Disruptive Demographics and the Triple Whammy of Geographic Disadvantage
|
|
|
- Lesley Wells
- 5 years ago
- Views:
Transcription

1 Disruptive Demographics and the Triple Whammy of Geographic Disadvantage James H. Johnson, Jr. Frank Hawkins Kenan Institute of Private Enterprise Kenan-Flagler Business School University of North Carolina at Chapel Hill August 2016
2 6 DISRUPTIVE TRENDS The South Rises Again The Browning of America Marrying Out is In The Silver Tsunami is About to Hit The End of Men? Cooling Water from Grandma s Well and Grandpa s Too!
3 OVERVIEW Two colorful demographic processes The Triple Whammy of Geographic Disadvantage Implications & Discussion
4 The Triple Whammy of Geographic Disadvantage Limiting educational and economic opportunities of mainly America s non-white youth
5 Two colorful demographic processes are drivers of change Browning & Graying of America
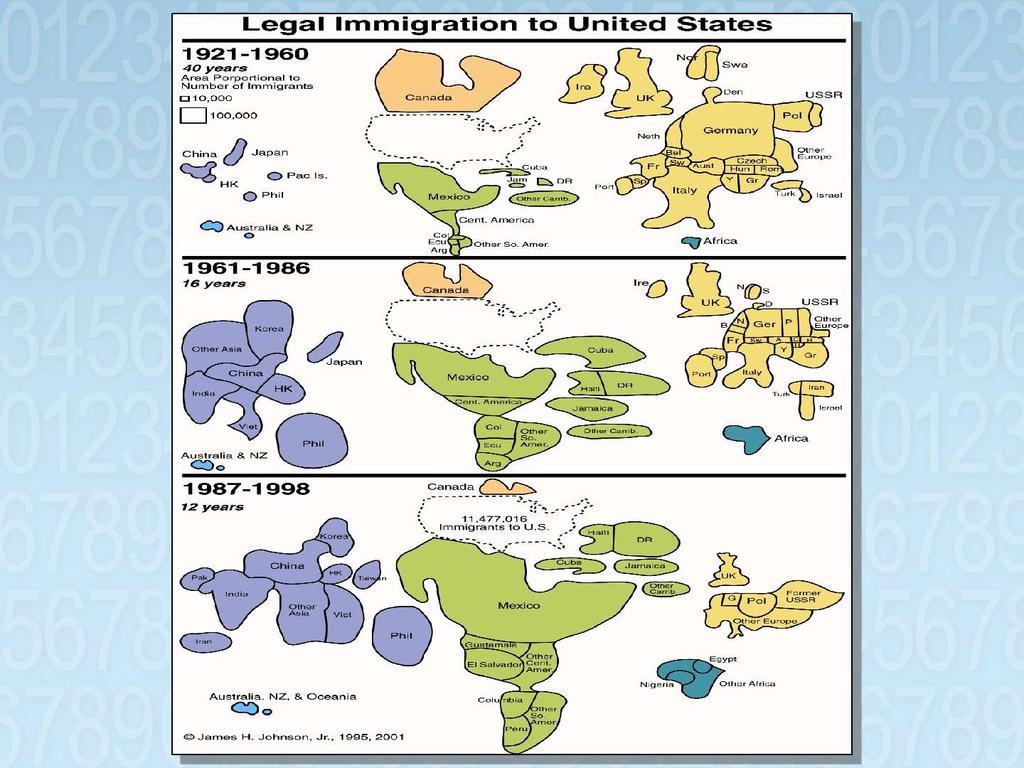
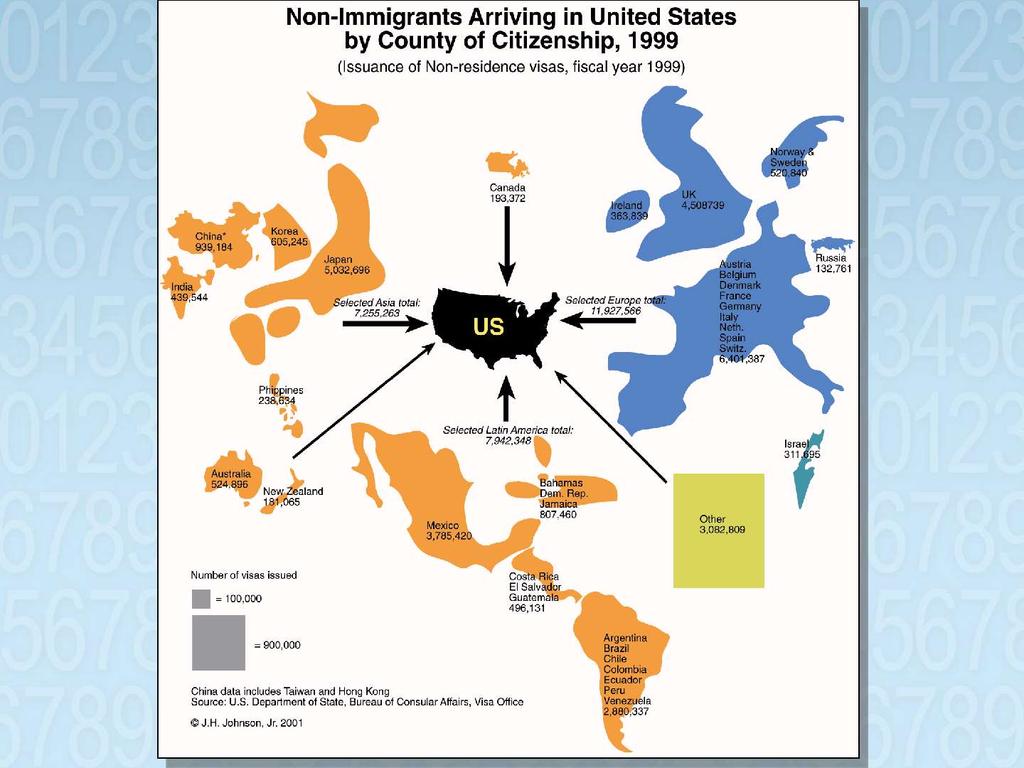
6 The Browning of America Immigration-driven population change
7
8 The Numbers Legal Immigrants Year Annual Flow , , , , ,137, ,067,000 Refugees, Parolees, Asylees Year Annual Flow , , , , ,500
9 The Numbers Cont d Illegal Immigrants 300,000 to 400,000 annually over the past two decades Three million granted amnesty in million illegal immigrants remained after 1986 reforms October 1996: INS estimated there were 5 million illegal immigrants in U.S. Since August 2005: Estimates of illegal population have ranged between 7 million and 15 million Today: An estimated 11.5 million unauthorized immigrants reside in U.S.
10 NON-IMMIGRANTS ADMITTED TO UNITED STATES, SELECTED YEARS, Year All Classes Exchange Visitors Academic & Vocational Students ,756, ,023 (1%) 271,861 (2%) ,539, ,213 (1%) 285,496 (3%) ,574, ,644 (1%) 355,207 (2%) ,640, ,364 (1%) 395,480 (2%) ,690, ,743 (1%) 699,953 (2%) ,824, ,435 (1%) 741,921 (2%) ,907, ,176 (1%) 687,506 (2%) ,381, ,138 (1%) 917,373 (2%) ,082, , 931 (1%) 1,702,730 (3%)
11
12 Number of Immigrants (in millions) U.S. Immigrant Population, Year
13 U.S. Foreign Born Population by Race/Ethnicity, 2014 Race/Ethnicity Foreign Population Share of Total (%) Total 42,235, Hispanic 19,300, White Alone, not Hispanic Black Alone, not Hispanic Asian Alone, not Hispanic Other Alone, not Hispanic 7,655, ,377, ,036, ,
14 NON-WHITE AND HISPANIC SHARES OF POPULATION GROWTH, Area Absolute Population Change Non-White Share Hispanic Share US 27,323, South 14,318, Texas 4,293, Florida 2,818, Georgia 1,501, NC 1,486,
15 NON-WHITE AND HISPANIC SHARES OF POPULATION GROWTH, Area Absolute Population Change Non-White Share Hispanic Share US 12,071, South 6,319, Texas 2,224, Florida 1,421, Georgia 501, NC 483, VA 357,
16 MEDIAN AGE OF U.S. POPULATION BY RACE, HISPANIC ORIGIN & GENDER, 2014 Race Total Male Female United States White Alone White, Non-Hispanic Black Alone AI/AN Alone Asian Alone NH/PI Alone Two or More Races Hispanic September
17 TOTAL FERTILITY RATES FOR U.S. WOMEN BY RACE/ETHNICITY, 2012 Race/Ethnicity Total Fertility Rate All Races 1.88 Hispanic 2.18 Non-Hispanic White 1.76 Blacks 1.90 Asian 1.77 Native American 1.35
18 RELATIVE DISTRIBUTION OF U.S. BIRTHS BY RACE / ETHNICITY Race/Ethnicity White 66% 50% 49.6% Blacks 17% 16% 15.0% Hispanics 15% 26% 26.0% Other 2% 8% 9.4% Source: Johnson and Lichter (2010); Tavernise (2011).
19 RELATIVE DISTRIBUTION OF U.S. POPULATION BY RACE / ETHNICITY Race/Ethnicity White 67% 47% Blacks 12.8% 13% Hispanics 14% 29% Asian 5% 9% Source: Pew Research Center, 2008 *projected.


20 Marrying Out is In November

21 INTERMARRIAGE TREND, % Married Someone of a Different Race/Ethnicity November

22 INTERMARRIAGE TYPES Newly Married Couples in 2008 November
23 The Graying of America & NC The Silver Tsunami is about to hit
24 Key Drivers Changes in Longevity Declining Fertility Aging of Boomer Cohort
25 U.S. LIFE EXPECTANCY AT BIRTH YEAR AGE
26 Centenarians in the U.S. Year Number , , ,000
27 COMPLETED FERTILITY FOR WOMEN YEARS OLD Year Percent Childless Avg. Number of Children Percent Higher Order Births* *Three or more Children
28 U.S. POPULATION CHANGE BY AGE, Age 2010 Absolute Change Percentage Change < TOTAL 104,853,555 5,416, % 82,134,554-2,905, % 81,489,445 19,536, % 40,267,984 5,276, % 308,745,538 27,323, %
29 U.S. POPULATION TURNING 50, 55, 62, AND 65 YEARS OF AGE, ( ) Age 50 Age 55 Age 62 Age 65 Average Number/Day 12,344 11,541 9,221 8,032 Average Number/Minute November
30
31
32

33 Metropolitan and Micropolitan Destinations of Elderly Migrants,
34
35 The Multigenerational Workforce
36 Multi-Generational Diversity Generation Birth Years Current Ages Est. Workforce Participation in 2013* Veterans Traditionalists WWII Generation Silent Generation Baby Boomers Boomers % (7M) % (60M) Generation X Baby Busters Generation Y Millennials % (51M) % (40M) November *Source: AARP Leading a Multi-Generational Workforce, 2007
37 Succession Planning & Accommodations for Elder Care Organizational Game Changers!
38 Other Signs of Aging For the first time in 100 years, deaths exceeded births among U.S. non-hispanic whites in 2011 Today, 16% of the U.S. population is 65+; 26% will be elderly by Close to 40 million people in the U.S. provided unpaid eldercare in 2011 and at an estimated cost of $30 billion in loss work productivity.
39 Other Signs of Aging Cont d 10 million millennials are caring for adult family members. 25 percent of U.S. caregivers are between 18 and 34 years of age. Google launches a medical company Calico to defeat death by prolonging life.
40
41 The Triple Whammy of Geographical Disadvantage The Human Capital Challenge
42 Racial Typology of U.S. Counties

43 Racial Typology of U.S. Counties
44 Racial Typology of U.S. Counties
45 Racial Typology of U.S. Counties

46 Distribution of School Age Population by County Typology
47 U.S. Racial Segregation by Census Tract
48 U.S. Racial Segregation by Census Tract
49 U.S. Racial Segregation by Census Tract
50 U.S. Racial Segregation by Census Tract

51 Distribution of School Age Population by Race and Level of Neighborhood Segregation
52 U.S. School Age Poverty by Census Tract
53 U.S. School Age Poverty by Census Tract
54 U.S. School Age Poverty by Census Tract
55 U.S. School Age Poverty by Census Tract
56 Distribution of School Age Population by Race and Level of Neighborhood Poverty

57 The Triple Whammy of Geographic Disadvantage
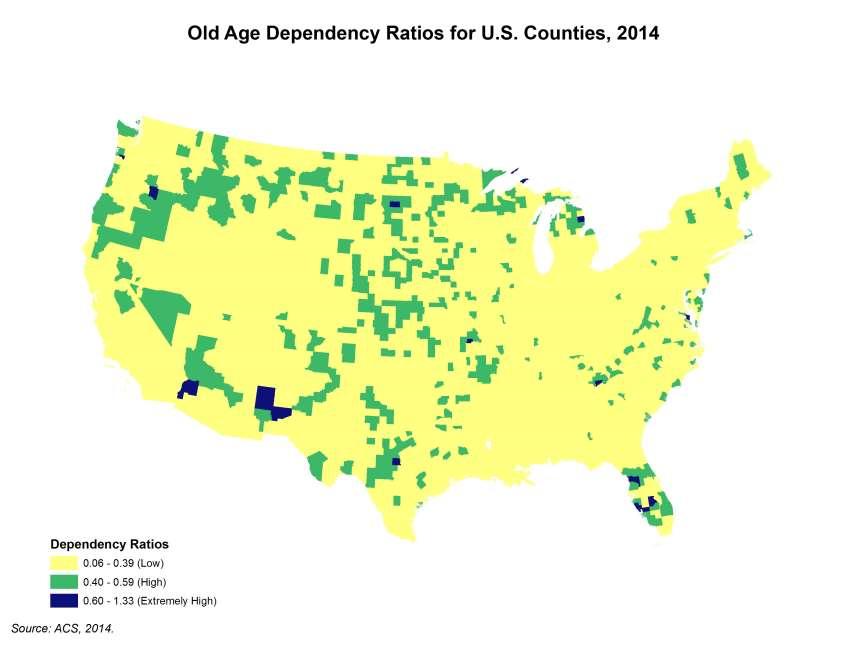
58 Summary Indicators of Exposure Level of Vulnerability Number of Youth Percent Non-White Triple Whammy 9.8 million 93 Double Whammy 12.2 million 81 Single Whammy 20.0 million 39 No Whammy 32.1 million 24
59
60
61
62 Number of Test Takers Male-Female Presence Disparity 6400 Total Number of EOC Test Takers males females / / / /2011 Year Graph shows total number of male and female students tested of 6 LEAs (Bertie, Bladen, Duplin, Halifax, Northampton, and Pamlico)
63 Percent of High School Graduates Requiring Remedial Course Work , , , , , None One Two or MoreHS more GradsPercent of HS Grads

64 The End of Men?


65 FEMALE WORKFORCE REPRESENTATION % Female
66 JOBS LOST/GAINED BY GENDER DURING 2007 (Q4) 2009 (Q3) RECESSION Industry Women Men Construction -106,000-1,300,000 Manufacturing -106,000-1,900,000 Healthcare +451, ,100 Government +176, ,000 Total -1,700,000-4,700,000
67 THE PLIGHT OF MEN Today, three times as many men of working age do not work at all compared to Selective male withdrawal from labor market rising non-employment due largely to skills mismatches, disabilities & incarceration. The percentage of prime-aged men receiving disability insurance doubled between 1970 (2.4%) and 2009 (4.8%). Since 1969 median wage of the American male has declined by almost $13,000 after accounting for inflation. After peaking in 1977, male college completion rates have barely changed over the past 35 years.
68 COLLEGE CLASS OF 2010 DEGREE MALE FEMALE DIFFERENCE Associate s 293, , ,000 Bachelor s 702, , ,000 Master s 257, , ,000 Professional 46,800 46, Doctor s 31,500 32,900 1,400 TOTAL 1,330,300 1,902, ,000
69 Gender Composition of Student Head Count Enrollment in NC Colleges & Universities, Fall 2014 Type of Institution Total Enrollment Male Enrollment Percent Male Enrollment All Institutions 554, , Bible Colleges 3,880 2, Public Institutions 459, , UNC System 220,121 95, PWIs 181,246 81, MSIs 38,875 14, HBUs 32,653 11, Community Colleges 239, , Private Institutions 90,974 38, Senior Colleges & Universities 90,296 37, Junior Colleges
70 Implications for Workforce Planning and Development Manage the transition from the graying to the browning of America. Help aging empty nesters to understand that they do have a dog in the K-12 education fight it called the future competitiveness of our state and nation. Embrace immigrants. Address the wayward sons problem in U.S. education and labor markets. Establish stronger ties with business to ensure that students graduate with the requisite skills to add value and enhance U.S. competitiveness in an ever-changing global marketplace.
71 THE COMPETITIVE TOOL KIT Analytical Reasoning Entrepreneurial Acumen Contextual Intelligence Soft Skills/Cultural Elasticity Agility and Flexibility
72 THE END
OVERVIEW. Demographic Trends. Challenges & Opportunities. Discussion
 People on the Move James H. Johnson, Jr. Frank Hawkins Kenan Institute of Private Enterprise Kenan-Flagler Business School University of North Carolina at Chapel Hill January 2017 OVERVIEW Demographic
Disruptive Demographics and the Triple Whammy of Geographic Disadvantage for America s Youth
 Disruptive Demographics and the Triple Whammy of Geographic Disadvantage for America s Youth James H. Johnson, Jr. Frank Hawkins Kenan Institute of Private Enterprise Kenan-Flagler Business School University
Disruptive Demographics: Implications for North Carolina s Health and Competitiveness
 Disruptive Demographics: Implications for North Carolina s Health and Competitiveness James H. Johnson, Jr. Frank Hawkins Kenan Institute of Private Enterprise Kenan-Flagler Business School University
Six Disruptive Demographics That Will Change the U.S. Forever
 Six Disruptive Demographics That Will Change the U.S. Forever October 2017 OVERVIEW Demographic Trends Challenges & Opportunities Discussion October 2017 2 what CENSUS 2010 will REVEAL October 2017 October
Disruptive Demographics: Implications for the Accounting Profession James H. Johnson, Jr. Distinguished Professor of Entrepreneurship & Strategy,
 Disruptive Demographics: Implications for the Accounting Profession James H. Johnson, Jr. Distinguished Professor of Entrepreneurship & Strategy, University of North Carolina Kenan-Flagler Business School
Six Disruptive Demographics That Will Change the U.S. & South Carolina Forever
 Six Disruptive Demographics That Will Change the U.S. & South Carolina Forever James H. Johnson, Jr. Frank Hawkins Kenan Institute of Private Enterprise Kenan-Flagler Business School University of North
Disruptive Demographics and North Carolina s Global Competitiveness Challenge
 Disruptive Demographics and North Carolina s Global Competitiveness Challenge James H. Johnson, Jr. Frank Hawkins Kenan Institute of Private Enterprise Kenan-Flagler Business School University of North
Disruptive Demographics: Implications for Higher Education Institutions
 Disruptive Demographics: Implications for Higher Education Institutions James H. Johnson, Jr. Frank Hawkins Kenan Ins
Six Disruptive Demographics That Will Change the U.S. Forever
 Six Disruptive Demographics That Will Change the U.S. Forever James H. Johnson, Jr. Frank Hawkins Kenan Institute of Private Enterprise Kenan-Flagler Business School University of North Carolina at Chapel
What are the major changes you are seeing in your community?
 Court Trends, Changing Times in North Carolina, and Public Courts- the World Courts Work in Willow Jacobson, What are the major changes you are seeing in your community? Six Disruptive Trends The South
Disruptive Demographics: Implications for Workforce Planning and Development
 Disruptive Demographics: Implications for Workforce Planning and Development James H. Johnson, Jr. Ph.D. William Rand Kenan, Jr. Distinguished Professor of Entrepreneurship and Strategy Kenan-Flagler Business
People on the Move: Implications for Career Education
 People on the Move: Implications for Career Education James H. Johnson, Jr. Ph.D. William Rand Kenan, Jr. Distinguished Professor of Management Kenan-Flagler Business School Director, Urban Investment
An Equity Profile of the Southeast Florida Region. Summary. Foreword
 An Equity Profile of the Southeast Florida Region PolicyLink and PERE An Equity Profile of the Southeast Florida Region Summary Communities of color are driving Southeast Florida s population growth, and
What Lies Ahead: Population, Household and Employment Forecasts to 2040 April Metropolitan Council Forecasts to 2040
 The Metropolitan Council forecasts population, households and employment for the sevencounty Minneapolis-St. Paul region with a 30-year time horizon. The Council will allocate this regional forecast to
Active Michigan Members by Race/Ethnicity and Gender Joining the Bar
 The Big Picture Active Michigan Members by Race/Ethnicity and Gender Joining the Bar 2005-2015 Other Ethnic Origin Female, 379, 6.9% Other Ethnic Origin Male, 306, 5.5% Arab Origin Female, 101, 1.8% Arab
Hispanic Health Insurance Rates Differ between Established and New Hispanic Destinations
 Population Trends in Post-Recession Rural America A Publication Series of the W3001 Research Project Hispanic Health Insurance Rates Differ between and New Hispanic s Brief No. 02-16 August 2016 Shannon
KENAN INSTITUTE WHITE PAPER
 KENAN INSTITUTE WHITE PAPER JANUARY 1, 2018 LEVERAGING NORTH CAROLINA S MIGRATION DIVIDEND UISC01201801 James H. Johnson, Jr., Ph.D Allan M. Parnell, Ph.D Frank Hawkins Kenan Institute of Private Enterprise
Cultural Frames: An Analytical Model
 Figure 1.1 Cultural Frames: An Analytical Model Hyper-Selectivity/ Hypo-Selectivity Ethnic Capital Tangible and Intangible Resources Host Society Public Institutional Resources The Stereotype Promise/Threat
Demographic Changes, Health Disparities, and Tuberculosis
 Demographic Changes, Health Disparities, and Tuberculosis Joan M. Mangan, PhD, MST October 22, 2015 Delivering Culturally Competent Patient Education and Care to Tuberculosis Program Clients Austin, TX
BLACK-WHITE BENCHMARKS FOR THE CITY OF PITTSBURGH
 BLACK-WHITE BENCHMARKS FOR THE CITY OF PITTSBURGH INTRODUCTION Ralph Bangs, Christine Anthou, Shannon Hughes, Chris Shorter University Center for Social and Urban Research University of Pittsburgh March
Race, Ethnicity, and Economic Outcomes in New Mexico
 Race, Ethnicity, and Economic Outcomes in New Mexico Race, Ethnicity, and Economic Outcomes in New Mexico New Mexico Fiscal Policy Project A program of New Mexico Voices for Children May 2011 The New Mexico
SECTION 1. Demographic and Economic Profiles of California s Population
 SECTION 1 Demographic and Economic Profiles of s Population s population has special characteristics compared to the United States as a whole. Section 1 presents data on the size of the populations of
Immigrants are playing an increasingly
 Trends in the Low-Wage Immigrant Labor Force, 2000 2005 THE URBAN INSTITUTE March 2007 Randy Capps, Karina Fortuny The Urban Institute Immigrants are playing an increasingly important role in the U.S.
Demographic Change How the US is Coping with Aging, Immigration, and Other Challenges William H. Frey
 Demographic Change How the US is Coping with Aging, Immigration, and Other Challenges William H. Frey Brookings Institution University of Michigan www.frey-demographer.org US: Total and Age 65+ Growth,
Chapter One: people & demographics
 Chapter One: people & demographics The composition of Alberta s population is the foundation for its post-secondary enrolment growth. The population s demographic profile determines the pressure points
Illegal Immigration: How Should We Deal With It?
 Illegal Immigration: How Should We Deal With It? Polling Question 1: Providing routine healthcare services to illegal Immigrants 1. Is a moral/ethical responsibility 2. Legitimizes illegal behavior 3.
Understanding the Immigrant Experience Lessons and themes for economic opportunity. Owen J. Furuseth and Laura Simmons UNC Charlotte Urban Institute
 Understanding the Immigrant Experience Lessons and themes for economic opportunity Owen J. Furuseth and Laura Simmons UNC Charlotte Urban Institute Charlotte-Mecklenburg Opportunity Task Force March 10,
The Brookings Institution Metropolitan Policy Program Bruce Katz, Director
 The Brookings Institution Metropolitan Policy Program Bruce Katz, Director State of the World s Cities: The American Experience Delivering Sustainable Communities Summit February 1st, 2005 State of the
The EEO Tabulation: Measuring Diversity in the Workplace ACS Data Users Conference May 29, 2014
 The EEO Tabulation: Measuring Diversity in the Workplace ACS Data Users Conference May 29, 2014 Ana J. Montalvo Industry and Occupation Statistics Branch Social, Economic, and Housing Statistics Division
An Equity Assessment of the. St. Louis Region
 An Equity Assessment of the A Snapshot of the Greater St. Louis 15 counties 2.8 million population 19th largest metropolitan region 1.1 million households 1.4 million workforce $132.07 billion economy
Introduction. Background
 Millennial Migration: How has the Great Recession affected the migration of a generation as it came of age? Megan J. Benetsky and Alison Fields Journey to Work and Migration Statistics Branch Social, Economic,
Pulling Open the Sticky Door
 Pulling Open the Sticky Door Social Mobility among Latinos in Nebraska Lissette Aliaga-Linares Social Demographer Office of Latino/Latin American Studies (OLLAS) University of Nebraska at Omaha Overview
Demographic, Economic, and Social Transformations in Brooklyn Community District 4: Bushwick,
 Demographic, Economic, and Social Transformations in Brooklyn Community District 4: Bushwick, 1990-2007 Astrid S. Rodríguez Ph.D. Candidate, Educational Psychology Center for Latin American, Caribbean
The Brookings Institution Metropolitan Policy Program Robert Puentes, Fellow
 The Brookings Institution Metropolitan Policy Program Robert Puentes, Fellow A Review of New Urban Demographics and Impacts on Housing National Multi Housing Council Research Forum March 26, 2007 St. Louis,
The Brookings Institution Metropolitan Policy Program Amy Liu, Deputy Director
 The Brookings Institution Metropolitan Policy Program Amy Liu, Deputy Director Mind the Gap: Reducing Disparities to Improve Regional Competitiveness in the Twin Cities Forum on the Business Response to
Rural Child Poverty across Immigrant Generations in New Destination States
 Rural Child Poverty across Immigrant Generations in New Destination States Brian Thiede, The Pennsylvania State University Leif Jensen, The Pennsylvania State University March 22, 2018 Rural Poverty Fifty
1615 L Street, NW, Suite 700 Washington, DC (main) (fax)
 (fax)") 1615 L Street, NW, Suite 700 Washington, DC 20036-5631 202-419-3600(main) 202-419-3608(fax) www.pewresearch.org A Fact Tank The Pew Research Center is a nonpartisan organization that provides information
1615 L Street, NW, Suite 700 Washington, DC 20036-5631 202-419-3600(main) 202-419-3608(fax) www.pewresearch.org A Fact Tank The Pew Research Center is a nonpartisan organization that provides information
Facts & Figures in this issue: income employment growth trends baby boomers millennials immigration
 Facts & Figures in this issue: income employment growth trends baby boomers millennials immigration 2017 Baby Boomers The term baby boomer refers to individuals born in the United States between 1946 and
STATE OF WORKING FLORIDA
 STATE OF WORKING FLORIDA 2018 The Future Workforce The 15th edition of the State of Working Florida reviews recent changes in Florida s economy and their potential impacts on the future workforce. This
Water Demand Demographic Change and Uncertainty
 Water Demand Demographic Change and Uncertainty Dr Peter Boden Edge Analytics Ltd College of Medical and Dental Sciences University of Birmingham February 2011 Slide 1 Edge Analytics www.edgeanalytics.co.uk
U.S. Hispanics & Immigration: A Demographer s View
 Jeffrey S. Passel Pew Hispanic Center Washington, DC The Economics of Immigration Construction Economics Research Network Washington, DC December 6, 2007 U.S. Hispanics & Immigration: A Demographer s View
MARRIAGE & PARENTHOOD
 CONTENTS OVERVIEW 3 KEY INDICATORS 4 OVERALL POPULATION 5 AGEING 8 MARRIAGE & PARENTHOOD 10 IMMIGRATION & CITIZENS BY DESCENT 14 1 ANNEX Overall Population Table 1: Total population 16 Table 2: Singapore
The Black Labor Force in the Recovery
 Cornell University ILR School DigitalCommons@ILR Federal Publications Key Workplace Documents 7-11-2011 The Black Labor Force in the Recovery United States Department of Labor Follow this and additional
Post-Secondary Education, Training and Labour September Profile of the New Brunswick Labour Force
 Post-Secondary Education, Training and Labour September 2018 Profile of the New Brunswick Labour Force Contents Population Trends... 2 Key Labour Force Statistics... 5 New Brunswick Overview... 5 Sub-Regional
Population Outlook for the Portland-Vancouver Metropolitan Region
 Portland State University PDXScholar Institute of Portland Metropolitan Studies Publications Institute of Portland Metropolitan Studies 2007 Population Outlook for the Portland-Vancouver Metropolitan Region
The Brookings Institution
 The Brookings Institution Metropolitan Policy Program Bruce Katz, Director Understanding Regional Dynamics: Implications for Social and Economic Justice Understanding Regional Dynamics: Implications for
Demographic, Economic and Social Transformations in Bronx Community District 4: High Bridge, Concourse and Mount Eden,
 Center for Latin American, Caribbean & Latino Studies Graduate Center City University of New York 365 Fifth Avenue Room 5419 New York, New York 10016 Demographic, Economic and Social Transformations in
3Demographic Drivers. The State of the Nation s Housing 2007
 3Demographic Drivers The demographic underpinnings of long-run housing demand remain solid. Net household growth should climb from an average 1.26 million annual pace in 1995 25 to 1.46 million in 25 215.
Demographic and Economic Impacts of International Migration to North Carolina. Frank Hawkins Kenan Institute of Private Enterprise
 April 2014 Demographic and Economic Impacts of International Migration to North Carolina James H. Johnson Jr and Stephen J. Appold Frank Hawkins Kenan Institute of Private Enterprise Kenan-Flagler Business
U.S. immigrant population continues to grow
 U.S. immigrant population continues to grow Millions 45 40 35 30 25 20 15 10 5 0 Source: PEW Research Center. All foreign-born immigrants Unauthorized immigrants 40.4 38.0 31.1 12.0 11.1 8.4 2000 2007
California s Congressional District 37 Demographic Sketch
 4.02.12 California s Congressional District 37 Demographic Sketch MANUEL PASTOR JUSTIN SCOGGINS JARED SANCHEZ Purpose Demographic Sketch Understand the Congressional District s population and its unique
Youth at High Risk of Disconnection
 Youth at High Risk of Disconnection A data update of Michael Wald and Tia Martinez s Connected by 25: Improving the Life Chances of the Country s Most Vulnerable 14-24 Year Olds Prepared by Jacob Rosch,
Extrapolated Versus Actual Rates of Violent Crime, California and the United States, from a 1992 Vantage Point
 Figure 2.1 Extrapolated Versus Actual Rates of Violent Crime, California and the United States, from a 1992 Vantage Point Incidence per 100,000 Population 1,800 1,600 1,400 1,200 1,000 800 600 400 200
Le Sueur County Demographic & Economic Profile Prepared on 7/12/2018
 Le Sueur County Demographic & Economic Profile Prepared on 7/12/2018 Prepared by: Mark Schultz Regional Labor Market Analyst Southeast and South Central Minnesota Minnesota Department of Employment and
Dynamic Diversity: Projected Changes in U.S. Race and Ethnic Composition 1995 to December 1999
 Dynamic Diversity: Projected Changes in U.S. Race and Ethnic Composition 1995 to 2050 December 1999 DYNAMIC DIVERSITY: PROJECTED CHANGES IN U.S. RACE AND ETHNIC COMPOSITION 1995 TO 2050 The Minority Business
Why disaggregate data on U.S. children by immigrant status? Some lessons from the diversitydatakids.org project
 Why disaggregate data on U.S. children by immigrant status? Some lessons from the diversitydatakids.org project Dolores Acevedo-Garcia, PhD, MPA-URP Samuel F. and Rose B. Gingold Professor of Human Development
CONTEXT FOR PRESENTATION
 CONTEXT FOR PRESENTATION Making predictions about what Diversity and HR professionals will face over the next 12-48 months requires examining a few assumptions. First, the U.S. will have a new administration
Changing Dynamics and. to the United States
 Jeffrey S. Passel Pew Hispanic Center Changing Dynamics and Characteristics of Immigration to the United States International Symposium on International Migration and Development United Nations, Torino,
Final Report. Participation of Latino/Hispanic Population in the Food Stamp Program in the South.
 Final Report Participation of Latino/Hispanic Population in the Food Stamp Program in the South. Safdar Muhammad 1 and Fisseha Tegegne Institute of Agricultural and Environmental Research Tennessee State
Institute for Public Policy and Economic Analysis
 Institute for Public Policy and Economic Analysis The Institute for Public Policy and Economic Analysis at Eastern Washington University will convey university expertise and sponsor research in social,
CLACLS. A Profile of Latino Citizenship in the United States: Demographic, Educational and Economic Trends between 1990 and 2013
 CLACLS Center for Latin American, Caribbean & Latino Studies A Profile of Latino Citizenship in the United States: Demographic, Educational and Economic Trends between 1990 and 2013 Karen Okigbo Sociology
People. Population size and growth
 The social report monitors outcomes for the New Zealand population. This section provides background information on who those people are, and provides a context for the indicators that follow. People Population
Cook County Health Strategic Planning Landscape
 Cook County Health Strategic Planning Landscape Terry Mason, MD COO Cook County Department of Public Health December 21, 2018 1 Cook County Population Change 2000-2010* U.S. Census 2000 population 2010
Destination Portland: Post-Great Recession Migration Trends in the Rose City Region
 Portland State University PDXScholar Publications, Reports and Presentations Population Research Center 3-2017 Destination Portland: Post-Great Recession Migration Trends in the Rose City Region Jason
Astrid S. Rodríguez Fellow, Center for Latin American, Caribbean & Latino Studies. Center for Latin American, Caribbean & Latino Studies
 Demographic, Economic, and Social Transformations in Bronx Community District 9: Parkchester, Unionport, Soundview, Castle Hill, and Clason Point, 1990-2006 Center for Latin American, Caribbean & Latino
Rural America At A Glance
 Rural America At A Glance 7 Edition Between July 5 and July 6, the population of nonmetro America grew.6 percent. Net domestic migration from metro areas accounted for nearly half of this growth. Gains
The Inland Empire in Hans Johnson Joseph Hayes
 The Inland Empire in 2015 Hans Johnson Joseph Hayes Inland Empire: Tremendous Growth and Change Strong population growth Increasing diversity Sustained economic growth* 2 PPIC Developed 2015 Projections
Making the Case for Multicultural Education in Utah: Utah s Demographic Transformation
 Making the Case for Multicultural Education in Utah: Utah s Demographic Transformation Utah Reach Training Utah State Office of Education May 8, 2009 Pamela S. Perlich, Ph.D. University of Utah Utah s
Left out under Federal Health Reform: Undocumented immigrant adults excluded from ACA Medicaid expansions
 Left out under Federal Health Reform: Undocumented immigrant adults excluded from ACA Medicaid expansions Jessie Kemmick Pintor, MPH Graduate Research Assistant State Health Access Data Assistance Center
Hand on the plow: South Carolina. Unaddressed disparities among rural minority populations. Jan Probst, PhD Director
 Hand on the plow: Unaddressed disparities among rural minority populations Jan Probst, PhD Director May 8, 2018 Overview Modest progress in some areas Social determinants do not suggest improvement will
An Analysis of the Economic Impact of Undocumented Workers on Business Activity in the US with Estimated Effects by State and by Industry
 AN ESSENTIAL RESOURCE: An Analysis of the Economic Impact of Undocumented Workers on Business Activity in the US with Estimated Effects by State and by Industry Prepared by The Perryman Group 510 North
A Demographic Profile
 Seventh-day Adventists in North America A Demographic Profile North American Division Secretariat Demographic Survey By Monte Sahlin and Paul Richardson November 2008 Introduction This report provides
THE NEW LATINO SOUTH: LATINOS IN NORTH CAROLINA. Understanding our Growing Community
 THE NEW LATINO SOUTH: LATINOS IN NORTH CAROLINA Understanding our Growing Community Axel Lluch Governor s Office of Hispanic/Latino Affairs 3/30/2006 1 THE NEW LATINO SOUTH? 3/30/2006 2 THE NEW LATINO
Measuring the Impact of Race, Class, and Immigration Status on Family Stability
 Measuring the Impact of Race, Class, and Immigration Status on Family Stability Daniel T. Lichter Departments of Policy Analysis Management and Sociology Cornell University NAS Conference on Science of
Demographic, Economic, and Social Transformations in Queens Community District 3: East Elmhurst, Jackson Heights, and North Corona,
 Demographic, Economic, and Social Transformations in Queens Community District 3: East Elmhurst, Jackson Heights, and North Corona, 1990-2006 Astrid S. Rodríguez Fellow, Center for Latin American, Caribbean
CLACLS. Demographic, Economic, and Social Transformations in Bronx Community District 5:
 CLACLS Center for Latin American, Caribbean & Latino Stud- Demographic, Economic, and Social Transformations in Bronx Community District 5: Fordham, University Heights, Morris Heights and Mount Hope, 1990
The New U.S. Demographics
 The Brookings Institution Center on Urban and Metropolitan Policy The New U.S. Demographics Audrey Singer Funders Network on Population, Reproductive Health and Rights November 10, 2003 QUESTIONS How has
Prophetic City: Houston on the Cusp of a Changing America.
 Prophetic City: Houston on the Cusp of a Changing America. Tracking Responses to the Economic and Demographic Transformations through 36 Years of Houston Surveys Dr. Stephen L. Klineberg TACA 63rd Annual
A Regional Comparison Minneapolis Saint Paul Regional Economic Development Partnership
 Greater MSP Baltimore A Regional Comparison Minneapolis Saint Paul Regional Economic Development Partnership TOP EMPLOYERS IN AND MSA GREATER MSP EMPLOYER EMPLOYEES EMPLOYER EMPLOYEES Target Corp. 26,694
City of Hammond Indiana DRAFT Fair Housing Assessment 07. Disparities in Access to Opportunity
 ANALYSIS EDUCATIONAL OPPORTUNITIES i. Describe any disparities in access to proficient schools based on race/ethnicity, national origin, and family status. ii. iii. Describe the relationship between the
Regional Data Snapshot
 Regional Data Snapshot Population, Economy & Education Features SET Civic Forum Uwharrie Region, NC Table of Contents 01 Overview 03 Human Capital 02 Demography 04 Labor Force 01 overview Uwharrie Region,
North Carolina s Tomorrow:
 North Carolina s Tomorrow: Seeking Good, Quality Jobs to Build an Economy that Works for All STATE OF WORKING NORTH CAROLINA 2014 By Alexandra Forter Sirota and Tazra Mitchell with Allan Freyer State
People. Population size and growth. Components of population change
 The social report monitors outcomes for the New Zealand population. This section contains background information on the size and characteristics of the population to provide a context for the indicators
Two of the key demographic issues that frame society around the globe today are migration and the ageing of the population. Every country around the
 1 Two of the key demographic issues that frame society around the globe today are migration and the ageing of the population. Every country around the globe is now facing an ageing population. And this
The Brookings Institution Metropolitan Policy Program Robert Puentes, Fellow
 The Brookings Institution Metropolitan Policy Program Robert Puentes, Fellow Of First Burbs and Boom Burbs: Dealing with Suburban Transition in the 21st Century City of Plano, TX Annual Retreat October
BIG PICTURE: CHANGING POVERTY AND EMPLOYMENT OUTCOMES IN SEATTLE
 BIG PICTURE: CHANGING POVERTY AND EMPLOYMENT OUTCOMES IN SEATTLE January 218 Author: Bryce Jones Seattle Jobs Initiative TABLE OF CONTENTS Introduction 1 Executive Summary 2 Changes in Poverty and Deep
Inequality in the Labor Market for Native American Women and the Great Recession
 Inequality in the Labor Market for Native American Women and the Great Recession Jeffrey D. Burnette Assistant Professor of Economics, Department of Sociology and Anthropology Co-Director, Native American
Chapter 3 - Community Demographics
 Comprehensive plans are prepared using a framework of population, household and economic trends. Demographic data available for the preparation of this plan is from the 2 census, data that is eight years
Geographic Mobility of New Jersey Residents. Migration affects the number and characteristics of our resident population
 Geographic Mobility of New Jersey Residents Migration affects the number and characteristics of our resident population Geographic Mobility of New Jersey Residents More than 4.1 million (or 47.4%) New
America s Changing Classrooms and Communities Data and Projections
 America s Changing Classrooms and Communities Data and Projections Denzil Mohammed Director, Public Education Institute The Immigrant Learning Center, Inc., Malden MA dmohammed@ilctr.org Immigrant Student
Tell us what you think. Provide feedback to help make American Community Survey data more useful for you.
 DP02 SELECTED SOCIAL CHARACTERISTICS IN THE UNITED STATES 2016 American Community Survey 1-Year Estimates Supporting documentation on code lists, subject definitions, data accuracy, and statistical testing
Racial Inequities in Montgomery County
 W A S H I N G T O N A R E A R E S E A R C H I N I T I A T I V E Racial Inequities in Montgomery County Leah Hendey and Lily Posey December 2017 Montgomery County, Maryland, faces a challenge in overcoming
2001 Senate Staff Employment Study
 2001 Senate Staff Employment Study Written by Congressional Management Foundation Table of Contents INDIVIDUAL POSITION PROFILES AND ANALYSES Methodology...7 Summary Tables...8 Washington Positions Assistant
An in-depth examination of North Carolina voter attitudes on important current issues
 An in-depth examination of North Carolina voter attitudes on important current issues Registered Voters in North Carolina August 25-30, 2018 1 Contents Contents Key Survey Insights... 3 Satisfaction with
Peruvians in the United States
 Peruvians in the United States 1980 2008 Center for Latin American, Caribbean & Latino Studies Graduate Center City University of New York 365 Fifth Avenue Room 5419 New York, New York 10016 212-817-8438
Inside the 2012 Latino Electorate
 June 3, 2013 Mark Hugo Lopez, Associate Director Ana Gonzalez-Barrera, Research Associate FOR FURTHER INFORMATION CONTACT: Pew Hispanic Center 1615 L St, N.W., Suite 700 Washington, D.C. 20036 Tel(202)
Immigration Policy Brief August 2006
 Immigration Policy Brief August 2006 Last updated August 16, 2006 The Growth and Reach of Immigration New Census Bureau Data Underscore Importance of Immigrants in the U.S. Labor Force Introduction: by
CARSEY INSTITUTE. Children are in the vanguard of America s. The Increasing Diversity of America s Youth. Children Lead the Way to a New Era
 CARSEY INSTITUTE Building Knowledge for Families and Communities National Issue Brief #71 Spring 2014 The Increasing Diversity of America s Youth Children Lead the Way to a New Era Kenneth M. Johnson,
What's Driving the Decline in U.S. Population Growth?
 Population Reference Bureau Inform. Empower. Advance. What's Driving the Decline in U.S. Population Growth? Mark Mather (May 2012) Between 2010 and 2011, the U.S. population increased by 0.7 percent, after