The EEO Tabulation: Measuring Diversity in the Workplace ACS Data Users Conference May 29, 2014
|
|
|
- Gwenda Chambers
- 5 years ago
- Views:
Transcription
1 The EEO Tabulation: Measuring Diversity in the Workplace ACS Data Users Conference May 29, 2014 Ana J. Montalvo Industry and Occupation Statistics Branch Social, Economic, and Housing Statistics Division U.S. Census Bureau

2 What do you do? ACS Occupation Questions Occupation describes the kind of work a person does on the job 2 occupation questions 2
3 Civil Rights Laws The statistics from the Equal Employment Opportunity Tabulation are used by Federal agencies that monitor employment practices and enforce civil rights laws in the workforce, and by employers so they can measure their compliance with the laws. Title VII of the Civil Rights Act of 1964 (Title VII) Age Discrimination in Employment Act (ADEA) Americans with Disabilities Act (ADA) Equal Pay Act of 1963 (EPA) Rehabilitation Act of
4 Sponsoring Agencies Equal Employment Opportunity Commission (EEOC) Department of Justice (DOJ) Employment Litigation Section of the Civil Rights Division Department of Labor (DOL) Office of Federal Contract Compliance Programs (OFCCP) Office of Personnel Management (OPM) 4
5 The Equal Employment Opportunity (EEO) Tabulation Custom tabulation of the civilian labor force aged 16 and older, which allows us to examine the diversity of the labor force The source for detailed occupational statistics by race, ethnicity, and sex in the labor force for local areas. May also include citizenship, educational attainment, industry, age, earnings, and unemployment status First time published with the 1970 Decennial Census data 5
6 What can this tabulation tell you? Detailed occupation: What percentage of cashiers in Austin, Texas, are non- Hispanic Asian? Diversity: What is the demographic composition of elementary and middle school teachers in the Virginia Beach-Norfolk-Newport News, Va.-N.C. metro area? Age: What percentage of flight attendants in Atlanta are 40 to 44 years old? Education: How many workers in Suffolk, Worcester and Berkshire counties in Massachusetts are 35-to-39 year old high school graduates? Commuting flows: What percentage of financial analysts work in Los Angeles County and live in Orange County, California? Citizenship: How many professional workers in the Huntsville, Ala. metro area are not U.S. citizens? Industry: How many mechanical engineers in the transportation equipment manufacturing industry in Michigan are non-hispanic black? 6
7 Levels of Geography Nation All states, the District of Columbia and Puerto Rico Metro and Micro areas Counties and EEO county sets Places 7
8 Types of Location Residence Where people live Universe: Total labor force (employed + unemployed) Worksite Where people work Universe: Employed and at work last week Worksite flow Where workers commute from (to their place of work) Universe: Employed and at work last week 8

9 More detailed geography 9
10 New this time Developed from 5-year American Community Survey ( ) Pre-calculated margins of error Available through American FactFinder 488 Census Occupation Codes - Occupation categories based on 2010 Standard Occupational Classification New measures: citizenship, unemployment status Puerto Rico tables are included Over 19 billion estimates Over 1 trillion calculations to produce 10
11 New Measures Citizenship U.S. Citizen Respondents who indicated that they were born in the United States, Puerto Rico, a U.S. Island Area (such as Guam), or abroad of American (U.S. citizen) parent or parents are considered U.S. citizens at birth. Foreign-born people who indicated that they were U.S. citizens through naturalization also are considered U.S. citizens. Not a U.S. Citizen Respondents who indicated that they were not U.S. citizens at the time of the survey. Unemployment Status Currently employed Currently unemployed and worked in the last year Currently unemployed and last worked 1 to 5 years ago 11
12 107 tables Data Products Provide residence and worksite geographic information Worksite and commuting flow tables Population threshold Tables that include the citizenship variable have a population threshold of 100,000 or more Tables that do not include the citizenship variable have a population threshold of 50,000 or more All tables have at least 3 unweighted cases per cell Disclosure avoidance and rounding rules applied 12
 Hawaii-15 race/ethnicity categories Notes: Black refers to Black or African American; AIAN refers to")
13 Race and Ethnicity Categories Tables Boxhead- U.S., except Hawaii-12 race/ethnicity categories (3 HI categories will be filled with an X on AFF) Hawaii-15 race/ethnicity categories Notes: Black refers to Black or African American; AIAN refers to American Indian and Alaska Native; and NHPI refers to Native Hawaiian and Other Pacific Islander. Balance of Not Hispanic or Latino includes the balance of non-hispanic individuals who reported multiple races or reported Some Other Race alone. 13
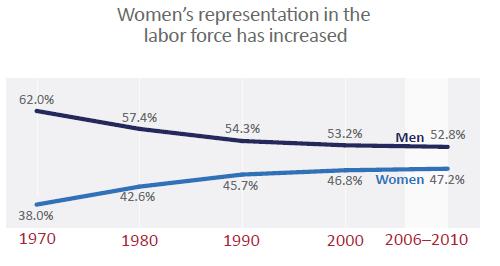
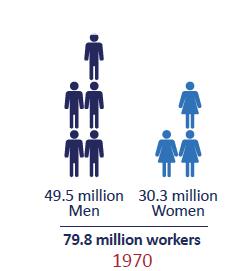
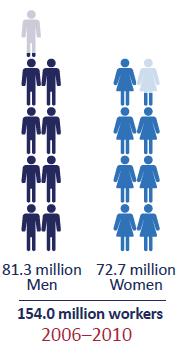
14 Composition of the Labor Force by Sex 14

15 Composition of the Labor Force by Sex

16 Increase in women s share of some healthcare occupations In the EEO Tab- 32% of physicians and surgeons were women, increasing from 27% in % of dentists were women, increasing from 18% in 2000
17 By Race and Hispanic Origin 67.0% 100.2m 72.8% 103.3m NHPI
18 By Race and Hispanic Origin NHPI 18
19 Disparities in education of the workforce Percent of the civilian labor force in the U.S. that had at least a bachelor s degree was around- 23% White alone 3% Asian 2% Hispanic 2% Black or African American
20 How to access the EEO Tabulation Data EEO Tabulation Webpage from Census website ( American FactFinder s Advanced Search or Download Center ( ndex.xhtml) FTP site ( 20
21 For questions, contact: Industry and Occupation Statistics Branch Social, Economic, and Housing Statistics Division U.S. Census Bureau faq5year.html Ana J. Montalvo, Project Lead
Labor Force Characteristics by Race and Ethnicity, 2015
 Cornell University ILR School DigitalCommons@ILR Federal Publications Key Workplace Documents 9-2016 Labor Force Characteristics by Race and Ethnicity, 2015 Bureau of Labor Statistics Follow this and additional
The foreign born are more geographically concentrated than the native population.
 The Foreign-Born Population in the United States Population Characteristics March 1999 Issued August 2000 P20-519 This report describes the foreign-born population in the United States in 1999. It provides
U.S. immigrant population continues to grow
 U.S. immigrant population continues to grow Millions 45 40 35 30 25 20 15 10 5 0 Source: PEW Research Center. All foreign-born immigrants Unauthorized immigrants 40.4 38.0 31.1 12.0 11.1 8.4 2000 2007
Racial Inequities in Fairfax County
 W A S H I N G T O N A R E A R E S E A R C H I N I T I A T I V E Racial Inequities in Fairfax County Leah Hendey and Lily Posey December 2017 Fairfax County, Virginia, is an affluent jurisdiction, with
 Page 1 of 5 DP02 SELECTED SOCIAL CHARACTERISTICS IN THE UNITED STATES 2013 American Community Survey 1-Year Estimates Although the American Community Survey (ACS) produces population, demographic and housing
Racial Inequities in Montgomery County
 W A S H I N G T O N A R E A R E S E A R C H I N I T I A T I V E Racial Inequities in Montgomery County Leah Hendey and Lily Posey December 2017 Montgomery County, Maryland, faces a challenge in overcoming
ATTACHMENT 16. Source and Accuracy Statement for the November 2008 CPS Microdata File on Voting and Registration
 ATTACHMENT 16 Source and Accuracy Statement for the November 2008 CPS Microdata File on Voting and Registration SOURCE OF DATA The data in this microdata file are from the November 2008 Current Population
Demographic Changes, Health Disparities, and Tuberculosis
 Demographic Changes, Health Disparities, and Tuberculosis Joan M. Mangan, PhD, MST October 22, 2015 Delivering Culturally Competent Patient Education and Care to Tuberculosis Program Clients Austin, TX
California s Congressional District 37 Demographic Sketch
 4.02.12 California s Congressional District 37 Demographic Sketch MANUEL PASTOR JUSTIN SCOGGINS JARED SANCHEZ Purpose Demographic Sketch Understand the Congressional District s population and its unique
Data Brief Vol. 1, No. 1
 Asian Americans and Pacific Islanders in the United States Aged 55 Years and Older: Population, Nativity, and Language Asian Americans and Pacific Islanders (AAPIs) are one of the fastest growing populations
SECTION 1. Demographic and Economic Profiles of California s Population
 SECTION 1 Demographic and Economic Profiles of s Population s population has special characteristics compared to the United States as a whole. Section 1 presents data on the size of the populations of
Our Shared Future: U N D E R S T A N D I N G B O S T O N. #SharedFuture. Charting a Path for Immigrant Advancement in a New Political Landscape
 U N D E R S T A N D I N G B O S T O N Our Shared Future: Charting a Path for Immigrant Advancement in a New Political Landscape Wednesday, April 19 th, 2017 8:30-10:30 a.m. #SharedFuture U N D E R S T
Tell us what you think. Provide feedback to help make American Community Survey data more useful for you.
 DP02 SELECTED SOCIAL CHARACTERISTICS IN THE UNITED STATES 2016 American Community Survey 1-Year Estimates Supporting documentation on code lists, subject definitions, data accuracy, and statistical testing
Illegal Immigration: How Should We Deal With It?
 Illegal Immigration: How Should We Deal With It? Polling Question 1: Providing routine healthcare services to illegal Immigrants 1. Is a moral/ethical responsibility 2. Legitimizes illegal behavior 3.
Le Sueur County Demographic & Economic Profile Prepared on 7/12/2018
 Le Sueur County Demographic & Economic Profile Prepared on 7/12/2018 Prepared by: Mark Schultz Regional Labor Market Analyst Southeast and South Central Minnesota Minnesota Department of Employment and
Using the American Community Survey to Measure Net International Migration
 Using the American Community Survey to Measure Net International Migration Victoria Velkoff Population Division U.S. Census Bureau Workshop on the American Community Survey Havana, Cuba November 16, 2010
Summary of the U.S. Census Bureau s 2015 County-Level Population and Component Estimates for Massachusetts
 Summary of the U.S. Census Bureau s 2015 County-Level Population and Component Estimates for Massachusetts Prepared by: UMass Donahue Institute Economic and Public Policy Research Population Estimates
Application for Employment
 (An Equal Opportunity Employer) Application for Employment PERSONAL INFORMATION DATE (PRINT) NAME LAST FIRST MIDDLE CURRENT ADDRESS STREET CITY STATE ZIP PHONE NUMBER CELL NUMBER ARE YOU 18 YEARS OR OLDER
United States Equal Employment Opportunity Commission
 United States Equal Employment Opportunity Commission NATIONAL ORIGIN DISCRIMINATION Christine Park-Gonzalez, Deputy District Director EEOC Los Angeles District EEOC is an independent regulatory commission
Demographic Data. Comprehensive Plan
 Comprehensive Plan 2010-2030 4 Demographic Data Population and demographics have changed over the past several decades in the City of Elwood. It is important to incorporate these shifts into the planning
Asian Pacific American Heritage Month: May 2004
 CB04-FF.06 April 19, 2004 Asian Pacific American Heritage Month: May 2004 In 1978, a joint congressional resolution established Asian Pacific American Heritage Week. The first 10 days of May were chosen
Race, Ethnicity, and Economic Outcomes in New Mexico
 Race, Ethnicity, and Economic Outcomes in New Mexico Race, Ethnicity, and Economic Outcomes in New Mexico New Mexico Fiscal Policy Project A program of New Mexico Voices for Children May 2011 The New Mexico
Understanding the Immigrant Experience Lessons and themes for economic opportunity. Owen J. Furuseth and Laura Simmons UNC Charlotte Urban Institute
 Understanding the Immigrant Experience Lessons and themes for economic opportunity Owen J. Furuseth and Laura Simmons UNC Charlotte Urban Institute Charlotte-Mecklenburg Opportunity Task Force March 10,
Characteristics of People. The Latino population has more people under the age of 18 and fewer elderly people than the non-hispanic White population.
 The Population in the United States Population Characteristics March 1998 Issued December 1999 P20-525 Introduction This report describes the characteristics of people of or Latino origin in the United
The American Community Survey and State Legislative Districts
 The American Community Survey and State Legislative Districts Dr. Nancy A. Potok Deputy Director and Chief Operating Officer U.S. Census Bureau National Conference of State Legislatures Legislative Summit
Racial Inequities in the Washington, DC, Region
 W A S H I N G T O N A R E A R E S E A R C H I N I T I A T V E Racial Inequities in the Washington, DC, Region 2011 15 Leah Hendey December 2017 The Washington, DC, region is increasingly diverse and prosperous,
Institute for Public Policy and Economic Analysis
 Institute for Public Policy and Economic Analysis The Institute for Public Policy and Economic Analysis at Eastern Washington University will convey university expertise and sponsor research in social,
THE STATE OF THE UNIONS IN 2009: A PROFILE OF UNION MEMBERSHIP IN LOS ANGELES, CALIFORNIA AND THE NATION 1
 THE STATE OF THE UNIONS IN 2009: A PROFILE OF UNION MEMBERSHIP IN LOS ANGELES, CALIFORNIA AND THE NATION 1 Lauren D. Appelbaum UCLA Institute for Research on Labor and Employment Ben Zipperer University
Environmental Justice Demographic Profile
 CENTRAL PUGET SOUND REGION Environmental Justice Demographic Profile January 2016 Contents INTRODUCTION... 3 OBJECTIVES... 4 DEFINITIONS... 4 Minority Populations... 4 Low-Income Population... 4 Other
Representational Bias in the 2012 Electorate
 Representational Bias in the 2012 Electorate by Vanessa Perez, Ph.D. January 2015 Table of Contents 1 Introduction 3 4 2 Methodology 5 3 Continuing Disparities in the and Voting Populations 6-10 4 National
Selected National Demographic Trends
 Selected National Demographic Trends Tawara D. Goode Director, Georgetown University National Center for Cultural Competence Assistant Professor, Center for Child and Human Development Spring 2016 University
Last First Middle. Number Street City State Zip Code. Monday Tuesday Wednesday Thursday Friday Saturday Sunday
 GOODWILL INDUSTRIES OF NORTHEASTERN PA 925 PROSPECT AVENUE, SCRANTON, PA 18505 Phone: (570) 343-1166 Fax: (570) 343-6765 Residential: (570) 706-9586 Fax: (570) 706-9587 www.goodwillnepa.org Applicants
THE STATE OF THE UNIONS IN 2011: A PROFILE OF UNION MEMBERSHIP IN LOS ANGELES, CALIFORNIA AND THE NATION 1
 THE STATE OF THE UNIONS IN 2011: A PROFILE OF UNION MEMBERSHIP IN LOS ANGELES, CALIFORNIA AND THE NATION 1 Lauren D. Appelbaum UCLA Institute for Research on Labor and Employment 2 Ben Zipperer University
OVERVIEW. Demographic Trends. Challenges & Opportunities. Discussion
 People on the Move James H. Johnson, Jr. Frank Hawkins Kenan Institute of Private Enterprise Kenan-Flagler Business School University of North Carolina at Chapel Hill January 2017 OVERVIEW Demographic
Name Home Phone( ) LAST FIRST MIDDLE Cell Phone( ) Address: Address NO STREET CITY STATE ZIP
 LAST FIRST MIDDLE Cell Phone( ) Address: Address NO STREET CITY STATE ZIP") Canadian County Children s Justice Center EMPLOYMENT APPLICATION (rev. 01-11) Canadian County is an equal opportunity employer and will consider all applicants for all positions equally without regard
Canadian County Children s Justice Center EMPLOYMENT APPLICATION (rev. 01-11) Canadian County is an equal opportunity employer and will consider all applicants for all positions equally without regard
This report is published by the Council on Asian Pacific Minnesotans. For more information, contact the Council on Asian Pacific Minnesotans at
 This report is published by the Council on Asian Pacific Minnesotans. For more information, contact the Council on Asian Pacific Minnesotans at 658 Cedar Street, Suite 160 Saint Paul, Minnesota 55155 (651)
The Inland Empire in Hans Johnson Joseph Hayes
 The Inland Empire in 2015 Hans Johnson Joseph Hayes Inland Empire: Tremendous Growth and Change Strong population growth Increasing diversity Sustained economic growth* 2 PPIC Developed 2015 Projections
WALTON COUNTY PROPERTY APPRAISER S OFFICE APPLICATION FOR AT-WILL EMPLOYMENT
 WALTON COUNTY PROPERTY APPRAISER S OFFICE APPLICATION FOR AT-WILL EMPLOYMENT P.O. BOX 691, DEFUNIAK SPRINGS, FL 32435 (850) 892-8123 FAX (850) 892-8374 We are proud to be an Equal Employment Opportunity,
Application for Employment
 Application for Employment Mission Statement The Metro YMCAs of the Oranges strengthens community through youth development, healthy living and social responsibility The YMCA maintains a zero tolerance
ESPERANZA HEALTH SYSTEMS, LTD. D/B/A LA HACIENDA TREATMENT CENTER ARBITRATION AGREEMENT
 ESPERANZA HEALTH SYSTEMS, LTD. D/B/A LA HACIENDA TREATMENT CENTER ARBITRATION AGREEMENT PLEASE READ AND SIGN THIS PAGE BEFORE COMPLETING THE APPLICATION PACKET Esperanza Health Systems, Ltd. D/B/A/ La
info Poverty in the San Diego Region SANDAG December 2013
 info December 2013 SANDAG Poverty in the San Diego Region Table of Contents Overview... 3 Background... 3 Federal Poverty Measurements... 4 Poverty Status for Individuals in the San Diego Region... 6 Demographic
The New U.S. Demographics
 The Brookings Institution Center on Urban and Metropolitan Policy The New U.S. Demographics Audrey Singer Funders Network on Population, Reproductive Health and Rights November 10, 2003 QUESTIONS How has
Utah s Demographic Transformation
 Utah's Demographic Transformation: Implications for Education and Workforce 27 Council of Councils Southern Utah University Cedar City, Utah October 11, 27 Pamela S. Perlich, Ph.D. Senior Research Economist
Salvadorans. imagine all the people. Salvadorans in Boston
 Salvadorans imagine all the people Salvadorans in Boston imagine all the people is a series of publications produced by the Boston Redevelopment Authority for the Mayor s Office of Immigrant Advancement.
Why disaggregate data on U.S. children by immigrant status? Some lessons from the diversitydatakids.org project
 Why disaggregate data on U.S. children by immigrant status? Some lessons from the diversitydatakids.org project Dolores Acevedo-Garcia, PhD, MPA-URP Samuel F. and Rose B. Gingold Professor of Human Development
INFOBRIEF SRS. Over the past decade, both the U.S. college-educated
 INFOBRIEF SRS Science Resources Statistics National Science Foundation NSF 07-324 Directorate for Social, Behavioral, and Economic Sciences June 2007 WHY DID THEY COME TO THE UNITED STATES? A PROFILE OF
Hispanics, Immigration and the Nation s Changing Demographics
 Hispanics, Immigration and the Nation s Changing Demographics Ana Gonzalez-Barrera Senior Researcher Immigration and Demographics U.S. Immigrant Population Reached 45 million in 2015; Projected to be 78.2
These socioeconomic indicators characterize the ROI. Community treatment by the Army; Greater public participation and public opinion;
 3.12 SOCIOECONOMICS AND ENVIRONMENTAL JUSTICE The socioeconomic indicators used to describe the affected environment for socioeconomic resources include population; economy, employment, and income; housing;
Population Estimates in the United States
 Population Estimates in the United States Victoria Velkoff U.S. Census Bureau Seminar on New Directions in Social Statistics February 22, 2008 Outline What estimates we produce and why Basic methodology
DEMOGRAPHIC PROFILE Skagit County, Washington. Prepared by: Skagit Council of Governments 204 West Montgomery Street, Mount Vernon, WA 98273
 DEMOGRAPHIC PROFILE 2013 Skagit County, Washington Prepared by: Skagit Council of Governments 204 West Montgomery Street, Mount Vernon, WA 98273 CONTENTS TABLE OF CONTENTS Introduction... 1 Persons and
Institute for Public Policy and Economic Analysis
 Institute for Public Policy and Economic Analysis The Institute for Public Policy and Economic Analysis at Eastern Washington University will convey university expertise and sponsor research in social,
PROJECTING DIVERSITY: THE METHODS, RESULTS, ASSUMPTIONS AND LIMITATIONS OF THE U.S. CENSUS BUREAU S POPULATION PROJECTIONS
 PROJECTING DIVERSITY: THE METHODS, RESULTS, ASSUMPTIONS AND LIMITATIONS OF THE U.S. CENSUS BUREAU S POPULATION PROJECTIONS Howard Hogan, U.S. Census Bureau Jennifer M. Ortman, U.S. Census Bureau Sandra
Gopal K. Singh 1 and Sue C. Lin Introduction
 BioMed Research International Volume 2013, Article ID 627412, 17 pages http://dx.doi.org/10.1155/2013/627412 Research Article Marked Ethnic, Nativity, and Socioeconomic Disparities in Disability and Health
Disruptive Demographics: Implications for North Carolina s Health and Competitiveness
 Disruptive Demographics: Implications for North Carolina s Health and Competitiveness James H. Johnson, Jr. Frank Hawkins Kenan Institute of Private Enterprise Kenan-Flagler Business School University
Mexicans in New York City, : A Visual Data Base
 Mexicans in New York City, 1990 2009: A Visual Data Base Center for Latin American, Caribbean & Latino Studies Graduate Center City University of New York 365 Fifth Avenue Room 5419 New York, New York
Introduction. Background
 Millennial Migration: How has the Great Recession affected the migration of a generation as it came of age? Megan J. Benetsky and Alison Fields Journey to Work and Migration Statistics Branch Social, Economic,
Briefing Book- Labor Market Trends in Metro Boston
 Briefing Book- Labor Market Two other briefing books focus on the importance of formal education and ESOL courses to Boston s foreign-born residents. While there are a number of reasons why improving immigrant
Union Members and Gainful Workers in Los Angeles, 1930 to 1950
 FIGURE 1.1 1000 800 Union Members and Gainful Workers in Los Angeles, 1930 to 1950 Gainful Workers Union Members (Thousands) 600 400 200 0 1930 1933 1934 1935 1938 1939 1940 1943 1944 1945 1946 1947 1948
Salvadorans. in Boston
 Salvadorans in Boston Banda El Salvador at the 2013 Rose Parade in Pasadena, California. Photo by Prayitno Photography, retrieved from flickr.com/ photos/prayitnophotography (Creative Commons Attribution
Measuring the American Social Contract
 Measuring the American Social Contract Part 1 of 4 Social Contract Indicators: Jobs Lauren Damme Next Social Contract Initiative, New America Foundation July, 2011 Valuable research assistance provided
Patrick Adler and Chris Tilly Institute for Research on Labor and Employment, UCLA. Ben Zipperer University of Massachusetts, Amherst
 THE STATE OF THE UNIONS IN 2013 A PROFILE OF UNION MEMBERSHIP IN LOS ANGELES, CALIFORNIA AND THE NATION 1 Patrick Adler and Chris Tilly Institute for Research on Labor and Employment, UCLA Ben Zipperer
Regional Data Snapshot
 Regional Data Snapshot Population, Economy & Education Features SET Civic Forum East Central NM, New Mexico Table of Contents 01 Overview 03 Human Capital 02 Demography 04 Labor Force 01 overview East
UndecidedVotersinthe NovemberPresidential Election. anationalsurvey
 UndecidedVotersinthe NovemberPresidential Election anationalsurvey September2008 Undecided Voters in the November Presidential Election a national survey Report prepared by Jeffrey Love, Ph.D. Data collected
Regional Data Snapshot
 Regional Data Snapshot Population, Economy & Education Features SET Civic Forum Uwharrie Region, NC Table of Contents 01 Overview 03 Human Capital 02 Demography 04 Labor Force 01 overview Uwharrie Region,
CLACLS. A Profile of Latino Citizenship in the United States: Demographic, Educational and Economic Trends between 1990 and 2013
 CLACLS Center for Latin American, Caribbean & Latino Studies A Profile of Latino Citizenship in the United States: Demographic, Educational and Economic Trends between 1990 and 2013 Karen Okigbo Sociology
Population Outlook for the Portland-Vancouver Metropolitan Region
 Portland State University PDXScholar Institute of Portland Metropolitan Studies Publications Institute of Portland Metropolitan Studies 2007 Population Outlook for the Portland-Vancouver Metropolitan Region
diverse communities diverse experiences
 diverse communities diverse experiences The Status of Asian Americans & Pacific Islanders in the U.S. A Review of Six Socioeconomic Indicators and Their Impact on Health APIAHF ASIAN & PACIFIC ISLANDER
FIVE KEY TRENDS STRUCTURING L.A. S FUTURE AND WHY 2GEN MAKES SENSE
 FIVE KEY TRENDS STRUCTURING L.A. S FUTURE AND WHY 2GEN MAKES SENSE 05/29/2015 MANUEL PASTOR @Prof_MPastor FUTURE-CASTING LOS ANGELES 1. 2. 3. 4. Slowing Demographic Change at Macro-level The Action: Micro-level
Disruptive Demographics: Implications for the Accounting Profession James H. Johnson, Jr. Distinguished Professor of Entrepreneurship & Strategy,
 Disruptive Demographics: Implications for the Accounting Profession James H. Johnson, Jr. Distinguished Professor of Entrepreneurship & Strategy, University of North Carolina Kenan-Flagler Business School
Where U.S. Immigrants Were Born 1960
 Where U.S. Immigrants Were Born 1960 2000 Latin America 9% Canada 10% Asia 5% Other 1% Other 6% Asia 26% Canada 3% Europe 15% Latino 22% Europe 75% Latin America 51% Foreign-Born Population by Region of
The Changing Face of Labor,
 The Changing Face of Labor, 1983-28 John Schmitt and Kris Warner November 29 Center for Economic and Policy Research 1611 Connecticut Avenue, NW, Suite 4 Washington, D.C. 29 22-293-538 www.cepr.net CEPR
Summary of the U.S. Census Bureau s 2016 County-Level Population and Component Estimates for Massachusetts
 Summary of the U.S. Census Bureau s 2016 County-Level Population and Component Estimates for Massachusetts Prepared by: UMass Donahue Institute Economic and Public Policy Research Population Estimates
Union Byte By Cherrie Bucknor and John Schmitt* January 2015
 January 21 Union Byte 21 By Cherrie Bucknor and John Schmitt* Center for Economic and Policy Research 1611 Connecticut Ave. NW Suite 4 Washington, DC 29 tel: 22-293-38 fax: 22-88-136 www.cepr.net Cherrie
Regional Data Snapshot
 Regional Data Snapshot Population, Economy & Education Features SET Civic Forum Glacial Lakes Region, South Dakota Table of Contents 01 Overview 03 Human Capital 02 Demography 04 Labor Force 01 overview
EMPLOYMENT APPLICATION CITY OF BILLINGS P.O. BOX 1178 BILLINGS, MT Notice to Applicants PERSONAL INFORMATION
 EMPLOYMENT APPLICATION CITY OF BILLINGS P.O. BOX 1178 BILLINGS, MT 59103 Notice to Applicants We welcome you as an applicant for employment. It is the policy of the City of Billings to consider applicants
HMDA Race and Ethnicity Reporting Appendix B - Revised as of August 24, 2017
 APPENDIX B TO PART 1003 FORM AND INSTRUCTIONS FOR DATA COLLECTION ON ETHNICITY, RACE, AND SEX * * * * * 8. You must report the ethnicity, race, and sex of an applicant as provided by the applicant. For
Foreign American Community Survey. April 2011
 Foreign Population 2005-2009 American Community Survey April 2011 Department of Community Planning, Housing and Development Planning Division Planning Research and Analysis Team Arlington Vision Arlington
Gone to Texas: Migration Vital to Growth in the Lone Star State. Pia Orrenius Federal Reserve Bank of Dallas June 27, 2018
 Gone to Texas: Migration Vital to Growth in the Lone Star State Pia Orrenius Federal Reserve Bank of Dallas June 27, 2018 Roadmap History/Trends in migration to Texas Role in economic growth Domestic migration
Youth at High Risk of Disconnection
 Youth at High Risk of Disconnection A data update of Michael Wald and Tia Martinez s Connected by 25: Improving the Life Chances of the Country s Most Vulnerable 14-24 Year Olds Prepared by Jacob Rosch,
Migration Information Source - Chinese Immigrants in the United States
 Pagina 1 di 8 Chinese Immigrants in the United States By Aaron Terrazas, Jeanne Batalova Migration Policy Institute May 6, 2010 The United States is home to about 1.6 million Chinese immigrants (including
The Black Labor Force in the Recovery
 Cornell University ILR School DigitalCommons@ILR Federal Publications Key Workplace Documents 7-11-2011 The Black Labor Force in the Recovery United States Department of Labor Follow this and additional
OFFICE OF THE CONTROLLER. City Services Auditor 2005 Taxi Commission Survey Report
 OFFICE OF THE CONTROLLER City Services Auditor 2005 Taxi Commission Survey Report February 7, 2006 TABLE OF CONTENTS INTRODUCTION 3 SURVEY DATA ANALYSIS 5 I. The Survey Respondents 5 II. The Reasonableness
Prophetic City: Houston on the Cusp of a Changing America.
 Prophetic City: Houston on the Cusp of a Changing America. Tracking Responses to the Economic and Demographic Transformations through 36 Years of Houston Surveys Dr. Stephen L. Klineberg TACA 63rd Annual
Hardee County Board of County Commissioners Equal Employment Opportunity (EEO) Self-Identification Form (completion of this form is voluntary)
 Self-Identification Form (completion of this form is voluntary)") Please submit to: Hardee County Board of County Commissioners HR Department 205 Hanchey Road, Wauchula, Florida 33873 Phone: (863) 773-2161 Hardee County Board of County Commissioners Equal Employment
Please submit to: Hardee County Board of County Commissioners HR Department 205 Hanchey Road, Wauchula, Florida 33873 Phone: (863) 773-2161 Hardee County Board of County Commissioners Equal Employment
Metro Atlanta Workforce:
 Metro Atlanta Workforce: Industries in Demand & Opportunity Occupations October, 2018 Atlanta Regional Commission For more information, contact: cdegiulio@atlantaregional.org In Sum In looking at a more
Remittances and the Dominican Republic Survey of Recipients in the Dominican Republic Survey of Senders in the United States
 Remittances and the Dominican Republic Survey of Recipients in the Dominican Republic Survey of Senders in the United States Columbia University New York City November 23, 2004 I. The U.S. Sample National
Racial Disparities in the Direct Care Workforce: Spotlight on Hispanic/Latino Workers
 FEBRUARY 2018 RESEARCH BRIEF Racial Disparities in the Direct Care Workforce: Spotlight on Hispanic/Latino Workers BY STEPHEN CAMPBELL The second in a three-part series focusing on racial and ethnic disparities
Inside the 2012 Latino Electorate
 June 3, 2013 Mark Hugo Lopez, Associate Director Ana Gonzalez-Barrera, Research Associate FOR FURTHER INFORMATION CONTACT: Pew Hispanic Center 1615 L St, N.W., Suite 700 Washington, D.C. 20036 Tel(202)
Program Year (PY) 2017 Workforce Innovation and Opportunity Act (WIOA) Allotments; PY 2017 Wagner-Peyser Act Final Allotments and PY 2017 Workforce
 2017 Workforce Innovation and Opportunity Act (WIOA) Allotments; PY 2017 Wagner-Peyser Act Final Allotments and PY 2017 Workforce") This document is scheduled to be published in the Federal Register on 06/15/2017 and available online at https://federalregister.gov/d/2017-12336, and on FDsys.gov DEPARTMENT OF LABOR Employment and Training
This document is scheduled to be published in the Federal Register on 06/15/2017 and available online at https://federalregister.gov/d/2017-12336, and on FDsys.gov DEPARTMENT OF LABOR Employment and Training
BLS Spotlight on Statistics: Union Membership In The United States
 Cornell University ILR School DigitalCommons@ILR Federal Publications Key Workplace Documents 9-2016 BLS : Union Membership In The United States Megan Dunn Bureau of Labor Statistics James Walker Bureau
FOCUS. Native American Youth and the Juvenile Justice System. Introduction. March Views from the National Council on Crime and Delinquency
 FOCUS Native American Youth and the Juvenile Justice System Christopher Hartney Introduction Native American youth are overrepresented in the juvenile justice system. A growing number of studies and reports
LATINO DATA PROJECT. Astrid S. Rodríguez Ph.D. Candidate, Educational Psychology. Center for Latin American, Caribbean, and Latino Studies
 LATINO DATA PROJECT Demographic, Economic, and Social Transformations in the South Bronx: Changes in the NYC Community Districts Comprising Mott Haven, Port Morris, Melrose, Longwood, and Hunts Point,
Facts & Figures in this issue: income employment growth trends baby boomers millennials immigration
 Facts & Figures in this issue: income employment growth trends baby boomers millennials immigration 2017 Baby Boomers The term baby boomer refers to individuals born in the United States between 1946 and
Peruvians in the United States
 Peruvians in the United States 1980 2008 Center for Latin American, Caribbean & Latino Studies Graduate Center City University of New York 365 Fifth Avenue Room 5419 New York, New York 10016 212-817-8438
THE NATIONAL ACADEMIES PRESS
 THE NATIONAL ACADEMIES PRESS This PDF is available at http://www.nap.edu/23550 SHARE The Economic and Fiscal Consequences of Immigration DETAILS 508 pages 6 x 9 PAPERBACK ISBN 978-0-309-44445-3 DOI: 10.17226/23550
New Americans in Houston
 New Americans in Houston A Snapshot of the Demographic and Economic Contributions of Immigrants in the Metro Area POPULATION 6.8M.6M Total population in 06 Immigrant population.% Immigrant share of the
Demographic, Economic, and Social Transformations in Brooklyn Community District 4: Bushwick,
 Demographic, Economic, and Social Transformations in Brooklyn Community District 4: Bushwick, 1990-2007 Astrid S. Rodríguez Ph.D. Candidate, Educational Psychology Center for Latin American, Caribbean
FOR ACTION OUR COMMUNITIES. OUR PRIORITIES. OUR COUNTRY.
 FOR ACTION OUR COMMUNITIES. OUR PRIORITIES. OUR COUNTRY. Presented by the National Council of Asian Pacific Americans (NCAPA) The National Council of Asian Pacific Americans (NCAPA), founded in 1996, is
Return to facility/person you obtained the application.
 Instructions for manual employment applications Today s Date: Due to the volume of applications received, we will not be able to respond to requests of application status. Please ensure you indicate your
MIGRATION STATISTICS AND BRAIN DRAIN/GAIN
 MIGRATION STATISTICS AND BRAIN DRAIN/GAIN Nebraska State Data Center 25th Annual Data Users Conference 2:15 to 3:15 p.m., August 19, 2014 David Drozd Randy Cantrell UNO Center for Public Affairs Research