Disruptive Demographics: Implications for North Carolina s Health and Competitiveness
|
|
|
- Noreen Wright
- 5 years ago
- Views:
Transcription
1 Disruptive Demographics: Implications for North Carolina s Health and Competitiveness James H. Johnson, Jr. Frank Hawkins Kenan Institute of Private Enterprise Kenan-Flagler Business School University of North Carolina at Chapel Hill November 2013
2 OVERVIEW Demographic Trends Challenges & Opportunities Discussion

3 what CENSUS 2010 will REVEAL November 2013
4 6 DISRUPTIVE TRENDS The South Rises Again The Browning of America Marrying Out is In The Silver Tsunami is About to Hit The End of Men? Cooling Water from Grandma s Well and Grandpa s Too!


5 The South Continues To Rise...Again!
6 Years SOUTH S SHARE OF U.S. NET POPULATION GROWTH, SELECTED YEARS, U.S. Absolute Population Change South s Absolute Population Change South s Share of Change ,974,129 8,468,303 27% ,123,138 9,339,455 33% ,886,128 15,598,279 30% ,497,947 22,650,563 50% ,035,665 29,104,814 49%
7 U.S. POPULATION CHANGE BY Region REGION, Population Absolute Population Change, Percent Population Change, U.S. 309,050,816 26,884, % Northeast 55,417,311 1,753, % Midwest 66,972,887 2,480, % South 114,555,744 14,318, % West 72,256,183 8,774, % North Carolina 9,535,483 1,486, %
8 SHARES OF NET POPULATION GROWTH BY REGION, Region Absolute Population Change Percent of Total UNITED STATES 26,884, NORTHEAST 1,753, MIDWEST 2,480, SOUTH 14,318, WEST 8,774,
9 NET MIGRATION TRENDS, Northeast Midwest South West Total -1,032-2,008 +2, Black Hispanic Elderly Foreign born = Net Import = Net Export
10 GROSS AND NET MIGRATION FOR THE SOUTH, The Region Domestic Foreign Years In Out Net In Out Net ,125,096 3,470, , , , , ,874,414 3,477, , , , ,300 Florida Domestic Foreign Years In Out Net In Out Net , , ,002 41,745 24,108 17, , ,087-13,156 33,095 32,094 1,001
11 STATE SHARE OF SOUTH S NET GROWTH, Region/State Absolute Change State s Share The South 14,318, % Texas 4,293, % Florida 2,818, % Georgia 1,501, % North Carolina 1,486, % Other Southern States 4,218, %

12 NC COUNTIES WITH THE LARGEST ABSOLUTE POPULATION GAINS,
13 NC COUNTIES EXPERIENCING POPULATION DECLINE,
14 Counties with Biologically Declining Populations, 2009
15 Absolute and Relative Population Change, Area 2010 Population Absolute Change Percent Change North Carolina 9,535,483 1,486, % Guilford 488,406 67, % County Greensboro City 269,666 45, %

16 North Carolina Counties Experiencing Growth & Decline,
17 Balance of Population Change Equation Population Change = In-Flows Out- Flows where In-flows = [Births + In-Migrants] & Out-Flows =[Deaths + Out-Migrants]
18 Typology of Communities Demographic Experience Balanced Growth Natural Growth Migration Magnets Dying Biologically Declining Emptying Out Drivers Births exceed deaths and in-migration exceeds outmigration. Out-migration exceeds in-migration but this population loss is offset by an excess of births over deaths. Deaths exceed births but population loss is averted because in-migration exceeds out-migration. Deaths exceed births and out-migration exceeds inmigration, resulting in population loss. In-migration exceeds out-migration but his net migration is not substantial enough to offset an excess of deaths over births Births exceed deaths but out-migration exceeds inmigration, resulting in net population loss
19 Types of Communities in Eastern and Western North Carolina Type of Community Number Balanced Growth 13 Natural Growth 5 Migration Magnet 4 Emptying Out 3 Dying 23 Biologically Declining 7

20 Demographic Typology of NC Counties,
21 Guilford County Migration Trends, Indicator In-Migrants Out- Migrants Number of Migrants Average Adjusted Gross Income 113, ,961 +5,416 Net/Difference $39,412 $40,654 -$1,242
22 Components of Population Change in Guilford County, NC, Area Guilford County Total Population Change Natural Change Net Migration 12,473 4,697 7,871
23 THE BROWNING OF NORTH CAROLINA
24 U.S. Immigrant Population, Number of Immigrants (in millions) Year
25 U.S. Foreign Born Population by Race/Ethnicity, 2011 Race/Ethnicity Foreign Population Share of Total (%) Total 40,381, Hispanic 18,788, White Alone, not Hispanic 7,608, Black Alone, not Hispanic 3,130, Asian Alone, not Hispanic 9,988, Other Alone, not Hispanic 866, July
26 U.S. POPULATION CHANGE BY Race RACE & ETHNICITY, Population Absolute Change Percentage Change Total 308,745,538 27,323, % Non-Hispanic 258,267,944 12,151, % White 196,817,552 2,264, % Black 37,685,848 3,738, % AI/AN 2,247, , % Asian 14,465,124 4,341, % NH/PI 481, , % 2 or More Races 5,966,481 1,364, % Hispanic 50,477,594 15,171, %
27 NORTH CAROLINA POPULATION GROWTH BY NATIVITY, RACE, AND ETHNICITY, % 547% 332% 129% 127% 133% 182% Native Immigrant White Black Hispanic Asian Pacific Islander
28 NORTH CAROLINA FOREIGN BORN POPULATION GROWTH, , % 430, % 21,978 28, % 0.6% 78, % 115, %
29 Area CONTRIBUTIONS OF NON-WHITES & HISPANICS TO NC POPULATION CHANGE, Absolute Population Change Percent Non- White* Percent Hispanic All Counties 1,486, Tier 1 Counties 69, Tier 2 Counties 327, Tier 3 Counties 1,088, Source: Census 2000 and Census *Non-whites include Blacks, Hispanics, American Indians and Alaskan Natives, Asians, Native Hawaiians & Pacific Islanders, and people of two or more races.
30 GUILFORD COUNTY POPULATION CHANGE BY RACE & ETHNICITY, Race 2010 Population Absolute Change Percentage Change Total 488,406 67, % Non-Hispanic 453,580 48, % White 265, % Black 156,982 34, % AI/AN 2, % Asian 19,059 8, % NH/PI % Some other race 1, % 2 or More Races 8,924 3, % Hispanic 34,826 18, %
31 GREENSBORO POPULATION CHANGE BY RACE & ETHNICITY, Race 2010 Population Absolute Change Percentage Change Total 269,666 45, % Non-Hispanic 249,330 35, % White 122,888 2, % Black 108,233 25, % AI/AN 1, % Asian 10,711 4, % NH/PI % Some other race % 2 or More Races 5,571 2, % Hispanic 20,336 10, %
32 CONTRIBUTIONS OF NON-WHITES & HISPANICS TO GUILFORD COUNTY POPULATION CHANGE, Area Absolute Population Change Percent Non-white Percent Hispanic North Carolina 1,486, Guilford 67, County Greensboro City 45,


33 Marrying Out is In October
34 INTERMARRIAGE TREND, % Married Someone of a Different Race/Ethnicity October


35 INTERMARRIAGE TYPES Newly Married Couples in 2008 October
36 OUT-MARRIAGE PATTERNS BY RACE AND GENDER, NC Hispanic Men 21.4 Hispanic Women 21.6 Black Men 9.4 Black Women 3.4 White Female 18.0 White Male 16.4 White Female 6.0 White Male 0.6 Black Female 1.5 Black Male 3.7 Hispanic Female 1.4 Hispanic Male 1.9 Asian Female 0.7 Asian Male 0.2 Asian Female 0.5 Asian Male 0.1 Other Female 1.2 Other Male 1.3 Other Female 1.5 Other Male 0.9 White Men 3.3 White Women 3.4 Asian Men 12.3 Asian Women 31.4 Hispanic Female 1.1 Hispanic Male 1.2 White Female 10.0 Hispanic Male 1.5 Black Female 0.3 Black Male 1.1 Black Female 0.6 White Male 25.8 Asian Female 0.9 Asian Male 0.2 Hispanic Female 0.5 Black Male 2.7 Other Female 1.0 Other Male 0.9 Other Female 1.2 Other Male 1.3
37 MEDIAN AGE & FERTILITY RATES FOR FEMALES IN NC, Demographic Group Median Age Fertility/1000 women* All Females White, Not Hispanic Black American Indian & Alaskan Native Asian Native Hawaiian & Pacific Islander Some other race Two or more races Hispanic Native Born Foreign Born Source: American Community Survey *Women 15 to 50 with births in past 12 months

38 Median Age and Fertility Rates for Females in Greensboro, Demographic Group All Females White, Not Hispanic Black American Indian & Alaskan Native Asian Native Hawaiian & Pacific Islander Some other race Two or more races Hispanic Native Born Foreign Born Source: *Women 15 to 50 with births in past 12 months. Median Age Fertility/1000 women*
39 RELATIVE DISTRIBUTION OF U.S. BIRTHS BY RACE / ETHNICITY Race/Ethnicity White 66% 50% 49.6% Blacks 17% 16% 15.0% Hispanics 15% 26% 26.0% Other 2% 8% 9.4% Source: Johnson and Lichter (2010); Tavernise (2011).
40 CHANGE IN THE RACE/ETHNIC COMPOSITION OF NC PUBLIC SCHOOLS, Group 2009 Enrollment 2000 Enrollment Absolute Change Percent Change Share of Net Change Total. 1,427,960 1,268, , % AI/AN 20,378 18,651 1, % Black 444, ,712 51, % Asian 35,140 23,576 11, % Hispanic 152,605 56,232 96, % White 774, ,251-1, Source: DPI, The Statistical Profile Online

41 NC s SILVER TSUNAMI

42 U.S. POPULATION CHANGE BY AGE, Age 2009 Absolute Change Percentage Change <25 104,960,250 5,258, ,096,278-1,898, ,379,439 16,977, ,570,590 4,496, TOTAL 307,006,550 24,834, October
43 U.S. POPULATION TURNING 50, 55, 62, AND 65 YEARS OF AGE, ( ) Age 50 Age 55 Age 62 Age 65 Average Number/Day 12,344 11,541 9,221 8,032 Average Number/Minute October

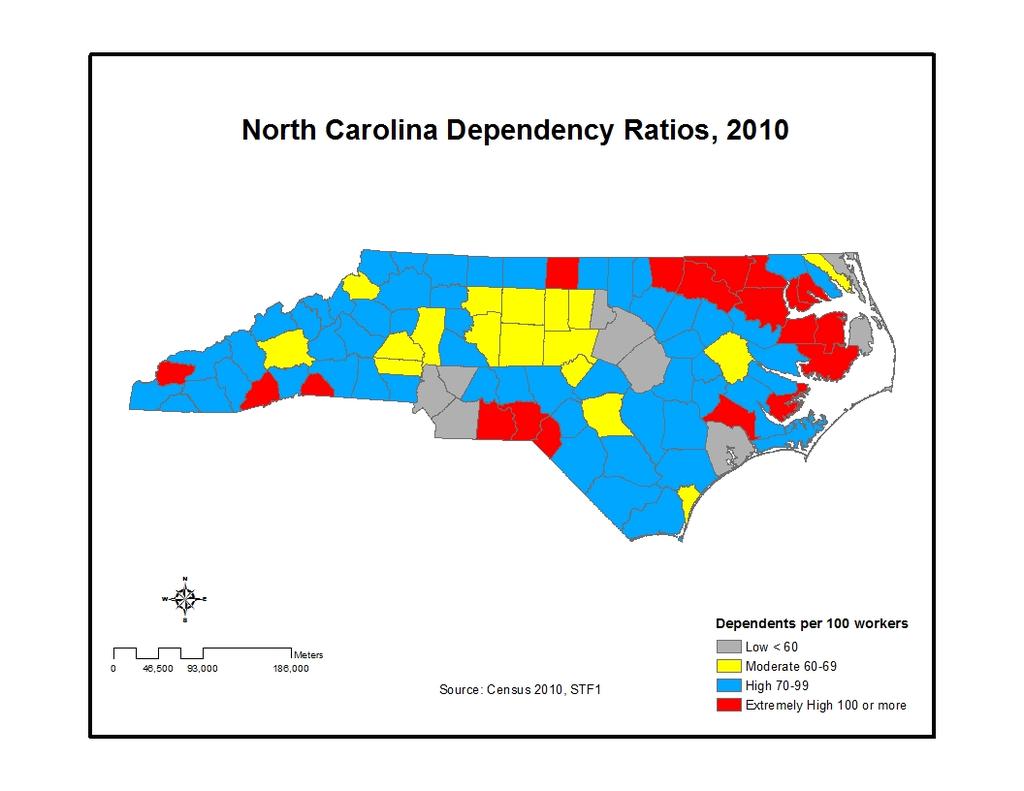
44 DEPENDENCY RATIOS IN THE AMERICAN SOUTH Source: Census 2010
45 NC ABSOLUTE POPULATION CHANGE BY AGE, Age All Counties Tier 3 Counties Tier 2 Counties All Ages 1,486,170 1,088, ,859 69,365 <25 449, ,818 85,481-5, , ,248-36,139-49, , , ,101 88, , ,175 79,416 36,440 Tier 1 Counties
46
 5,099 (7.2%) 17,467 (38.7%) 4,394 (16.5%) Guilford County 67,358 (16.0% ) 25,500 (17.5%) -902 (-0.7%) 32,113 (34.5%) 10,647 (21.")
47 Absolute and Percent Population Change by Age, Age All Ages < Greensboro 45,775 (20.4% ) 18,815 (23.1%) 5,099 (7.2%) 17,467 (38.7%) 4,394 (16.5%) Guilford County 67,358 (16.0% ) 25,500 (17.5%) -902 (-0.7%) 32,113 (34.5%) 10,647 (21.5% )
48 COOLING WATERS FROM GRANDMA S WELL And Grandpa s Too!
49 Children Living in Non-Grandparent and Grandparent Households, Household Type Absolute Number 2010 Absolute Change All 74,718 2, No Grandparents 67, Both Grandparents Grandmother Only 2, , Grandfather Only Percent Change October
50 Children Living in Non-Grandparent and Grandparent-Headed Households by Presence of Parents, 2010 Household Type All Children (in thousands) Living with Both Parents Living with Mother Only Living with Father Only All 74, % 23.1% 3.4% 4.0% No Grandparents Both Grandparents Grandmother Only Grandfather Only 67, % 21.2% 3.3% 2.1% Living with Neither parent 2, % 40.6% 5.2% 36.1% 1, % 48.4% 4.5% 33.2% % 45.9% 4.4% 23.6% October
51 GRANDPARENTS LIVING WITH GRANDCHILDREN AGES 18 AND YOUNGER IN NORTH CAROLINA Total Households with Grandparents Grandparents Responsible for Grandchildren Child's Parents in Household Percent Change 146, , , , ,679 67,

52 The End of Men?


53 FEMALE WORKFORCE REPRESENTATION % Female
54 JOBS LOST/GAINED BY GENDER DURING 2007 (Q4) 2009 (Q3) RECESSION Industry Women Men Construction -106,000-1,300,000 Manufacturing -106,000-1,900,000 Healthcare +451, ,100 Government +176, ,000 Total -1,700,000-4,700,000
55 THE PLIGHT OF MEN Today, three times as many men of working age do not work at all compared to Selective male withdrawal from labor market rising non-employment due largely to skills mismatches, disabilities & incarceration. The percentage of prime-aged men receiving disability insurance doubled between 1970 (2.4%) and 2009 (4.8%). Since 1969 median wage of the American male has declined by almost $13,000 after accounting for inflation. After peaking in 1977, male college completion rates have barely changed over the past 35 years.
56 COLLEGE CLASS OF 2010 DEGREE MALE FEMALE DIFFERENCE Associate s 293, , ,000 Bachelor s 702, , ,000 Master s 257, , ,000 Professional 46,800 46, Doctor s 31,500 32,900 1,400 TOTAL 1,330,300 1,902, ,000
57 Area ENROLLMENT IN 2 YEAR COLLEGES, 2009 Total Enrollment Full Time Enrollment (%) Male Enrollment (%) Black Enrollment (%) U.S. 20,966, Southeast 4,731, Region North 574, Carolina NC- 2 Yr Colleges 253,
58 UNC SYSTEM STUDENT ENROLLMENT BY GENDER AND TYPE OF INSTITUTION, 2010 Type of Institution Total Enrollment Male Enrollment Percent Male UNC System 175,281 76, Majority Serving 139,250 63, Minority Serving 36,031 13, HBUs 29,865 11,191 37
59 Average EOG Scores Math 8 EOG Scores Percentage Passed Boys Girls State Avg / / / /2011 Year Gender scores are averages of 6 LEAs (Bertie, Bladen, Halifax, Duplin, Northampton and Pamlico)
60 Average EOG Scores Reading 8 EOG Scores Percentage Passed Boys Girls State Avg / / / /2011 Year Gender scores are averages of 6 LEAs (Bertie, Bladen, Halifax, Duplin, Northampton and Pamlico)
61 Average EOC Scores Algebra 1 EOC Scores Percentage Passed Boys Girls State Avg / / / /2011 Year Gender scores are averages of 6 LEAs (Bertie, Bladen, Halifax, Duplin, Northampton and Pamlico)
62 EOC Composite Scores EOC Composite Pass Rates % of Students Passing Males Females State / / / /2011 Year Gender scores are averages of 6 LEAs (Bertie, Bladen, Halifax, Duplin, Northampton and Pamlico)
63 Male-Female Presence Disparity 6400 Total Number of EOC Test Takers Number of Test Takers males females / / / /2011 Year Graph shows total number of male and female students tested of 6 LEAs (Bertie, Bladen, Duplin, Halifax, Northampton, and Pamlico)
64 High School Graduation Rates Graduation Rates (LEAs Grouped) Percent Graduated Boys Girls / / / /2011 Year Avg. graduation rates of 6 LEAs (Bertie, Bladen, Halifax, Duplin, Northampton and Pamlico)
65 The Minority Male Challenge
66 Third Grade EOG Reading Test Pass Rates For Males by Race/Ethnicity 80% 70% 65% 66% 68% 69% EOG Pass Rate 60% 50% 40% 55% 38% 59% 57% 55% 52% 52% 50% 45% 46% 46% 48% 49% 43% White Boys Black Boys Latino Boys American Indian 30% 33% 31% 20% Year
67 Third Grade EOG Math Test Pass Rates for Males by Race/Ethnicity 100% 90% 84% 90% 90% 90% 90% 80% 76% 77% 79% 80% EOG Pass Rate 70% 60% 67% 67% 74% 75% 65% 65% 80% 77% 67% 68% White Boys Black Boys Latino Boys American Indian 50% 54% 40% Year
68 Eighth Grade EOG Reading Test Pass Rates for Males by Race/Ethnicity 100% 90% 80% 77% 80% 80% 81% EOG Pass Rate 70% 60% 50% 40% 30% 32% 66% 35% 54% 49% 44% 54% 48% 43% 55% 56% 56% 52% 50% 48% White Boys Black Boys Latino Boys American Indian 20% 30% Year
69 Eighth Grade EOG Math Test Pass Rates for Males by Race/Ethnicity 100% 90% 87% 89% 89% 90% EOG Pass Rate 80% 70% 60% 78% 56% 77% 73% 74% 66% 65% 65% 79% 80% 78% 77% 67% 68% White Boys Black Boys Latino Boys American Indian 50% 51% 54% 40% Year

70 September
71 Percent of High School Graduates Requiring Remedial Course Work , , , , , None One Two or MoreHS more GradsPercent of HS Grads
72 THE COMPETITIVE TOOL KIT Analytical Reasoning Entrepreneurial Acumen Contextual Intelligence Soft Skills/Cultural Elasticity Agility and Flexibility
73 Implications for Workforce Planning and Development Managing transition from the graying to the browning of America. Competition for talent will be fierce and global. Embrace immigrants. Successful recruitment and retention will hinge on your ability to effectively manage the full nexus of diversity issues. Actively engage in K-12 Education to ensure a steady flow of talent into the health care sector. July
74 MOVING FORWARD Foster & facilitate successful aging in place as a form of enlightened self-interest. Develop and/or expand falls prevention programs. Promote healthy eating by design and active living by design. Explore the feasibility of entering the retail clinic market. Review HR procedures and training materials to ensure the delivery of culturally competent care. Audit existing facilities to ensure equal opportunity access. across the life course and build new facilities according to universal design principles and standards. Leverage smart technologies expand the reach of high quality health care and prevention programs.
OVERVIEW. Demographic Trends. Challenges & Opportunities. Discussion
 People on the Move James H. Johnson, Jr. Frank Hawkins Kenan Institute of Private Enterprise Kenan-Flagler Business School University of North Carolina at Chapel Hill January 2017 OVERVIEW Demographic
Disruptive Demographics and the Triple Whammy of Geographic Disadvantage
 Disruptive Demographics and the Triple Whammy of Geographic Disadvantage James H. Johnson, Jr. Frank Hawkins Kenan Institute of Private Enterprise Kenan-Flagler Business School University of North Carolina
Disruptive Demographics and North Carolina s Global Competitiveness Challenge
 Disruptive Demographics and North Carolina s Global Competitiveness Challenge James H. Johnson, Jr. Frank Hawkins Kenan Institute of Private Enterprise Kenan-Flagler Business School University of North
Disruptive Demographics: Implications for the Accounting Profession James H. Johnson, Jr. Distinguished Professor of Entrepreneurship & Strategy,
 Disruptive Demographics: Implications for the Accounting Profession James H. Johnson, Jr. Distinguished Professor of Entrepreneurship & Strategy, University of North Carolina Kenan-Flagler Business School
Six Disruptive Demographics That Will Change the U.S. Forever
 Six Disruptive Demographics That Will Change the U.S. Forever October 2017 OVERVIEW Demographic Trends Challenges & Opportunities Discussion October 2017 2 what CENSUS 2010 will REVEAL October 2017 October
Disruptive Demographics and the Triple Whammy of Geographic Disadvantage for America s Youth
 Disruptive Demographics and the Triple Whammy of Geographic Disadvantage for America s Youth James H. Johnson, Jr. Frank Hawkins Kenan Institute of Private Enterprise Kenan-Flagler Business School University
Six Disruptive Demographics That Will Change the U.S. & South Carolina Forever
 Six Disruptive Demographics That Will Change the U.S. & South Carolina Forever James H. Johnson, Jr. Frank Hawkins Kenan Institute of Private Enterprise Kenan-Flagler Business School University of North
Disruptive Demographics: Implications for Higher Education Institutions
 Disruptive Demographics: Implications for Higher Education Institutions James H. Johnson, Jr. Frank Hawkins Kenan Ins
Disruptive Demographics: Implications for Workforce Planning and Development
 Disruptive Demographics: Implications for Workforce Planning and Development James H. Johnson, Jr. Ph.D. William Rand Kenan, Jr. Distinguished Professor of Entrepreneurship and Strategy Kenan-Flagler Business
What are the major changes you are seeing in your community?
 Court Trends, Changing Times in North Carolina, and Public Courts- the World Courts Work in Willow Jacobson, What are the major changes you are seeing in your community? Six Disruptive Trends The South
Six Disruptive Demographics That Will Change the U.S. Forever
 Six Disruptive Demographics That Will Change the U.S. Forever James H. Johnson, Jr. Frank Hawkins Kenan Institute of Private Enterprise Kenan-Flagler Business School University of North Carolina at Chapel
People on the Move: Implications for Career Education
 People on the Move: Implications for Career Education James H. Johnson, Jr. Ph.D. William Rand Kenan, Jr. Distinguished Professor of Management Kenan-Flagler Business School Director, Urban Investment
Le Sueur County Demographic & Economic Profile Prepared on 7/12/2018
 Le Sueur County Demographic & Economic Profile Prepared on 7/12/2018 Prepared by: Mark Schultz Regional Labor Market Analyst Southeast and South Central Minnesota Minnesota Department of Employment and
Pulling Open the Sticky Door
 Pulling Open the Sticky Door Social Mobility among Latinos in Nebraska Lissette Aliaga-Linares Social Demographer Office of Latino/Latin American Studies (OLLAS) University of Nebraska at Omaha Overview
Demographic Changes, Health Disparities, and Tuberculosis
 Demographic Changes, Health Disparities, and Tuberculosis Joan M. Mangan, PhD, MST October 22, 2015 Delivering Culturally Competent Patient Education and Care to Tuberculosis Program Clients Austin, TX
SECTION 1. Demographic and Economic Profiles of California s Population
 SECTION 1 Demographic and Economic Profiles of s Population s population has special characteristics compared to the United States as a whole. Section 1 presents data on the size of the populations of
The EEO Tabulation: Measuring Diversity in the Workplace ACS Data Users Conference May 29, 2014
 The EEO Tabulation: Measuring Diversity in the Workplace ACS Data Users Conference May 29, 2014 Ana J. Montalvo Industry and Occupation Statistics Branch Social, Economic, and Housing Statistics Division
Population Outlook for the Portland-Vancouver Metropolitan Region
 Portland State University PDXScholar Institute of Portland Metropolitan Studies Publications Institute of Portland Metropolitan Studies 2007 Population Outlook for the Portland-Vancouver Metropolitan Region
Utah s Demographic Transformation
 Utah's Demographic Transformation: Implications for Education and Workforce 27 Council of Councils Southern Utah University Cedar City, Utah October 11, 27 Pamela S. Perlich, Ph.D. Senior Research Economist
Regional Data Snapshot
 Regional Data Snapshot Population, Economy & Education Features SET Civic Forum Uwharrie Region, NC Table of Contents 01 Overview 03 Human Capital 02 Demography 04 Labor Force 01 overview Uwharrie Region,
Demographic Change How the US is Coping with Aging, Immigration, and Other Challenges William H. Frey
 Demographic Change How the US is Coping with Aging, Immigration, and Other Challenges William H. Frey Brookings Institution University of Michigan www.frey-demographer.org US: Total and Age 65+ Growth,
Immigrants are playing an increasingly
 Trends in the Low-Wage Immigrant Labor Force, 2000 2005 THE URBAN INSTITUTE March 2007 Randy Capps, Karina Fortuny The Urban Institute Immigrants are playing an increasingly important role in the U.S.
KENAN INSTITUTE WHITE PAPER
 KENAN INSTITUTE WHITE PAPER JANUARY 1, 2018 LEVERAGING NORTH CAROLINA S MIGRATION DIVIDEND UISC01201801 James H. Johnson, Jr., Ph.D Allan M. Parnell, Ph.D Frank Hawkins Kenan Institute of Private Enterprise
1615 L Street, NW, Suite 700 Washington, DC (main) (fax)
 (fax)") 1615 L Street, NW, Suite 700 Washington, DC 20036-5631 202-419-3600(main) 202-419-3608(fax) www.pewresearch.org A Fact Tank The Pew Research Center is a nonpartisan organization that provides information
1615 L Street, NW, Suite 700 Washington, DC 20036-5631 202-419-3600(main) 202-419-3608(fax) www.pewresearch.org A Fact Tank The Pew Research Center is a nonpartisan organization that provides information
CLACLS. A Profile of Latino Citizenship in the United States: Demographic, Educational and Economic Trends between 1990 and 2013
 CLACLS Center for Latin American, Caribbean & Latino Studies A Profile of Latino Citizenship in the United States: Demographic, Educational and Economic Trends between 1990 and 2013 Karen Okigbo Sociology
People. Population size and growth
 The social report monitors outcomes for the New Zealand population. This section provides background information on who those people are, and provides a context for the indicators that follow. People Population
MARRIAGE & PARENTHOOD
 CONTENTS OVERVIEW 3 KEY INDICATORS 4 OVERALL POPULATION 5 AGEING 8 MARRIAGE & PARENTHOOD 10 IMMIGRATION & CITIZENS BY DESCENT 14 1 ANNEX Overall Population Table 1: Total population 16 Table 2: Singapore
Illegal Immigration: How Should We Deal With It?
 Illegal Immigration: How Should We Deal With It? Polling Question 1: Providing routine healthcare services to illegal Immigrants 1. Is a moral/ethical responsibility 2. Legitimizes illegal behavior 3.
Chapter One: people & demographics
 Chapter One: people & demographics The composition of Alberta s population is the foundation for its post-secondary enrolment growth. The population s demographic profile determines the pressure points
Race, Ethnicity, and Economic Outcomes in New Mexico
 Race, Ethnicity, and Economic Outcomes in New Mexico Race, Ethnicity, and Economic Outcomes in New Mexico New Mexico Fiscal Policy Project A program of New Mexico Voices for Children May 2011 The New Mexico
OREGON OUTLOOK Sponsored by Population Research Center Portland Multnomah Progress Board Oregon Progress Board
 REGN TATE ERIE APRIL 003 PPULATIN REEARCH CENTER REGN s MAJR PPULATIN TREND This report reviews Population Growth Household Trends Household ize Families and Non-families Implications Future Reports Metropolitan
Dynamic Diversity: Projected Changes in U.S. Race and Ethnic Composition 1995 to December 1999
 Dynamic Diversity: Projected Changes in U.S. Race and Ethnic Composition 1995 to 2050 December 1999 DYNAMIC DIVERSITY: PROJECTED CHANGES IN U.S. RACE AND ETHNIC COMPOSITION 1995 TO 2050 The Minority Business
Chapter 7. Migration
 Chapter 7 Migration Chapter 7 Migration Americans have traditionally been highly higher levels of educational attainment than Figure 7-1. mobile, with nearly 1 in 7 people changing residence each year.
BLACK-WHITE BENCHMARKS FOR THE CITY OF PITTSBURGH
 BLACK-WHITE BENCHMARKS FOR THE CITY OF PITTSBURGH INTRODUCTION Ralph Bangs, Christine Anthou, Shannon Hughes, Chris Shorter University Center for Social and Urban Research University of Pittsburgh March
Tell us what you think. Provide feedback to help make American Community Survey data more useful for you.
 DP02 SELECTED SOCIAL CHARACTERISTICS IN THE UNITED STATES 2016 American Community Survey 1-Year Estimates Supporting documentation on code lists, subject definitions, data accuracy, and statistical testing
People. Population size and growth. Components of population change
 The social report monitors outcomes for the New Zealand population. This section contains background information on the size and characteristics of the population to provide a context for the indicators
The Inland Empire in Hans Johnson Joseph Hayes
 The Inland Empire in 2015 Hans Johnson Joseph Hayes Inland Empire: Tremendous Growth and Change Strong population growth Increasing diversity Sustained economic growth* 2 PPIC Developed 2015 Projections
Institute for Public Policy and Economic Analysis
 Institute for Public Policy and Economic Analysis The Institute for Public Policy and Economic Analysis at Eastern Washington University will convey university expertise and sponsor research in social,
Regional Data Snapshot
 Regional Data Snapshot Population, Economy & Education Features SET Civic Forum East Central NM, New Mexico Table of Contents 01 Overview 03 Human Capital 02 Demography 04 Labor Force 01 overview East
STATE OF THE STATE MSFCA Strategic Long Range Plan
 STATE OF THE STATE - 2016 MSFCA Strategic Long Range Plan Background Research What are the current hot issues affecting the Minnesota Fire Service in 2016. Includes numerous reports/references. See appendix
 Page 1 of 5 DP02 SELECTED SOCIAL CHARACTERISTICS IN THE UNITED STATES 2013 American Community Survey 1-Year Estimates Although the American Community Survey (ACS) produces population, demographic and housing
info Poverty in the San Diego Region SANDAG December 2013
 info December 2013 SANDAG Poverty in the San Diego Region Table of Contents Overview... 3 Background... 3 Federal Poverty Measurements... 4 Poverty Status for Individuals in the San Diego Region... 6 Demographic
Institute for Public Policy and Economic Analysis
 Institute for Public Policy and Economic Analysis The Institute for Public Policy and Economic Analysis at Eastern Washington University will convey university expertise and sponsor research in social,
The Brookings Institution Metropolitan Policy Program Amy Liu, Deputy Director
 The Brookings Institution Metropolitan Policy Program Amy Liu, Deputy Director Mind the Gap: Reducing Disparities to Improve Regional Competitiveness in the Twin Cities Forum on the Business Response to
Demographic, Economic, and Social Transformations in Brooklyn Community District 4: Bushwick,
 Demographic, Economic, and Social Transformations in Brooklyn Community District 4: Bushwick, 1990-2007 Astrid S. Rodríguez Ph.D. Candidate, Educational Psychology Center for Latin American, Caribbean
REGIONAL. San Joaquin County Population Projection
 Lodi 12 EBERHARDT SCHOOL OF BUSINESS Business Forecasting Center in partnership with San Joaquin Council of Governments 99 26 5 205 Tracy 4 Lathrop Stockton 120 Manteca Ripon Escalon REGIONAL analyst june
Regional Data Snapshot
 Regional Data Snapshot Population, Economy & Education Features SET Civic Forum Glacial Lakes Region, South Dakota Table of Contents 01 Overview 03 Human Capital 02 Demography 04 Labor Force 01 overview
California s Congressional District 37 Demographic Sketch
 4.02.12 California s Congressional District 37 Demographic Sketch MANUEL PASTOR JUSTIN SCOGGINS JARED SANCHEZ Purpose Demographic Sketch Understand the Congressional District s population and its unique
Extrapolated Versus Actual Rates of Violent Crime, California and the United States, from a 1992 Vantage Point
 Figure 2.1 Extrapolated Versus Actual Rates of Violent Crime, California and the United States, from a 1992 Vantage Point Incidence per 100,000 Population 1,800 1,600 1,400 1,200 1,000 800 600 400 200
Evaluating the Role of Immigration in U.S. Population Projections
 Evaluating the Role of Immigration in U.S. Population Projections Stephen Tordella, Decision Demographics Steven Camarota, Center for Immigration Studies Tom Godfrey, Decision Demographics Nancy Wemmerus
Demographic Data. Comprehensive Plan
 Comprehensive Plan 2010-2030 4 Demographic Data Population and demographics have changed over the past several decades in the City of Elwood. It is important to incorporate these shifts into the planning
Human Population Growth Through Time
 Human Population Growth Through Time Current world population: 7.35 Billion (Nov. 2016) http://www.worldometers.info/world-population/ 2012 7 billion 1999 13 years 12 years 1974 1927 1804 13 years 14 years
Interview dates: September 6 8, 2013 Number of interviews: 1,007
 AP Syria Survey A telephone survey of the American general population (ages 18+) Interview dates: September 6 8, 2013 Number of interviews: 1,007 Margin of error for the total sample: +/- 3.7 percentage
Changing Demographics & How They Affect Your Business, Today & Tomorrow
 Changing Demographics & How They Affect Your Business, Today & Tomorrow 5 Key Findings Diversity Rural to Urban Shifts Bright Flight The Changing Suburbs Young People Postponing Marriage 1 in 3 is not
BIG PICTURE: CHANGING POVERTY AND EMPLOYMENT OUTCOMES IN SEATTLE
 BIG PICTURE: CHANGING POVERTY AND EMPLOYMENT OUTCOMES IN SEATTLE January 218 Author: Bryce Jones Seattle Jobs Initiative TABLE OF CONTENTS Introduction 1 Executive Summary 2 Changes in Poverty and Deep
What Lies Ahead: Population, Household and Employment Forecasts to 2040 April Metropolitan Council Forecasts to 2040
 The Metropolitan Council forecasts population, households and employment for the sevencounty Minneapolis-St. Paul region with a 30-year time horizon. The Council will allocate this regional forecast to
Demographic, Economic and Social Transformations in Bronx Community District 4: High Bridge, Concourse and Mount Eden,
 Center for Latin American, Caribbean & Latino Studies Graduate Center City University of New York 365 Fifth Avenue Room 5419 New York, New York 10016 Demographic, Economic and Social Transformations in
Planning for the Silver Tsunami:
 Planning for the Silver Tsunami: The Shifting Age Profile of the Commonwealth and Its Implications for Workforce Development H e n r y Renski A NEW DEMOGRAPHIC MODEL PROJECTS A CONTINUING, LONG-TERM SLOWING
Labor Force Characteristics by Race and Ethnicity, 2015
 Cornell University ILR School DigitalCommons@ILR Federal Publications Key Workplace Documents 9-2016 Labor Force Characteristics by Race and Ethnicity, 2015 Bureau of Labor Statistics Follow this and additional
Rural Child Poverty across Immigrant Generations in New Destination States
 Rural Child Poverty across Immigrant Generations in New Destination States Brian Thiede, The Pennsylvania State University Leif Jensen, The Pennsylvania State University March 22, 2018 Rural Poverty Fifty
APPENDIX G DEMOGRAPHICS
 APPENDIX G DEMOGRAPHICS Analyzing current and past demographic data is an important step in defining future transportation needs for individuals living and working in the PPUATS Metropolitan Planning Area.
Youth at High Risk of Disconnection
 Youth at High Risk of Disconnection A data update of Michael Wald and Tia Martinez s Connected by 25: Improving the Life Chances of the Country s Most Vulnerable 14-24 Year Olds Prepared by Jacob Rosch,
Cultural Frames: An Analytical Model
 Figure 1.1 Cultural Frames: An Analytical Model Hyper-Selectivity/ Hypo-Selectivity Ethnic Capital Tangible and Intangible Resources Host Society Public Institutional Resources The Stereotype Promise/Threat
The Political Geography of Virginia and Florida: Bookends of the New South
 Table 1. Growth by Migration Components: and Florida, 2000 2007 Florida 2007 Population (000s) 7,712 18,251 Growth Rate* Total 8.5 13.7 Migration Rate* Domestic Migration 2.1 7.8 Immmigration 2.1 4.0 *
Contents. Acknowledgements...xii Leading facts and indicators...xiv Acronyms and abbreviations...xvi Map: Pacific region, Marshall Islands...
 Contents Acknowledgements...xii Leading facts and indicators...xiv Acronyms and abbreviations...xvi Map: Pacific region, Marshall Islands... xii CHAPTER 1: CENSUS ORGANIZATION AND OPERATIONS...1 CHAPTER
An Equity Profile of the Southeast Florida Region. Summary. Foreword
 An Equity Profile of the Southeast Florida Region PolicyLink and PERE An Equity Profile of the Southeast Florida Region Summary Communities of color are driving Southeast Florida s population growth, and
Georgia s Immigrants: Past, Present, and Future
 Georgia s Immigrants: Past, Present, and Future Douglas J. Krupka John V. Winters Fiscal Research Center Andrew Young School of Policy Studies Georgia State University Atlanta, GA FRC Report No. 175 April
Socio-Economic Profile
 LOCAL HEALTH AREA 7 - Socio-Economic Profile Powell River Comox Cumberland Denman Island Hornby Island Qualicum CENSUS POPULATION LAND AREA POPULATION DENSITY Number % of Region Sq. Km. % of Region Persons
Astrid S. Rodríguez Fellow, Center for Latin American, Caribbean & Latino Studies. Center for Latin American, Caribbean & Latino Studies
 Demographic, Economic, and Social Transformations in Bronx Community District 9: Parkchester, Unionport, Soundview, Castle Hill, and Clason Point, 1990-2006 Center for Latin American, Caribbean & Latino
Chapter 6: Women-Owned and Minority-Owned Businesses
 Chapter 6: Women-Owned and Minority-Owned Businesses 1 Learning Objectives To realize women-owned businesses have grown rapidly since 1980 as a result of many factors To understand why women-owned businesses
PROJECTING DIVERSITY: THE METHODS, RESULTS, ASSUMPTIONS AND LIMITATIONS OF THE U.S. CENSUS BUREAU S POPULATION PROJECTIONS
 PROJECTING DIVERSITY: THE METHODS, RESULTS, ASSUMPTIONS AND LIMITATIONS OF THE U.S. CENSUS BUREAU S POPULATION PROJECTIONS Howard Hogan, U.S. Census Bureau Jennifer M. Ortman, U.S. Census Bureau Sandra
Hispanic Health Insurance Rates Differ between Established and New Hispanic Destinations
 Population Trends in Post-Recession Rural America A Publication Series of the W3001 Research Project Hispanic Health Insurance Rates Differ between and New Hispanic s Brief No. 02-16 August 2016 Shannon
MAGNET Migration and Governance Network An initiative of the Swiss Development Cooperation
 International Labour Organization ILO Regional Office for the Arab States MAGNET Migration and Governance Network An initiative of the Swiss Development Cooperation The Kuwaiti Labour Market and Foreign
We know that the Latinx community still faces many challenges, in particular the unresolved immigration status of so many in our community.
 1 Ten years ago United Way issued a groundbreaking report on the state of the growing Latinx Community in Dane County. At that time Latinos were the fastest growing racial/ethnic group not only in Dane
Business Case for Diversity
 INCORPORATING Diversity Making the Business Case for Diversity By Kari Heistad afiz Adamjee doesn t look like a revolutionary trendsetter. He was born in Africa and raised in Pakistan before he came to
SOCIAL SECURITY NUMBER *last 4 digits*
 MSDE OFFICE USE ONLY Approved Disapproved APPLICATION FOR EMPLOYMENT Maryland State Department of Education Staff Recruitment Section 200 West Baltimore Street Baltimore MD 21201 410-333-3045 (TTY) 410-333-8950
Demographic, Economic, and Social Transformations in Queens Community District 3: East Elmhurst, Jackson Heights, and North Corona,
 Demographic, Economic, and Social Transformations in Queens Community District 3: East Elmhurst, Jackson Heights, and North Corona, 1990-2006 Astrid S. Rodríguez Fellow, Center for Latin American, Caribbean
Seattle Public Schools Enrollment and Immigration. Natasha M. Rivers, PhD. Table of Contents
 Seattle Public Schools Enrollment and Immigration Natasha M. Rivers, PhD Table of Contents 1. Introduction: What s been happening with Enrollment in Seattle Public Schools? p.2-3 2. Public School Enrollment
Extended Abstract. The Demographic Components of Growth and Diversity in New Hispanic Destinations
 Extended Abstract The Demographic Components of Growth and Diversity in New Hispanic Destinations Daniel T. Lichter Departments of Policy Analysis & Management and Sociology Cornell University Kenneth
Understanding Racial Inequity in Alachua County
 Understanding Racial Inequity in Alachua County (January, 2018) Hector H. Sandoval (BEBR) Department of Economics College of Liberal Arts and Sciences University of Florida Understanding Racial Inequity
The New U.S. Demographics
 The Brookings Institution Center on Urban and Metropolitan Policy The New U.S. Demographics Audrey Singer Funders Network on Population, Reproductive Health and Rights November 10, 2003 QUESTIONS How has
Goal 3: Promote Gender Equality and Empower Women
 98 Gender equality in primary school enrollment is high, with most economies having ratios of or more. This is also the case for gender equality in secondary school enrollment, but not so for tertiary
Hispanics. A People in Motion
 5 s A People in Motion The * population of the United States is growing fast and changing fast. The places Latinos live, the jobs they hold, the schooling they complete, the languages they speak, even
Changing Demographics & How They Affect Your Business,
 Changing Demographics & How They Affect Your Business, Today & Tomorrow We ve Changed No Longer a Melting Pot, but a Salad Bowl OLD NEW Diversity Rural to Urban Shifts Bright Flight Minorities iti Moving
Social and Demographic Trends in Burnaby and Neighbouring Communities 1981 to 2006
 Social and Demographic Trends in and Neighbouring Communities 1981 to 2006 October 2009 Table of Contents October 2009 1 Introduction... 2 2 Population... 3 Population Growth... 3 Age Structure... 4 3
Summary of the U.S. Census Bureau s 2018 State-Level Population Estimate for Massachusetts
 Summary of the U.S. Census Bureau s 2018 State-Level Population Estimate for Massachusetts Prepared by: Population Estimates Program For Release December 19, 2018 On December 19, 2018, the U.S. Census
Last Name First Name M.I. Name You Prefer. City State Zip Address. Daytime Phone Evening Phone Best Time to Call. City State If yes, where?
 GENERAL INFORMATION Last First M.I. You Prefer Mailing Address City State Zip County If less than a year, previous address How long have you resided in the county? City State Zip time Phone Phone Best
The Changing Face of Labor,
 The Changing Face of Labor, 1983-28 John Schmitt and Kris Warner November 29 Center for Economic and Policy Research 1611 Connecticut Avenue, NW, Suite 4 Washington, D.C. 29 22-293-538 www.cepr.net CEPR
Facts & Figures in this issue: income employment growth trends baby boomers millennials immigration
 Facts & Figures in this issue: income employment growth trends baby boomers millennials immigration 2017 Baby Boomers The term baby boomer refers to individuals born in the United States between 1946 and
Racial Inequities in Montgomery County
 W A S H I N G T O N A R E A R E S E A R C H I N I T I A T I V E Racial Inequities in Montgomery County Leah Hendey and Lily Posey December 2017 Montgomery County, Maryland, faces a challenge in overcoming
THE MEASURE OF AMERICA
 THE MEASURE OF AMERICA American Human Development Report 2008 2009 xvii Executive Summary American history is in part a story of expanding opportunity to ever-greater numbers of citizens. Practical policies
The Status of Women in Ventura and Santa Barbara Counties
 The Status of Women in Ventura and Santa Barbara Counties March 3, 2010 Foreword March, 2010 One hundred and fifty-three years ago, thousands of women garment workers marched to change their poverty level
U.S. immigrant population continues to grow
 U.S. immigrant population continues to grow Millions 45 40 35 30 25 20 15 10 5 0 Source: PEW Research Center. All foreign-born immigrants Unauthorized immigrants 40.4 38.0 31.1 12.0 11.1 8.4 2000 2007
Share of Children of Immigrants Ages Five to Seventeen, by State, Share of Children of Immigrants Ages Five to Seventeen, by State, 2008
 Figure 1.1. Share of Children of Immigrants Ages Five to Seventeen, by State, 1990 and 2008 Share of Children of Immigrants Ages Five to Seventeen, by State, 1990 Less than 10 percent 10 to 19 percent
College Assistance Migrant Program CAMP
 College Assistance Migrant Program CAMP Application Form The College Assistance Migrant Program (CAMP) is a federally funded program designed to support students from migrant and seasonal farm worker backgrounds
Pacific Economic Trends and Snapshot
 Pacific Economic Trends and Snapshot September 213 Report to Ministry of Business, Innovation, and Employment Contents 1. Key points... 3 2. Demographic trends... 5 3. Qualifications and skills... 7 4.
NEW FACULTY ORIENTATION What We Know About the Students We Serve
 NEW FACULTY ORIENTATION What We Know About the Students We Serve Presented by: Jim Fillpot Dean, Institutional Research & Resource Development 1 NEW FACULTY ORIENTATION What Do We Know About: Ø Our Service
Post-Secondary Education, Training and Labour September Profile of the New Brunswick Labour Force
 Post-Secondary Education, Training and Labour September 2018 Profile of the New Brunswick Labour Force Contents Population Trends... 2 Key Labour Force Statistics... 5 New Brunswick Overview... 5 Sub-Regional
Our Shared Future: U N D E R S T A N D I N G B O S T O N. #SharedFuture. Charting a Path for Immigrant Advancement in a New Political Landscape
 U N D E R S T A N D I N G B O S T O N Our Shared Future: Charting a Path for Immigrant Advancement in a New Political Landscape Wednesday, April 19 th, 2017 8:30-10:30 a.m. #SharedFuture U N D E R S T
Population Estimates in the United States
 Population Estimates in the United States Victoria Velkoff U.S. Census Bureau Seminar on New Directions in Social Statistics February 22, 2008 Outline What estimates we produce and why Basic methodology