Disruptive Demographics: Implications for the Accounting Profession James H. Johnson, Jr. Distinguished Professor of Entrepreneurship & Strategy,
|
|
|
- Benedict Allison
- 6 years ago
- Views:
Transcription

1 Disruptive Demographics: Implications for the Accounting Profession James H. Johnson, Jr. Distinguished Professor of Entrepreneurship & Strategy, University of North Carolina Kenan-Flagler Business School
2 Disruptive Demographics: Implications for the Accounting Profession James H. Johnson, Jr., Ph.D. Frank Hawkins Kenan Institute of Private Enterprise Kenan-Flagler Business School University of North Carolina at Chapel Hill October 2015
3 OVERVIEW Demographic Trends Challenges & Opportunities Discussion 3
4 what CENSUS 2010 will REVEAL October
5
6 6 DISRUPTIVE TRENDS The South Rises Again The Browning of America Marrying Out is In The Silver Tsunami is About Hit The End of Men? Cooling Water from Grandma s Well and Grandpa s Too! 6


7 The South Continues To Rise...Again! 7
8 South s Share of U.S. Net Population Growth, Years Selected Years, U.S. Absolute Population Change South s Absolute Population Change South s Share of Change ,974,129 8,468,303 27% ,123,138 9,339,455 33% ,886,128 15,598,279 30% ,497,947 22,650,563 50% ,035,665 29,104,814 49%
9 U.S. POPULATION CHANGE BY REGION, Region Population Absolute Population Change, Percent Population Change, U.S. 309,050,816 26,884, % Northeast 55,417,311 1,753, % Midwest 66,972,887 2,480, % South 114,555,744 14,318, % West 72,256,183 8,774, %
10 SHARES OF NET POPULATION GROWTH BY REGION, Region Absolute Population Change Percent of Total UNITED STATES 26,884, NORTHEAST 1,753, MIDWEST 2,480, SOUTH 14,318, WEST 8,774,
11 NET MIGRATION TRENDS, Northeast Midwest South West Total -1,032-2,008 +2, Black Hispanic Elderly Foreign born = Net Import = Net Export 11
12 GROSS AND NET MIGRATION FOR THE SOUTH, The Region Domestic Foreign Years In Out Net In Out Net ,125,096 3,470, , , , , ,874,414 3,477, , , , ,300 Florida Domestic Foreign Years In Out Net In Out Net , , ,002 41,745 24,108 17, , ,087-13,156 33,095 32,094 1,001
13 State Share of South s Net Growth, Region/State Absolute Change State s Share The South 14,318, % Texas 4,293, % Florida 2,818, % Georgia 1,501, % North Carolina 1,486, % Other Southern 4,218, % States 13
14 U.S. POPULATION CHANGE BY REGION, Region Population Absolute Population Change, Percent Population Change, U.S. 318,857,056 10,098, % Northeast 56,152, , % Midwest 67,745, , % South 119,771,934 5,208, % West 75,187,681 3,240, %
15 SHARES OF NET POPULATION GROWTH BY REGION, Region Absolute Population Change Percent of Total UNITED STATES 10,098, NORTHEAST 833, MIDWEST 815, SOUTH 5,208, WEST 3,240,
16 STATE SHARES OF SOUTH S NET GROWTH, Region/State Absolute Change State s Share The South 5,208, % Texas 1,810, % Florida 1,088, % Georgia 408, % North Carolina 408, % Virginia 325, % Other Southern States 1,167, %
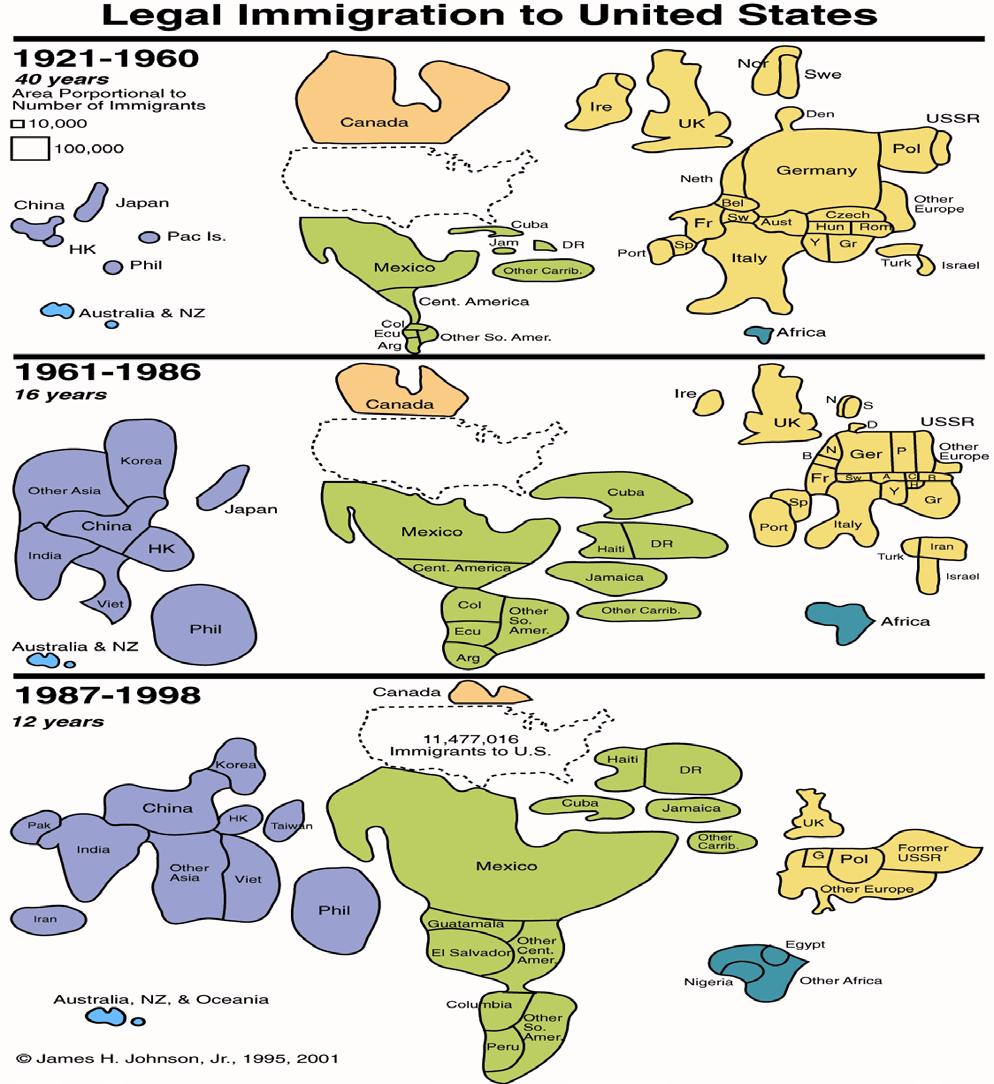
17 THE BROWNING OF AMERICA 17


18
19 The Numbers Legal Immigrants Year Annual Flow , , , , ,137, ,067,000 Refugees, Parolees, Asylees Year Annual Flow , , , , ,500
20 The Numbers Cont d Illegal Immigrants 300,000 to 400,000 annually over the past two decades Three million granted amnesty in million illegal immigrants remained after 1986 reforms October 1996: INS estimated there were 5 million illegal immigrants in U.S. Since August 2005: Estimates of illegal population have ranged between 7 million and 15 million Today: An estimated 11.5 million unauthorized immigrants reside in U.S.
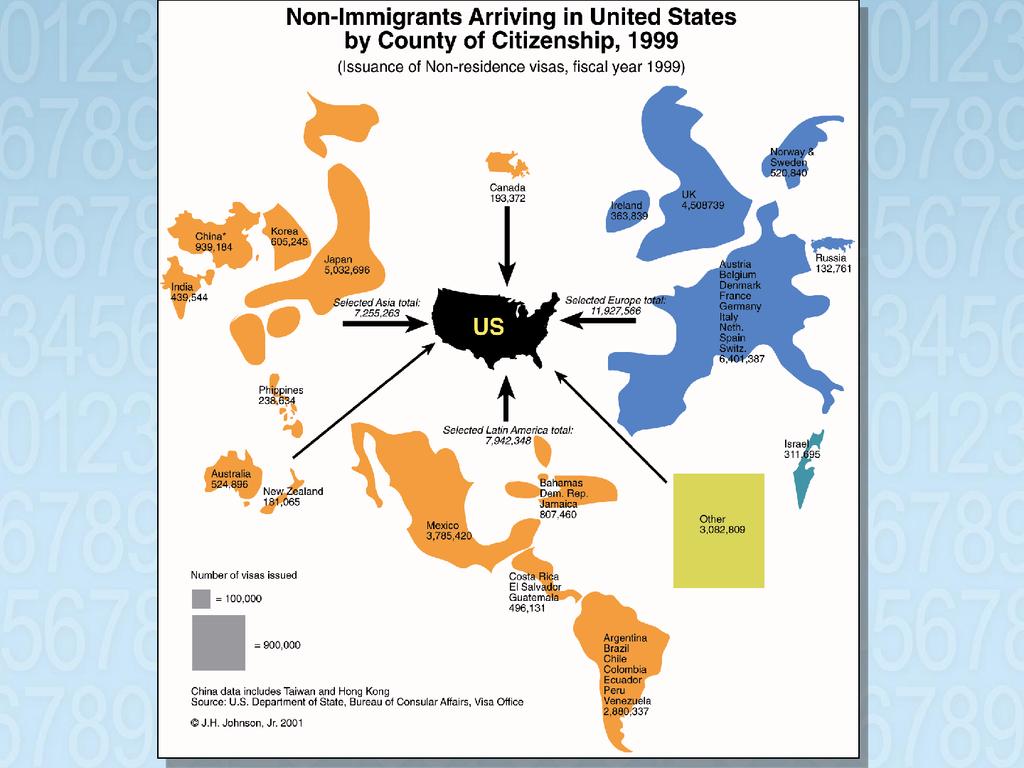
21 NON-IMMIGRANTS ADMITTED TO UNITED STATES, SELECTED YEARS, Year All Classes Exchange Visitors Academic & Vocational Students ,756, ,023 (1%) 271,861 (2%) ,539, ,213 (1%) 285,496 (3%) ,574, ,644 (1%) 355,207 (2%) ,640, ,364 (1%) 395,480 (2%) ,690, ,743 (1%) 699,953 (2%) ,824, ,435 (1%) 741,921 (2%) ,907, ,176 (1%) 687,506 (2%) ,381, ,138 (1%) 917,373 (2%) ,082, , 931 (1%) 1,702,730 (3%)
22
23 U.S. Immigrant Population, Number of Immigrants (in millions) Year
24 U.S. Foreign Born Population by Race/Ethnicity, 2011 Race/Ethnicity Foreign Population Share of Total (%) Total 40,381, Hispanic 18,788, White Alone, not Hispanic Black Alone, not Hispanic Asian Alone, not Hispanic Other Alone, not Hispanic 7,608, ,130, ,988, ,
25 U.S. POPULATION CHANGE BY RACE & Race ETHNICITY, Population Absolute Change Percentage Change Total 308,745,538 27,323, % Non-Hispanic 258,267,944 12,151, % White 196,817,552 2,264, % Black 37,685,848 3,738, % AI/AN 2,247, , % Asian 14,465,124 4,341, % NH/PI 481, , % 2 or More Races 5,966,481 1,364, % Hispanic 50,477,594 15,171, %

26 NON-WHITE AND HISPANIC SHARES OF POPULATION GROWTH, Area Absolute Population Change Non-White Share Hispanic Share US 27,323, South 14,318, Texas 4,293, Florida 2,818, Georgia 1,501, NC 1,486,
27 MEDIAN AGE OF U.S. POPULATION BY RACE, HISPANIC ORIGIN & GENDER, 2009 Race Total Male Female United States White Alone White, Non-Hispanic Black Alone AI/AN Alone Asian Alone NH/PI Alone Two or More Races Hispanic
28 TOTAL FERTILITY RATES FOR U.S. WOMEN BY RACE/ETHNICITY, 2012 Race/Ethnicity Total Fertility Rate All Races 1.88 Hispanic 2.18 Non-Hispanic White 1.76 Blacks 1.90 Asian 1.77 Native American 1.35
29 RELATIVE DISTRIBUTION OF U.S. BIRTHS BY RACE / ETHNICITY Race/Ethnicity White 66% 50% 49.6% Blacks 17% 16% 15.0% Hispanics 15% 26% 26.0% Other 2% 8% 9.4% Source: Johnson and Lichter (2010); Tavernise (2011).
30 RELATIVE DISTRIBUTION OF U.S. POPULATION BY RACE / ETHNICITY Race/Ethnicity White 67% 47% Blacks 12.8% 13% Hispanics 14% 29% Asian 5% 9% Source: Pew Research Center, 2008 *projected. 30


31 Marrying Out is In September
32 INTERMARRIAGE TREND, % Married Someone of a Different Race/Ethnicity 32


33 EDUCATION & INTERMARRIAGE % of Newlyweds Who Married Someone of a Different Race/Ethnicity,

34 INTERMARRIAGE TYPES Newly Married Couples in

35 INTERMARRIAGE RATES BY RACE & ETHNICITY % of Newlyweds Who Married Someone of a Different Race/Ethnicity,

36 THE SILVER TSUNAMI 36

37 U.S. POPULATION CHANGE BY AGE, Age 2009 Absolute Change Percentage Change <25 104,960,250 5,258, ,096,278-1,898, ,379,439 16,977, ,570,590 4,496, TOTAL 307,006,550 24,834,
38 U.S. POPULATION TURNING 50, 55, 62, AND 65 YEARS OF AGE, ( ) Age 50 Age 55 Age 62 Age 65 Average Number/Day 12,344 11,541 9,221 8,032 Average Number/Minute


39 THE GREYING OF AMERICA U.S. Census Projections 39
40 ABSOLUTE AND PERCENT CHANGE IN U.S. POPULATION BY AGE Age % Change Total
41 OLDER WORKERS IN U.S. WORKFORCE YEAR Age 65 or Older Age 75 or Older % 4.7% % 7.3% September

42 DEPENDENCY RATIOS IN THE AMERICAN SOUTH Source: Census 2010

43 The End of Men? 43


44 FEMALE WORKFORCE REPRESENTATION % Female 44
45 The Plight of Men Today, three times as many men of working age do not work at all compared to Selective male withdrawal from labor market rising non-employment due largely to skills mismatches, disabilities & incarceration. The percentage of prime-aged men receiving disability insurance doubled between 1970 (2.4%) and 2009 (4.8%). Since 1969 median wage of the American male has declined by almost $13,000 after accounting for inflation. After peaking in 1977, male college completion rates have barely changed over the past 35 years.
46 COLLEGE CLASS OF 2010 DEGREE MALE FEMALE DIFFERENCE Associate s 293, , ,000 Bachelor s 702, , ,000 Master s 257, , ,000 Professional 46,800 46, Doctor s 31,500 32,900 1,400 TOTAL 1,330,300 1,902, ,000 46

47 September
48 Jobs Lost/Gained by Gender During 2007 (Q4) 2009 (Q3) Recession Industry Women Men Construction -106,000-1,300,000 Manufacturing -106,000-1,900,000 Healthcare +451, ,100 Government +176, ,000 Total -1,700,000-4,700,000 48
49 Cooling Waters From Grandma s Well And Grandpa s Too! September
50 Children Living in Non-Grandparent and Grandparent Households, Household Type Absolute Number 2010 Absolute Change All 74,718 2, No Grandparents 67, Both Grandparents Grandmother Only 2, , Grandfather Only Percent Change
51 Children Living in Non-Grandparent and Grandparent-Headed Households by Presence of Parents, 2010 Household Type All Children (in thousands) Living with Both Parents Living with Mother Only Living with Father Only All 74, % 23.1% 3.4% 4.0% No Grandparents Both Grandparents Grandmother Only Grandfather Only 67, % 21.2% 3.3% 2.1% Living with Neither parent 2, % 40.6% 5.2% 36.1% 1, % 48.4% 4.5% 33.2% % 45.9% 4.4% 23.6% 51

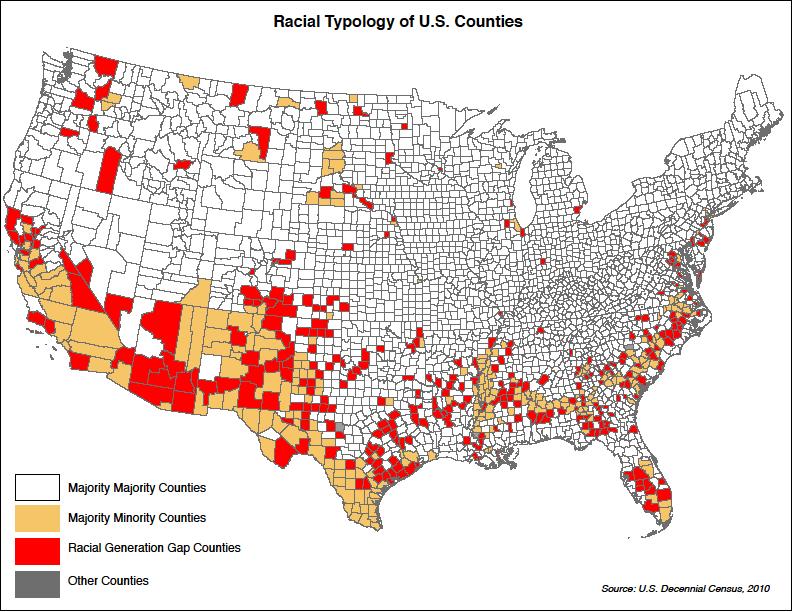
52 DIVERSITY RULES...but Challenges Abound 52
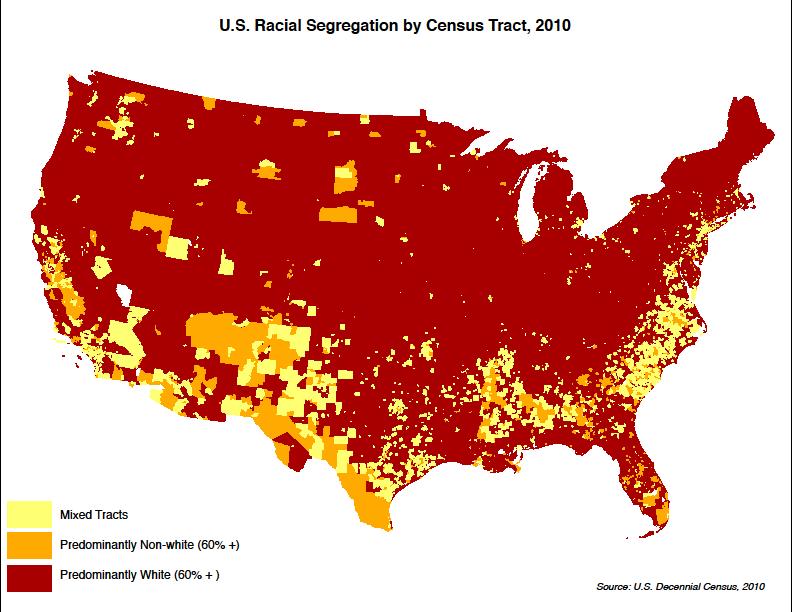
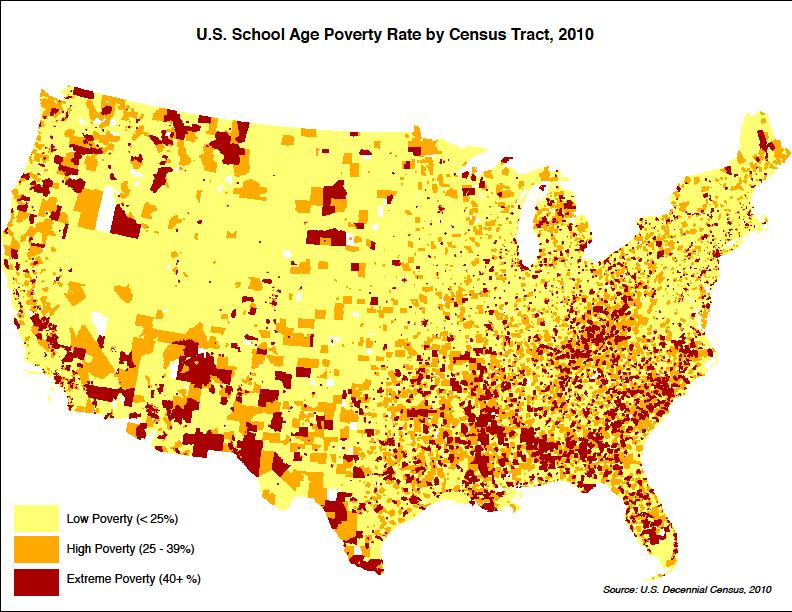
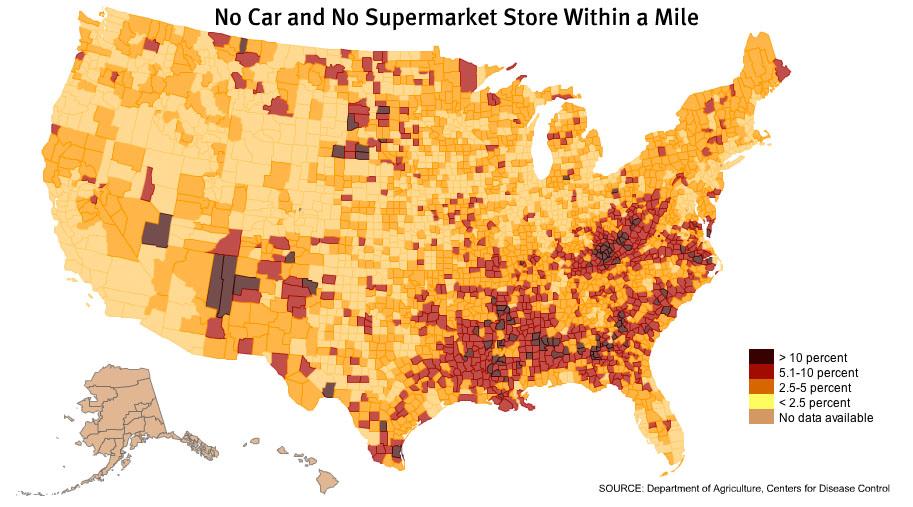
53 The Triple Whammy of Geographical Disadvantage The Human Capital Challenge
54
55
56
57

58 Education is Necessary...but insufficient 58
59 AVERAGE SHARE OF LONG-TERM UNEMPLOYMENT BY EDUCATION Education % Change Less Than High School 24.7% 23.7% -1.0 High School Graduate 40.6% 34.3% -6.3 Some College 20.7% 24.4% 3.7 Bachelor s Degree or More 14.0% 17.6% 3.6 September
60 AVERAGE SHARE OF LONG-TERM UNEMPLOYMENT BY OCCUPATION Occupation % Change Blue Collar 40.5% 31.6% -8.9 Service Occupation 14.3% 16.7% 2.4 White Collar 38.5% 44.4%
61 THE LONG-TERM UNEMPLOYED, 2009 PROFESSION % OF ALL JOBLESS WORKERS Architecture & Engineering 41.2 Management 39.0 Community & Social Services Occupations 36.1 Installation, Maintenance & Repair Work 34.9 Production Occupations
62 THE COMPETITIVE TOOL KIT Analytical Reasoning Entrepreneurial Acumen Contextual Intelligence Soft Skills/Cultural Elasticity Agility and Flexibility
63 Implications for Workforce Planning and Development Managing transition from the graying to the browning of America. Competition for talent will be fierce and global. Successful recruitment and retention will hinge on your ability to effectively manage the full nexus of diversity issues. 63
64 Diversity Challenges and Opportunities in the Accounting Profession Workforce Changing Rapidly Lucrative Ethnic Markets for Services Glass/Bamboo Ceiling Promotion and Retention of Women & Minorities High Turnover Sexual Harassment Succession Planning 64

65 Iceberg Model of Diversity Visible Diversity Traits If all I know about you is what I can see Race/Skin Color Gender Visible Disability Age Group Physical Attributes Ethnicity Invisible Diversity Traits Level in Organization Culture Marital Status Values Education MBTI Religion/Religious Experiences International Cultural Immersion Communication Style Conflict Style Beliefs Teaching Style Recreational Habits IQ Learning Styles Academic Discipline Literacy Sexual Orientation Personality Style Orientation to Time Family Relationships Orientation to Tasks Physical Abilities/Qualities EQ Military Experience Socioeconomic Status Geographic Background Work Background Smoker/Non-Smoker Parental Status Native Born/Non-Native Born Political Ideology Thinking Style
66 THE END
Disruptive Demographics: Implications for North Carolina s Health and Competitiveness
 Disruptive Demographics: Implications for North Carolina s Health and Competitiveness James H. Johnson, Jr. Frank Hawkins Kenan Institute of Private Enterprise Kenan-Flagler Business School University
OVERVIEW. Demographic Trends. Challenges & Opportunities. Discussion
 People on the Move James H. Johnson, Jr. Frank Hawkins Kenan Institute of Private Enterprise Kenan-Flagler Business School University of North Carolina at Chapel Hill January 2017 OVERVIEW Demographic
Disruptive Demographics and the Triple Whammy of Geographic Disadvantage
 Disruptive Demographics and the Triple Whammy of Geographic Disadvantage James H. Johnson, Jr. Frank Hawkins Kenan Institute of Private Enterprise Kenan-Flagler Business School University of North Carolina
Six Disruptive Demographics That Will Change the U.S. Forever
 Six Disruptive Demographics That Will Change the U.S. Forever October 2017 OVERVIEW Demographic Trends Challenges & Opportunities Discussion October 2017 2 what CENSUS 2010 will REVEAL October 2017 October
Six Disruptive Demographics That Will Change the U.S. & South Carolina Forever
 Six Disruptive Demographics That Will Change the U.S. & South Carolina Forever James H. Johnson, Jr. Frank Hawkins Kenan Institute of Private Enterprise Kenan-Flagler Business School University of North
Disruptive Demographics and North Carolina s Global Competitiveness Challenge
 Disruptive Demographics and North Carolina s Global Competitiveness Challenge James H. Johnson, Jr. Frank Hawkins Kenan Institute of Private Enterprise Kenan-Flagler Business School University of North
Disruptive Demographics and the Triple Whammy of Geographic Disadvantage for America s Youth
 Disruptive Demographics and the Triple Whammy of Geographic Disadvantage for America s Youth James H. Johnson, Jr. Frank Hawkins Kenan Institute of Private Enterprise Kenan-Flagler Business School University
Disruptive Demographics: Implications for Higher Education Institutions
 Disruptive Demographics: Implications for Higher Education Institutions James H. Johnson, Jr. Frank Hawkins Kenan Ins
Six Disruptive Demographics That Will Change the U.S. Forever
 Six Disruptive Demographics That Will Change the U.S. Forever James H. Johnson, Jr. Frank Hawkins Kenan Institute of Private Enterprise Kenan-Flagler Business School University of North Carolina at Chapel
Disruptive Demographics: Implications for Workforce Planning and Development
 Disruptive Demographics: Implications for Workforce Planning and Development James H. Johnson, Jr. Ph.D. William Rand Kenan, Jr. Distinguished Professor of Entrepreneurship and Strategy Kenan-Flagler Business
People on the Move: Implications for Career Education
 People on the Move: Implications for Career Education James H. Johnson, Jr. Ph.D. William Rand Kenan, Jr. Distinguished Professor of Management Kenan-Flagler Business School Director, Urban Investment
What are the major changes you are seeing in your community?
 Court Trends, Changing Times in North Carolina, and Public Courts- the World Courts Work in Willow Jacobson, What are the major changes you are seeing in your community? Six Disruptive Trends The South
Pulling Open the Sticky Door
 Pulling Open the Sticky Door Social Mobility among Latinos in Nebraska Lissette Aliaga-Linares Social Demographer Office of Latino/Latin American Studies (OLLAS) University of Nebraska at Omaha Overview
Immigrants are playing an increasingly
 Trends in the Low-Wage Immigrant Labor Force, 2000 2005 THE URBAN INSTITUTE March 2007 Randy Capps, Karina Fortuny The Urban Institute Immigrants are playing an increasingly important role in the U.S.
1615 L Street, NW, Suite 700 Washington, DC (main) (fax)
 (fax)") 1615 L Street, NW, Suite 700 Washington, DC 20036-5631 202-419-3600(main) 202-419-3608(fax) www.pewresearch.org A Fact Tank The Pew Research Center is a nonpartisan organization that provides information
1615 L Street, NW, Suite 700 Washington, DC 20036-5631 202-419-3600(main) 202-419-3608(fax) www.pewresearch.org A Fact Tank The Pew Research Center is a nonpartisan organization that provides information
The EEO Tabulation: Measuring Diversity in the Workplace ACS Data Users Conference May 29, 2014
 The EEO Tabulation: Measuring Diversity in the Workplace ACS Data Users Conference May 29, 2014 Ana J. Montalvo Industry and Occupation Statistics Branch Social, Economic, and Housing Statistics Division
Rural America At A Glance
 Rural America At A Glance 7 Edition Between July 5 and July 6, the population of nonmetro America grew.6 percent. Net domestic migration from metro areas accounted for nearly half of this growth. Gains
Demographic Changes, Health Disparities, and Tuberculosis
 Demographic Changes, Health Disparities, and Tuberculosis Joan M. Mangan, PhD, MST October 22, 2015 Delivering Culturally Competent Patient Education and Care to Tuberculosis Program Clients Austin, TX
Cultural Frames: An Analytical Model
 Figure 1.1 Cultural Frames: An Analytical Model Hyper-Selectivity/ Hypo-Selectivity Ethnic Capital Tangible and Intangible Resources Host Society Public Institutional Resources The Stereotype Promise/Threat
KENAN INSTITUTE WHITE PAPER
 KENAN INSTITUTE WHITE PAPER JANUARY 1, 2018 LEVERAGING NORTH CAROLINA S MIGRATION DIVIDEND UISC01201801 James H. Johnson, Jr., Ph.D Allan M. Parnell, Ph.D Frank Hawkins Kenan Institute of Private Enterprise
Indian Migration to the Global North in the Americas: The United States
 Chapter 1 Indian Migration to the Global North in the Americas: The United States The multicultural, multiracial and diverse character of North American society reflects the consequences of significant
CLACLS. A Profile of Latino Citizenship in the United States: Demographic, Educational and Economic Trends between 1990 and 2013
 CLACLS Center for Latin American, Caribbean & Latino Studies A Profile of Latino Citizenship in the United States: Demographic, Educational and Economic Trends between 1990 and 2013 Karen Okigbo Sociology
Understanding the Immigrant Experience Lessons and themes for economic opportunity. Owen J. Furuseth and Laura Simmons UNC Charlotte Urban Institute
 Understanding the Immigrant Experience Lessons and themes for economic opportunity Owen J. Furuseth and Laura Simmons UNC Charlotte Urban Institute Charlotte-Mecklenburg Opportunity Task Force March 10,
Demographic, Economic, and Social Transformations in Brooklyn Community District 4: Bushwick,
 Demographic, Economic, and Social Transformations in Brooklyn Community District 4: Bushwick, 1990-2007 Astrid S. Rodríguez Ph.D. Candidate, Educational Psychology Center for Latin American, Caribbean
BLACK-WHITE BENCHMARKS FOR THE CITY OF PITTSBURGH
 BLACK-WHITE BENCHMARKS FOR THE CITY OF PITTSBURGH INTRODUCTION Ralph Bangs, Christine Anthou, Shannon Hughes, Chris Shorter University Center for Social and Urban Research University of Pittsburgh March
Demographic Data. Comprehensive Plan
 Comprehensive Plan 2010-2030 4 Demographic Data Population and demographics have changed over the past several decades in the City of Elwood. It is important to incorporate these shifts into the planning
Demographic Change How the US is Coping with Aging, Immigration, and Other Challenges William H. Frey
 Demographic Change How the US is Coping with Aging, Immigration, and Other Challenges William H. Frey Brookings Institution University of Michigan www.frey-demographer.org US: Total and Age 65+ Growth,
Peruvians in the United States
 Peruvians in the United States 1980 2008 Center for Latin American, Caribbean & Latino Studies Graduate Center City University of New York 365 Fifth Avenue Room 5419 New York, New York 10016 212-817-8438
SECTION 1. Demographic and Economic Profiles of California s Population
 SECTION 1 Demographic and Economic Profiles of s Population s population has special characteristics compared to the United States as a whole. Section 1 presents data on the size of the populations of
info Poverty in the San Diego Region SANDAG December 2013
 info December 2013 SANDAG Poverty in the San Diego Region Table of Contents Overview... 3 Background... 3 Federal Poverty Measurements... 4 Poverty Status for Individuals in the San Diego Region... 6 Demographic
Utah s Demographic Transformation
 Utah's Demographic Transformation: Implications for Education and Workforce 27 Council of Councils Southern Utah University Cedar City, Utah October 11, 27 Pamela S. Perlich, Ph.D. Senior Research Economist
Le Sueur County Demographic & Economic Profile Prepared on 7/12/2018
 Le Sueur County Demographic & Economic Profile Prepared on 7/12/2018 Prepared by: Mark Schultz Regional Labor Market Analyst Southeast and South Central Minnesota Minnesota Department of Employment and
Illegal Immigration: How Should We Deal With It?
 Illegal Immigration: How Should We Deal With It? Polling Question 1: Providing routine healthcare services to illegal Immigrants 1. Is a moral/ethical responsibility 2. Legitimizes illegal behavior 3.
Brazilians. in Boston
 Brazilians in Boston The Dewey Square mural (2012), by the Brazilian artist duo Os Gémeos (twins Otávio and Gustavo Pandolfo), spray painted on a 25-metre wide wall on the occasion of their exhibition
Human Resources in the 1990s
 CHAPTER 5 Human Resources in the 1990s THE SUSTAINED ECONOMIC EXPANSION of the 1980s has produced remarkable growth in employment and increased economic opportunity. As the Nation looks ahead to the 1990s,
Astrid S. Rodríguez Fellow, Center for Latin American, Caribbean & Latino Studies. Center for Latin American, Caribbean & Latino Studies
 Demographic, Economic, and Social Transformations in Bronx Community District 9: Parkchester, Unionport, Soundview, Castle Hill, and Clason Point, 1990-2006 Center for Latin American, Caribbean & Latino
STATEMENT OF PATRICIA A. BUCKLEY, PH.D. SENIOR ECONOMIC ADVISOR U.S
 STATEMENT OF PATRICIA A. BUCKLEY, PH.D. SENIOR ECONOMIC ADVISOR U.S. DEPARTMENT OF COMMERCE BEFORE THE HOUSE JUDICIARY SUBCOMMITTEE ON IMMIGRATION, CITIZENSHIP, REFUGEES, BORDER SECURITY AND INTERNATIONAL
Immigration Policy Brief August 2006
 Immigration Policy Brief August 2006 Last updated August 16, 2006 The Growth and Reach of Immigration New Census Bureau Data Underscore Importance of Immigrants in the U.S. Labor Force Introduction: by
Brockton and Abington
 s in Massachusetts Selected Areas Brockton and Abington by Phillip Granberry, PhD and Sarah Rustan September 17, 2010 INTRODUCTION This report provides a descriptive snapshot of selected economic, social,
Demographic, Economic, and Social Transformations in Queens Community District 3: East Elmhurst, Jackson Heights, and North Corona,
 Demographic, Economic, and Social Transformations in Queens Community District 3: East Elmhurst, Jackson Heights, and North Corona, 1990-2006 Astrid S. Rodríguez Fellow, Center for Latin American, Caribbean
Chapter One: people & demographics
 Chapter One: people & demographics The composition of Alberta s population is the foundation for its post-secondary enrolment growth. The population s demographic profile determines the pressure points
In class, we have framed poverty in four different ways: poverty in terms of
 Sandra Yu In class, we have framed poverty in four different ways: poverty in terms of deviance, dependence, economic growth and capability, and political disenfranchisement. In this paper, I will focus
California s Congressional District 37 Demographic Sketch
 4.02.12 California s Congressional District 37 Demographic Sketch MANUEL PASTOR JUSTIN SCOGGINS JARED SANCHEZ Purpose Demographic Sketch Understand the Congressional District s population and its unique
Hispanic Employment in Construction
 Hispanic Employment in Construction Published by the CPWR Data Center The recent economic downturn affected the entire U.S. construction industry. To better understand how Hispanic construction workers
New Americans in Houston
 New Americans in Houston A Snapshot of the Demographic and Economic Contributions of Immigrants in the Metro Area POPULATION 6.8M.6M Total population in 06 Immigrant population.% Immigrant share of the
Labor Force Characteristics by Race and Ethnicity, 2015
 Cornell University ILR School DigitalCommons@ILR Federal Publications Key Workplace Documents 9-2016 Labor Force Characteristics by Race and Ethnicity, 2015 Bureau of Labor Statistics Follow this and additional
Latinos in Massachusetts Selected Areas: Framingham
 University of Massachusetts Boston ScholarWorks at UMass Boston Gastón Institute Publications Gastón Institute for Latino Community Development and Public Policy Publications 9-17-2010 Latinos in Massachusetts
Institute for Public Policy and Economic Analysis
 Institute for Public Policy and Economic Analysis The Institute for Public Policy and Economic Analysis at Eastern Washington University will convey university expertise and sponsor research in social,
Demographic, Economic and Social Transformations in Bronx Community District 4: High Bridge, Concourse and Mount Eden,
 Center for Latin American, Caribbean & Latino Studies Graduate Center City University of New York 365 Fifth Avenue Room 5419 New York, New York 10016 Demographic, Economic and Social Transformations in
Extrapolated Versus Actual Rates of Violent Crime, California and the United States, from a 1992 Vantage Point
 Figure 2.1 Extrapolated Versus Actual Rates of Violent Crime, California and the United States, from a 1992 Vantage Point Incidence per 100,000 Population 1,800 1,600 1,400 1,200 1,000 800 600 400 200
Mexicans in New York City, : A Visual Data Base
 Mexicans in New York City, 1990 2009: A Visual Data Base Center for Latin American, Caribbean & Latino Studies Graduate Center City University of New York 365 Fifth Avenue Room 5419 New York, New York
Backgrounder. This report finds that immigrants have been hit somewhat harder by the current recession than have nativeborn
 Backgrounder Center for Immigration Studies May 2009 Trends in Immigrant and Native Employment By Steven A. Camarota and Karen Jensenius This report finds that immigrants have been hit somewhat harder
Pacific Economic Trends and Snapshot
 Pacific Economic Trends and Snapshot September 213 Report to Ministry of Business, Innovation, and Employment Contents 1. Key points... 3 2. Demographic trends... 5 3. Qualifications and skills... 7 4.
Hispanic Health Insurance Rates Differ between Established and New Hispanic Destinations
 Population Trends in Post-Recession Rural America A Publication Series of the W3001 Research Project Hispanic Health Insurance Rates Differ between and New Hispanic s Brief No. 02-16 August 2016 Shannon
Regional Data Snapshot
 Regional Data Snapshot Population, Economy & Education Features SET Civic Forum Uwharrie Region, NC Table of Contents 01 Overview 03 Human Capital 02 Demography 04 Labor Force 01 overview Uwharrie Region,
STATE OF THE STATE MSFCA Strategic Long Range Plan
 STATE OF THE STATE - 2016 MSFCA Strategic Long Range Plan Background Research What are the current hot issues affecting the Minnesota Fire Service in 2016. Includes numerous reports/references. See appendix
Race, Ethnicity, and Economic Outcomes in New Mexico
 Race, Ethnicity, and Economic Outcomes in New Mexico Race, Ethnicity, and Economic Outcomes in New Mexico New Mexico Fiscal Policy Project A program of New Mexico Voices for Children May 2011 The New Mexico
Republic of Korea. (19 session)
") Republic of Korea th (19 session) 347.The Committee considered the third and fourth periodic reports of the Republic of Korea (CEDAW/C/KOR/3 and CEDAW/C/KOR/4) at its 400th and 401st meetings, on 7 July
Republic of Korea th (19 session) 347.The Committee considered the third and fourth periodic reports of the Republic of Korea (CEDAW/C/KOR/3 and CEDAW/C/KOR/4) at its 400th and 401st meetings, on 7 July
Abstract. Acknowledgments
 Profile of Hired Farmworkers, 1998 Annual Averages. By Jack L. Runyan. Food and Rural Economics Division, Economic Research Service, U.S. Department of Agriculture. Agricultural Economic Report No. 790.
MARRIAGE & PARENTHOOD
 CONTENTS OVERVIEW 3 KEY INDICATORS 4 OVERALL POPULATION 5 AGEING 8 MARRIAGE & PARENTHOOD 10 IMMIGRATION & CITIZENS BY DESCENT 14 1 ANNEX Overall Population Table 1: Total population 16 Table 2: Singapore
Chapter 7. Migration
 Chapter 7 Migration Chapter 7 Migration Americans have traditionally been highly higher levels of educational attainment than Figure 7-1. mobile, with nearly 1 in 7 people changing residence each year.
The foreign born are more geographically concentrated than the native population.
 The Foreign-Born Population in the United States Population Characteristics March 1999 Issued August 2000 P20-519 This report describes the foreign-born population in the United States in 1999. It provides
Geographic Mobility of New Jersey Residents. Migration affects the number and characteristics of our resident population
 Geographic Mobility of New Jersey Residents Migration affects the number and characteristics of our resident population Geographic Mobility of New Jersey Residents More than 4.1 million (or 47.4%) New
Left out under Federal Health Reform: Undocumented immigrant adults excluded from ACA Medicaid expansions
 Left out under Federal Health Reform: Undocumented immigrant adults excluded from ACA Medicaid expansions Jessie Kemmick Pintor, MPH Graduate Research Assistant State Health Access Data Assistance Center
The Brookings Institution Metropolitan Policy Program Amy Liu, Deputy Director
 The Brookings Institution Metropolitan Policy Program Amy Liu, Deputy Director Mind the Gap: Reducing Disparities to Improve Regional Competitiveness in the Twin Cities Forum on the Business Response to
Demographic and Economic Impacts of International Migration to North Carolina. Frank Hawkins Kenan Institute of Private Enterprise
 April 2014 Demographic and Economic Impacts of International Migration to North Carolina James H. Johnson Jr and Stephen J. Appold Frank Hawkins Kenan Institute of Private Enterprise Kenan-Flagler Business
ATTACHMENT 16. Source and Accuracy Statement for the November 2008 CPS Microdata File on Voting and Registration
 ATTACHMENT 16 Source and Accuracy Statement for the November 2008 CPS Microdata File on Voting and Registration SOURCE OF DATA The data in this microdata file are from the November 2008 Current Population
U.S. Hispanics & Immigration: A Demographer s View
 Jeffrey S. Passel Pew Hispanic Center Washington, DC The Economics of Immigration Construction Economics Research Network Washington, DC December 6, 2007 U.S. Hispanics & Immigration: A Demographer s View
Changing Dynamics and. to the United States
 Jeffrey S. Passel Pew Hispanic Center Changing Dynamics and Characteristics of Immigration to the United States International Symposium on International Migration and Development United Nations, Torino,
Regional Data Snapshot
 Regional Data Snapshot Population, Economy & Education Features SET Civic Forum East Central NM, New Mexico Table of Contents 01 Overview 03 Human Capital 02 Demography 04 Labor Force 01 overview East
Population Aging, Immigration and Future Labor Shortage : Myths and Virtual Reality
 Population Aging, Immigration and Future Labor Shortage : Myths and Virtual Reality Alain Bélanger Speakers Series of the Social Statistics Program McGill University, Montreal, January 23, 2013 Montréal,
Ecuadorians in the United States
 Center for Latin American, Caribbean & Latino Studies Graduate Center City University of New York 365 Fifth Avenue Room 5419 New York, New York 10016 Ecuadorians in the United States 1980 2008 212-817-8438
An Equity Profile of the Southeast Florida Region. Summary. Foreword
 An Equity Profile of the Southeast Florida Region PolicyLink and PERE An Equity Profile of the Southeast Florida Region Summary Communities of color are driving Southeast Florida s population growth, and
Population and Dwelling Counts
 Release 1 Population and Dwelling Counts Population Counts Quick Facts In 2016, Conception Bay South had a population of 26,199, representing a percentage change of 5.4% from 2011. This compares to the
Post-Secondary Education, Training and Labour September Profile of the New Brunswick Labour Force
 Post-Secondary Education, Training and Labour September 2018 Profile of the New Brunswick Labour Force Contents Population Trends... 2 Key Labour Force Statistics... 5 New Brunswick Overview... 5 Sub-Regional
Looking at the future potential labor supply through the first release of labor underutilization indicators
 Mizuho Economic Outlook & Analysis June 21, 2018 Looking at the future potential labor supply through the first release of labor underutilization indicators < Summary > Japan s Ministry of Internal Affairs
Unemployment Rises Sharply Among Latino Immigrants in 2008
 Report February 12, 2009 Unemployment Rises Sharply Among Latino Immigrants in 2008 Rakesh Kochhar Associate Director for Research, Pew Hispanic Center The Pew Hispanic Center is a nonpartisan research
THE AMERICAN POLITICAL LANDSCAPE
 THE AMERICAN POLITICAL LANDSCAPE I. The 2008 election proved that race, gender, age and religious affiliation were important factors; do race, gender and religion matter in American politics? YES! a. ETHNOCENTRISM-
R 799, % New Americans in San Diego A Snapshot of the Demographic and Economic Contributions of Immigrants in the County 1
 New Americans in San Diego A Snapshot of the Demographic and Economic Contributions of Immigrants in the County 1 POPULATION GROWTH 24+76R Immigrant share of the population, 2016 Number of immigrants living
Population Outlook for the Portland-Vancouver Metropolitan Region
 Portland State University PDXScholar Institute of Portland Metropolitan Studies Publications Institute of Portland Metropolitan Studies 2007 Population Outlook for the Portland-Vancouver Metropolitan Region
Impact of Immigration: Disruptive or Helpful?
 DABE September Meeting Denver, CO September 21, 2016 Impact of Immigration: Disruptive or Helpful? Pia Orrenius, Ph.D. Federal Reserve Bank of Dallas Disclaimer: The views expressed herein are those of
Government data show that since 2000 all of the net gain in the number of working-age (16 to 65) people
 people") CENTER FOR IMMIGRATION STUDIES June All Employment Growth Since Went to Immigrants of U.S.-born not working grew by 17 million By Steven A. Camarota and Karen Zeigler Government data show that since all
CENTER FOR IMMIGRATION STUDIES June All Employment Growth Since Went to Immigrants of U.S.-born not working grew by 17 million By Steven A. Camarota and Karen Zeigler Government data show that since all
Asian American Survey
 Asian American Survey Findings from a Survey of 700 Asian American Voters nationwide plus 100 each in FL, IL, NV, and VA Celinda Lake, David Mermin, and Shilpa Grover Lake Research Partners Washington,
LATINO DATA PROJECT. Astrid S. Rodríguez Ph.D. Candidate, Educational Psychology. Center for Latin American, Caribbean, and Latino Studies
 LATINO DATA PROJECT Demographic, Economic, and Social Transformations in the South Bronx: Changes in the NYC Community Districts Comprising Mott Haven, Port Morris, Melrose, Longwood, and Hunts Point,
Measuring International Migration- Related SDGs with U.S. Census Bureau Data
 Measuring International Migration- Related SDGs with U.S. Census Bureau Data Jason Schachter and Megan Benetsky Population Division U.S. Census Bureau International Forum on Migration Statistics Session
Brazilians. imagine all the people. Brazilians in Boston
 Brazilians imagine all the people Brazilians in Boston imagine all the people is a series of publications produced by the Boston Redevelopment Authority for the Mayor s Office of Immigrant Advancement.
Left out under Federal Health Reform: Undocumented immigrant adults excluded from ACA Medicaid expansions
 Left out under Federal Health Reform: Undocumented immigrant adults excluded from ACA Medicaid expansions Jessie Kemmick Pintor, MPH Graduate Research Assistant State Health Access Data Assistance Center
What Lies Ahead: Population, Household and Employment Forecasts to 2040 April Metropolitan Council Forecasts to 2040
 The Metropolitan Council forecasts population, households and employment for the sevencounty Minneapolis-St. Paul region with a 30-year time horizon. The Council will allocate this regional forecast to
National Youth Policy of India 2014: Does it Meet Aspirations of Next Gen?
 11 National Youth Policy of India 2014: Does it Meet Aspirations of Next Gen? 2 Table of Contents 1 Overview...3 2 Objectives of the Policy... 4 3 Analysis of Policy Objectives... 5 4 Analysis of Key
Salvadorans. imagine all the people. Salvadorans in Boston
 Salvadorans imagine all the people Salvadorans in Boston imagine all the people is a series of publications produced by the Boston Redevelopment Authority for the Mayor s Office of Immigrant Advancement.
STRENGTHENING RURAL CANADA: Fewer & Older: The Coming Population and Demographic Challenges in Rural Newfoundland & Labrador
 STRENGTHENING RURAL CANADA: Fewer & Older: The Coming Population and Demographic Challenges in Rural Newfoundland & Labrador An Executive Summary 1 This paper has been prepared for the Strengthening Rural
3 1-1 GDP GDP growth rate Population size Labor force Labor participation rate Employed population
 INDEX Overview: Thailand 2 1 Economy 3 1-1 GDP 3 1-2 GDP growth rate 5 2 Population 6 2-1 Population size 6 3 Labor force and the related statistics 9 3-1 Labor force 10 3-2 Labor participation rate 12
May Final Report. Public Opinions of Immigration in Florida. UF/IFAS Center for Public Issues Education. Erica Odera & Dr.
 May 2013 UF/IFAS Center for Public Issues Education Final Report Public Opinions of Immigration in Florida Erica Odera & Dr. Alexa Lamm Center for Public Issues Education IN AGRICULTURE AND NATURAL RESOURCES
Youth at High Risk of Disconnection
 Youth at High Risk of Disconnection A data update of Michael Wald and Tia Martinez s Connected by 25: Improving the Life Chances of the Country s Most Vulnerable 14-24 Year Olds Prepared by Jacob Rosch,
Introduction. Background
 Millennial Migration: How has the Great Recession affected the migration of a generation as it came of age? Megan J. Benetsky and Alison Fields Journey to Work and Migration Statistics Branch Social, Economic,
Emigrating Israeli Families Identification Using Official Israeli Databases
 Emigrating Israeli Families Identification Using Official Israeli Databases Mark Feldman Director of Labour Statistics Sector (ICBS) In the Presentation Overview of Israel Identifying emigrating families:
The Contributions of Immigrants and Their Children to the American Workforce and Jobs of the Future
 ASSOCIATED PRESS/JACQUELYN MARTIN The Contributions of Immigrants and Their Children to the American Workforce and Jobs of the Future Dowell Myers, Stephen Levy, and John Pitkin June 19, 2013 www.americanprogress.org
R 4.5% 28,228. New Americans in Fort Wayne and Northeast Indiana. Immigrant share of the population, 2016
 New Americans in Fort Wayne and Northeast Indiana A Snapshot of the Demographic and Economic Contributions of Immigrants in the Region 1 POPULATION GROWTH +9R.% Immigrant share of the population, 016 Between
Our Shared Future: U N D E R S T A N D I N G B O S T O N. #SharedFuture. Charting a Path for Immigrant Advancement in a New Political Landscape
 U N D E R S T A N D I N G B O S T O N Our Shared Future: Charting a Path for Immigrant Advancement in a New Political Landscape Wednesday, April 19 th, 2017 8:30-10:30 a.m. #SharedFuture U N D E R S T
Regional Data Snapshot
 Regional Data Snapshot Population, Economy & Education Features SET Civic Forum Glacial Lakes Region, South Dakota Table of Contents 01 Overview 03 Human Capital 02 Demography 04 Labor Force 01 overview