1. Movement. Movement is inherently geographical. All movement involves leaving home. Three types of movement: 1. Cyclic 2. Periodic 3.
|
|
|
- Bennett John Weaver
- 5 years ago
- Views:
Transcription

1 Migration
2 1. Movement Movement is inherently geographical. All movement involves leaving home. Three types of movement: 1. Cyclic 2. Periodic 3. Migration
3 2. Cyclic Movement Involves journeys that begin at our home base and bring us back to it Regular sequences of short moves within a local area = activity spaces Commuting Seasonal movement Nomadism
4 3. Periodic Movement Involves a longer period of time away from the home base than cyclic movement Migrant labor 4. Transhumance - a system of pastoral farming where ranchers move livestock according to the seasonal availability of pastures College attendance Military service
5 5. Migration Permanent relocation across significant distances
6 6. International Migration Movement across international boundary lines. From one country to another country. Also known as transnational migration. 6. Emigrant = migrates out of country 7. Immigrant = migrates into country
7 9. Internal Migration Movement within a country. Varies according to the mobility of the population. More internal migration in MDC s.
8
9
10 10. Push factors: Negative influences that make a person want to move away.
11 Major Push Factors High crime rates and safety concerns Environmental catastrophe War or conflict Economic conditions Poverty Persecution by government for political beliefs Persecution based on religious beliefs or ethnicity Fear that culture or traditions are being threatened Expelled from country
12 12. Pull factors: Positive influences that pull a person toward a particular place. They tend to be vague and based solely on perceptions.
13 Major Pull Factors To reunite with family Economic opportunity Religious freedom Political freedom Education opportunity PERCEPTIONS
14 What is a push and what is pull? Highly personal Example of factor that could be both depending on the individual?
15 Migration 2013 Map and QOD Using the data provided, shade the top ten destination and origin countries for migrants in 2013 (ignore the 1990 numbers). Once shaded analyze the map by answering the following questions: What patterns are evident? What impact would this data have on particular regions of the world? What impact would it have on a global scale?
16 Instant Research: Push and Pull Factors Your table has been assigned a destination country and an origin country. Destination Country: List three major pull factors for that country and explain each factor. Cite a source and provide 3-5 bullet point details. Origin Country: List three major push factors for that country and explain each factor. Cite a source and provide 3-5 bullet point details. EXAMPLE PUSH FACTOR: Lack of Economic Opportunity Unemployment rate in 2014 is 22% Average income is below poverty levels PUT INFORMATION ON POSTER
17 T4: Destination: Saudi Arabia Origin: China T3: Destination: Australia Origin: Russia T2: Destination: United Kingdom Origin: Mexico T1: Destination: Russia Origin: India T8: Destination: France Origin: Bangladesh T7: Destination: Spain Origin: Pakistan T6: Destination: Germany Origin: Afghanistan T5: Destination: United States Origin: United Kingdom

18 12. Forced Migration Migrants are pushed from their home Atlantic slave trade: the largest and most devastating forced migration in the history of humanity
19 13. Voluntary Migration: Migrants have an option of whether or not to move.

20 14. Countermigration When governments detain migrants who enter or attempt to enter their countries illegally and return the migrants to their home countries.
21 15. Chain migration: Occurs when people migrate to be with people who migrated before them and they feel some linkage. Family Religion Ethnic Cultural
22 16. Step migration: A migration in which an eventual long distance relocation taken in a series of steps. For example from a farm, to a village, to small town, to a city.
23 17. Intervening opportunity: Many migrants encounter an opportunity along their migration stream that keeps them from getting to the metropolis that impelled them to move in the first place. Example: during the Great Migration
24 18. Migration Stream: A pathway from a place of origin to a destination.
25 19. Counterstream: People moving back to place of origin from the new place. Deported Indians returning to India to take advantage of growing economy Country refusing entry Jews trying to flee Germany during WWII.
26 20. Migration Waves: Chains of migration built upon each other create waves of migration from one origin to the same destination.
27
28 21. Three Major Waves of Migration to United States
29 A. Colonial Era Immigration ( ): Primary source of migrants was Europe and Africa (both voluntary and forced). Europeans fleeing political and religious persecution Vast Majority of Europeans (90%) came for Great Britain Africans forced into slavery
30 B. Nineteenth Century Immigration ( ) Primary source of migrants was Europe Ireland and Germany 1870 s Western Europe 1880 s Scandinavian countries Southern and Eastern Europe (Italy, Russia, and Austria-Hungary).
31 C. Late Twentieth and Early Twenty First Century Immigration (1970 current). More than three fourths of recent US migrants have been from Asia or Latin America

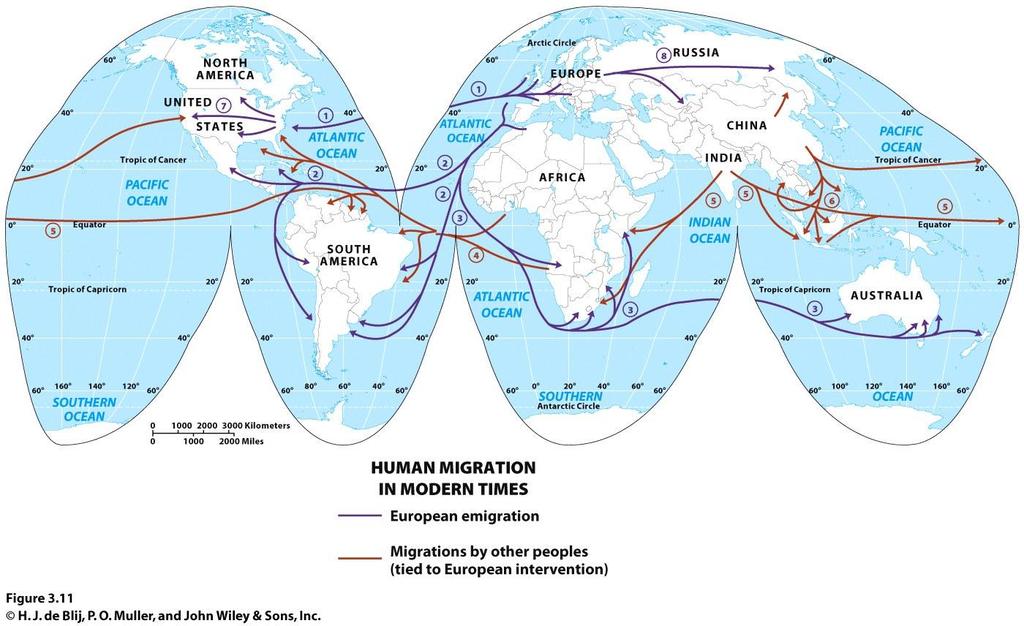
32 22. Global Scale Migration Before 1500 most global migration was done by European explorers in search of spices and fame. The era of exploration was followed by European Colonization 23. Colonization = process where colonizing country takes over another place, putting its government in charge and taking control Moves in its own people or indentured servants Most of migration in the past 500 years was generated by European colonization
33
34 24. Regional Migration Smaller scale migration movement to neighboring countries Major reasons for regional migration Economic opportunity Islands of Development = Port cities that become islands of development within a larger undeveloped region Reconnect cultural groups Example - Migration of Jews to Israel Conflict and war
35 25. National Migration
36 26. Russification Soviet government sought to assimilate all the people in the Soviet territory into the Russian culture, by encouraging people to move out of Moscow and St. Petersburg and fill in the country.
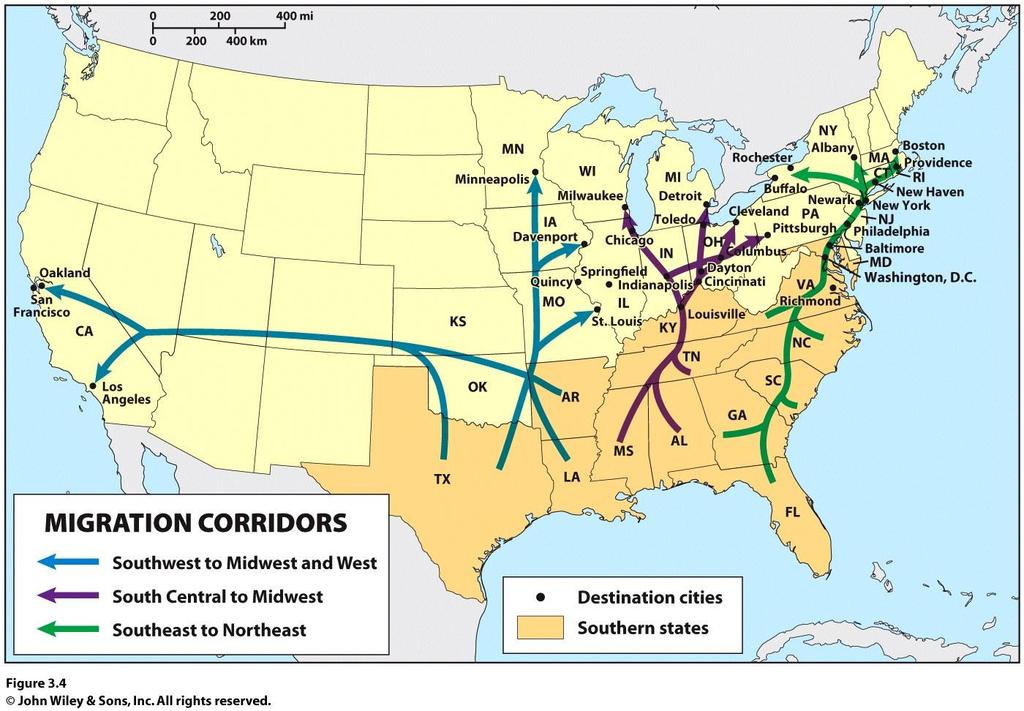
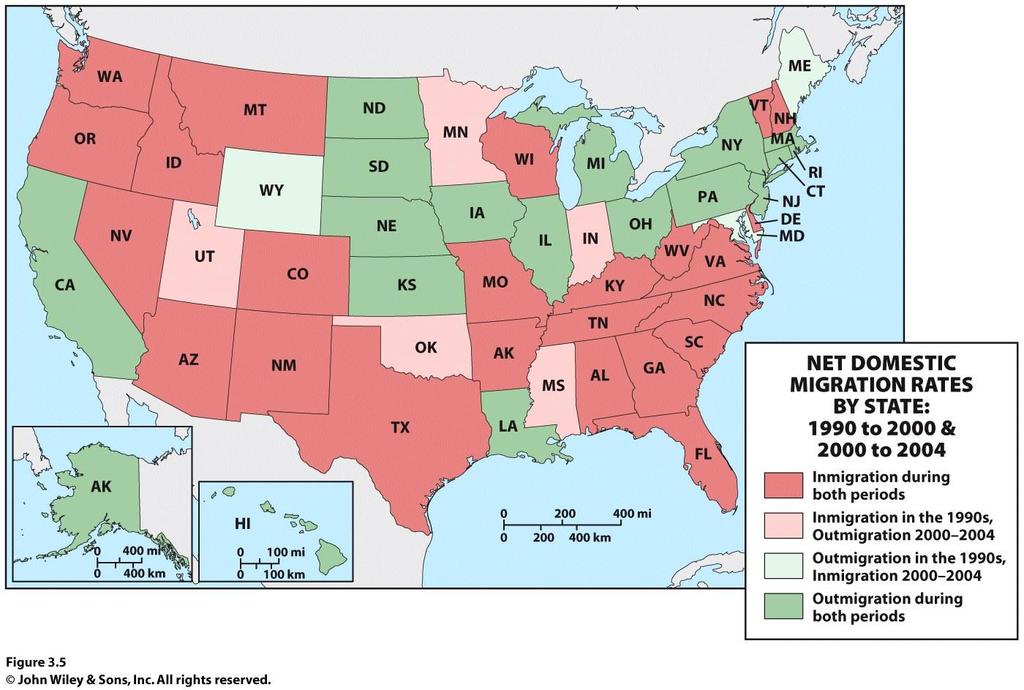
37 27. The Great Migration Large U.S. internal migration Great Migration occurred during WWII African Americans left the South to take industrial (factory ) jobs in the North


38 28. The Great Migration in Reverse In 1970 s more African Americans returning to the South than were moving North. Closing of factories in North led to the return South where economic conditions were better Known as the move from the Rustbelt to the Sunbelt
39 29. Guest Workers Guest workers are legal, documented migrants who have work visas, usually short term. Millions of guest workers live outside of their home country and send remittances from their jobs home.


40 30. Remittances Money migrants send back to family and friends in their home countries. Becomes an important part of the economy in many poorer countries.
41 31. Reverse Remittances Money sent to a migrant from family and friends in the home country US economic downturn many migrants asked family back in Mexico for financial help.
42 32. Ravenstein s Laws of Migration: 1. Every migration flow generates a return or countermigration. 2. The majority of migrants move a short distance. 3. Migrants who move longer distances tend to choose big-city destinations. 4. Urban residents are less migratory than inhabitants of rural areas. 5. Families are less likely to make international moves than young adults.
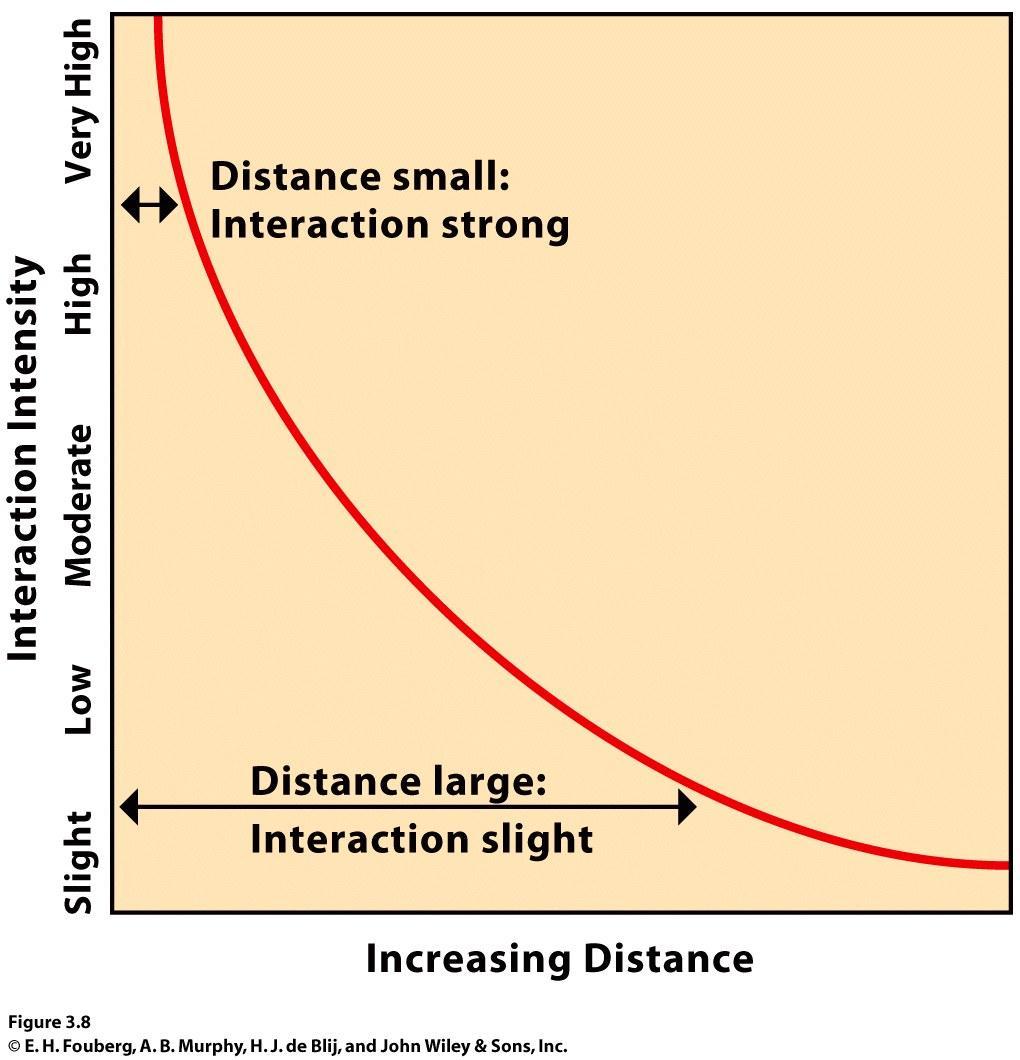
43 33. Gravity model: Predicts interaction between places on the basis of their population size and distance between them. Larger more populated places will attract more migrants than smaller less populated places Closer places will attract more migrants than places farther away
44
45 34. Distance Decay: Prospective migrants are likely to have more complete perceptions of nearer places than of farther ones. Since interaction with faraway places generally decreases as distance increases, prospective migrants are likely to feel much less certain about distant destinations than about nearer ones.

46 35. Refugees The 1951 Refugee Convention defines a refugee as a person who has a well founded fear of being persecuted for reasons of race, religion, nationality, membership of a particular social group, or political opinion.
47 36. Economic refugee: Someone who is seeking a higher material standard of living. 37. Environmental refugee: Someone fleeing the destruction of a natural disaster.
48 38. UNHCR: The United Nations High Commissioner on Refugees.
49 39. Internally displaced persons (IDP s): People who have been displaced within their own countries, but they do not cross international borders as they flee.

50 40. Asylum: the right to protection in the first country in which the refugee arrives.
51 41. Repatriation: a process by which the UNHCR helps return refugees to their homelands once violence and persecution subside.

52 Islands of Development: Places within a region or country where foreign investment, jobs, and infrastructure are concentrated. Specifically created for economic purposes. Economically developed area surrounded by less developed areas. Major pull factor for migrants

53 Malaysian government built a new, ultramodern capital at Putrjaya to symbolize the country s rapid economic growth.

54 The global oil industry has created the entire city of Port Gentile, Gabon to extract Gabon s oil resources.
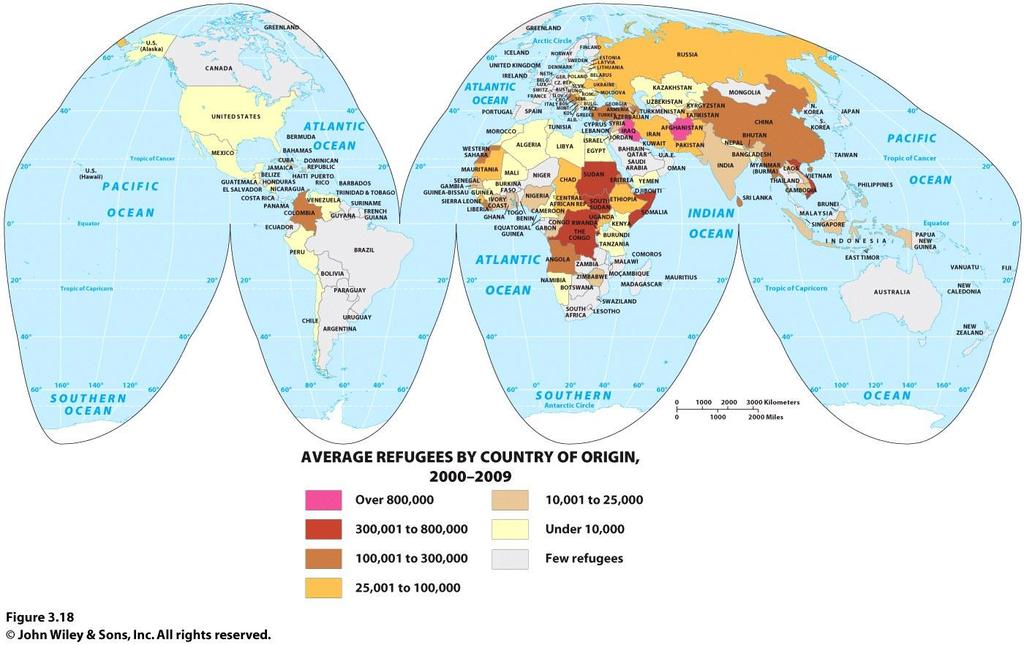
55 42. Regions of Dislocation and Refugees
56 Sub Saharan Africa Millions fled Rwanda and Congo in response to tribal conflicts Darfur region of Sudan experienced a genocide Wars in Zaire, Tanzania, Uganda, Liberia, Sierre Leone, Angola and Burundi have had large numbers of refugees Current hotspot CAR Central African Republic
57 The Middle East Mass migration of Palestinians into Jordan, Syria and Egypt after the formation of Israel Dislocation of Kurds from Iraq and Afghanistan during the Soviet occupation in 1980 s Wars in Iran and Iraq have created large numbers of IDP s and refugee s Current Hotspot is Syria
58 South Asia The third-ranking geographic realm, mainly because of Pakistan s role in accommodating Afghanistan s refugees. Over 1 million Sri Lankans dislocated in conflict
59 Europe Fall of Yugoslavia led to largest refugee crises in Europe since WWII. Nearly 7 million refugees fled homes.
60 43. Immigration Laws Immigration laws tend to restrict or prevent immigration Quotas: Laws that set a certain number or percent of immigrants that will be allowed into the country. Selective Migration: Laws that bar individuals with certain backgrounds from entering the country. Might bar those with criminal records or subversive political activities
61
62 Additional Resources Immigration to the United States Refugees Geographic Mobility and Movement in the United States migrate.html 2012 John Wiley & Sons, Inc. All rights reserved.
63 Population
64 44. Demography: The study of human populations. Demographers study the spatial distribution and density of humans and their movements.

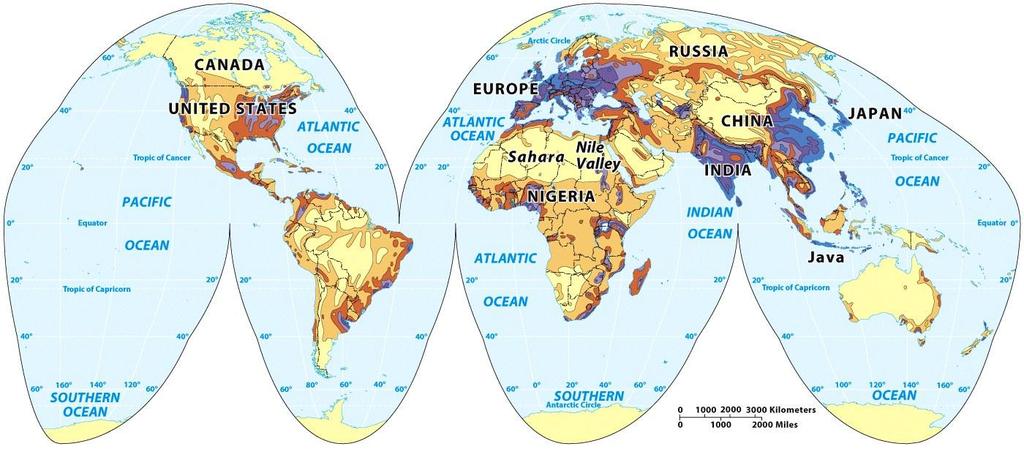
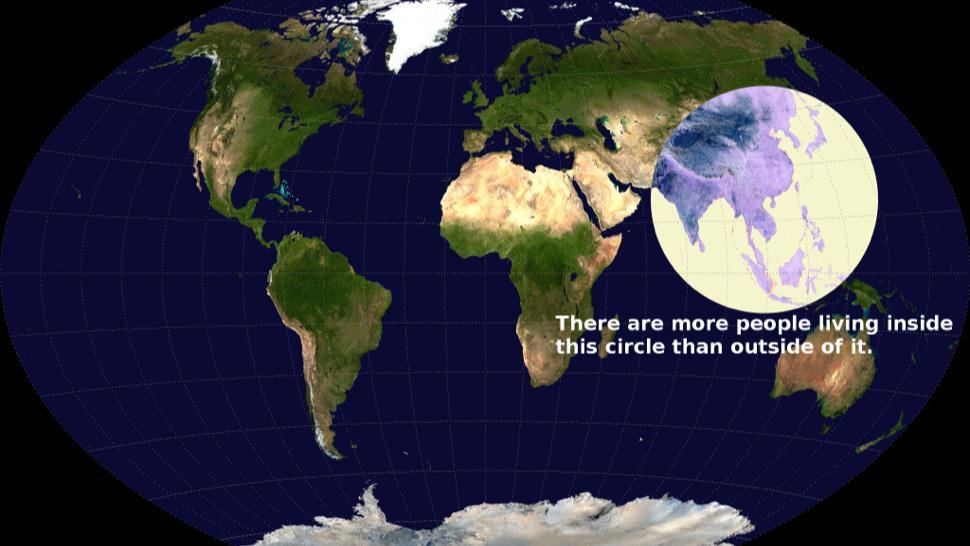
65 45. Ecumene: The portion of the earth that is inhabited by humans. Approximately 75% of all humans live on only 5% of the Earth s surface. Over 50% live in cities
66 What is the current world population? 7.3 Billion
67
68 Visualizing How a Population Reaches 7 Billion on Vimeo
69 Earth s Population History 7 billion reached 2011 (12 years later) 6 billion reached 1999 (12 years later) 5 billion reached 1987 (13 years later) 4 billion reached 1974 (15 years later) 3 billion reached 1959 (29 years later) 2 billion reached 1930 (100 years later) 1 billion reached circa 1830 Source: Kuby, HGIA
70 How many people are added to the 228,000 planet each day?
71 Name the three most populated countries? China India United States
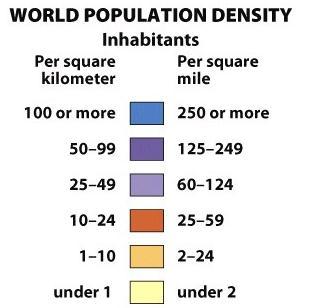
72 46. Population density: a country s total population relative to land size. Assumes an even distribution of population to the land
73
74 47. Arithmetic Population Density The population of a country or region expressed as an average per unit area. Derived by dividing the population of an area by the number of miles/kilometers that make up that unit. For Example Average population density in US is 82 per square mile

75 48. Physiologic Population Density The number of people per unit area of agriculturally productive land Concept Caching: Rice Terraces- Bail, Indonesia
76 Population Distribution Descriptions of locations on the Earth s surface where individuals or groups (depending on the scale) live. Geographers often represent population distributions on dot maps, in which one dot represents a certain number of a population.
77 To have a clear understanding of population you must look at both density and distribution.

78 World Population Distribution 2012 John Wiley & Sons, Inc. All rights reserved. H.J. de Blij, P.O. Muller, and John Wiley & Sons
79
80 East Asia Almost 25% of world s population Population concentrated in Korea, Japan, China Over 1.3 billion people in China
81 South Asia Physical geography barriers separate population clusters Himalaya Mountains; Indus River Valley Confined region with rapidly growing population Bangladesh: 152 million people in an area the size of Iowa
82 North America Megalopolis Huge urban agglomerations; Boston, NYC, Philadelphia, Baltimore, Washington, D.C This accounts for more than 20% of US population
83 50. Life Expectancy: Average number of years to be lived by a person.


84 is the average lifespan a newborn can expect is short when child deaths are common
85 Life expectancy (years) years years $ Burundi Population (millions) 2000 $ Sweden $ Income per person (comparable dollars per year)
 2000 $ 1000 100 1 20 000 $ Income per person (comparable dollars per")
86 100 Life expectancy (years) years $ Burundi Population (millions) 2000 $ $ Income per person (comparable dollars per year)
 2000 $ 1000 100 1 20 000 $ Income per person (comparable dollars")
87 100 Life expectancy Age (years) (years) years $ Burundi Population (millions) 2000 $ $ Income per person (comparable dollars per year)
88 Life expectancy Age (years) (years) years $ Burundi Look at the expected life of five newborn Burundians Population (millions) 2000 $ $ Income per person (comparable dollars per year) 100 1
89 100 Pierre Liz Jean Ann Sarah Age (years) How long will they live if conditions remain as in Burundi in 2007 during their whole lifetime? 0
90 100 Pierre Liz Jean Ann Sarah Age (years)
91 Pierre Liz Jean Ann Sarah 100 old Age (years) child adult So yes, 2 of 5 get old in Burundi
92 Pierre Liz Jean Ann Sarah 100 Calculate the mean This is the Life Expectancy = Age (years) years
93 Life expectancy (years) years years $ Burundi $ 31 years Population (millions) Sweden $ 84 Income per person (comparable dollars per year)

94 Life expectancy (years) years $ Population (millions) 2000 $ Sweden $ Income per person (comparable dollars per year)
")
95 Life expectancy Age (years) (years) years Look at the expected 0 Population (millions) life of five newborn Swedes 200 $ 2000 $ Sweden $ Income per person (comparable dollars per year)
96 Per Lisa Jan Anton Sara Age (years) How long will they live if conditions remain as in Sweden in 2007 during their whole lifetime?
97 Per Lisa Jan Anton Sara Age (years) old 20 1 adult 0
98 Per Lisa Jan Anton Sara years Age (years) Calculate the mean =81
99 Life expectancy (years) years $ Population (millions) 2000 $ Sweden $ Income per person (comparable dollars per year)


100 Let s compare
101 Life expectancy (years) years years $ Burundi Population (millions) 2000 $ Sweden $ Income per person (comparable dollars per year)
102 Age (years)
103 Age (years) 100 To live long in Sweden is almost the same as 80 to live long in Burundi But dying young So, in no, Sweden is very different all Burundians do not live 31 from dying years shorter young in than Burundi Swedes
104 is an average -Most Burundians get older than 50 -Some die in childhood is low when childdeaths are common -It is low in Burundi not because all die a bit earlier -But because some die much younger
105 51. Total Fertility Rate (TFR): Average number of children born to woman of childbearing age
106 52. Fecundity: The ability of a woman to conceive. The fecund years are generally Range is expanding in many regions.
107 53. Infant Mortality Rate (IMR): Number of infant deaths per 1,000 live births in a year. Infant is defined as first year. IMR is often used as an indicator of a countries overall quality of life. A high IMR is usually associated with high levels of poverty, malnourishment, poor sanitation, lack of medical care and few opportunities for education

108 QOD: Hypothesize why the IMR is low in some regions of the country and high in others. Shift scales in your mind, and take one state and choose one state to consider: how do you think IMR varies within this state?
109 tep-step-the-path-ending-preventable-childdeaths
110 54. Child Mortality Rate: Number of children that die between their first and fifth years in a given population.

111 55. Crude Birth Rate (CBR): Number of births in a year per 1000

112 56. Crude Death Rate (CDR): Number of deaths in a year per 1000
113 57. Rate of Natural Increase: The growth rate of a population. Excludes immigration and emigration. Births (CBR) Deaths (CDR) = Natural Increase (NI)
114 QUIZ TIME COUNTRY POPULATION (millions) BIRTHS per 1,000 DEATHS per 1,000 GNI PPP (US $) Sudan ,030 Singapore ,790 Estonia ,810 Germany ,100 United States ,310
115 Birth and Death Rates, Worldwide Rates of birth, death, and natural increase per 1,000 population Natural Increase Birth rate Death rate Source: United Nations, World Population Prospects: The 2002 Revision (medium scenario), Population Reference Bureau
116 The Demographic Transition Model H.J. de Blij, P.O. Muller, and John Wiley & Sons, Inc John Wiley & Sons, Inc. All rights reserved.
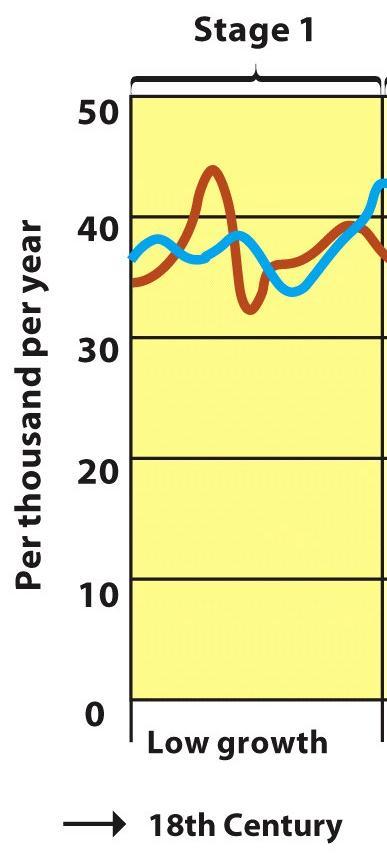
117 58. Demographic Transition Model: A geographic model that explains and predicts changes in population growth.
118 The DTM predicts changes in CBR, CDR and RNI as a country transitions through economic stages of development Based on assumption that economics drive population changes and that all countries will pass through four stages of demographic transition.
119
120
121 DTM STAGE 1 Low Growth Stage or Pre-Industrial Stage CBR and CDR are extremely high creating a low RNI. CBR and CDR fluctuate because of disease, famine and war. Most people in stage 1 are subsistence farmers. Known as stationary or equilibrium because CBR and CDR are nearly equal and not moving No countries are currently stage 1.
122
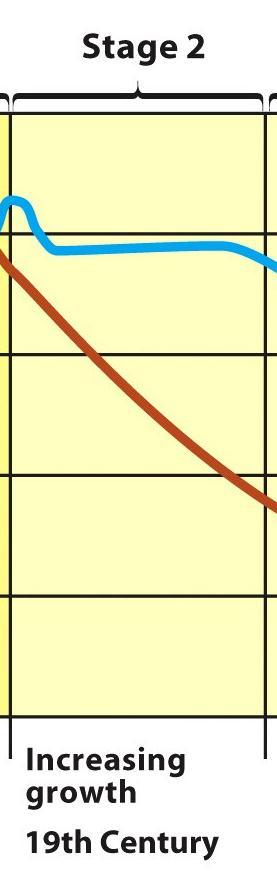
123 DTM STAGE 2 High Growth Stage or Early Industrial Stage High birth rates (over 30) but death rates decline (to about 20) CBR remains high because most are still subsistence farmers and cultural traditions change slowly. Because CBR is high and CDR declines, RNI increases and population expansion is high. Many less developed countries currently in stage 2.
124 TRANSITION TO STAGE TWO IN CLASSIC DTM 1. Agricultural technology Improvements in food supply: higher yields as agricultural practices improved in Second Agricultural Revolution (18 th century) In Europe, food quality improved as new foods introduced from Americas 2. Medical technology Better medical understanding (causes of diseases; how they spread) 3. Public sanitation technologies Improved water supply (safe drinking water) Better sewage treatment, food handling, and general personal hygiene 2003 Population Reference Bureau
125
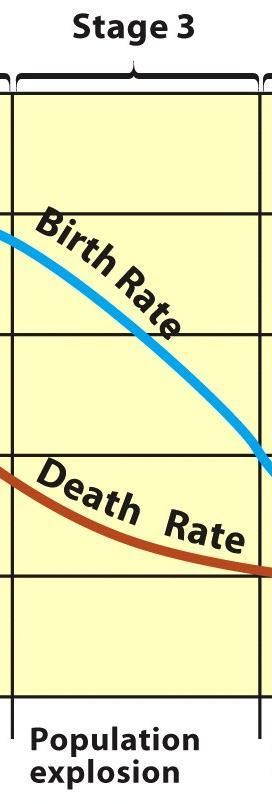
126 DTM STAGE 3 Moderate Growth or Later Industrial Birth rates decline sharply (to about 15) Death rates decline a bit more (to about 10 or less) CBR begins to fall as families move to cities and health conditions improve causing children to live longer. Women have more opportunities in industrializing economies. RNI is increasing, but still greater than zero. Most Latin American and Asian countries remain in Stage 3.
127 TRANSITION TO STAGE THREE IN CLASSIC DTM 1. Societies become more urban, less rural Declining childhood death in rural areas (fewer kids needed) Increasing urbanization changes traditional values about having children City living raises cost of having dependents 2. Women more influential in childbearing decisions Increasing female literacy changes value placed on motherhood as sole measure of women s status Women enter work force: life extends beyond family, changes attitude toward childbearing 3. Improved contraceptive technology, availability of birth control 2003 Population Reference Bureau
128
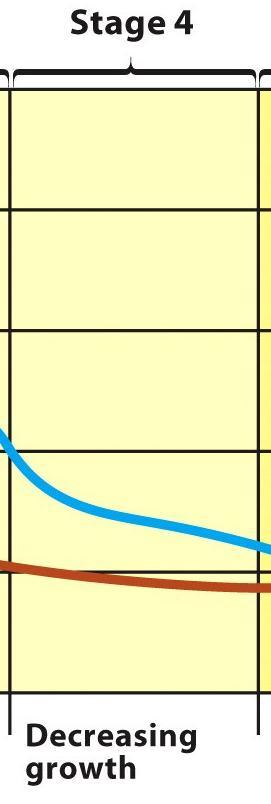
129 DTM STAGE 4 Low Growth or Post-Industrial Birth rates and death rates both low (about 10) CBR falls and meets the CDR at equally low levels reaches equilibrium. RNI stabilizes and there is close to zero population growth
130
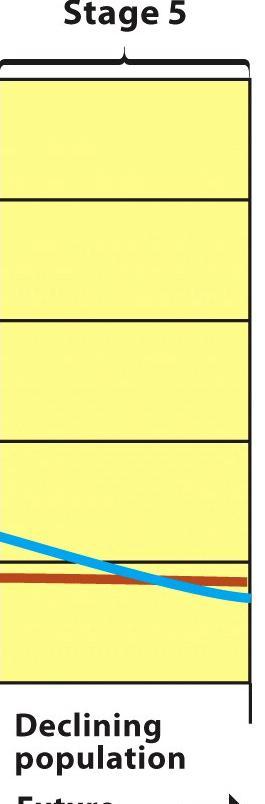
131 DTM STAGE 5 Declining Growth Demonstrates graying population trends. CBR drops below CDR causing a negative RNI. Many Western European countries and Japan are entering stage 5.
132 H.J. de Blij, P.O. Muller, and John Wiley & Sons, Inc.
133 H.J. de Blij, P.O. Muller, and John Wiley & Sons, Inc.
134 DTM Practice: For each country listed below determine which stage of the DTM they are currently experiencing. Country Crude Birth Rate Crude Death Rate Mexico Nigeria Italy South Africa Germany Afghanistan Sri Lanka Canada Russia Brazil Rate of Natural Increase (percent) Demographic Transition Stage
135 59. Population Composition: The structure of a population in terms of age, gender, and other properties such as marital status and education. Age and gender are key indicators of population composition.

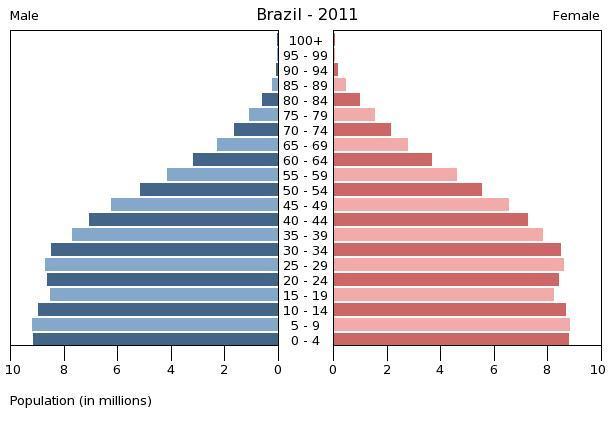
136 60. Population Pyramids: A visual representation of age and gender structures.

137 POPULATION STRUCTURE The population pyramid displays the age and sex structure of a country or given area OLD DEPENDANTS Population in Five Year Age bands ECONOMICALLY ACTIVE YOUNG DEPENDANTS MALES To the left Usually, but not always, in % to make for easier comparisons between countries FEMALES To the right


138 What Population Pyramids Show Us KEY Economically More Developed Country Economically Less Developed Country slope of pyramid indicate the death rate width of the base is related to birth rate/fertility rate proportions of men and women can suggest male or female migrations height of graph can indicate life expectancy (ignore the very thin end of the wedge as occurs on graph B as these people are a definite minority) "kinks" indicate dramatic reductions in birth rate or increases in death rate in the past area of graph indicates total population - compare areas of different population age groups or different sex on one graph The overall shape of the population pyramid can indicate whether it is an Economically More Developed Country or Economically Less Developed Country

139 Data from: UN, World Population Prospects The wider the base of the pyramid, the higher the percentage of young people exists. Shape is typical of developing countries. Generally an indication that the population will expand in the near future.

140 Data from: UN, World Population Prospects The more top heavy the pyramid the higher the percentage of elderly people in the population.
141 61. Graying Population A population with more middle aged and elderly people than young, reproductive people Generally indicates a slow growing or declining population John Wiley & Sons, Inc. All rights reserved.
142 US Population Pyramids es/geoenrichment_infographic/
143 QOD: What are the different social needs of a population that is composed of: More elderly More Young More Males More Females

144 Population Pyramids related to the Demographic Transition Model Stage 1 Stage 2 Stage 3 Stage 4 IMPLICATIONS IMPLICATIONS IMPLICATIONS IMPLICATIONS Both birth rates and Death rates are High, so population growth rates are slow but population Is usually restored Due to high birth Rate. Short life Expectancy EXAMPLES: none today - Afghanistan, Ivory Coast (30 years ago)there are no Stage 1 countries today Population starts to grow at an exponential rate due to fall in Crude Death Rate. More living In middle age. Life expectancy rises Infant mortality rate falls. EXAMPLES: DR Congo, Yemen, Afghanistan (today) Population continues to grow but at slower rate. Low C Death Rate. Dramatically declining Crude Birth Rate. EXAMPLES: India, Brazil (late 3) Most of world is in 3 Low Crude Birth Rate and Crude Death Rate Higher dependency ratio and longer life expectancy Crude Death Rate does Rise slightly because of The ageing population EXAMPLES: China, United States, Canada, Australia
145 Stage 5

146 What Stage of DTM is US? 2011 Data TFR 2.1 BR 14 DR 8 Natural Increase:.6% Growth Rate:.9% Why is Growth Rate higher? How does this impact pyramid? Pyramid looks like a late 3 country. But does US fit description profile of Stage 4 better?

147 2012 John Wiley & Sons, Inc. All rights reserved.

148 2012 John Wiley & Sons, Inc. All rights reserved.

149 2012 John Wiley & Sons, Inc. All rights reserved.
150
151 What Stage of DTM? Why?
152
153
154
155 Demographic Transition Model 2003 Population Reference Bureau
156 62. Demographic Momentum: The tendency for a population to continue growing after a fertility decline. If your fertility rate drops, how does your population grow? Create a visual representation (graph, chart, map ) that demonstrates this phenomenon.
157 63. Government Population Policies Expansive population policies: Encourage large families and raise the rate of natural increase Eugenic population policies: Designed to favor one racial or cultural sector of the population over others

158 Restrictive population policies e.g., One-Child Policy in China Limitations: Sweden Contradictions: Roman Catholic doctrine Chengdu, China H.J. de Blij

159 Theories for the Relationship Between Population and Resources Malthus vs. Boserup
160 Is there likely to be a population crisis?

161 Pessimistic Approaches Thomas Malthus ( ) Wrote An essay on the Principle of Population in 1798 which described a forthcoming population catastrophe World population was then nine million World population has now grown to SEVEN billion
162 Malthus core principles Food is essential for life Population increases faster than food supply Therefore Malthus predicted that population would grow until it reached the limit of food supply, then there would be widespread poverty and famine.
163 Malthus recognized that: Population, if left unchecked, will grow geometrically: 1, 2, 4, 8,16,32 Whereas food supply increases arithmetically as the amount of land is finite: 1, 2, 3, 4, 5, 6
164 Population Food supply And therefore he said there would be a Malthusian catastrophe: At the point where population reaches its limit of food supply there will be war, famine and disease. Time
165 Malthusian Checks Malthus stated that once population reached this point, checks would come into play to readdress the balance between population and resources: 1. positive checks increased levels of misery (war, famine and disease) 2. preventative checks celibacy, later marriage etc

166 A more optimistic approach Ester Boserup ( ) Wrote The Conditions of Agricultural Growth in 1965 Opposite to Malthus People have resources of knowledge and technology to increase food supply as necessary
167 Boserup s main points Environments have limits that restrict population But these limits can be changed using technologies Population growth is the trigger for innovation to allow food supply to increase e.g. irrigation, weeding, crop intensification, better seed quality, tools, techniques etc
168 Was Boserup right? Evidence which supports Boserup: Increasing intensity of shifting cultivation Move from slash and burn practices to using irrigation in rural areas with higher population densities The Green Revolution widespread introduction of high-yielding varieties, pesticides etc Hugely increased yields allowed more people to be fed GMOs Genetically Modified Organisms
169 Was Boserup right? Boserup admits that overpopulation can lead to unsuitable farming practices which may degrade the land E.g. population pressure as one of the reasons for desertification in the Sahel region
170 What Do You Think? Explain Malthus Theory Explain Boserup s Theory Which theory do you believe is right - three reasons why?

171 66. Infectious Diseases: Results from the invasion of parasites and their multiplication in the body Malaria HIV/AIDS

172 67. Chronic/Degenerative Diseases: Illnesses of longevity or old age Heart Disease Cancer

173 68. Genetic or Inherited Diseases: Traced to ancestry Sickle Cell Anemia Hemophilia
174 69. Endemic: Disease that affects a small area. The flu hits Portland 70. Epidemic: A disease affecting a region. the flu spreads throughout Oregon and Washington 71. Pandemic: A disease that affects very large numbers of people, often at a global level. The flu spreads across the entire US and Northern Europe
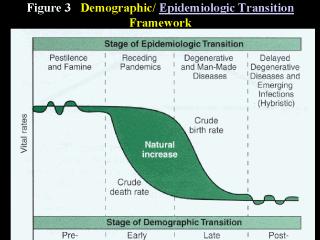
175 72. Epidemiological Transition Model Explains changes in population due to medical innovation and improvements
176
177 The Age of Pestilence and Famine mortality is high and fluctuating, thus precluding sustained population growth. In this stage the average life expectancy at birth is low and variable, between 20 and 40 years.
178 The Age of Receding Pandemics Mortality declines progressively; and the rate of decline accelerates as epidemic peaks become less frequent or disappear. The average life expectancy at birth increases steadily from about 30 to about 50 years. Population growth is sustained.
179 The Age of Degenerative and Man-Made Diseases Mortality continues to decline and eventually approaches stability at a relatively low level. The average life expectancy at birth rises gradually until it exceeds 50 years. It is during this stage that fertility becomes the crucial factor in population growth.
180 Delayed degenerative diseases and emerging infections Mortality and birth rates are both low Fluctuate but relatively stable 2012 John Wiley & Sons, Inc. All rights reserved.
181 HIV/AIDS 2010 nearly 42 million people were living with HIV/AIDS (1.2 percent of the population) 5 Million new infections occur each year. Nearly 20% of adults in some Sub-Saharan regions are infected with HIV/AIDS.
182 Hans Rosling on HIV: New facts and stunning data visuals - YouTube

183 Data from: Population Reference Bureau
184 Demographic Momentum or Population Momentum distilled-demographics-populationmomentum.aspx
185 Future Population Growth Stationary Population Level (SPL) The level at which a national population ceases to grow Anticipated dates for population stabilization are often moved back Ex. Brazil and India
186 Additional Resources 200 Countries, 200 Years, 4 Minutes John Wiley & Sons, Inc. All rights reserved.
187 DTM MINI FRQ A. What changes occur to the CBR and CDR during stage three of the DTM. B. List and explain two reasons that these changes occur.
188 World Trends Analysis Using Graphs and Charts Number your paper from 1-20 For each Graph / Chart write down 2 conclusions, trends or patterns that you observe Population Reference Bureau
189 Adult Literacy, by Region Literacy Rates, by Sex, 2000 Percent World Africa Latin America/ Caribbean Asia Arab States/ North Africa Female Male Source: UNESCO Institute for Statistics ( Population Reference Bureau
190 Notes on Adult Literacy, by Region Nearly all men and women in more developed regions can read and write. However, literacy rates are lower in the less developed regions. Women s literacy rates in particular vary significantly by region: from 51 percent in Africa, to 68 percent in Asia, to 88 percent in Latin America and the Caribbean. Overall, more men than women are literate. This is especially striking in the Arab states and North Africa, where nearly three-fourths of men but less than half of all women are literate Population Reference Bureau
191 Age Distribution of the World s Population Population Structures by Age and Sex, 2005 Millions Less Developed Regions Age More Developed Regions Male Female Male Female Population Reference Bureau Source: United Nations, World Population Prospects: The 2002 Revision (medium scenario), 2003.
192 Notes on Age Distribution of the World s Population Sex and age distributions show that less developed countries have significantly younger populations than more developed countries. Roughly one-third of the population in less developed countries is under age 15. In many sub-saharan African countries, this proportion rises to nearly onehalf of the population. In contrast, less than one-fifth of the population in more developed countries is under 15. Today there are more than 2 billion young people below age 20 in less developed regions the age cohort that will soon become the world s newest group of parents. Young age structures in the less developed countries are due mainly to higher levels of childbearing in recent decades Population Reference Bureau
193 Annual Increase in World Population Millions Source: United Nations, World Population Prospects: The 2002 Revision, Population Reference Bureau
194 Notes on Birth and Death Rates, Worldwide Birth rates and death rates are declining around the world. Overall economic development, public health programs, and improvements in food production and distribution, water, and sanitation have led to dramatic declines in death rates. And women now have fewer children than they did in the 1950s. Nevertheless, if death rates are lower than birth rates, populations will still grow. Also, it is possible for absolute numbers of births to increase even when birth rates decline Population Reference Bureau
195 The Classic Stages of Demographic Transition Stage 1 Stage 2 Stage 3 Stage 4 Birth rate Natural increase Death rate Time Note: Natural increase is produced from the excess of births over deaths Population Reference Bureau
196 Desire for Smaller Families Women With Two Children Who Say They Want No More Children Percent Bangladesh Egypt Guatemala Kenya Zimbabwe Late 1980s Late 1990s/Early 2000s Source: ORC Macro, Demographic and Health Surveys, Population Reference Bureau
197 Diverging Trends in Fertility Reduction Average number of children per woman Bangladesh Egypt India Indonesia Iran Nepal Pakistan Turkey Yemen 2003 Population Reference Bureau Source: United Nations, World Population Prospects: The 2002 Revision (medium scenario), 2003.
198 Growth in More, Less Developed Countries Billions Less Developed Countries More Developed Countries Source: United Nations, World Population Prospects: The 2002 Revision (medium scenario), Population Reference Bureau
199 Largest Cities, Worldwide Millions London Tokyo New York Sao Paulo Mexico City Tokyo Mumbai Dhaka (Bombay) Tokyo Source: United Nations, World Urbanization Prospects: The 2001 Revision (medium scenario), Population Reference Bureau
200 Notes on Largest Cities, Worldwide The largest cities in the world are growing rapidly in size and they are shifting from the more developed regions to the less developed regions. In 1960 the three largest cities were in more developed countries; by 2000, only Tokyo remained in the top three. In 1960, New York was the largest city in the world, with a population of about 14 million. By 2015, the largest city worldwide is projected to be Tokyo, with nearly double this population size: 27 million Population Reference Bureau
201 Population in Countries With Low Fertility Decline or Growth, Percent Country (average number of children per woman) China (1.8) 12 South Korea (1.4) 6 Trinidad & Tobago (1.6) 3-8 Italy (1.2) -14 Russia (1.1) -17 Bulgaria (1.1) Source: United Nations, World Population Prospects: The 2002 Revision (medium scenario), Population Reference Bureau
202 Notes on Population in Countries With Low Fertility All countries shown here have below replacement level childbearing the level required for population to ultimately stop growing or declining. Yet, half will continue to grow and half are projected to decline by Although women in both Russia and Bulgaria have on average 1.1 children each (among the lowest rates in the world), Russia, with a slightly younger population, will lose a smaller proportion of its population (14 percent, compared with 17 percent for Bulgaria) between 2002 and Still, Russia, having a much bigger population, is projected to lose nearly 20 million people, whereas Bulgaria will probably shrink by just 1.5 million Population Reference Bureau
203 Ratio of Workers to Dependents, by Region Africa East Asia South Central Asia Latin America and the Caribbean Note: People 15 to 64 are considered to be workers; people 14 and younger and those over 65 are considered to be dependents. Source: United Nations, World Population Prospects: The 2002 Revision (medium scenario), Population Reference Bureau
204 Reaching Replacement Fertility Average number of children per woman Azerbaijan Brazil China Mauritius Thailand Tunisia Source: United Nations, World Population Prospects: The 2002 Revision (medium scenario), Population Reference Bureau
205 10 Places With the Lowest Birth Rates Worldwide Average number of children per woman, Hong Kong Special Administrative 1.00 Latvia 1.10 Bulgaria Macao Special Adminstrative Slovenia Russian Federation Spain Ukraine Armenia Czech Republic Source: United Nations, World Population Prospects: The 2002 Revision (medium scenario), Population Reference Bureau
206 Trends in Aging, by World Region Population Ages 65 and Older Percent World Africa Asia Latin America/ Caribbean More Developed Regions Source: United Nations, World Population Prospects: The 2002 Revision (medium scenario), Population Reference Bureau
207 Notes on Trends in Aging, by World Region By 2025, over 20 percent of the population in more developed regions will be ages 65 and older. By 2025, one-tenth of the world s population will be over age 65. Asia will see the proportion of its elderly population almost double, from about 6 percent in 2000 to 10 percent in In absolute terms, this represents a stark increase in just 25 years: from about 216 million to nearly 475 million older people Population Reference Bureau
208 Trends in Life Expectancy, by Region Life Expectancy at Birth, in Years Africa Asia Latin America/Caribbean More Developed Regions World Source: United Nations, World Population Prospects: The 2002 Revision (medium scenario), Population Reference Bureau
209 Notes on Trends in Life Expectancy, by Region Currently, infants born around the world can expect to live an average of 65 years up nine years since the late 1960s. Asia has experienced the largest increase in life expectancy since the late 1960s: from 54 years to 67 years. Life expectancy varies widely by region. In more developed countries, life expectancy averages 76 years, compared with only 49 years in Africa Population Reference Bureau
210 Millions Percent increase per year Trends in Population Growth Worldwide Population Increase and Growth Rate, Five-Year Periods Net population added per year Annual population growth rate Source: United Nations, World Population Prospects: The 2002 Revision (medium scenario), Population Reference Bureau
211 Notes on Trends in Population Growth Worldwide This figure illustrates the lag between changes in the rate of growth and the net increase in population per year. Over the period , the population growth rate declined (a reflection of declining fertility), yet millions of people were added to the world s population (which peaked around 1985, when 87 million people were added each year). From 2000 on, the growth rate will continue to decline. Between 2015 and 2020, we will still be adding 69 million people each year. Why? Because the generation of women now having their children is very large as the result of high fertility in their mothers and grandmothers generations Population Reference Bureau
212 Trends in Urbanization, by Region Urban Population Percent World Africa Asia Latin America/ Caribbean More Developed Regions Source: United Nations, World Urbanization Prospects: The 2001 Revision (medium scenario), Population Reference Bureau
213 Notes on Trends in Urbanization, by Region The world is becoming increasingly urban. By 2010, half of the world s population is expected to live in urban areas. Typically, the population living in towns of 2,000 or more, or in national and provincial capitals, is classified as urban. Currently, world regions differ greatly in their levels of urbanization. In more developed regions and in Latin America and the Caribbean, over 70 percent of the population is urban, whereas in Africa and Asia, under 40 percent of the population is urban. By 2030, however, the urban proportion of these two regions will exceed 50 percent. By 2030, roughly 60 percent of the world s population will be living in urban areas Population Reference Bureau
214 Urbanization in Central America Population Living in Urban Areas Percent Costa Rica El Salvador Guatemala Honduras Nicaragua Panama (projected) Source: United Nations, World Urbanization Prospects: The 2001 Revision (medium scenario), Population Reference Bureau
215 Notes on Urbanization in Central America Urbanization in Latin America is a tale of two regions. Central American countries are urbanizing rapidly, at a pace similar to that of their South American neighbors 20 years ago Population Reference Bureau
216 Women and Aging World Population, by Sex, at Specified Age Groups, 2025 Percent All Ages Ages 60+ Ages 80+ Women Men Source: United Nations, World Population Prospects:The 2002 Revision (medium scenario), Population Reference Bureau
217 Notes on Women and Aging The figure above depicts what demographers refer to as the feminization of aging. Although women make up half of world population, by the end of the next quarter century, they will account for more than half (54 percent) of people ages 60 and older, and 63 percent of very old people (80 and older) Population Reference Bureau
218 Women of Childbearing Age Number of Women 15 to 49 Billions Source: United Nations, World Population Prospects: The 2002 Revision (medium scenario), Population Reference Bureau
219 Notes on Women of Childbearing Age The number of women of childbearing ages 15 to 49 more than doubled between 1950 and 1990: from 620 million to over 1.3 billion. Their numbers are expected to reach over 2 billion by the middle of this century, according to the UN s medium projections. The growing population of women in their childbearing years and their male partners will contribute to future world population growth, even if levels of childbearing continue to decline Population Reference Bureau
220 Billions Children per woman Women of Childbearing Age and Fertility Worldwide Women 15 to 49 Average number of children per woman Source: United Nations, World Population Prospects: The 2002 Revision (medium scenario), Population Reference Bureau
221 Notes on Women of Childbearing Age and Fertility The number of women in their childbearing years has increased since the 1950s and is projected to continue to increase through The number of children per woman has declined since the 1950s and is projected to continue to decline. Even though women have on average fewer children than their mothers, the absolute number of babies being born continues to increase because of the increases in the total number of women of childbearing age Population Reference Bureau
222 World Population Clock 2003 Natural Increase per World More Developed Countries Less Developed Countries Less Developed Countries (less China) Year 80,903, ,337 79,987,144 71,675,164 Day 221,653 2, , ,370 Minute Source: Population Reference Bureau, 2003 World Population Data Sheet Population Reference Bureau
223 World Population Growth, in Billions Number of years to add each billion (year) First Billion All of Human History (1800) Second 123 (1930) Third Fourth Fifth Sixth Seventh Eighth Ninth 33 (1960) 14 (1974) 13 (1987) 12 (1999) 14 (2013) 15 (2028) 26 (2054) Sources: First and second billion: Population Reference Bureau. Third through ninth billion: United Nations, World Population Prospects: The 1998 Revision (medium scenario) Population Reference Bureau
224 World Population Growth Through History Billions Old Stone Age New Stone Age Bronze Age Iron Age Modern Age Middle Ages Future Black Death The Plague million 7000 years B.C B.C B.C B.C B.C B.C B.C. A.D. 1 A.D A.D A.D. A.D A.D Source: Population Reference Bureau; and United Nations, World Population Projections to 2100 (1998) Population Reference Bureau

225 Declining Infant Mortality Rates 2003 Population Reference Bureau
226 When IMR declines, fertility rates drop soon after 2003 Population Reference Bureau
227 Stage 3: Later Industrial Birth rates decline sharply (to about 15) Death rates decline a bit more (to about 10 or less) Note growth still occurs, but at a reduced and declining rate MDCs = starts in late 1800s LDCs = starts after 1980s* * Or hasn t started yet 2003 Population Reference Bureau
228 Stage Three: Further improvements in medicine lower death rates more; raise life expectancies Measles Mortality, US, since 1900 TB Mortality, US, since Population Reference Bureau

229 Rapidly increasing urbanization in world LDCs today Population Classified as Urban 2003 Population Reference Bureau


230 Strong inverse relationship between female literacy and fertility rates, observed globally Increasing availability and use of modern contraception in most LDCs since 1970s 2003 Population Reference Bureau
231 Stage 4: Post-Industrial Birth rates and death rates both low (about 10) Population growth very low or zero MDCs = starts after 1970s LDCs = hasn t started yet Stage 5 (?): Hypothesized (not in Classic DTM) Much of Europe now or soon in population decline as birth rates drop far below replacement level 2003 Population Reference Bureau
232 Key Population Indicators for Selected Countries 2003 Population Reference Bureau
233 Practice with real pyramids-what Stage of DTM? DTM STAGE: DTM STAGE: DTM STAGE: DTM STAGE: 2003 Population Reference Bureau
234 Differences in DTM experience: MDCs & LDCs Faster decline in death rates Tech improvements diffused from MDCs & applied rapidly in LDCs post-ww2 Longer lag between decline in deaths and decline in births Stage 3 slower start in LDCs where econ growth is delayed Higher max rates of growth in LDCs Over 3.5% peak RNI in Mauritius and Mexico; only 1.3% peak in Sweden 2003 Population Reference Bureau

235 Age structures today in LDCs are much younger than MDCs experienced leading to prolonged Demographic Momentum expected growth of pop. long after fertility declines Percentage of Population Under Age Population Reference Bureau
236 Summary of DTM for LDCs Industrializing LDCs with some economic development follow DTM more closely; now in Stage Three. Most like MDCs in places where female literacy has increased the most. Lowest-income countries have high birth rates and deaths are leveling off at higher rates than DTM predicts (Stage Two). In some LDCs, death rates starting to increase (epidemics, worsening poverty) 2003 Population Reference Bureau

237 AZ: Breakdown by Ethnic Population Groups within MDCs may have varying pop patterns 2003 Population Reference Bureau
 or online materials posted by Keith Montgomery, Dept of Geology and Geography, Univ of Wisconsin - Marathon County (http://www.uwmc.uwc.")
238 2003 Population Reference Bureau Demographic Transition Model Explaining Spatial Patterns of World Population Growth Many graphics in this powerpoint are from Michael Kuby et al., Human Geography in Action (instructor package) or online materials posted by Keith Montgomery, Dept of Geology and Geography, Univ of Wisconsin - Marathon County (
239 DTM based on historical patterns in Europe & other MDCs 2003 Population Reference Bureau
240 DTM only predicts changes in birth/death rates over time Observed changes in RNI correlate to changes in economic development Thus, DTM implies: The greater the wealth, the lower the RNI... but use caution describing this relationship 2003 Population Reference Bureau
2. In what stage of the demographic transition model are most LDC? a. First b. Second c. Third d. Fourth e. Fifth
 1. The three largest population clusters in the world are in a. East Asia, South Asia, Southeast Asia b. East Asia, South Asia, South America c. Africa, South Asia, East Asia d. Australia, South Asia,
1. GEOGRAPHIC ANALYSIS OF POPULATION Population & Migration
 1. GEOGRAPHIC ANALYSIS OF POPULATION Population & Migration BASICS OF DEMOGRAPHY Demography - study of: POPULATION DISTRIBUTION Distribution: (Distribution is ) Living space of humans on earth s surface:
Chapter 3: Migration John Wiley & Sons, Inc. All rights reserved.
 Chapter 3: Migration Field Note: Risking Lives for Remittances In 1994, I was on my way to Rosenstiel Marine Center on Virginia Key, off the coast of Miami, Florida. I noticed an overcrowded boat, with
Slide 1. Slide 2. Slide 3. Chapter 3: Migration. Key Question. What is migration? Field Note: Risking Lives for Remittances
 Slide 1 Chapter 3: Migration Slide 2 Field Note: Risking Lives for Remittances In 1994, I was on my way to Rosenstiel Marine Center on Virginia Key, off the coast of Miami, Florida. I noticed an overcrowded
Demography. Spatial Distribution and Movement. Where are they? Where are they going?
 Population Demography Spatial Distribution and Movement Where are they? Where are they going? Scale of inquiry Global International National Local Global Trends Where are they growing fastest / slowest?
Levels and trends in international migration
 Levels and trends in international migration The number of international migrants worldwide has continued to grow rapidly over the past fifteen years reaching million in 1, up from million in 1, 191 million
 http://www.youtube.com/watch?v=ymwwrgv_aie Demographics Demography is the scientific study of population. Demographers look statistically as to how people are distributed spatially by age, gender, occupation,
15. Of the following five countries, the highest TRF would be found in: a. China b. Columbia c. Denmark d. Rwanda e. Japan
 1. Which of the following best describes a push factor that would cause rural people in the Less Developed World to leave their farms and migrate away from their home community? a. Guest worker policies
10/20/2015. Chapter 3: Migration. Terms of Migration. Migration
 Chapter 3: Migration Migration Terms of Migration Movement is inherently geographical. All movement involves leaving home. Three types of movement: 1. Cyclic Regular sequences of short moves within a local
Unit 3 - Geography of Population: Demography, Migration
 Unit 3 - Geography of Population: Demography, Migration 38:180 Human Geography 2.1 Demography Demography is the study of the size and composition of population, including the dynamics of population change,
MULTIPLE CHOICE. Choose the one alternative that best completes the statement or answers the question.
 Exam Name MULTIPLE CHOICE. Choose the one alternative that best completes the statement or answers the question. 1) Geographers define overpopulation as A) too many people compared to resources. B) too
Migration Review CH. 3
 Migration Review CH. 3 Migration Big Ideas Types of Movement Cyclic, Periodic, & Migration Types of Migration Forced & Voluntary Rovenstein s Laws of Migration Gravity Model Push and Pull Factors Political
STATISTICAL REFLECTIONS
 World Population Day, 11 July 217 STATISTICAL REFLECTIONS 18 July 217 Contents Introduction...1 World population trends...1 Rearrangement among continents...2 Change in the age structure, ageing world
Age Cohort A group of people who share the same age. age distribution The age structure of a population.
 Anti- Natalist A government policy concerned with limiting population growth. Agriculture Revolution The time when human begins first domesticated plants and animals and no longer relied entirely on hunting
FRQ 1 Population growth rates vary around the world. Given this fact, answer the following:
 AP Human Geography Unit II. Population and Migration Free Response Questions FRQ 1 Population growth rates vary around the world. Given this fact, answer the following: A) Explain the difference between
Population & Migration
 Population & Migration Population Distribution Humans are not distributed evenly across the earth. Geographers identify regions of Earth s surface where population is clustered and regions where it is
Demography. Demography is the study of human population. Population is a dynamic open systems with inputs, processes and outputs.
 Population Demography Demography is the study of human population. Population is a dynamic open systems with inputs, processes and outputs. This means that change constantly occurs in population numbers,
Population & Migration
 Population & Migration Population Distribution Humans are not distributed evenly across the earth. Geographers identify regions of Earth s surface where population is clustered and regions where it is
Economic Geography. World Population. Unit 2: Population. World Population. World Cartogram
 I. INTRODUCTION TO POPULATION Economic Geography Unit 2: Population A. Aspects of Population (3) 1. Number of People 2. Spatial Distribution 3. Demographic Composition B. Demography World Cartogram II.
An Introduction to Human Geography The Cultural Landscape, 8e James M. Rubenstein. Migration. PPT by Abe Goldman modified DKroegel
 An Introduction to Human Geography The Cultural Landscape, 8e James M. Rubenstein Migration PPT by Abe Goldman modified DKroegel The process by which characteristics spreads across space from one place
World population. World population. World population. World population. World population. World population billion by 2100
 http://www.theworldpopulation.com/ 5-11 billion by 2100 97% of growth is in developing countries living in acute poverty Projections vary based on assumptions regarding: demographic transition in developing
brownd Monday, May 9, :05:58 AM CT 58:b0:35:ac:27:98 Popula'on
 Popula'on Basic Terms Demography Immigra'on Emigra'on Ecumene Non- Ecumene Basic Terms Demography- Study of human popula'on Immigra'on- people coming into a country Emigra'on- people leaving a country
Some important terms and Concepts in population dynamics
 By Dr. Sengupta, CJD International School, Braunschweig Some important terms and Concepts in population dynamics DEMOGRAPHY- is the study of population Population Density Population per unit of land area;
I N T R O D U C T I O N
 REFUGEES by numbers 2002 I N T R O D U C T I O N At the start of 2002 the number of people of concern to UNHCR was 19.8 million roughly one out of every 300 persons on Earth compared with 21.8 million
CHAPTER 6: WHERE AND WHY PEOPLE MOVE
 CHAPTER 6: WHERE AND WHY PEOPLE MOVE CHAPTER OUTLINE I. Introduction II. Perception and Migration A. Absolute and relative distance 1. Absolute distance can be read on a map or globe 2. Relative distance
Chapter 5. World Population. Population. Population Geography. Population geography. Emigration Immigration Demography. What s the world population?
 CO.6 Chapter 5 Population Geography Population Population geography Distribution of humankind Emigration Immigration Demography Specific group characteristics World Population What s the world population?
Chapter 3: Migration. The Cultural Landscape: An Introduction to Human Geography
 Chapter 3: Migration The Cultural Landscape: An Introduction to Human Geography E.G. RAVENSTEIN British sociologist 11 LAWS OF MIGRATION are based on the Gravity Model = the influence of a location on
3/21/ Global Migration Patterns. 3.1 Global Migration Patterns. Distance of Migration. 3.1 Global Migration Patterns
 3.1 Global Migration Patterns Emigration is migration from a location; immigration is migration to a location. Net migration is the difference between the number of immigrants and emigrants. Geography
Summary of the Results
 Summary of the Results CHAPTER I: SIZE AND GEOGRAPHICAL DISTRIBUTION OF THE POPULATION 1. Trends in the Population of Japan The population of Japan is 127.77 million. It increased by 0.7% over the five-year
SS 11: COUNTERPOINTS CH. 13: POPULATION: CANADA AND THE WORLD NOTES the UN declared the world s population had reached 6 billion.
 SS 11: COUNTERPOINTS CH. 13: POPULATION: CANADA AND THE WORLD NOTES 1 INTRODUCTION 1. 1999 the UN declared the world s population had reached 6 billion. 2. Forecasters are sure that at least another billion
MIGRATION. Chapter 3 Key Issue 2. Textbook: p Vocabulary: #31-34
 MIGRATION Chapter 3 Key Issue 2 Textbook: p. 84-91 Vocabulary: #31-34 ENERGIZER Do Now: review the main ideas from Chapter 3, Key Issue 2 (p. 84-91) Do Next: make sure you have good definitions for vocabulary
GLOBAL RISKS OF CONCERN TO BUSINESS WEF EXECUTIVE OPINION SURVEY RESULTS SEPTEMBER 2017
 GLOBAL RISKS OF CONCERN TO BUSINESS WEF EXECUTIVE OPINION SURVEY RESULTS SEPTEMBER 2017 GLOBAL RISKS OF CONCERN TO BUSINESS Results from the World Economic Forum Executive Opinion Survey 2017 Survey and
Unit II Migration. Unit II Population and Migration 21
 Unit II Migration 91. The type of migration in which a person chooses to migrate is called A) chain migration. B) step migration. C) forced migration. D) voluntary migration. E. channelized migration.
Human Population Growth Through Time
 Human Population Growth Through Time Current world population: 7.35 Billion (Nov. 2016) http://www.worldometers.info/world-population/ 2012 7 billion 1999 13 years 12 years 1974 1927 1804 13 years 14 years
The National Police Immigration Service (NPIS) forcibly returned 412 persons in December 2017, and 166 of these were convicted offenders.
 forcibly returned 412 persons in December 2017, and 166 of these were convicted offenders.") Monthly statistics December 2017: Forced returns from Norway The National Police Immigration Service (NPIS) forcibly returned 412 persons in December 2017, and 166 of these were convicted offenders. The
Monthly statistics December 2017: Forced returns from Norway The National Police Immigration Service (NPIS) forcibly returned 412 persons in December 2017, and 166 of these were convicted offenders. The
Population Growth & Its impacts. PAD 6838/ 7865 Lecture 3
 Population Growth & Its impacts PAD 6838/ 7865 Lecture 3 Organization World Population Growth Growth pattern: Urban and rural Population growth and poverty Solutions to population growth World Population
Migration PPT by Abe Goldman
 Chapter 3 Migration PPT by Abe Goldman Key Issue 1 / EQ / Purpose Why do people migrate? Migration Terms Migration Form of relocation diffusion involving permanent move to a new location. Example: Family
Migration. What is Migration? Movement. Chapter 3. Key Question: Cyclic Movement movement away from home for a short period.
 Migration Chapter 3 Key Question: What is Migration? Movement Cyclic Movement movement away from home for a short period. Commuting Seasonal movement Nomadism Periodic Movement movement away from home
HUMAN RESOURCES IN R&D
 HUMAN RESOURCES IN R&D This fact sheet presents the latest UIS S&T data available as of July 2011. Regional density of researchers and their field of employment UIS Fact Sheet, August 2011, No. 13 In the
Question 2: Reasons for and consequences of aging populations in Developing Countries Question 3: Muslim Population growth in Europe
 Unit 2 FRQ Practice 2013 - Question 2: Reasons for and consequences of aging populations in Developing Countries 2012 - Question 3: Muslim Population growth in Europe 2011 - Question 2: Malthusian Theory
CHAPTER 3: MIGRATION. APHUG BHS Ms. Justice
 CHAPTER 3: MIGRATION APHUG BHS Ms. Justice Key Question 3.3 Where do people migrate? Global Migration Flows Global-scale migration across international boundaries and between world regions Explorers played
Economic Geography Chapter 10 Development
 Economic Geography Chapter 10 Development Development: Key Issues 1. Why Does Development Vary Among Countries? 2. Where Are Inequalities in Development Found? 3. Why Do Countries Face Challenges to Development?
Population. Thursday, March 19, Geography 05: Population and Migration. Population geography. Emigration: Immigration:
 Thursday, March 19, 2015 Geography 05: Population and Migration Population Population geography Distribution of humankind Emigration: The flow of people out of a place Immigration: The flow of people into
Migration and Demography
 Migration and Demography Section 2.2 Topics: Demographic Trends and Realities Progressively Ageing Populations Four Case Studies Demography and Migration Policy Challenges Essentials of Migration Management
Population and Migration. Chapters 2 and 3 Test Review
 Population and Migration Chapters 2 and 3 Test Review 1. What is land suited for agriculture? 1. Farm Land 2. Brain Drain 3. Arable Land 4. Crop Land 1. What is land suited for agriculture? 1. Farm Land
Chapter 3: Migration. General Characteristics Ravenstein s Laws Zelinsky s Migration Transition
 Chapter 3: Migration General Characteristics Ravenstein s Laws Zelinsky s Migration Transition Mobility (the ability to move from one place to another) regular non-permanent movements cyclical or circulation
Human Resources in R&D
 NORTH AMERICA AND WESTERN EUROPE EAST ASIA AND THE PACIFIC CENTRAL AND EASTERN EUROPE SOUTH AND WEST ASIA LATIN AMERICA AND THE CARIBBEAN ARAB STATES SUB-SAHARAN AFRICA CENTRAL ASIA 1.8% 1.9% 1. 1. 0.6%
Studying Populations II
 GEOG 247 Cultural Geography Studying Populations II Projected Population Change 2010-2100 Prof. Anthony Grande Hunter College CUNY AFG 2015 From US News and World Report article using UN data, Oct., 2014
CHAPTER I: SIZE AND GEOGRAPHICAL DISTRIBUTION OF THE POPULATION
 CHAPTER I: SIZE AND GEOGRAPHICAL DISTRIBUTION OF THE POPULATION 1. Trends in the Population of Japan The population of Japan is 127.77 million. It increased by 0.7% over the five-year period, the lowest
irat Unit 1 News? Missed questions? Does any team want to appeal? Population Pattern, Data World Population Growth Through History
 Unit 1 News? Population Pattern, Data 1 2 irat This is a closed-book, no notes test! You have 10 minutes to complete the test. Circle the correct answers to each question on the answer sheet provided.
The Demography of the Labor Force in Emerging Markets
 The Demography of the Labor Force in Emerging Markets David Lam I. Introduction This paper discusses how demographic changes are affecting the labor force in emerging markets. As will be shown below, the
C OVER STORY OVERPOPULATION: MYTHS AND REALITY. Text: Olga Irisova
 C OVER STORY OVERPOPULATION: MYTHS AND REALITY Text: Olga Irisova 1/11 W OR LD EC ONOMIC JOURNAL #11 2013 OVER THE PAST 54 YEARS, THE EARTH S POPULATION HAS MORE THAN DOUBLED, AND ACCORDING TO A RECENT
Last Time Industrialization in the late 19th Century up through WWII Import Substitution Industrialization (ISI) (1940s 1970s) Export Promotion
 (1940s 1970s) Export Promotion") Last Time Industrialization in the late 19th Century up through WWII Import Substitution Industrialization (ISI) (1940s 1970s) Export Promotion Industrialization TODAY Population growth, distribution,
Last Time Industrialization in the late 19th Century up through WWII Import Substitution Industrialization (ISI) (1940s 1970s) Export Promotion Industrialization TODAY Population growth, distribution,
Introduction: The State of Europe s Population, 2003
 Introduction: The State of Europe s Population, 2003 Changes in the size, growth and composition of the population are of key importance to policy-makers in practically all domains of life. To provide
World Map Title Name. Russia. United States. Japan. Mexico. Philippines Nigeria. Brazil. Indonesia. Germany United Kingdom. Canada
 214 P Gersmehl Teachers may copy for use in their classrooms. Contact pgersmehl@gmail.com regarding permission for any other use. World Map Title Name Canada United States Mexico Colombia Ecuador Haiti
Supplementary Notes: (PJ Shlachtman, Miller book) Human Population: Growth, Demography, and Carrying Capacity
 Human Population: Growth, Demography, and Carrying Capacity") Supplementary Notes: (PJ Shlachtman, Miller book) Human Population:, Demography, and Carrying Capacity Factors Affecting Human Population Size Pop. size is affected by birth s, death s, emigration and
Supplementary Notes: (PJ Shlachtman, Miller book) Human Population:, Demography, and Carrying Capacity Factors Affecting Human Population Size Pop. size is affected by birth s, death s, emigration and
Pakistan 2.5 Europe 11.5 Bangladesh 2.0 Japan 1.8 Philippines 1.3 Viet Nam 1.2 Thailand 1.0
 173 People Snapshots Asia and the Pacific accounts for nearly 55% of global population and 6 of the world s 10 most populous economies. The region s population is forecast to grow by almost 1 billion by
World Refugee Survey, 2001
 World Refugee Survey, 2001 Refugees in Africa: 3,346,000 "Host" Country Home Country of Refugees Number ALGERIA Western Sahara, Palestinians 85,000 ANGOLA Congo-Kinshasa 12,000 BENIN Togo, Other 4,000
Migration! Before we start: DO NOW IN YOUR NOTES. Why have and do people move across time and space?
 Migration! Before we start: DO NOW IN YOUR NOTES. Why have and do people move across time and space? One day you will probably migrate away from Chicagoland area What will the catalyst for movement be?
World Population A.D World Population from the Beginnings to the Present. Words
 1 Today, about 6 billion people live on our earth. Each year, the world s population grows by about 80 million. If it continues to grow at such a rate the world s population will reach 9 billion by the
Advanced Copy. Not for Immediate Release. Embargoed until: 21 June 2017, 11 am EDT
 Advanced Copy. Not for Immediate Release. Embargoed until: 21 June 2017, 11 am EDT ESA/P/WP/248 Department of Economic and Social Affairs Population Division World Population Prospects The 2017 Revision
Migration. Chapter 3
 Migration Chapter 3 Migration Migration A change in residence that is intended to be permanent. Emigration-leaving a country. Immigration-entering a country. Little Haiti, Miami, Florida On average, Americans
A GLOBAL PERSPECTIVE ON RESEARCH AND DEVELOPMENT
 UNESCO Institute for Statistics A GLOBAL PERSPECTIVE ON RESEARCH AND DEVELOPMENT The UNESCO Institute for Statistics (UIS) works with governments and diverse organizations to provide global statistics
Chapter 18 Development and Globalization
 Chapter 18 Development and Globalization 1. Levels of Development 2. Issues in Development 3. Economies in Transition 4. Challenges of Globalization Do the benefits of economic development outweigh the
Population Growth and California s Future. Hans Johnson
 Population Growth and California s Future Hans Johnson Outline California s rapid growth Population diversity Implications for policy 2 California Has a Large and Growing Population 40,000 Population (in
The Multidimensional Financial Inclusion MIFI 1
 2016 Report Tracking Financial Inclusion The Multidimensional Financial Inclusion MIFI 1 Financial Inclusion Financial inclusion is an essential ingredient of economic development and poverty reduction
Unit 2 Test Population and Migration
 Unit 2 Test Population and Migration 1. Geographers might characterize as overpopulated a country where a. There are too many people according to a standard economic measure of poverty. b. The population
Proposed Indicative Scale of Contributions for 2016 and 2017
 October 2015 E Item 16 of the Provisional Agenda SIXTH SESSION OF THE GOVERNING BODY Rome, Italy, 5 9 October 2015 Proposed Indicative Scale of Contributions for 2016 and 2017 Note by the Secretary 1.
birth control birth control brain drain birth rate coastal plain commuting Consciously preventing unwanted pregnancies.
 birth control birth control Consciously preventing unwanted pregnancies. Consciously preventing unwanted pregnancies. birth rate brain drain Scientists from Britain to America The number of live births
Chapter 6: Human Population & Its Impact How many is too many? 7 billion currently; 1.6 mill. more each week ~2.4 bill. more by 2050 Developing 82%
 Chapter 6: Human Population & Its Impact How many is too many? 7 billion currently; 1.6 mill. more each week ~2.4 bill. more by 2050 Developing 82% of population Developed high resource use; (more coming
Translation from Norwegian
 Statistics for May 2018 Forced returns from Norway The National Police Immigration Service (NPIS) forcibly returned 402 persons in May 2018, and 156 of these were convicted offenders. The NPIS is responsible
1 THICK WHITE SENTRA; SIDES AND FACE PAINTED TO MATCH WALL PAINT: GRAPHICS DIRECT PRINTED TO SURFACE; CLEAT MOUNT TO WALL CRITICAL INSTALL POINT
 Map Country Panels 1 THICK WHITE SENTRA; SIDES AND FACE PAINTED TO MATCH WALL PAINT: GRAPHICS DIRECT PRINTED TO SURFACE; CLEAT MOUNT TO WALL CRITICAL INSTALL POINT GRAPHICS PRINTED DIRECT TO WHITE 1 THICK
Return of convicted offenders
 Monthly statistics December : Forced returns from Norway The National Police Immigration Service (NPIS) forcibly returned 869 persons in December, and 173 of these were convicted offenders. The NPIS forcibly
Maps. Pictorial representations of indices of elements that affect the survival, growth and development of infants around the world.
 Maps Pictorial representations of indices of elements that affect the survival, growth development of infants around the world. Maps 1. THE EARLY YEARS PAGE 68 2. WOMEN S STATUS = CHILDREN S STATUS PAGE
Delays in the registration process may mean that the real figure is higher.
 Monthly statistics December 2013: Forced returns from Norway The National Police Immigration Service (NPIS) forcibly returned 483 persons in December 2013. 164 of those forcibly returned in December 2013
Global Prevalence of Adult Overweight & Obesity by Region
 Country Year of Data Collection Global Prevalence of Adult Overweight & Obesity by Region National /Regional Survey Size Age Category % BMI 25-29.9 %BMI 30+ % BMI 25- %BMI 30+ 29.9 European Region Albania
I. LEVELS AND TRENDS IN INTERNATIONAL MIGRANT STOCK
 I. LEVELS AND TRENDS IN INTERNATIONAL MIGRANT STOCK A. INTERNATIONAL MIGRANT STOCK BY DEVELOPMENT GROUP The Population Division estimates that, worldwide, there were 214.2 million international migrants
SEVERANCE PAY POLICIES AROUND THE WORLD
 SEVERANCE PAY POLICIES AROUND THE WORLD SEVERANCE PAY POLICIES AROUND THE WORLD No one likes to dwell on lay-offs and terminations, but severance policies are a major component of every HR department s
Pages What is cultural diffusion? 2. What is diversity?
 10.24.16 Pages 96-97 1. What is cultural diffusion? 2. What is diversity? POPULATION & MOVEMENT Core Concept 6 Population Growth World Population = ~7 Billion Demographers are people who study human populations
AUSTRALIA S REFUGEE RESPONSE NOT THE MOST GENEROUS BUT IN TOP 25
 19 July 2013 AUSTRALIA S REFUGEE RESPONSE NOT THE MOST GENEROUS BUT IN TOP 25 Australia is not the world s most generous country in its response to refugees but is just inside the top 25, according to
Trademarks FIGURE 8 FIGURE 9. Highlights. Figure 8 Trademark applications worldwide. Figure 9 Trademark application class counts worldwide
 Trademarks Highlights Applications grew by 16.4% in 2016 An estimated 7 million trademark applications were filed worldwide in 2016, 16.4% more than in 2015 (figure 8). This marks the seventh consecutive
In small groups work together to create lists of places you can think of that have highest populations. What continents are these countries located
 In small groups work together to create lists of places you can think of that have highest populations. What continents are these countries located on? What about most populated cities? DO NOT USE A PHONE!!!!!
The National Police Immigration Service (NPIS) returned 444 persons in August 2018, and 154 of these were convicted offenders.
 returned 444 persons in August 2018, and 154 of these were convicted offenders.") Monthly statistics August 2018 Forced returns from Norway The National Police Immigration Service (NPIS) returned 444 persons in August 2018, and 154 of these were convicted offenders. The NPIS is responsible
Monthly statistics August 2018 Forced returns from Norway The National Police Immigration Service (NPIS) returned 444 persons in August 2018, and 154 of these were convicted offenders. The NPIS is responsible
2018 Social Progress Index
 2018 Social Progress Index The Social Progress Index Framework asks universally important questions 2 2018 Social Progress Index Framework 3 Our best index yet The Social Progress Index is an aggregate
TOPICS INCLUDE: Population Growth Demographic Data Rule of 70 Age-Structure Pyramids Impact of Growth UNIT 3: POPULATION
 TOPICS INCLUDE: Population Growth Demographic Data Rule of 70 Age-Structure Pyramids Impact of Growth UNIT 3: POPULATION # of individuals in a given area Uniform equally spaced Clumped/Clustered individuals
SLOW PACE OF RESETTLEMENT LEAVES WORLD S REFUGEES WITHOUT ANSWERS
 21 June 2016 SLOW PACE OF RESETTLEMENT LEAVES WORLD S REFUGEES WITHOUT ANSWERS Australia and the world s wealthiest nations have failed to deliver on promises to increase resettlement for the world s neediest
Human Population Growth
 Human Population Growth Clarifying Objective 2.1.4 Explain how ecosystems can be relatively stable over hundreds or thousands of years, even though populations may fluctuate due to availability of food
FERTILITY RATE average number of children a woman will have between 15 and 44 (reproductive age)
") HUMAN GEOGRAPHY: Population Change INDICATORS OF DEVELOPMENT KEY TERMS BIRTH RATE live births per 1000 people per year DEATH RATE deaths per 1000 people per year FERTILITY RATE average number of children
HUMAN GEOGRAPHY: Population Change INDICATORS OF DEVELOPMENT KEY TERMS BIRTH RATE live births per 1000 people per year DEATH RATE deaths per 1000 people per year FERTILITY RATE average number of children
Test Bank for Economic Development. 12th Edition by Todaro and Smith
 Test Bank for Economic Development 12th Edition by Todaro and Smith Link download full: https://digitalcontentmarket.org/download/test-bankfor-economic-development-12th-edition-by-todaro Chapter 2 Comparative
Module 2.1: Population (ch. 2) 1. Using the population pyramid below, identify which stage of growth the country is in?
 1. Using the population pyramid below, identify which stage of growth the country is in?") 1. Using the population pyramid below, identify which stage of growth the country is in? a. Low Growth b. High Growth c. Moderate Growth d. Stationary Growth 2. What type of population density is measured
1. Using the population pyramid below, identify which stage of growth the country is in? a. Low Growth b. High Growth c. Moderate Growth d. Stationary Growth 2. What type of population density is measured
c4hxpxnrz0
 Update Jan 2010 HUMAN RACE In the 6 seconds it takes you to read this sentence, 24 13 people will be added to the Earth s population. o Before you ve finished this letter, that number will reach 1000.
Regional Scores. African countries Press Freedom Ratings 2001
 Regional Scores African countries Press Freedom 2001 Algeria Angola Benin Botswana Burkina Faso Burundi Cape Verde Cameroon Central African Republic Chad Comoros Congo (Brazzaville) Congo (Kinshasa) Cote
People. Population size and growth. Components of population change
 The social report monitors outcomes for the New Zealand population. This section contains background information on the size and characteristics of the population to provide a context for the indicators
Case study: China s one-child policy
 Human Population Case study: China s one-child policy In 1970, China s 790 million people faced starvation The government instituted a onechild policy China s growth rate plummeted In 1984, the policy
ARABPLAST 2019 FACT SHEET
 ARABPLAST 2019 FACT SHEET 1. Exhibition Name ArabPlast 2019 2. Edition / Years 14th / 28 3. Frequency Biannual 4. Description International Trade Show for Plastics, Petrochemicals, Packaging & Rubber Industry
Contracting Parties to the Ramsar Convention
 Contracting Parties to the Ramsar Convention 14/12/2016 Number of Contracting Parties: 169 Country Entry into force Notes Albania 29.02.1996 Algeria 04.03.1984 Andorra 23.11.2012 Antigua and Barbuda 02.10.2005
Full file at
 Chapter 2 Comparative Economic Development Key Concepts In the new edition, Chapter 2 serves to further examine the extreme contrasts not only between developed and developing countries, but also between
Countries for which a visa is required to enter Colombia
 Albania EASTERN EUROPE Angola SOUTH AFRICA Argelia (***) Argentina SOUTH AMERICA Australia OCEANIA Austria Azerbaijan(**) EURASIA Bahrain MIDDLE EAST Bangladesh SOUTH ASIA Barbados CARIBBEAN AMERICA Belgium
Population Composition
 Unit-II Chapter-3 People of any country are diverse in many respects. Each person is unique in her/his own way. People can be distinguished by their age, sex and their place of residence. Some of the other
The NPIS is responsible for forcibly returning those who are not entitled to stay in Norway.
 Monthly statistics December 2014: Forced returns from Norway The National Police Immigration Service (NPIS) forcibly returned 532 persons in December 2014. 201 of these returnees had a criminal conviction