Introduction: The State of Europe s Population, 2003
|
|
|
- Vanessa Howard
- 5 years ago
- Views:
Transcription

1 Introduction: The State of Europe s Population, 2003 Changes in the size, growth and composition of the population are of key importance to policy-makers in practically all domains of life. To provide reliable demographic indicators, as well as insights into the determinants and consequences of current and future demographic trends, has been an ongoing concern of the Council of Europe for many years. The Council s European Population Committee (CAHP) provides these indicators for all member states, and occasionally also non-member states, in its annual publication Recent Demographic Developments in Europe. The Committee also executes policy-oriented population research projects on a wide array of topics relevant to the work programme of the Council. As before, the 2004 edition of the report on Recent Demographic Developments, contains the most comprehensive and up to date Europe-wide demographic information. After this Introduction, which summarises the major outcomes, the report contains an overview of the main indicators in comparative tables, and a methodological note. The CD-Rom presents national reports and demographic indicators by country including detailed time-series data for the main indicators. Population growth and population density According to United Nations estimates, the current size of the world population is 6.3 billion. After a period of historically unprecedented population growth during the 20th century, when the world population grew from 1.6 to 6.1 billion, population growth rates have come down to a current overall level of 1.2% with further declines projected. The bulk of world population increase is concentrated in the developing countries. United Nations population projections, in their so-called medium variant, indicate a world population of 8.9 billion by the year 2050 (UN, 2003). The share of Europe in the world population has declined from some 25% at the beginning of the 20th century to a current 12%, and a further decrease is foreseen. At the beginning of 2004, the total population of Europe is estimated at 815 million. The majority of Europe s population is living in the European Union (56%). The other member states of the Council of Europe account for 43% and the remaining 1% comes to the only nonmember European country, Belarus (cf Map 1). 11
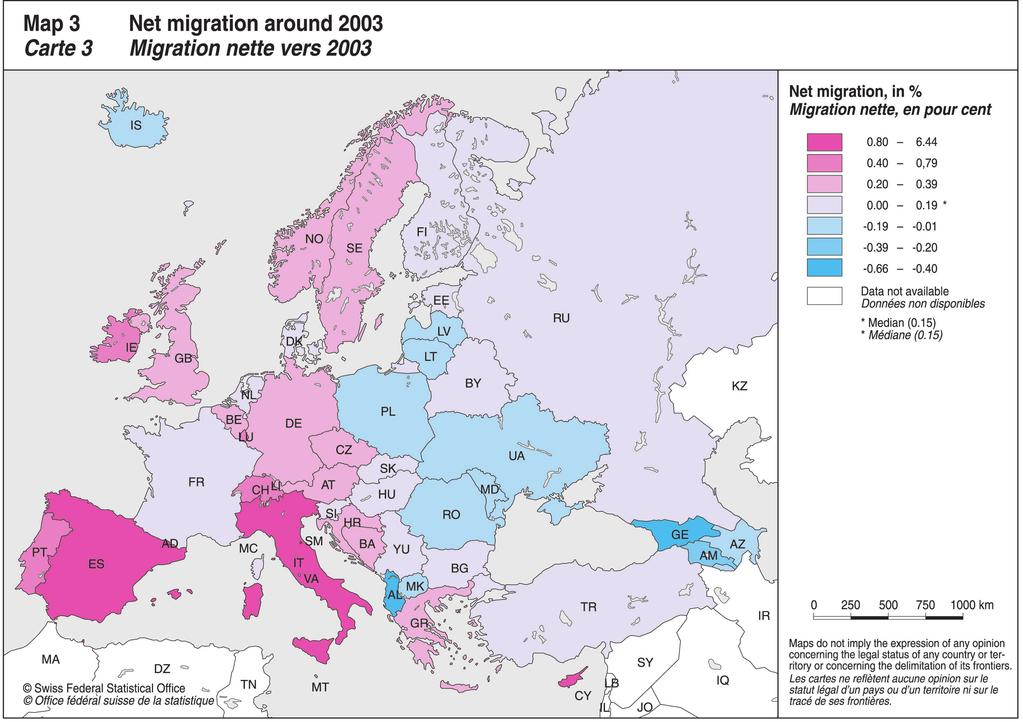
2 Introduction During 2003, the total population of Europe grew by 1.9 million people, corresponding to an annual growth rate of 0.23%. As is shown in Figure 1, this increase is due entirely to the previous EU-15 countries. Both in the ten new EU member states and in the other Council of Europe member states the population slightly declined because of a negative natural increase (more deaths than live births) which is not compensated for by a small surplus of international migration. European countries vary greatly according to geographical size and population. The smallest in population is San Marino, with 29 thousand inhabitants, followed by six other countries with less than one million inhabitants (Liechtenstein, Andorra,, Malta, Luxembourg, and Cyprus).The most populated countries in Europe are the Russian Federation with 144 million, Germany (83 million), (71 million), France (60 million), the United Kingdom (60 million), and Italy (58 million). Together these six countries account for 58% of Europe s total population. Population density, which is a function of a country s land area as well as its population, also fluctuates greatly from one state to another. The most inhabitants per square kilometre live in Malta (1 265), followed by the Netherlands (481), San Marino (471) and Belgium (339). Of the countries with over 50 million inhabitants, the United Kingdom (246) and Germany (231) have relatively high densities. At the other extreme, in northern Europe, (just 3 inhabitants per km 2 ), the Russian Federation (8), (14) and Finland (15) are characterised by very low densities. Variation within countries may however be significant. Of the 39 European countries with more than one million inhabitants, 4 (Ireland, Albania, Spain and ) had the highest rates of population growth in 2003, i.e. around 16 per 1000 of the population at the beginning of that year (see Figure 2). However, the composition of these growth rates varies: for Ireland the contribution of natural increase more or less equals the contribution of net migration, for Albania and natural increase is the main growth component while for Spain net migration accounts for the high growth rate. The second country in transition (after Albania) in the top ten of fastest growing populations is Azerbaijan, due to natural increase. Obviously, these two countries are exceptions to the rule that countries in transition can generally be characterised by negative growth rates. Indeed, all the bottom ten countries belong to this group, starting with Ukraine with a population decrease of 8 per 1000, followed by Georgia ( 6), ( 6), the Russian Federation ( 5), Latvia ( 5), and Lithuania ( 5). Generally speaking natural population growth is declining in Europe; increasingly, natural growth is negative or only marginally positive (cf Map 2). As a result, for Europe as a whole, more people died in 2003 than were born, although this difference is still very small. While in 1990 only three countries (Germany, and Hungary) had a negative natural growth, in 2003 this is true for almost all countries in transition and also for Italy and Greece. The country with currently the highest rate of natural growth is (14), although also in this country this rate is falling slowly but steadily. Most of the countries in transition have been characterised by a modest negative rate of net migration since 1990 (cf Map 3). In 2003, exceptions are the Czech Republic (+2.5), Croatia (2.5), Slovenia (1.8), Hungary (1.6), the Russian Federation (0.7), Belarus (0.5), and the Slovak Republic Figure 1 Population growth in Europe in million Europe EU new EU other COE natural increase net migration total growth 12
3 Introduction Figure 2 Ten highest and ten lowest rates of population growth in Europe in 2003 Ukraine Georgia Russian Federation Latvia Lithuania Estonia Romania Serbia and Montenegro* total Europe France Switzerland Portugal Azerbaijan Italy Spain Albania* Ireland per 1000 population natural increase net migration * Rough estimates. NB Countries with fewer than one million inhabitants have been ignored. (0.3). However, except for Slovenia, net immigration in these countries is not sufficient to compensate for negative natural growth. In 2003 the highest rates of positive net migration can be found in the southern part of Europe: Andorra (70), Cyprus (16), Spain (14), San Marino (14), and Italy (11). Of the older countries of immigration, the Netherlands (0.4) and France (1.0) had the lowest, and Switzerland (4.7) and Belgium (3.4) the highest rates of positive net migration in 2003, the others being (3.2), Austria (3.1), (2.5), Germany (1.9), the United Kingdom (1.7), and Denmark (1.3). Since the 1990s, the group of immigration countries was joined by Spain, Italy, Portugal, Greece, and Ireland, all formerly countries of emigration. Low and declining population growth irreversibly results in changing age structures, with population ageing as its main outcome. Population ageing One of the most outstanding features of Europe s demography is population ageing, i.e the decreasing share of the younger age groups in the overall population and the increasing share of the older age groups. Viewed from a global perspective, Europe is by far the oldest world region. The median age, i.e the age that divides the population into two equal halves, may be used as an indicator of population ageing. Currently the median age is 37.7 in Europe, compared to a world level of 26.4; in the other major world regions the median age is 35.4 in Northern America, 30.7 in Oceania, 26.1 in Asia, 24.2 in Latin America and the Caribbean and 18.3 in Africa (UN, 2003). The current age structure of a population reflects its demographic past and is the inevitable outcome of structural changes in fertility and mortality. As there are no indications of major changes in both these root causes of population ageing in Europe, it 13
4 Introduction 14
5 Introduction follows that population ageing is here to stay. It is self-evident that population ageing poses major challenges to society. As the main thrust of population ageing is yet to come, these challenges can only intensify. Accommodating policies to cope with the multiple impacts of population ageing are urgently needed and should be multifold, inter alia addressing the labour market, social and health care, housing, education, social protection, including pension schemes and social cohesion. The root causes of population ageing are twofold. On the one hand population ageing is fuelled by low fertility, primarily resulting in lower shares of the young. Current fertility levels are below the so-called replacement level of 2.1 children per woman on average in the overwhelming majority of European countries (see below). Low mortality levels and thus increasing life expectancy (below) also trigger population ageing and yield growing shares of the older population. It should be noted that population ageing not only impacts on the extremes of the age structure: it also affects, for instance, the potentially active population in cases where the labour force is ageing as well. In Figure 3 (Age pyramid on January 1st 2003), the current age structure of Europe s population is presented. It is obvious that the largest age groups are those around age 40 (i.e born in the early 1960s). Especially the birth cohorts after 1985 are substantially smaller, as are the birth cohorts from the early 1940s, the latter due to the impacts of the Second World War. In Figure 4 the current highest and lowest ranking countries as regards the shares of the youngest age groups (0-14 years) in the total populations are presented. According to this indicator, by far the youngest countries are Albania (32% of its population was 0-14 years of age in 2000), (29% in 2004) and Azerbaijan (26% in 2004). The lowest shares of younger people are all between 14,2% () and 15.2% (Ukraine). Figure 5 presents similar data for the older age groups (65 years or over) in the total populations. Five of oldest countries, with shares of over 16%, also had low shares of young: Italy, Greece, Germany, and Spain. A summary indicator of ageing is provided by the so-called dependency ratio. Usually two dependency ratios are distinguished: the share of the young population (below age 15) relative to the potentially active population (of 15-64) indicates what may be labelled as the green pressure. Higher green pressures are associated with for instance higher costs for education. The grey pressure gives the share of the older (65-plus) population relative to the potentially active population. A high grey pressure is commonly associated with for instance high cost for (health) care and pensions. Taken together, the green and the grey pressure give the overall dependency ratio, as an indicator of population pressure. It will come as no surprise that young and growing populations have a larger green pressure than older and declining 15
6 Introduction Figure 4 Ten highest and ten lowest percentage 0-14 years of age in Europe, Albania Azerbaijan Ireland TFYR Macedonia* Cyprus Ukraine Czech Republic San Marino Germany Andorra Slovenia Greece Spain Italy * The use in the figures of the term TFYR Macedonia is for descriptive purposes and the convenience of the reader. Figure 5 Ten highest and ten lowest percentage 65 years of age or over in Europe, Italy Greece Germany Belgium Spain Portugal France Croatia Slovak Republic Ireland TFYR Macedonia Liechtenstein Azerbaijan Albania populations, where the grey pressure is most dominant. It should however be noted that for several reasons, these are rough indicators. On the one hand, education usually does not stop at age 15 (increasingly education needs are present throughout the life course: life-long learning); also young people may be active on the labour market before age 15. At the other extreme, some elderly may remain economically active after age 65. Finally it should be noted that the potentially active population includes those that are not economically active for reasons of unemployment, disability, and the like.taking this into account, Figure 6 presents the ranking of countries with respect to the dependency ratio.the highest overall dependency ratios are registered for Albania, and, which also have high shares of young persons and low shares of older persons. The high dependency 16
7 Introduction Figure 6 Ten highest and ten lowest dependency ratios in Europe, Albania France United Kingdom Belgium Denmark Serbia and Montenegro Ukraine Belarus Poland Slovenia Czech Republic Slovak Republic Russian Federation Liechtenstein Andorra ratios in, France and Belgium, on the contrary, are caused by the fact that these countries have high shares of older persons. The low dependency ratios in Ukraine, Slovenia, the Czech Republic and Andorra are mainly caused by the low shares of young persons, while in, the Slovak Republic and Liechtenstein they are basically caused by low shares of the older population. Family formation and dissolution In recent years major changes in family formation and dissolution trends took place, generally with declining numbers of marriages and increasing numbers of divorces and consensual unions; moreover the age at first marriage increased as well. In 2002, the most recent year for which almost all European countries have data available, the total first marriage rate for women below the age of 50 years was 0.62 on average in Europe, which is well below the level of 0.77 in The variation among countries is significant as is shown in Figure 7 and Map 4. Note that two countries (Cyprus and Malta) have a first marriage probability above 1.00, which is due to a strong concentration of the number of marriages contracted in a specific year. Irrespective of these two, all other countries have rates ranging between a low of 0.42 (Estonia) and a high of 0.85 ( The former Yugoslav Republic of Macedonia ). The mean age of women at first marriage shows an even larger variation (Figure 8 and Map 5). On average a European woman married for the first time at the age of 26,5 years in Around 1990 the average age still was about 24,2 years. In 2002 all Scandinavian countries have a pattern of late first marriage which is also the case nowadays for the Netherlands, Spain and Switzerland. Early first marriage is almost completely located in Eastern Europe, i.e. in several of the new EU member states and in other non-eu members of the Council of Europe. Marriage dissolution by divorce also shows strong variation (Figure 9 and Map 6). On average the European probability of having a divorce is 0.32 in 2002 as compared to 0.26 around Very low divorce rates still prevail in countries like Italy, Poland, Spain and. The highest divorce rates are observed in Scandinavia, where marriage rates are relatively low, and the age at marriage high. This Northern European pattern of family formation can also be observed in Belgium and Luxembourg as well as in Austria and the Czech Republic. Fertility Also European fertility patterns changed considerably in recent decades. The major changes may be summarised by a drop in the fertility level (the number of children per woman) as well as the rise in the age at first birth. In addition to low and late fertility, extra-marital fertility became more common. A ranking of the total (period) fertility rates in 2002 is given in Figure 10. For Europe as a whole this rate was 1.8 in 1990 and 1.5 in The list 17

8 Introduction Figure 7 Ten highest and ten lowest total female first marriage rates (below age 50) in Europe, 2002 Cyprus Malta TFYR Macedonia Liechtenstein Denmark Croatia Belarus Romania Portugal Austria Czech Republic Hungary Belgium Latvia Slovenia Estonia ,2 0,4 0,6 0,8 1 1,2 1,4 1,6 1,8
9 Introduction Figure 8 Ten highest and ten lowest mean ages of women at first marriage (below age 50) in Europe, 2002 Denmark Liechtenstein Spain Finland San Marino Switzerland Netherlands Georgia Latvia Slovak Republic Poland Lithuania TFYR Macedonia Romania
10 Introduction Figure 9 Ten highest and ten lowest total divorce rates in Europe, 2002 Liechtenstein Belgium Luxembourg Finland Estonia Denmark Czech Republic Austria San Marino Poland Croatia Italy Azerbaijan Spain TFYR Macedonia Georgia ,1 0,2 0,3 0,4 0,5 0,6
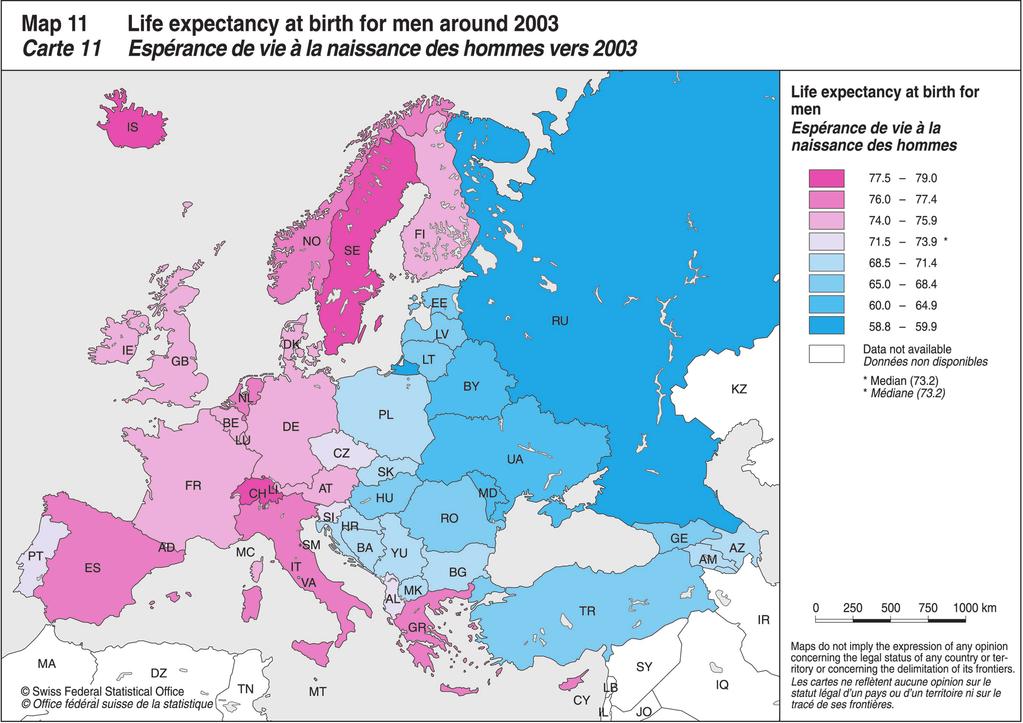
11 Introduction of currently highest ranking countries includes both countries with decreasing rates, like for example, Ireland and, and countries which used to have lower rates more recently, like Denmark, Finland, France, the Netherlands and. Until recently Ireland and were exceptions with respect to the below replacement fertility that was prevalent in Northern and Western Europe already for several decades (see also Map 7). To compensate for period effects, Figure 11 gives the total fertility rate of women born in the year These women are approaching their 40th birthday and only few among them will still have additional children. As the data in Figure 10 may be distorted by accidental period influences that may have taken place in specific countries the information in Figure 11 gives a more accurate overview of country-specific variation in childbearing. First of all it is evident that the fertility level of birth cohort 1965 is substantially higher than the 2002 period level. Obviously the women born in 1965 still used to have a large family, while currently new mothers have smaller families. The data also shows evidence from some EU countries that currently show the lowest fertility, like Austria, Germany, Greece, Italy and Spain, that also the cohort fertility rate is rather low, adding to the doubts about significant fertility recovery. The mean age of women who become mothers for the first time is shown in Figure 12 and Map 8. The graph is based on data that display the age of the mother at her first biological birth (this excludes Belgium, Germany, Luxembourg, Switzerland and the United Kingdom, where the birth order is calculated in marriages). In countries that report the age at the biological first birth, the mean age at first motherhood increased from 24,4 in 1990 to 25,9 in For several years the Netherlands had the oldest mothers but currently San Marino and Spain, and possibly also Italy that has no recent information, have taken over. Very late fertility is typically concentrated in the countries of the European Union and in several of these countries the upward trends are slowing down. Early fertility is mainly concentrated in Eastern Europe; here the upward trend has recently started. Also this increasing age at childbearing adds to the low fertility levels. Extra-marital births are becoming increasingly common (cf Map 9). In 1990 about 15% of all births in Europe occurred to non-married women, and by 2002 the percentage had risen to 28. Figure 13 gives the ranking. Not surprisingly, Scandinavian countries are found in the top panel, some with rates above 50%; but also, France and Georgia have significant shares of extramarital fertility. Low rates are observed in several Mediterranean countries. Mortality Figures 14A and B summarise life expectancy at birth. For European men, life expectancy increased from 70.0 years in 1990 to 72.1 in For women the increase was from 77.0 years to 78.8 (cf Maps 10 and 11). Male life expectancy increased stronger than for women. It should be noted that in Georgia,, Russian Federation, Ukraine and Belarus both male and female Figure 10 Ten highest and ten lowest total fertility rates in Europe, 2002 Ireland France TFYR Macedonia Netherlands Denmark Finland Serbia and Montenegro Bosnia and Herzegovina Belarus Slovenia Slovak Republic San Marino Czech Republic Ukraine 0,0 0,5 1,0 1,5 2,0 2,5 21

12 Introduction Figure 11 Ten highest and ten lowest total cohort fertility rates in Europe, birth cohort 1965 Cyprus Albania Azerbaijan TFYR Macedonia Ireland Serbia and Montenegro Greece Lithuania Switzerland Russian Federation Ukraine Austria Belarus Spain Germany Italy 0,0 22 0,5 1,0 1,5 2,0 2,5 3,0 3,5
13 Introduction Figure 12 Ten highest and ten lowest mean ages of women at first birth in Europe, 2002 San Marino Spain Netherlands France Greece Ireland Denmark Finland Slovenia TFYR Macedonia Estonia Azerbaijan Lithuania Romania Belarus Ukraine

14 Introduction Figure 13 Ten highest and ten lowest extra marital fertility rates in Europe, 2002 Estonia Georgia Denmark France Latvia United Kingdom Italy Switzerland TFYR Macedonia Bosnia and Herzegovina Croatia San Marino Azerbaijan Greece Cyprus
15 Introduction life expectancies declined in this period; Romania and also have low life expectancies for both sexes. While in Georgia and the sex difference is 6.8 and 4.6 years respectively, the difference is 11.5 and 13.2 years respectively in Ukraine and the Russian Federation, which is substantially larger than the about 7 years difference that occurs on average for Europe as a whole. The highest life expectancies for men are observed in some Scandinavian countries, but some Mediterranean countries, like Greece, Italy and Spain, have high life expectancies as well. The ranking for female life expectancy shows similarities with the male ranking, although there is some variation in the sequence. Figure 14A Ten highest and ten lowest life expectancies in Europe, males, latest (around 2002) Liechtenstein Switzerland San Marino Italy Cyprus Spain Greece Georgia Romania Lithuania Latvia Estonia Belarus Ukraine Russian Federation Figure 14B Ten highest and ten lowest life expectancies in Europe, females, latest (around 2002) San Marino Spain Switzerland France Italy Liechtenstein Finland Austria Bosnia and Herzegovina Azerbaijan Romania Georgia Belarus Ukraine Russian Federation
16 Introduction 26
17 Introduction Figure 15 Ten highest and ten lowest infant mortality rates in Europe, 2002 Georgia Romania Russian Federation Serbia and Montenegro Azerbaijan Albania France Austria Malta Andorra Slovenia Finland Liechtenstein Another important mortality indicator is the infant mortality rate. In the period the Europewide rate dropped from 12.7 deaths among children under 1 year of age (per 1000 live born children) to 7.9. Currently is the obvious exception with respect to the level of infant mortality as is shown in Figure 15. Other countries with high infant mortality rates are mainly located in Eastern Europe. The lowest rates are mainly observed in Western or Northern Europe (cf Map 12). 27
18 Introduction T0.1 Main demographic indicators for Europe 2003 Country Population on January 1st, 2004 (thousands) Population growth rate 2003 (%) Rate of natural increase 2003 (%) Rate of net migration 2003 (%) Crude marriage rate 2003 per 1000 Total fertility rate 2003 Infant mortality rate 2003 per 1000 Europa (E) , Member States of the Council of Europe (E) , Albania Andorra 72,3 7,7 0,7 6,4 2,8 1, ,2 0,1 0,3-0,2 4,8 1,35 12,0 Austria 8 140,1 0,4-0,0 0,4 4,6 1,38 4,5 Azerbaijan 8 265,7 0,8 0,8-0,0 6,8 1,59 12,8 Belgium Bosnia and Herzegovina ,3-0,6-0,6... 3,9 1,23 12,3 Croatia ,33 6,3 Cyprus 818,2 2,0 0,4 1,5 13,9 1,50 4,1 Czech Republic ,5 0,1-0,2 0,3 4,8 1,18 3,9 Denmark 5 397,6 0,3 0,1 0,1 6,5 1,76 4,4 Estonia 1 351, Finland 5 219,7 0,3 0,2 0,1 5,0 1,8 3,1 France ,7 0,4 0,4 0,1 4,6 1,89 4,1 Georgia 4 315,2-0,6 0,0-0,6 2,9 1,37... Germany ,7-0,0-0,2 0,2 4,6... 4,2 FRG before unification Former GDR Greece Hungary ,7 0,3 0,4 0,2 4,5 1,28 7,3 290,6 0,8 0,8-0,0 5,1 1,99 2,4 Ireland 4 027, Italy ,2 1,0-0,1 1, Latvia 2 319,2-0,5-0,5 0,0 4,3 1,29 9,4 Liechtenstein 34,3 1,3 0,4 0,9 4,4 1,30 2,9 Lithuania 3 445,9-0,5-0,3-0,2 4,9 1,30 6,8 Luxembourg 451,6 0,7 0,3 0,5 4,4 1,63 4,9 Malta 399,9 0,6 0,2 0,3 5,9 1,46 5, ,4-0,3-0,2... 6,9 1,22 14,4 Netherlands ,0 0,4 0,4 0,0 5,0 1,75 4, ,5 0,6 0,3 0,2 4,9 1,80 3,4 Poland ,6-0,1-0,0-0,0 5,1 1,22 7,0 Portugal ,7 0,6 0,0 0,6 5,1 1,44 4,1 Romania ,3-0,3-0,3-0,0 6,2 1,27 16,7 Russian Federation ,2-0,6-0,6 0,1 7,6 1,32 12,4 San Marino Serbia and Montenegro Slovak Republic 5 380,1 0,2-0,0 0,0 4,8 1,20 7,8 Slovenia 1 996,4 0,1-0,1 0,2 3,4 1,20 4,0 Spain ,9 1,5 0,1 1,4 5,0 1,30 3, ,7 0,4 0,1 0,3 4,4 1,71 3,1 Switzerland 7 364,2 0,7 0,1 0,6 5,5 1,39 4,3 The former Yugoslav Republic of Macedonia 2 029,9... 0,4... 7,1 1,54 11, ,0 1,5 1,4 0,1... 2,43 38,3 Ukraine ,1-0,8-0,8 0,0 7,8 1,20 9,6 United Kingdom Non-Member countries (E) 9 849,1-0,5-0,6 0,1 7,1 1,21 7,7 Belarus 9 849,1-0,5-0,6 0,1 7,1 1,21 7,7 (E) Population estimates based on 2004, figures or failing that, estimated on the basis of the latest available data 28
19 Introduction T0.2 Main demographic indicators for Europe 2002 (or latest available data) Country Population on January 1st, 2003 (thousands) Population growth rate 2002 (%) Rate of natural increase 2002 (%) Rate of net migration 2002 (%) Crude marriage rate 2002 per 1000 Total fertility rate 2002 Infant mortality rate 2002 per 1000 Males Life expectancy at birth Females Latest available year Europa (E) ,2 0, Member States of The Council of Europe (E) ,6 0, Albania 3401,2* ,70 76, Andorra 67,2 1,2 0,8 0,4 2,8 1, ,3-0,1 0,2-0,3 4,3 1,2 14,0 69,90 75, Austria 8 102,2 0,5 0,0 0,3 4,5 1,4 4,1 75,82 81, Azerbaijan 8 202,5 0,7 0,8 0,0 5,1 1,6 12,8 69,61 75, Belgium ,8 0,4 0,1 0,4 3,9 1,6 4,4 75,11 81, Bosnia and Herzegovina 3828,4* ,2 9,4 69,70 75, ,8-0,6-0,6... 3,7 1,2 13,3 68,87 75, Croatia 4 442,2-0,0-0,2 0,2 5,1 1,3 7,0 70,52 77, Cyprus 802,5 1,2 0,4 0,8 13,5 1,5 4,7 77,01 81, Czech Republic ,3-0,0-0,2 0,1 5,2 1,2 4,2 72,03 78, Denmark 5 383,5 0,3 0,1 0,2 6,9 1,7 4,4 74,65 79, Estonia 1 356,0-0,4-0,4 0,0 4,3 1,4 5,7 65,28 77, Finland 5 206,3 0,2 0,1 0,1 5,2 1,7 3,0 74,89 81, France ,0 0,5 0,4 0,1 4,7 1,9 4,1 75,76 83, Georgia 4 342,6-0,7 0,0-0,7 2,9 1,4 23,6 68,00 74, Germany ,7 0,1-0,1 0,3 4,8 1,3 4,2 75,47 81, FRG before unification ,4 4,3 74,41 80, Former GDR ,0 72,41 79, Greece ,4 0,3 0,0 0,3 5,3 1,3 5,1 76,39 81, Hungary ,4-0,3-0,4 0,0 4,5 1,3 7,2 68,29 76, ,5 0,7 0,8-0,1 5,7 1,9 2,2 78,97 82, Ireland 3 963,6 1,6 0,8 0,8 5,1 2,0 5,3 75,16 80, Italy ,1 0,6 0,0 0,6 4,6 1,3 4,5 76,80 82, Latvia 2 331,5-0,6-0,5-0,1 4,2 1,2 9,9 65,91 76, Liechtenstein 33,9 1,0 0,5 0,5 5,1 1,5 2,4 78,71 82, Lithuania 3 462,6-0,4-0,3-0,1 4,7 1,2 7,9 66,48 77, Luxembourg 448,3 1,0 0,4 0,6 4,5 1,6 5,0 74,91 81, Malta 397,3 0,7 0,2 0,3 5,7 1,5 4,0 76,05 81, ,3-0,3-0,2-0,1 6,0 1,2 14,7 64,49 72, Netherlands ,6 0,5 0,4 0,2 5,3 1,7 5,0 75,96 80, ,3 0,6 0,2 0,4 5,3 1,8 3,5 76,43 81, Poland ,5-0,0 0,0 0,0 5,0 1,2 7,5 70,39 78, Portugal ,5 0,8 0,1 0,7 5,4 1,5 5,0 74,00 80, Romania ,8-0,3-0,3 0,0 5,9 1,3 17,2 67,40 74, Russian Federation ,0-0,6-0,7 0,1 7,1 1,3 13,3 58,80 72, San Marino 28,8 2,1 0,3 1,7 7,5 1,2 6,7 77,78 84, Serbia and Montenegro 10662,3* ,74 75, Slovak Republic 5 379,2 0,0 0,0 0,0 4,7 1,2 7,6 69,77 77, Slovenia 1 995,0 0,1-0,1 0,1 3,5 1,2 3,8 73,20 80, Spain ,6 1,7 0,1 1,6 5,1 1,3 4,1 76,90 83, ,8 0,4 0,0 0,3 4,3 1,6 3,3 77,90 82, Switzerland 7 317,9 0,8 0,1 0,7 5,5 1,4 4,5 77,90 83, The former Yugoslav Republic of Macedonia 2 023,7... 0,5... 7,2 1,8 10,2 70,80 75, ,0 1,6 1,4 1,4 6,4 2,5 39,4 66,20 70, Ukraine ,3-0,9-0,8-0,2 6,6 1,1 10,3 62,40 73, United Kingdom ,0 0,4 0,1 0,3 4,9 1,6 5,2 75,92 80, Non-Member countries (E) 9 898,6-0,5-0,6 0,1 6,7 1,2 7,8 62,27 74, Belarus 9 898,6-0,5-0,6 0,1 6,7 1,2 7,8 62,27 74, (E) Population estimates based on 2003, figures or failing that, estimated on the basis of the latest available data (*). 29
STATISTICAL REFLECTIONS
 World Population Day, 11 July 217 STATISTICAL REFLECTIONS 18 July 217 Contents Introduction...1 World population trends...1 Rearrangement among continents...2 Change in the age structure, ageing world
EuCham Charts. October Youth unemployment rates in Europe. Rank Country Unemployment rate (%)
") EuCham Charts October 2015 Youth unemployment rates in Europe Rank Country Unemployment rate (%) 1 Netherlands 5.0 2 Norway 5.5 3 Denmark 5.8 3 Iceland 5.8 4 Luxembourg 6.3... 34 Moldova 30.9 Youth unemployment
EuCham Charts October 2015 Youth unemployment rates in Europe Rank Country Unemployment rate (%) 1 Netherlands 5.0 2 Norway 5.5 3 Denmark 5.8 3 Iceland 5.8 4 Luxembourg 6.3... 34 Moldova 30.9 Youth unemployment
THE EUROPEAN COURT OF HUMAN RIGHTS IN FACTS & FIGURES
 THE EUROPEAN COURT OF HUMAN RIGHTS IN FACTS & FIGURES 2017 This document has been prepared by the Public Relations Unit of the Court, and does not bind the Court. It is intended to provide basic general
European patent filings
 Annual Report 07 - European patent filings European patent filings Total filings This graph shows the geographic origin of the European patent filings. This is determined by the country of residence of
Recent demographic trends
 Recent demographic trends Jitka Rychtaříková Charles University in Prague, Faculty of Science Department of Demography and Geodemography Albertov 6, 128 43 Praha 2, Czech Republic tel.: 420 221 951 420
Annex 1. Technical notes for the demographic and epidemiological profile
 139 Annex 1. Technical notes for the demographic and epidemiological profile 140 The European health report 2012: charting the way to well-being Data sources and methods Data sources for this report include
LMG Women in Business Law Awards - Europe - Firm Categories
 LMG Women in Business Law Awards - Europe - Firm Categories Welcome to the Euromoney LMG Women in Business Law Awards submissions survey 1. Your details First Name Last Name Position Email Address Firm
Overview ECHR
 Overview 1959-2016 ECHR This document has been prepared by the Public Relations Unit of the Court, and does not bind the Court. It is intended to provide basic general information about the way the Court
Measuring Social Inclusion
 Measuring Social Inclusion Measuring Social Inclusion Social inclusion is a complex and multidimensional concept that cannot be measured directly. To represent the state of social inclusion in European
The global and regional policy context: Implications for Cyprus
 The global and regional policy context: Implications for Cyprus Dr Zsuzsanna Jakab WHO Regional Director for Europe Policy Dialogue on Health System and Public Health Reform in Cyprus: Health in the 21
Fertility rate and employment rate: how do they interact to each other?
 Fertility rate and employment rate: how do they interact to each other? Presentation by Gyula Pulay, general director of the Research Institute of SAO Changing trends From the middle of the last century
Gender pay gap in public services: an initial report
 Introduction This report 1 examines the gender pay gap, the difference between what men and women earn, in public services. Drawing on figures from both Eurostat, the statistical office of the European
Overview ECHR
 Overview 1959-2017 ECHR This document has been prepared by the Public Relations Unit of the Court, and does not bind the Court. It is intended to provide basic general information about the way the Court
Index for the comparison of the efficiency of 42 European judicial systems, with data taken from the World Bank and Cepej reports.
 FB Index 2012 Index for the comparison of the efficiency of 42 European judicial systems, with data taken from the World Bank and Cepej reports. Introduction The points of reference internationally recognized
RECENT POPULATION CHANGE IN EUROPE
 RECENT POPULATION CHANGE IN EUROPE Silvia Megyesiová Vanda Lieskovská Abstract Population ageing is going to be a key demographic challenge in many Member States of the European Union. The ageing process
International Trade Union Confederation Pan-European Regional Council (PERC) CONSTITUTION (as amended by 3 rd PERC General Assembly, 15 December 2015)
 CONSTITUTION (as amended by 3 rd PERC General Assembly, 15 December 2015)") 1 International Trade Union Confederation Pan-European Regional Council (PERC) CONSTITUTION (as amended by 3 rd PERC General Assembly, 15 December 2015) I. Principles, aims and objectives. A Pan-European
1 International Trade Union Confederation Pan-European Regional Council (PERC) CONSTITUTION (as amended by 3 rd PERC General Assembly, 15 December 2015) I. Principles, aims and objectives. A Pan-European
Romania's position in the online database of the European Commission on gender balance in decision-making positions in public administration
 Romania's position in the online database of the European Commission on gender balance in decision-making positions in public administration Comparative Analysis 2014-2015 Str. Petofi Sandor nr.47, Sector
The proportion of the UK population aged under 16 dropped below the proportion over state pension age for the first time in (Table 1.
 Population In 2007, there were 6.0 million people resident in the UK, an increase of almost 400,000 (0.6 per cent) on 2006, equivalent to an average increase of around,000 people a day. (Table.) Chapter
Social. Charter. The. at a glance
 The Social Charter at a glance The European Social Charter Human Rights, together, every day The European Social Charter (referred to below as the Charter ) is a treaty of the Council of Europe which sets
Asylum Trends. Appendix: Eurostat data
 Asylum Trends Appendix: Eurostat data Contents Colophon 2 First asylum applications in Europe (EU, Norway and Switzerland) Monthly asylum applications in the EU, Norway and Switzerland 3 First asylum applications
Asylum Trends. Appendix: Eurostat data
 Asylum Trends Appendix: Eurostat data Contents Colophon 2 First asylum applications in Europe (EU, Norway and Switzerland) Monthly asylum applications in the EU, Norway and Switzerland 3 First asylum applications
Asylum Trends. Appendix: Eurostat data
 Asylum Trends Appendix: Eurostat data Contents Colophon 2 First asylum applications in Europe (EU, Norway and Switzerland) Monthly asylum applications in the EU, Norway and Switzerland 3 First asylum applications
Asylum Trends. Appendix: Eurostat data
 Asylum Trends Appendix: Eurostat data Contents Colophon 2 First asylum applications in Europe (EU, Norway and Switzerland) Monthly asylum applications in the EU, Norway and Switzerland 3 First asylum applications
2nd Ministerial Conference of the Prague Process Action Plan
 English version 2nd Ministerial Conference of the Prague Process Action Plan 2012-2016 Introduction We, the Ministers responsible for migration and migration-related matters from Albania, Armenia, Austria,
Migrant population of the UK
 BRIEFING PAPER Number CBP8070, 3 August 2017 Migrant population of the UK By Vyara Apostolova & Oliver Hawkins Contents: 1. Who counts as a migrant? 2. Migrant population in the UK 3. Migrant population
Europe in Figures - Eurostat Yearbook 2008 The diversity of the EU through statistics
 STAT/08/75 2 June 2008 Europe in Figures - Eurostat Yearbook 2008 The diversity of the EU through statistics What was the population growth in the EU27 over the last 10 years? In which Member State is
The European health report Dr Claudia Stein Director Division of Information, Evidence, Research and Innovation (DIR)
") The European health report 2012 Dr Claudia Stein Director Division of Information, Evidence, Research and Innovation (DIR) The European health report 2012 Purposes and four sections of the report 1. Provide
The European health report 2012 Dr Claudia Stein Director Division of Information, Evidence, Research and Innovation (DIR) The European health report 2012 Purposes and four sections of the report 1. Provide
TECHNICAL BRIEF August 2013
 TECHNICAL BRIEF August 2013 GENDER EQUALITY IN TRIPARTITE SOCIAL DIALOGUE IN EUROPE AND CENTRAL ASIA Angelika Muller and Sarah Doyle 1 GOVERNANCE Tripartite social dialogue and gender equality are both
European judicial systems
 European judicial systems Edition 2008 (data 2006): Efficiency and quality of justice European Commission for the Efficiency of Justice (CEPEJ) 10. Prosecutors 10.1. Introduction In Recommendation 2000(19),
The new demographic and social challenges in Spain: the aging process and the immigration
 International Geographical Union Commission GLOBAL CHANGE AND HUMAN MOBILITY The 4th International Conference on Population Geographies The Chinese University of Hong Kong (10-13 July 2007) The new demographic
Migration Report Central conclusions
 Migration Report 2013 Central conclusions 2 Migration Report 2013 - Central conclusions Migration Report 2013 Central conclusions The Federal Government s Migration Report aims to provide a foundation
The Penalty of Life Imprisonment in the Light of European Penitentiary Statistics
 The Penalty of Life Imprisonment in the Light of European Penitentiary Statistics Beata Gruszczyńska 1 Introduction This article provides basic statistical data on prison populations in European countries.
Eurostat Yearbook 2006/07 A goldmine of statistical information
 25/2007-20 February 2007 Eurostat Yearbook 2006/07 A goldmine of statistical information What percentage of the population is overweight or obese? How many foreign languages are learnt by pupils in the
Migration Report Central conclusions
 Migration Report 2012 Central conclusions 2 Migration Report 2012: Central conclusions Migration Report 2012 Central conclusions The Federal Government s Migration Report aims to provide a foundation for
Italy Luxembourg Morocco Netherlands Norway Poland Portugal Romania
 1. Label the following countries on the map: Albania Algeria Austria Belgium Bulgaria Czechoslovakia Denmark East Germany Finland France Great Britain Greece Hungary Iceland Ireland Italy Luxembourg Morocco
8193/11 GL/mkl 1 DG C I
 COUNCIL OF THE EUROPEAN UNION Brussels, 25 March 2011 8193/11 AVIATION 70 INFORMATION NOTE From: European Commission To: Council Subject: State of play of ratification by Member States of the aviation
Migration and Demography
 Migration and Demography Section 2.2 Topics: Demographic Trends and Realities Progressively Ageing Populations Four Case Studies Demography and Migration Policy Challenges Essentials of Migration Management
POPULATION AND MIGRATION
 POPULATION AND MIGRATION POPULATION TOTAL POPULATION FERTILITY DEPENDENT POPULATION POPULATION BY REGION ELDERLY POPULATION BY REGION INTERNATIONAL MIGRATION IMMIGRANT AND FOREIGN POPULATION TRENDS IN
9 th International Workshop Budapest
 9 th International Workshop Budapest 2-5 October 2017 15 years of LANDNET-working: an Overview Frank van Holst, LANDNET Board / RVO.nl 9th International LANDNET Workshop - Budapest, 2-5 October 2017 Structure
Migration Challenge or Opportunity? - Introduction. 15th Munich Economic Summit
 Migration Challenge or Opportunity? - Introduction 15th Munich Economic Summit Clemens Fuest 30 June 2016 What do you think are the two most important issues facing the EU at the moment? 40 35 2014 2015
Council of Europe Development Bank (CEB)
") Council of Europe Development Bank (CEB) Supporting social cohesion across Europe: financing social and affordable housing Viorica REVENCO, ACCA Economist 5 May 2015 viorica.revenco@coebank.org The CEB:
Council of Europe Development Bank (CEB) Supporting social cohesion across Europe: financing social and affordable housing Viorica REVENCO, ACCA Economist 5 May 2015 viorica.revenco@coebank.org The CEB:
Sex-disaggregated statistics on the participation of women and men in political and public decision-making in Council of Europe member states
 Sex-disaggregated statistics on the participation of women and men in political and public decision-making in Council of Europe member states Situation as at 1 September 2008 http://www.coe.int/equality
UNIDEM CAMPUS FOR THE SOUTHERN MEDITERRANEAN COUNTRIES
 UNIDEM CAMPUS FOR THE SOUTHERN MEDITERRANEAN COUNTRIES Venice Commission of Council of Europe STRENGTHENING THE LEGAL CAPACITIES OF THE CIVIL SERVICE IN THE SOUTHERN MEDITERRANEAN COUNTRIES Administrations
ASSOCIATION OF EUROPEAN JOURNALISTS (AEJ)
") ASSOCIATION OF EUROPEAN JOURNALISTS (AEJ) International non profit association Registered under Business No. 0458 856 619 Established by an act dated 23 February 1996 Published in the Annexes to the Moniteur
ASSOCIATION OF EUROPEAN JOURNALISTS (AEJ) International non profit association Registered under Business No. 0458 856 619 Established by an act dated 23 February 1996 Published in the Annexes to the Moniteur
VISA POLICY OF THE REPUBLIC OF KAZAKHSTAN
 VISA POLICY OF THE REPUBLIC OF KAZAKHSTAN Country Diplomatic Service National Term of visafree stay CIS countries 1 Azerbaijan visa-free visa-free visa-free 30 days 2 Kyrgyzstan visa-free visa-free visa-free
WILL CHINA S SLOWDOWN BRING HEADWINDS OR OPPORTUNITIES FOR EUROPE AND CENTRAL ASIA?
 ECA Economic Update April 216 WILL CHINA S SLOWDOWN BRING HEADWINDS OR OPPORTUNITIES FOR EUROPE AND CENTRAL ASIA? Maurizio Bussolo Chief Economist Office and Asia Region April 29, 216 Bruegel, Brussels,
Asylum Trends. Appendix: Eurostat data
 Asylum Trends Appendix: Eurostat data Contents Colophon 2 First asylum applications in Europe (, Norway and Switzerland) Monthly asylum applications in the, Norway and Switzerland 3 First asylum applications
GEOG 3810 (01): Geography of Europe
: Geography of Europe") http://faculty.bemidjistate.edu/mlawrence/europes16.pdf UPDATED 11 March: abstracted Outline assignment is available here. NOTE: THIS COURSE IS NOT ON D2L. GEOG 3810 (01): Geography of Europe SPRING 2016,
http://faculty.bemidjistate.edu/mlawrence/europes16.pdf UPDATED 11 March: abstracted Outline assignment is available here. NOTE: THIS COURSE IS NOT ON D2L. GEOG 3810 (01): Geography of Europe SPRING 2016,
In 2012, million persons were employed in the EU
 countries: Latvia (2.3 pps) and Estonia (+2.0 pps). On the other hand, the employment rate fell by more than 2 pps in Spain (-2.3 pps), Portugal (-2.4 pps), Cyprus (-3.0 pps) and Greece (-4.3pps). The
European Union Passport
 European Union Passport European Union Passport How the EU works The EU is a unique economic and political partnership between 28 European countries that together cover much of the continent. The EU was
Asylum Trends. Appendix: Eurostat data
 Asylum Trends Appendix: Eurostat data Contents Colophon 2 First asylum applications in Europe (, Norway and Switzerland) Monthly asylum applications in the, Norway and Switzerland 3 First asylum applications
Asylum Trends. Appendix: Eurostat data
 Asylum Trends Appendix: Eurostat data Contents Colophon 2 First asylum applications in Europe (, Norway and Switzerland) Monthly asylum applications in the, Norway and Switzerland 3 First asylum applications
The environment and health process in Europe
 157 The environment and health process in Europe Henry Perlstadt and Ivan D. Ivanov As a result of the national studies described in the previous chapter, a survey instrument was designed to collect a
SPACE I 2015 Facts & Figures
 EXECUTIVE SUMMARY MARCH 2017 SPACE I 2015 Facts & Figures Marcelo F. Aebi (PhD), Christine Burkhardt (MA), Mélanie M. Tiago (MA) www.unil.ch/space Project SPACE at the University of Lausanne, Switzerland
3.1. Importance of rural areas
 3.1. Importance of rural areas 3.1.1. CONTEXT 1 - DESIGNATION OF RURAL AREAS A consistent typology of 'predominantly rural', 'intermediate' or 'predominantly urban' regions for EC statistics and reports
Context Indicator 17: Population density
 3.2. Socio-economic situation of rural areas 3.2.1. Predominantly rural regions are more densely populated in the EU-N12 than in the EU-15 Context Indicator 17: Population density In 2011, predominantly
The Madrid System. Overview and Trends. Mexico March 23-24, David Muls Senior Director Madrid Registry
 The Madrid System Overview and Trends David Muls Senior Director Madrid Registry Mexico March 23-24, 2015 What is the Madrid System? A centralized filing and management procedure A one-stop shop for trademark
THE VENICE COMMISSION OF THE COUNCIL OF EUROPE
 THE VENICE COMMISSION OF THE COUNCIL OF EUROPE Promoting democracy through law The role of the Venice Commission whose full name is the European Commission for Democracy through Law is to provide legal
Shrinking populations in Eastern Europe
 Shrinking populations in Eastern Europe s for policy-makers and advocates What is at stake? In several countries in Eastern Europe, populations are shrinking. The world s ten fastest shrinking populations
Shaping the Future of Transport
 Shaping the Future of Transport Welcome to the International Transport Forum Over 50 Ministers Shaping the transport policy agenda The International Transport Forum is a strategic think tank for the transport
The EU on the move: A Japanese view
 The EU on the move: A Japanese view H.E. Mr. Kazuo KODAMA Ambassador of Japan to the EU Brussels, 06 February 2018 I. The Japan-EU EPA Table of Contents 1. World GDP by Country (2016) 2. Share of Japan
Content. Introduction of EUROMIL. Fundamental Rights for Military Personnel. Added value of military unions/associations
 Content Introduction of EUROMIL Fundamental Rights for Military Personnel Added value of military unions/associations Situation on the RoA in Europe Founded: 1972 Factsheet: EUROMIL 40 associations from
IMMIGRATION IN THE EU
 IMMIGRATION IN THE EU Source: Eurostat 10/6/2015, unless otherwise indicated Data refers to non-eu nationals who have established their usual residence in the territory of an EU State for a period of at
EUROPEAN SOCIAL CHARTER Social Rights Monitoring :
 EUROPEAN SOCIAL CHARTER Social Rights Monitoring 15 215: Children, Family ant et ld R Migrants MAIN FINDING 215 CONCLUSIONS OF THE EUROPEAN COMMITTEE OF SOCIAL RIGHTS WHAT YOU NEED TO KNOW NON-CONFORMITY
Territorial indicators for policy purposes: NUTS regions and beyond
 Territorial indicators for policy purposes: NUTS regions and beyond Territorial Diversity and Networks Szeged, September 2016 Teodora Brandmuller Regional statistics and geographical information unit,
ASYLUM IN THE EU Source: Eurostat 4/6/2013, unless otherwise indicated ASYLUM APPLICATIONS IN THE EU27
 ASYLUM IN THE EU Source: Eurostat 4/6/2013, unless otherwise indicated ASYLUM APPLICATIONS IN THE EU27 Total number of asylum applications in 2012 335 365 450 000 400 000 350 000 300 000 250 000 200 000
Strasbourg, 21/02/11 CAHDI (2011) Inf 2 (CAHDI)
 Inf 2 (CAHDI)") Strasbourg, 21/02/11 CAHDI (2011) Inf 2 COMMITTEE OF LEGAL ADVISERS ON PUBLIC INTERNATIONAL LAW (CAHDI) State of signatures and ratifications of the UN Convention on Jurisdictional Immunities of States
Strasbourg, 21/02/11 CAHDI (2011) Inf 2 COMMITTEE OF LEGAL ADVISERS ON PUBLIC INTERNATIONAL LAW (CAHDI) State of signatures and ratifications of the UN Convention on Jurisdictional Immunities of States
Eurostat Working Papers
 Eurostat Working Papers Population and social conditions 3/1999/E/n 15 Report on the demographic situation in 12 Central European Countries*, Cyprus and Malta eurostat Population and social conditions
Migration, Mobility and Integration in the European Labour Market. Lorenzo Corsini
 Migration, Mobility and Integration in the European Labour Market Lorenzo Corsini Content of the lecture We provide some insight on -The degree of differentials on some key labourmarket variables across
VOICE AND DATA INTERNATIONAL
 INTERNATIONAL VOICE AND DATA Find the EE international rates, as well as the new roaming bundles for and. INTERNATIONAL VOICE AND DATA p.28-32 International Voice p.29-30 International Data p.31-32 contents
Annual Report on Asylum and Migration Statistics 2004 and European Migration Network
 Annual Report on Asylum and Migration Statistics 2004 and 2005 produced by the European Migration Network September 2008 This EMN Synthesis Report summarises the main findings for the years 2004 and 2005
BULGARIAN TRADE WITH EU IN THE PERIOD JANUARY - MARCH 2016 (PRELIMINARY DATA)
") BULGARIAN TRADE WITH EU IN THE PERIOD JANUARY - MARCH 2016 (PRELIMINARY DATA) In the period January - March 2016 Bulgarian exports to the EU grew by 2.6% in comparison with the same 2015 and amounted to
BULGARIAN TRADE WITH EU IN THE PERIOD JANUARY - MARCH 2016 (PRELIMINARY DATA) In the period January - March 2016 Bulgarian exports to the EU grew by 2.6% in comparison with the same 2015 and amounted to
Commonwealth of Australia. Migration Regulations CLASSES OF PERSONS (Subparagraphs 1236(1)(a)(ii), 1236(1)(b)(ii) and 1236(1)(c)(ii))
(a)(ii), 1236(1)(b)(ii) and 1236(1)(c)(ii))") Commonwealth of Australia Migration Regulations 1994 CLASSES OF PERSONS (Subparagraphs 1236(1)(a)(ii), 1236(1)(b)(ii) and 1236(1)(c)(ii)) I, SOPHIE MONTGOMERY, Delegate of the Minister for Immigration,
Commonwealth of Australia Migration Regulations 1994 CLASSES OF PERSONS (Subparagraphs 1236(1)(a)(ii), 1236(1)(b)(ii) and 1236(1)(c)(ii)) I, SOPHIE MONTGOMERY, Delegate of the Minister for Immigration,
GDP per capita in purchasing power standards
 GDP per capita in purchasing power standards GDP per capita varied by one to six across the Member States in 2011, while Actual Individual Consumption (AIC) per capita in the Member States ranged from
Second EU Immigrants and Minorities, Integration and Discrimination Survey: Main results
 Second EU Immigrants and Minorities, Integration and Discrimination Survey: Main results Questions & Answers on the survey methodology This is a brief overview of how the Agency s Second European Union
TRIPS OF BULGARIAN RESIDENTS ABROAD AND ARRIVALS OF VISITORS FROM ABROAD TO BULGARIA IN SEPTEMBER 2015
 TRIPS OF BULGARIAN RESIDENTS ABROAD AND ARRIVALS OF VISITORS FROM ABROAD TO BULGARIA IN SEPTEMBER 2015 In September 2015, the number of the trips of Bulgarian residents abroad was 450.9 thousand (Annex,
Collective Bargaining in Europe
 Collective Bargaining in Europe Collective bargaining and social dialogue in Europe Trade union strength and collective bargaining at national level Recent trends and particular situation in public sector
2016 Europe Travel Trends Report
 2016 Europe Travel Trends Report One-third of worldwide travellers report1 they ll spend more on travel in 2016 than the year previous. Of those big spenders, Europeans dominate the list, with Switzerland,
ASYLUM LEVELS AND TRENDS IN INDUSTRIALIZED COUNTRIES, 2005
 ASYLUM LEVELS AND TRENDS IN INDUSTRIALIZED COUNTRIES, 2005 OVERVIEW OF ASYLUM APPLICATIONS LODGED IN EUROPE AND NON-EUROPEAN INDUSTRIALIZED COUNTRIES IN 2005 Click here to download the tables in zipped
Settling In 2018 Main Indicators of Immigrant Integration
 Settling In 2018 Main Indicators of Immigrant Integration Settling In 2018 Main Indicators of Immigrant Integration Notes on Cyprus 1. Note by Turkey: The information in this document with reference to
SPACE I 2016 Facts & Numbers
 EXECUTIVE SUMMARY MARCH 2018 SPACE I 2016 Facts & Numbers Marcelo F. Aebi (PhD), Mélanie M. Tiago (MA), Léa Berger-Kolopp (MA). www.unil.ch/space Project SPACE at the University of Lausanne, Switzerland.
UPDATE ON THE PERIODIC REPORTING EXERCISE IN MEDITERRANEAN EUROPE
 UPDATE ON THE PERIODIC REPORTING EXERCISE IN MEDITERRANEAN EUROPE Meeting of National Focal Points of Nordic, Baltic, Western and Mediterranean Europe and German Site Managers on the Implementation of
Group of States against Corruption (GRECO) PROGRAMME OF ACTIVITIES 2019
 PROGRAMME OF ACTIVITIES 2019") Strasbourg, 7 December 2018 Greco(2018)13-fin Group of States against Corruption (GRECO) PROGRAMME OF ACTIVITIES 2019 Adopted by GRECO 81 (Strasbourg, 3-7 December 2018) GRECO Secretariat Council of Europe
Strasbourg, 7 December 2018 Greco(2018)13-fin Group of States against Corruption (GRECO) PROGRAMME OF ACTIVITIES 2019 Adopted by GRECO 81 (Strasbourg, 3-7 December 2018) GRECO Secretariat Council of Europe
Asylum in the EU28 Large increase to almost asylum applicants registered in the EU28 in 2013 Largest group from Syria
 STAT/14/46 24 March 2014 Asylum in the EU28 Large increase to almost 435 000 asylum applicants registered in the EU28 in 2013 Largest group from Syria In 2013, 435 000 asylum applicants 1 were registered
2018 BAVARIA S ECONOMY FACTS AND FIGURES
 Bavarian Ministry of Economic Affairs, Energy and Technology 2018 BAVARIA S ECONOMY FACTS AND FIGURES wwwstmwibayernde As of August 2018 Area Population (3006) 1) females males age 0-14 (3112) 15-64 65+
BULGARIAN TRADE WITH EU IN JANUARY 2017 (PRELIMINARY DATA)
") BULGARIAN TRADE WITH EU IN JANUARY 2017 (PRELIMINARY DATA) In January 2017 Bulgarian exports to the EU increased by 7.2% month of 2016 and amounted to 2 426.0 Million BGN (Annex, Table 1 and 2). Main trade
BULGARIAN TRADE WITH EU IN JANUARY 2017 (PRELIMINARY DATA) In January 2017 Bulgarian exports to the EU increased by 7.2% month of 2016 and amounted to 2 426.0 Million BGN (Annex, Table 1 and 2). Main trade
WHO Global Code of Practice on the International Recruitment of Health Personnel. Findings of the first round of reporting.
 WHO Global Code of Practice on the International Recruitment of Health Personnel. Findings of the first round of reporting. Dr Galina Perfilieva WHO Regional Office for Europe Negotiations and adoption
Parity democracy A far cry from reality.
 Parity democracy A far cry from reality Comparative study on the results of the first and second rounds of monitoring of Council of Europe Recommendation Rec(2003)3 on balanced participation of women and
THE COUNCIL OF EUROPE CONVENTION ON PREVENTING AND COMBATING VIOLENCE AGAINST WOMEN AND DOMESTIC VIOLENCE (ISTANBUL CONVENTION)
") 1 THE COUNCIL OF EUROPE CONVENTION ON PREVENTING AND COMBATING VIOLENCE AGAINST WOMEN AND DOMESTIC VIOLENCE (ISTANBUL CONVENTION) Global Exchange on Migration and Diversity, Centre on Migration, Policy
1 THE COUNCIL OF EUROPE CONVENTION ON PREVENTING AND COMBATING VIOLENCE AGAINST WOMEN AND DOMESTIC VIOLENCE (ISTANBUL CONVENTION) Global Exchange on Migration and Diversity, Centre on Migration, Policy
TRIPS OF BULGARIAN RESIDENTS ABROAD AND ARRIVALS OF VISITORS FROM ABROAD TO BULGARIA IN MARCH 2016
 TRIPS OF BULGARIAN RESIDENTS ABROAD AND ARRIVALS OF VISITORS FROM ABROAD TO BULGARIA IN MARCH 2016 In March 2016, the number of the trips of Bulgarian residents abroad was 354.7 thousand (Annex, Table
POPULATION AND DEMOGRAPHIC PROCESSES IN 2016
 POPULATION AND DEMOGRAPHIC PROCESSES IN 2016 Demographic situation in Bulgaria in 2016: Population number decrease and population ageing continue; Unbalanced territorial distribution of population go deeper;
TRIPS OF BULGARIAN RESIDENTS ABROAD AND ARRIVALS OF VISITORS FROM ABROAD TO BULGARIA IN AUGUST 2016
 TRIPS OF BULGARIAN RESIDENTS ABROAD AND ARRIVALS OF VISITORS FROM ABROAD TO BULGARIA IN AUGUST 2016 In August 2016, the number of the trips of Bulgarian residents abroad was 590.6 thousand (Annex, Table
TRIPS OF BULGARIAN RESIDENTS ABROAD AND ARRIVALS OF VISITORS FROM ABROAD TO BULGARIA IN FEBRUARY 2017
 TRIPS OF BULGARIAN RESIDENTS ABROAD AND ARRIVALS OF VISITORS FROM ABROAD TO BULGARIA IN FEBRUARY 2017 In February 2017, the number of the trips of Bulgarian residents abroad was 366.8 thousand (Annex,
TRIPS OF BULGARIAN RESIDENTS ABROAD AND ARRIVALS OF VISITORS FROM ABROAD TO BULGARIA IN AUGUST 2015
 TRIPS OF BULGARIAN RESIDENTS ABROAD AND ARRIVALS OF VISITORS FROM ABROAD TO BULGARIA IN AUGUST 2015 In August 2015, the number of the trips of Bulgarian residents abroad was 512.0 thousand (Annex, Table
TRIPS OF BULGARIAN RESIDENTS ABROAD AND ARRIVALS OF VISITORS FROM ABROAD TO BULGARIA IN MAY 2017
 TRIPS OF BULGARIAN RESIDENTS ABROAD AND ARRIVALS OF VISITORS FROM ABROAD TO BULGARIA IN MAY 2017 In May 2017, the number of the trips of Bulgarian residents abroad was 653.3 thousand (Annex, Table 1) or
Identification of the respondent: Fields marked with * are mandatory.
 Towards implementing European Public Sector Accounting Standards (EPSAS) for EU Member States - Public consultation on future EPSAS governance principles and structures Fields marked with are mandatory.
TRIPS OF BULGARIAN RESIDENTS ABROAD AND ARRIVALS OF VISITORS FROM ABROAD TO BULGARIA IN DECEMBER 2016
 TRIPS OF BULGARIAN RESIDENTS ABROAD AND ARRIVALS OF VISITORS FROM ABROAD TO BULGARIA IN DECEMBER 2016 In December 2016, the number of the trips of Bulgarian residents abroad was 397.3 thousand (Annex,
Terms of Reference and accreditation requirements for membership in the Network of European National Healthy Cities Networks Phase VI ( )
") WHO Network of European Healthy Cities Network Terms of Reference and accreditation requirements for membership in the Network of European National Healthy Cities Networks Phase VI (2014-2018) Network
WHO Network of European Healthy Cities Network Terms of Reference and accreditation requirements for membership in the Network of European National Healthy Cities Networks Phase VI (2014-2018) Network
Stimulating Investment in the Western Balkans. Ellen Goldstein World Bank Country Director for Southeast Europe
 Stimulating Investment in the Western Balkans Ellen Goldstein World Bank Country Director for Southeast Europe February 24, 2014 Key Messages Location, human capital and labor costs make investing in the
3-The effect of immigrants on the welfare state
 3-The effect of immigrants on the welfare state Political issues: Even if in the long run migrants finance the pay as you go pension system, migrants may be very costly for the destination economy because