Special Eurobarometer 440. Report. Europeans, Agriculture and the CAP
|
|
|
- Hope Black
- 5 years ago
- Views:
Transcription


1 Survey requested by the European Commission, Directorate-General for Agriculture and Rural Development and co-ordinated by the Directorate-General for Communication This document does not represent the point of view of the European Commission. The interpretations and opinions contained in it are solely those of the authors. Fieldwork Publication January 2016 Wave EB84.2 TNS opinion & social
2 Survey conducted by TNS political & social at the request of the European Commission, Directorate-General for Agriculture and Rural Development Survey co-ordinated by the European Commission, Directorate-General for Communication (DG COMM Strategy, Corporate Communication Actions and Eurobarometer Unit)
3 Project number Project title European, Agriculture and the CAP January 2016 Linguistic version EN Catalogue number KF EN-N ISBN doi: /03171 European Union,
4 1 TABLE OF CONTENTS INTRODUCTION 2 EXECUTIVE SUMMARY 5 I. AGRICULTURE IN THE EU: PERCEIVED IMPORTANCE AND MAIN OBJECTIVES OF THE EU IN TERMS OF AGRICULTURE AND RURAL DEVELOPMENT POLICY 7 1 The perceived importance of agriculture and rural areas in the EU 7 2 The responsibilities of farmers in our society 12 3 Main objectives of the EU in terms of agriculture and rural development policy17 II. THE COMMON AGRICULTURAL POLICY (CAP): AWARENESS, IMPORTANCE AND CONTRIBUTION TO THE EU S PRIORITIES 21 1 Awareness of the CAP 21 2 The perceived performance of the CAP 27 3 The perceived importance of the priorities of the CAP 33 4 The contribution of the CAP 39 5 Does the CAP only benefit farmers? 45 III. FINANCIAL AID FOR FARMERS AND THE CAP BUDGET 49 1 Financial aid for farmers 49 2 Reasons justifying the CAP s share of the total EU budget 53 3 Future financial support to farmers 57 4 Opinions on the cross-compliance mechanism 62 5 Opinions on payments given to farmers for implementing environmentally-friendly practices 67 IV. INFORMATION ABOUT THE CAP 69 1 The wish to receive more information about the CAP 69 2 The type of information respondents would be willing to receive 72 V. THE BENEFITS PROVIDED BY FORESTS 77 VI. RECOGNITION OF QUALITY LABELS 82 CONCLUSION 87 ANNEXES Technical specifications Questionnaire Tables
5 2 INTRODUCTION The Common Agricultural Policy (CAP) was introduced in It is a common policy for all the Member States of the European Union and is managed, and funded from the resources of the EU annual budget, of which the CAP constitutes almost 40% of the total budget. The main aims of the policy are to improve agricultural productivity so that consumers have a stable supply of affordable food, and to ensure that EU farmers can make a reasonable living. The CAP continues to be adapted to respond to the challenges of its time. Now, more than fifty years after the introduction of the CAP, with more than 500 million consumers needing a reliable source of affordable, healthy and nutritious food, the EU has had to address a number of current and future challenges. These include: global competition, economic and financial crises, climate change and sustainable management of the natural resources, food security, rising costs such as fuel and fertiliser. Significant reforms have been made in recent years, to modernise the sector and make it more market oriented. Most notably, in 2013, after three years of intensive discussion and negotiations, the policy was reshaped to meet the challenges of the future, The new CAP is designed to ensure direct support will become fairer and greener, strengthen the position of the farmers in the food chain and the policy as a whole will become more efficient and more transparent. With over 18 months passing since the introduction of the new CAP reforms, the Directorate- General for Agriculture and Rural Development was interested in consulting European public opinion once again to monitor views on agriculture and the CAP.
6 3 The objectives of this survey are to: Understand the relationship between Europeans and agriculture within the EU: what importance do they attach to agriculture and rural areas? How do they see the role of farmers in our society? What do they see as the main objectives of the EU in terms of agriculture? Understand the relationship between Europeans and the CAP: what do they know about it? Do they think that the CAP is performing well? How do they evaluate its contribution to the priorities of the EU? Assess EU public opinion of the financial aid provided to farmers and the proportion of the EU budget that this support represents. Also how do they see the future financial support to farmers? And their opinions about specific mechanisms such as cross-compliance or greening. Assess if EU public opinion would like to be more informed about the CAP Understand how they perceive the role of forests Assess the recognition of quality logos and labels among EU citizens A number of the questions in this Eurobarometer survey have been asked in previous surveys, e.g. in November , in November , in March and in November For these questions, it is possible to analyse the results of this survey alongside those from the previous surveys. This survey was carried out by the TNS Opinion & Social network in the 28 Member States of the European Union between 17 and ,822 EU citizens from different social and demographic categories were interviewed face-to-face at home and in their native language on behalf of the Directorate-General for Agriculture and Rural Development. The methodology used is that of Eurobarometer surveys as carried out by the Directorate-General for Communication ( Strategy, Corporate Communication Actions and Eurobarometer Unit). A technical note on the manner in which the interviews were conducted by the institutes within the TNS Opinion & Social network is appended as an annex to this report. Also included are the interview methods and the confidence intervals
7 4 Note: In this report, countries are referred to by their official abbreviation. The abbreviations used in this report correspond to: Belgium BE Latvia LV Czech Republic CZ Luxembourg LU Bulgaria BG Hungary HU Denmark DK Malta MT Germany DE The Netherlands NL Estonia EE Austria AT Greece EL Poland PL Spain ES Portugal PT France FR Romania RO Croatia HR Slovenia SI Ireland IE Slovakia SK Italy IT Finland FI Republic of Cyprus* CY Sweden SE Lithuania LT United Kingdom UK European Union weighted average for the 28 Member States BE, FR, IT, LU, DE, AT, ES, PT, IE, NL, FI, EL, EE, SI, CY, MT, SK, LV, LT BG, CZ, DK, HR, HU, PL, RO, SE, UK EU28 Euro area Non euro area * Cyprus as a whole is one of the 28 European Union Member States. However, the acquis communautaire has been suspended in the part of the country which is not controlled by the government of the Republic of Cyprus. For practical reasons, only the interviews carried out in the part of the country controlled by the government of the Republic of Cyprus are included in the CY category and in the EU28 average. We wish to thank the people throughout the European Union who have given their time to take part in this survey. Without their active participation, this study would not have been possible.
8 5 EXECUTIVE SUMMARY Agriculture in the EU: perceived importance and main objectives of the EU A growing majority of Europeans consider agriculture and rural areas as important for the future, with more than nine out of ten respondents holding this view. In fact, more than six Europeans in ten consider agriculture and rural areas to be very important (62%, +16 percentage points since November 2009). Europeans consider the main responsibilities of farmers to be supplying the population with a diversity of quality products (42%, +4 percentage points since 2013) and ensuring the welfare of farmed animals (35%, +8). Ranked fourth in the last survey, this latter responsibility has become increasingly important to respondents in many countries. More than half of Europeans think the EU s main objectives in terms of agriculture and rural development policy should be ensuring agricultural products are of good quality, healthy and safe (56%) and ensuring reasonable food prices for consumers (51%). The Common Agricultural Policy (CAP): Awareness, importance and impact An increasing number of Europeans have heard about the support the EU gives farmers through the Common Agricultural Policy (CAP) since the last survey (69%, +5 since 2013). Similar to the results from the last survey, only one in ten claim to know the details (10%, +2), while a smaller proportion now say that they have never heard of it (30%, -4pp). Europeans believe the EU is fulfilling its role in securing the food supply in the EU (70% agree) and in ensuring agricultural products are of good quality, healthy and safe (65%). Whilst an absolute majority agree the EU is fulfilling its role in ensuring a fair standard of living for farmers (52%), a high proportion of respondents do not hold this view (35% disagree). Similarly, important minorities disagree the EU is fulfilling its role in ensuring reasonable food prices (33% disagree) and protecting the environment (31% disagree). The majority of Europeans consider all of the listed priorities of the CAP to be important, with two priorities mentioned more often as being very important : investing in rural areas to stimulate economic growth and job creation (47%), and strengthening the farmer s role in the food chain (45%). Respondents believe the contribution the CAP brings to the EU is in improving trade relations between the EU and the rest of the world (66% agree) and helping with the smooth running of the EU single market (65% agree). Slightly less so are of the view the CAP contributes to extending coverage of broadband Internet and communication services in rural areas (54%). Majority of Europeans continue to agree the CAP benefits all citizens and not only farmers, however support has declined importantly since 2013 (62%, -15 percentage points since 2013). Financial aid for farmers and the CAP budget 41% of Europeans consider the amount of financial aid given to farmers to be about right, however support has declined (-4 percentage points since 2013). An increasing proportion of respondents hold the view this amount is too low (29%, +3) and 13% think it is too high (unchanged). According to Europeans, the three most mentioned reasons why the EU spends such a significant proportion of its budget on the CAP are: financial aid to farmers makes it possible to guarantee the food supply of Europeans (40%, -4 percentage points since 2013); financial
9 6 aid ensures the sustainable production of food products (33%, -5pp); the heavy human and financial investment required by agriculture (32%, +4pp). Close to half of Europeans would like to see an increase in the EU financial support for farmers over the next ten years (45%, +6 percentage points since 2009) and only 13% say they would like to see a decrease. More than four out of five Europeans consider it is justified to reduce farmers subsidy payments if they do not respect the rules for the environment, animal welfare and food safety. Since the last survey, European opinions have strengthened on this topic. The large majority of Europeans are in favour of the EU continuing to pay farmers for carrying out agricultural practices that are beneficial to the climate and the environment (87%, vs. 6% opposed ). Information about the CAP Less than a third of Europeans would like to receive more information about the Common Agricultural Policy (30%). The most mentioned topic for Europeans interested in receiving more information about the CAP are guaranteeing food safety (55% very interested ) followed by boosting the rural economy (39%) and supporting the farmers (31%). The benefits provided by forests According to respondents, there are two standout benefits provided by forests: absorbing carbon dioxide to fight climate change and its detrimental effects (66%) and providing animals natural habitats, preserving the different types of animals and plants and conserving nature (63%). Recognition of quality labels Slightly more than six out of ten Europeans (63%, +3 percentage points since 2013) are aware of at least one logo, which is a trend that is unchanged since the survey in The Fair trade logo is the most recognised (37%, unchanged) followed by the Organic Farming logo (23%, -2). Respondents are now much more likely to recognise the Protected Designation of Origin logo than they were in previous years (20%, +7 percentage points since 2013).
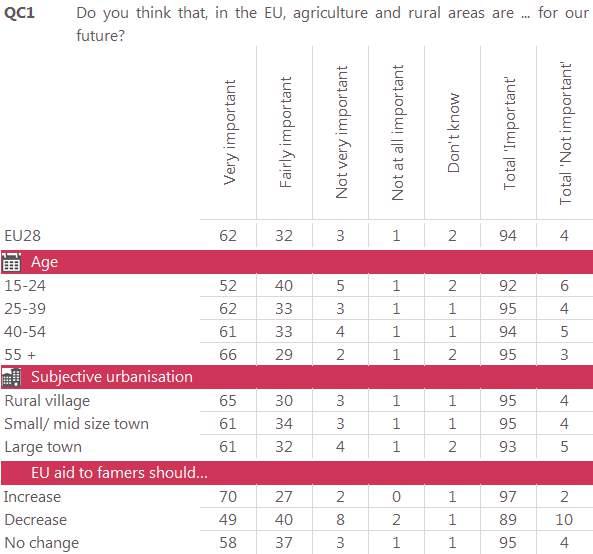
10 7 I. AGRICULTURE IN THE EU: PERCEIVED IMPORTANCE AND MAIN OBJECTIVES OF THE EU IN TERMS OF AGRICULTURE AND RURAL DEVELOPMENT POLICY One of the aims of this survey is to better understand the relationship between Europeans and agriculture within the EU: what importance do they attach to agriculture and rural areas? How they see the role of farmers in our society? What do they see as the main objectives of the EU in terms of agriculture? 1 The perceived importance of agriculture and rural areas in the EU Majority of Europeans consider agriculture and rural areas to be important; almost two thirds now believe agriculture to be very important for their future Europeans were asked how important they think agriculture and rural areas are for their future, within the EU 5. More than nine out of ten respondents in the EU (94%) hold the view that agriculture and rural areas are important for their future. This represents a 2-point increase since the previous survey conducted in November Public opinion has strengthened on this topic: a large proportion of Europeans now consider these areas to be very important for their future, with notable increases in the level of importance from the previous surveys (62%, +9 percentage points since 2013, +16pp since 2009), whilst 32% consider that they are fairly important (-7pp since 2013, -12pp since 2009). In comparison, in 2009, we observed similar proportions of fairly (44%), and very important (46%). 5 QC1 Do you think that, in the EU, agriculture and rural areas are for our future? ANSWER: Very important, Fairly important, Not very important, Not at all important, Don t know.
11 8 Whilst the majority of respondents across all EU Member States, consider both agriculture and rural areas to be important for their future, there are differences across countries with regards to the degree of importance respondents have in regards to these areas: at least four out of five respondents in Luxembourg (85%), Slovenia (81%) and Malta (80%) consider agriculture and rural areas to be very important. In comparison, just around half of respondents in Italy (50%), Poland (51%) and the Netherlands (53%) consider these areas to be very important for their future. Very small proportions of respondents across all countries believe agricultural and rural areas are not important ranging from 1% in Luxembourg and Portugal to 9% of respondents in Latvia.
 and the Netherlands (93%, +6pp).")
12 9 Results are overall stable with the largest percentage point increases seen in Ireland (97%, +6 percentage points since 2013), Sweden (97%, +6pp) and the Netherlands (93%, +6pp). The largest declines are observed in Latvia (89%, -5pp) and Austria (93%, -3pp).
13 10 In every socio demographic category, large proportions of respondents consider agriculture and rural areas as very important, with only few differences. Highest proportions of very important are seen among those aged 55 or over (66%) and those who live in rural villages (65%). Respondents who think that EU aid to farmers should increase (70%), are much more likely to consider agriculture and rural areas to be very important compared to those who are of the view EU aid should decrease (49%).
14 11
15 12 2 The responsibilities of farmers in our society The two main responsibilities of farmers are supplying the population with a diversity of quality products and ensuring the welfare or farmed animals Respondents were asked to consider what they think should be the two main responsibilities of farmers in our society 6. This question was also asked during the previous Eurobarometer survey in November As in the previous survey, EU respondents are most likely to mention supplying the population with a diversity of quality products (42%, +4 percentage points since 2013) as one the top main responsibilities for farmers in our society. The second most mentioned responsibility is ensuring the welfare of farmed animals (35%). This particular responsibility has also experienced notable increased support since the last survey (+8pp), when it was ranked as the fifth most mentioned responsibility. Protecting the environment comes in third position (30%, -2pp). In fourth position, maintaining economic activity and employment in rural areas appears to be of lesser importance to EU respondents (29%, -7pp). In 2013, it was the second most mentioned responsibility for farmers. One in four mentioned a farmer s main responsibility to be ensuring the EU s food selfsufficiency ; however, since 2013, support has declined by four percentage points to 25%. The least mentioned responsibility for farmers by Europeans is encouraging and improving life in the countryside with 24% of Europeans of the view this is a main responsibility of a farmer, with increased support since 2013 (+3pp). 6 QC6. What do you think should be the two main responsibilities of farmers in our society? ANSWERS Protecting the environment; Maintaining economic activity and employment in rural areas; Ensuring the EU s food self-sufficiency; Supplying the population with a diversity of quality products; Ensuring the welfare of farmed animals; Encouraging and improving life in the countryside; Other; Don t know.
16 13 A country analysis shows some variations between Member States: Supplying the population with a diversity of quality products is the top responsibility attributed to farmers in 18 Member States. The countries where respondents mentioned this responsibility the most include Slovakia (55%, +5 percentage points since November 2013) Lithuania (54%, +7pp), Hungary (53%, +9pp) and Greece (53%, +11pp). It is least mentioned in the United Kingdom and Denmark, where 30% of respondents believe this to be a main responsibility for farmers (unchanged since 2013). Ensuring the welfare of farmed animals is the leading responsibility in six Member States with more than half of respondents in most of these countries considering this to be the main responsibility of farmers in their society. The countries with the highest proportion of respondents attributing this responsibility to farmers are Sweden (58%, +9 percentage points since 2013), the Netherlands (56%, +10pp) and Luxembourg (56%, +24pp). Respondents in Bulgaria (9%, +1pp) and Latvia (12%, +3pp) least mentioned this responsibility. Ensuring the welfare of farmed animals has become an increasingly important issue amongst respondents, with large gains of 10 percentage points or more observed in eight countries. Of particular interest is a 24-point increase in Luxembourg with 56% of respondents now attributing this to be one of the main responsibilities for farmers in their society. Large increases since 2013 are also observed in Malta (46%, +18pp), Portugal (35%, +17pp), France (41%, +14pp), and Romania (28%, +11pp). Protecting the environment is the lead responsibility attributed to farmers in one Member State, Italy (36%, +5 percentage points since 2013), whereas in 2013 this aspect was considered the main responsibility in six countries. It is least mentioned as a farmer s main responsibility in Croatia (13%, -5pp), Estonia (14%, -10pp) and Slovakia (14%, -2pp). Support for this responsibility has declined amongst respondents in 19 countries since the last survey, with respondents in Ireland (22%, -14pp), Luxembourg (33%, -13pp) and Romania (30%, -12pp) less likely to mention this as a main responsibility for farmers in our society. Maintaining economic activity and employment in rural areas is the main responsibility in three Member States with more than half of respondents from Estonia (56%, +4 percentage points since 2013) and Latvia (53%, -1pp) attributing this to farmers as their main responsibility for
17 14 society. Respondents in Spain (41%, -8pp) equally mentioned maintaining economic activity and employment in rural areas and supplying the population with a diversity of quality products as a farmer s responsibility in our society. Respondents in Malta (15%, -7pp) are less likely to mention this as a main responsibility for farmers. Since the 2013 survey, support for this responsibility has declined in 25 Member States, with most significant decreases observed in Slovakia (29%, -13pp), Italy (32%, -11pp) and the Czech Republic (30%, -11pp). Ensuring the EU s food self-sufficiency is not the leading responsibility in any Member States, however it is most mentioned by respondents in Germany (42%, +5 percentage points since 2013) and Slovenia (38%, -12pp) and least mentioned in Latvia (9%, -5pp). There are percentage point declines in support across the majority of EU countries, with the largest decline observed in Austria (31%, -16pp). Encouraging and improving life in the countryside is most likely to be mentioned as the leading responsibility for farmers in our society by respondents for one Member State, Romania (39%, +7 percentage points) and least likely to be mentioned by respondents in Denmark (11%, +3pp). Support for this particular responsibility has increased with 13 countries observing five or more percentage point increases since Countries with the highest increases in proportions of respondents with this view since 2013 are Cyprus (36%, +19pp), Bulgaria (42%, +19pp) and Croatia (44%, +15pp).
18 15
; Younger people aged 15-24 are more likely than older people aged 55 or over to view the farmer s responsibility to ensure the welfare of farmed animals (39% for 32%); Respondents who")
19 16 A socio demographic analysis reveals some variations between categories: A higher proportion of women than men expect the farmer s main responsibility to ensure the welfare of farmed animals (38% for 31%); Younger people aged are more likely than older people aged 55 or over to view the farmer s responsibility to ensure the welfare of farmed animals (39% for 32%); Respondents who finished their education aged 20 or over, are more likely than those who finished their schooling at the age of 15 or before, to be of the opinion that a farmer s main responsibility is to ensure the EU s food self-sufficiency (29% for 21%). The respondents who finished their education aged 20+ are also less likely to be of the opinion that a farmer s role is to encourage and improve life in the countryside (19% compared to 28% for respondents who finished their education at the age of 15 or before).

20 3 Main objectives of the EU in terms of agriculture and rural development policy Ensuring agricultural products are of good quality, healthy and safe should be the main objective of the EU in terms of agricultural and rural policy Europeans were asked for their opinion on what the main objectives for the EU should be in terms of agriculture and rural policy 7. More than half of the respondents (56%) in the EU hold the view that ensuring agricultural products are of good quality, healthy and safe should be one of the main objectives for the EU. Ensuring reasonable food prices for consumers (51%) is second highest to be mentioned as one of the EU s main objectives, followed very closely by ensuring a fair standard of living for farmers (49%). The least mentioned objective out of the seven provided to respondents is securing a stable supply of food in the EU however at 40%, a considerable proportion of respondents still consider this to be one of the main objectives for the EU in terms of agriculture and rural policy. 7 QC4 In your opinion, which of the following should be the main objectives of the EU in terms of agriculture and rural development policy? Ensuring that agricultural products are of good quality, healthy and safe; Developing rural areas while preserving the countryside; Ensuring reasonable food prices for consumers; Protecting the environment and tackling climate change; Ensuring a sustainable way to produce food; Securing a stable supply of food in the EU; Ensuring a fair standard of living for farmers; Don t know; Other (spontaneous). 17
21 18 Ensuring agricultural products are of good quality, healthy and safe is the most frequently mentioned objective for 16 of the 28 Member States, with the highest proportion of respondents citing this in France (72%), the Netherlands (72%), Malta (71%) and Luxembourg (71%). In Italy, whilst this is also the most popular opinion (50%), there is a greater spread of opinion, with 46% of respondents believing that developing rural areas while preserving the countryside should be a main objective for the EU and 44% considering ensuring reasonable food prices for consumers should be the main objective. There are five Member States where respondents consider ensuring reasonable food prices for consumers as the leading main objective for the EU. A high proportion of respondents from Greece (74%) take this view, as do respondents from Cyprus (65%) and Slovakia (62%). Ensuring a fair standard of living for farmers is the top objective mentioned by respondents in five of the 28 Member States: Belgium (62%), Spain (62%), Romania (59%), Ireland (56%) and the United Kingdom (54%). The country with the lowest proportion of respondents holding this view is Italy (25%). Developing rural areas while preserving the countryside is mentioned by respondents as the top objective in three Member States Estonia (80%), Latvia (65%) and Bulgaria (59%). Respondents in Belgium are less likely to agree, with only 36% of respondents considering this to be a main objective for the EU. In most countries, less than half of respondents mention protecting the environment and tackling climate change as a main objective for the EU to consider, with Sweden (66%) and Malta (60%) having the highest proportion of respondents with this opinion. Respondents in Bulgaria (28%), Latvia (32%) and Poland (32%) have the lowest proportion of respondents with the view that protecting the environment should be one of the main objective the EU in terms of agriculture and rural development policy. Ensuring a sustainable way to produce food is most mentioned in Sweden (63%), Denmark (61%) and the Netherlands (59%) whilst Bulgaria (29%) can be found at the opposite end of the scale. Finland is the only country where securing a stable supply of food in the EU is considered as one of the EU s main objectives (62%, the same proportion as for ensuring agricultural products are of good quality, healthy and safe). Only a quarter of respondents in Bulgaria (25%), Italy (25%) and Latvia (25%) share this view.
22 19
; A similar trend is observed with ensuring that agricultural products are of good quality,")
23 20 A socio demographic analysis shows: Only little difference between men and women; By age, the older respondents are more likely to mention ensuring reasonable food prices for consumers as an objective than the younger respondents (53% of respondents aged 55 or over for 46% of year olds); A similar trend is observed with ensuring that agricultural products are of good quality, healthy and safe (59% of respondents aged 55 or over for 53% of year olds); A higher proportion of respondents living in rural villages (53%) think ensuring a fair standard of living is an important objective for farmers compared to respondents living in large towns (46%).
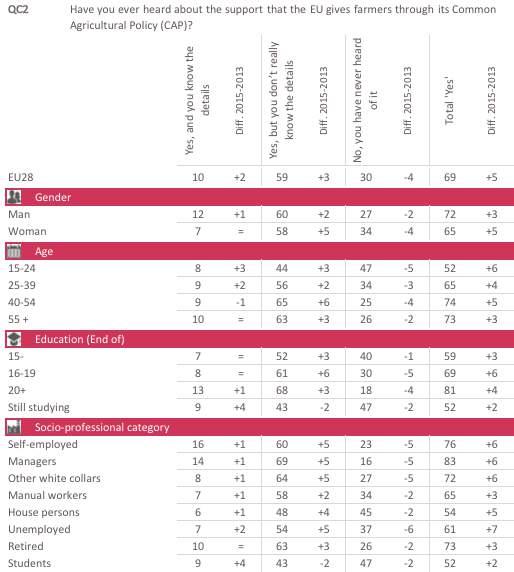
24 21 II. THE COMMON AGRICULTURAL POLICY (CAP): AWARENESS, IMPORTANCE AND CONTRIBUTION TO THE EU S PRIORITIES The second objective of the survey is to understand how Europeans perceive the CAP: what do they know about it? Do they think that the CAP is performing well? How do they evaluate its global impact? 1 Awareness of the CAP The majority of Europeans are aware of the CAP but few really know the details Europeans were asked if they have ever heard of the support the EU gives farmers through its Common Agricultural Policy (CAP), and if they had heard of it, were they aware of the details 8. The question was also asked during the Eurobarometer survey in November Overall, more than two thirds of European respondents have heard about this support (69%, +5 percentage points since 2013). Since the previous survey, there has been an increase in the proportion of Europeans who have heard about the CAP, but do not really know the details (59%, +3pp). One in ten European respondents claim they are aware of the CAP, and know the details (10%, +2pp) while three in ten say that they have never heard about this support (30%. -4pp). A country analysis reveals wide ranges of respondent awareness across the European Union: More than nine out of ten respondents in Sweden (95%), Finland (93%) and Lithuania (93%) are aware of the support the CAP provides farmers, with high awareness levels also reported Latvia (89%) and the Netherlands (87%) and Denmark (87%). Awareness is much less pronounced in Italy (47%), Spain and the United Kingdom (both 57%). 8 QC2 Have you ever heard about the support that the EU gives farmers through its Common Agricultural Policy (CAP)? ANSWERS Yes, and you know the details; Yes, but you don t really know the details; No, you have never heard of it, Don t Know.


25 22 In Lithuania (24%) and Ireland (20%), one in five respondents or more claim they know about the CAP and its details. This is almost twice the proportion of most other countries, with the exception of Poland (18%), Romania (18%) and Cyprus (18%).
26 23 An analysis of the evolutions since the last survey (2013) reveals: The proportion of respondents who have heard about the support, but do not really know the details have increased in all countries with the exception of two: Lithuania (69%, -6 percentage points since 2013) and Austria (58%, -6pp). Largest increases in proportion of respondents who have heard about the support, but know little about the details are seen in Greece (64%, +14pp), Finland (81%, +14pp) and Luxembourg (69%, +13pp). Yes, have heard about the support, and know the details there is very little change in trend since the last survey for most countries, with the exception of Lithuania (+9 percentage points since 2013), Cyprus (+7pp), Ireland (+7pp), Austria (+6pp) and Sweden (+6pp).
27 24
28 25 A socio demographic analysis reveals: Slightly more men than women have heard about the support given by the EU to farmers via the CAP (72%, vs. 65% of women). A higher proportion of men than women, also claim to know the details of the support (12% man, 7% woman); Older respondents are much more aware of the support given by the EU, than younger respondents (52% of year olds, compared 73% for respondents aged 55 or over); There is a notable difference in levels of awareness for those who left school at the age of 15 or before (59%) and those who continued education until the age of 20 or above (81%); Managers (83%), self-employed (76%), retired respondents (73%) and other white collar workers (72%) are more likely to be aware of the support given by the EU, than students (52%), house persons (54%) and the unemployed (61%); There is little difference in awareness for respondents living in rural villages, small/mid-size towns and large towns (rural 70%, small/mid-size town 67%, large town 69%); In terms of the trend since 2013, it is interesting to note that the positive trend in terms of the awareness of the CAP is broadly observed across all socio-demographic groups. However, as noted previously, there is no longer a notable difference in awareness between different categories of urbanisation. In 2013, 68% of respondents in rural villages said they had heard about the support the EU gives farmers through the CAP, compared to just 60% of those in small to mid-sized towns. In this survey, the difference is no longer noticeable with just a three percentage point gap separating the two.
29 26

30 27 2 The perceived performance of the CAP The majority of Europeans agree the EU is fulfilling its role in securing the food supply and ensuring products are of good quality, healthy and safe Europeans were asked for their opinions on how the EU through the Common Agricultural Policy is fulfilling its role across a variety of topics 9. Europeans are more likely to agree the EU is fulfilling its role in securing the food supply in the EU (70% agree ) with a relatively high proportion of respondents who totally agree (23%). Close to two-third of respondents agree the EU is fulfilling its role in ensuring agricultural products are of good quality, healthy and safe (65%). However, respondents seem less convinced the EU is fulfilling its role in developing rural areas (56%), ensuring reasonable food prices (56%), protecting the environment (55%) and ensuring a fair standard of living for farmers (52%). Whilst the majority agree the EU is fulfilling its role in these areas, a high proportion of Europeans disagree the EU is fulfilling its role in ensuring a fair standard of living for farmers (35%), reasonable food prices (33%), protecting the environment (31%) and developing rural areas while preserving the countryside (28%). 9 QC5 To what extent do you think the EU through the Common Agricultural Policy (CAP) is fulfilling its role in. Ensuring a fair standard of living for farmers; Developing rural areas while preserving the countryside; Ensuring reasonable food prices for consumers; Securing food supply in the EU; Protecting the environment and tackling climate change; Ensuring that agricultural products are of good quality, healthy and safe ANSWER : Totally agree, Tend to agree, Tend to disagree, Total disagree, Don t know
31 28 A country analysis shows some variations: Ensuring a fair standard of living for farmers: in 20 of the 28 EU Member States, more than half of respondents agree the EU is fulfilling its role in ensuring a fair standard of living for farmers. Respondents in Ireland (69%), Hungary (69%) and Malta (68%) are more likely to agree with this statement than respondents in France (34%), Estonia (34%) and Sweden (42%). There are five Member States where there are a higher proportion of respondents disagreeing with the statement, than are in agreement: France (54%), Latvia (49%), Estonia (48%), but also Spain (45% disagree vs. 44% agree) and Sweden (43% vs. 42%), where public opinion is divided. Respondents in Spain and France appear to have highest proportion who totally disagree with the view, the EU is fulfilling its role, with 21% of respondents in both countries reporting they totally disagree with the statement. About one in five respondents in the United Kingdom (23%) and Italy (22%) claim they don t know whether the EU is fulfilling its role in ensuring a fair standard of living for farmers. To develop rural areas while preserving the countryside: with the exception of two Member States, a relative majority of respondents agree the EU is fulfilling its role in this area, with respondents in some countries agreeing more strongly than others. Countries with the highest proportion of respondents agreeing the EU is fulfilling its role in this area include Hungary (73% agree ) and Lithuania (71%). The two exceptions are France and Estonia, each with 43% of respondents that disagree the EU is fulfilling its role in developing rural areas while preserving the countryside. A large proportion of respondents in Greece (42%), Sweden (37%), Spain (35%) and Finland (34%) also disagree. In the United Kingdom (27%), Denmark (23%) and Malta (21%), more than one in five respondents say that they don t know. The high rates of don t know for the United Kingdom can be seen throughout the survey.
 and Germany (68%).")
32 29 Ensuring reasonable food prices for consumers: more than 50% of respondents in 20 countries agree the EU is fulfilling its role this area. The highest proportions are observed in the Netherlands (74%) and Germany (68%). There are two countries where the majority of respondents disagree that the EU is fulfilling its role in this area: France (50% disagree vs. 37% agree) and Greece (55% vs. 40%). Both countries have high proportions of respondents who totally disagree (France, 17% and Greece, 24%) the EU is fulfilling its role. Opinion is more divided amongst respondents in six other countries. For example, the Czech Republic (47% disagree vs. 47% agree), Spain (46% vs. 44%), Lithuania (46% vs. 48%), Slovenia (45% vs. 46%), Latvia (45% vs. 47%), and Bulgaria (44% vs. 48%).
, Hungary (82%) and Germany (82%) have the highest proportion of respondents who agree in comparison to 58% of respondents in Sweden.")
33 30 Securing food supply in the EU: in all countries, the majority of respondents agree the EU is fulfilling its role in securing food supply in the EU. The Netherlands (84%), Hungary (82%) and Germany (82%) have the highest proportion of respondents who agree in comparison to 58% of respondents in Sweden. Respondents in the Netherlands have the strongest support for this statement, with 42% totally agreeing the EU is fulfilling its role in this area. It is the highest percentage across all countries, by nine points. Less than a quarter of respondents across all countries disagree the EU is fulfilling its role in securing the food supply. Of all countries, the highest proportion of respondents who disagree is observed in Spain (24%), Slovenia (23%) and Sweden (23%). Protecting the environment and tackling climate change: in all but one EU Member State, the relative majority of respondents agree the EU is fulfilling its role in protecting the environment and tackling climate change. Levels of agreement from respondents across countries are wide ranging, from highs in Hungary (75%), the Netherlands (74%) and Malta (70%) to a low of 36% of respondents in France. In France, 47% of respondents disagree the EU is fulfilling its role through the CAP in protecting the environment. The levels of disagreement amongst respondents in France were split between totally disagree (18%) and tend to disagree (29%). More than a quarter of respondents in Estonia (28%) and the United Kingdom (26%) responded that they don t know.
 compared to 47% support from respondents in France.")
34 31 Ensuring that agricultural products are of good quality, healthy and safe: the majority view across all EU countries is that the EU is fulfilling its role in this area with wide ranging levels of support. Respondents in the Netherlands have the highest proportion in agreement (87%) compared to 47% support from respondents in France. There is a high proportion of respondents in the Netherlands that totally agree (56%) the EU are fulfilling its role, which is 20 percentage points ahead of any other country. France has the highest proportion of respondents who disagree (41%), of which 17% totally disagree and 24% tend to disagree. Around a third of respondents in the Czech Republic (33%), Latvia (32%) and Greece (32%) also disagree the EU is fulfilling its role in ensuring agricultural products are of good quality, healthy and safe.
 are slightly less likely to agree the EU is fulfilling its role in ensuring reasonable food prices for")
35 32 A socio demographic analysis shows few variations across gender/age categories. However, there are some other observations: Respondents who reside in rural villages (54%) are slightly less likely to agree the EU is fulfilling its role in ensuring reasonable food prices for consumers than those living in large towns (60%); Respondents who agree the CAP benefits all European citizens and not only farmers are more likely to agree the EU is fulfilling its role in ensuring that agricultural products are of good quality, healthy and safe (74%), compared with 53% of those who don t agree the CAP benefits all. A similar trend occurs across all priorities for this group of respondents, Respondents who have heard of the CAP are more likely to agree the EU is fulfilling its role in securing food supply in the EU (79% for 62% of those who haven t heard of the CAP); Europeans who think EU aid to farmers should not change (60%) are more likely to agree the EU is fulfilling its role in ensuring a fair standard of living for farmers than those who think aid should increase (49%)
36 33 3 The perceived importance of the priorities of the CAP Europeans rate investing in rural areas to stimulate economic growth, and strengthening the farmer s role in the food chain slightly ahead of other priorities The respondents were asked to rate the importance they think a number of priorities of the Common Agricultural Policy should be 10. More than four out five Europeans rate all of the priorities as important with respondents more like to mention two priorities slightly more often. Investing in rural areas to stimulate economic growth and job creation (88%) and strengthening the farmer s role in the food chain (88%) are ahead of the other priorities, by 4-8 percentage points. Both of these priorities had large proportions of respondents regarding them as very important, (47% and 45% respectively). Developing research and innovation in agriculture had less Europeans considering this to be a very important priority (39%) and similarly enhancing the competitiveness and productivity of European agriculture (35%). Of all the priorities, this latter one had the highest proportion of respondents mentioning this is not a very important priority (11%). A country analysis reveals some differences between Member States: Enhancing the competitiveness and productivity of European agriculture: more than 70% of respondents in 26 countries consider enhancing the competitiveness and productivity of European agriculture to be an important priority with respondents in Portugal (93%), Bulgaria, Greece and Cyprus (all 90%) clearly of this view with significant proportions indicating it is very important (Bulgaria 61%, Cyprus 50%, Greece 48% and Portugal 44%,). 10 How important do you think the following priorities of the Common Agricultural Policy (CAP) are? Investing in Rural areas to stimulate economic growth and job creation; Strengthening the farmers role in the food chain; Developing research and innovation in agriculture; encouraging young people to enter the agricultural sector; enhancing the competitiveness and productivity of European Agriculture. ANSWERS Very important, Fairly important, Not very important, Not at all important, Don t know
 and Romania (53% very important and 31% fairly important ).")
37 34 In nine countries, the proportion of respondents who view this priority as very important outweigh the proportion who view it as fairly important. Examples not already mentioned include Ireland (51% very important and 37% fairly important ) and Romania (53% very important and 31% fairly important ). The majority of respondents in France (64%) and Luxembourg (68%) consider this as an important priority, however there is a reasonable proportion of people who consider this to be not important - France (28% not important ) and Luxembourg (25% not important ). More than one in five respondents in Austria (21%), Belgium (22%), Sweden (23%) and the Netherlands (26%) also hold this view. Developing research and innovation in agriculture: across all EU Member States, more than 70% of respondents consider developing research and innovation to be an important priority. In seven countries, at least 50% of respondents are more likely to consider this priority as very important than fairly important - Ireland (57%), Bulgaria (57%) and Romania (56%) have the highest proportions of respondents considering this priority as very important. Respondents in Estonia (27%), France (26%) and Austria (23%) are less likely to have strong views with lower proportions considering this priority to be very important, and higher proportions rating this priority as fairly important. More than one in five respondents in Austria (23%) consider this priority as not important, and slightly less respondents in France (18%) and Latvia (17%) share a similar view.
, Cyprus (96%), Portugal and Slovakia (both 95%).")
38 35 Investing in rural areas to stimulate economic growth and job creation: in all EU Member States, more than four out of five respondents view this as an important priority for the CAP. The countries with the highest proportion of respondents with this view include Bulgaria (96%), Cyprus (96%), Portugal and Slovakia (both 95%). In 16 countries, more than 50% of respondents consider this priority to be very important Bulgaria (79%), Latvia (69%), Cyprus (68%) and Romania (66%) are countries with the highest proportions of respondents who consider this priority to be very important. In the remaining countries, respondents are less likely to consider this priority as very important, but more inclined to view it as fairly important. Respondents in Luxembourg (33% very important, 50% fairly important ) and Denmark (34% very important, 48% fairly important ) are two examples. Slightly less than one in five respondents in the Netherlands view this priority as not important (18%) and 15% of respondents in Austria shared a similar view.
, Bulgaria, Portugal, Finland and Cyprus (all 93%) were more likely to consider this as an important priority in comparison with respondents in the Netherlands (80%)")

39 36 Strengthening the farmer s role in the food chain: again, more than four out of five respondents across all countries view this as an important priority for the CAP. Respondents in Slovakia (95%), Bulgaria, Portugal, Finland and Cyprus (all 93%) were more likely to consider this as an important priority in comparison with respondents in the Netherlands (80%) and Denmark (80%). There are 14 countries where 50% or more respondents consider this to be a very important priority. The top three countries are Bulgaria (67%), Cyprus (60%) and Ireland (59%). The proportion of respondents who consider this priority to be not important is low across all countries, with the highest proportion of respondents observed in the Netherlands (17% not important ), followed by Denmark (12%).
 are more likely to have this view than respondents in the Netherlands (68%) and Denmark (73%).")
40 37 Encouraging young people to enter the agricultural sector: in 26 countries, more than four out of five respondents consider this to be an important priority for the CAP to address. A higher proportion of respondents in Bulgaria, Greece, Portugal, Cyprus and Slovakia (all 94%) are more likely to have this view than respondents in the Netherlands (68%) and Denmark (73%). There are 15 countries where more than half of the respondents consider encouraging young people to enter the sector, to be a very important priority for the EU, with the highest proportions in Bulgaria (73%) and Cyprus (69%). A reasonable proportion of respondents in the Netherlands (29%) think encouraging young people to enter the agricultural sector is not important. To a lesser extent, 20% of respondents in Denmark hold similar views. There are generally few socio-demographic differences between categories however: Older respondents (87%) are more likely than younger respondents (76%), to consider encouraging young people to enter the agricultural sector as an important priority for the CAP; Europeans who think EU aid to farmers should increase are more likely to think encouraging young people is an important priority for the CAP than those who think aid should decrease (89% vs. 73%). There is a similar trend for this group across all priorities mentioned.
41 38
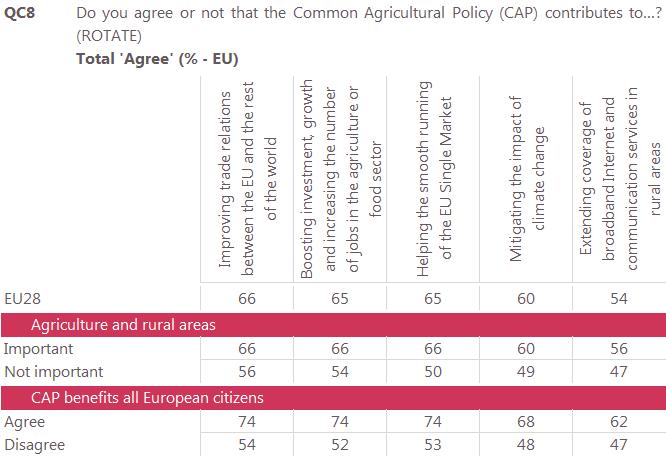
42 39 4 The contribution of the CAP Europeans view CAP as contributing to trade relations, helping the smooth running of the EU single market and boosting investments in the economy Europeans were asked whether they agree or not that the Common Agriculture Policy contributes to a variety of statements 11. Overall, the majority of Europeans agree that the CAP contributes to improving trade relations (66%), helps the smooth running of the EU single market (65%), boosts investment and increases jobs (65%), mitigates climate change (60%) and is extending broadband Internet coverage and communication services in rural areas (54%). More than one in five respondents disagree that the CAP is contributing to extending coverage of broadband Internet and communication services in rural areas (22%) and an additional 24% of respondents answer that they don t know. Almost one in four respondents disagree that the CAP is contributing to mitigating the impact of climate change (24%). A country analysis shows some variations between Member States: Boosting investment, growth and increasing the number of jobs in the agriculture or food sector: more than one in two respondents in 26 Member States agree that the CAP contributes to boosting investment, growth and jobs in the agriculture and food sectors. Respondents in Malta, Italy and Hungary are more likely to agree with 78% of respondents indicating their support for this statement. 11 QC8. Do you agree or not that the Common Agricultural Policy (CAP) contributes to? Boosting investment, growth and increasing the number of jobs in the agriculture or food sector; Helping the smooth running of the EU Single Market; Improving trade relations between the EU and the rest of the world; Mitigating the impact of climate change; Extending the coverage of broadband internet and communication services in rural areas. ANSWERS Totally agree; Tend to agree, Tend to disagree, Totally disagree, Don t know

43 40 Less than 50% of respondents in France and Sweden however agree this is the way the CAP contributes to the agriculture and food sectors. Over one third of respondents in both countries disagree, and almost 20% in both countries responded with don t know. High proportions of disagreement are also observed in Greece (36%) and Latvia (35%). Almost one quarter of the respondents in the United Kingdom (23%) did not know how to respond. Helping the smooth running of the EU Single Market: the level of agreement amongst respondents varies across countries significantly. For example, 76% of respondents in Portugal and Hungary agree the CAP is contributing to the smooth running of the EU single market whilst only 48% of respondents in Latvia agree with this view. Quite a large proportion of respondents in Latvia disagree the CAP is contributing to the smooth running of the EU Single Market (31%), similarly in France (29% of respondents disagree ) and the Czech Republic (31%). Almost one third of respondents in the United Kingdom (29%) and a quarter of respondents in Bulgaria (25%) and Spain (25%) responded with don t know.
, Portugal (76%) and Hungary (76%) are more likely to agree the CAP is helping improve trade relations than France (48%) and Sweden (51%).")
, France (23%), Sweden")
44 41 Improving trade relations between the EU and the rest of the world: in 27 Member States, more than 50% of respondents agree the CAP is contributing to improving trade relations with the rest of the world. Respondents in Italy (77%), Portugal (76%) and Hungary (76%) are more likely to agree the CAP is helping improve trade relations than France (48%) and Sweden (51%). There are high proportions of respondents that disagree the CAP is improving trade relations in France (29%), Slovenia (29%), the Czech Republic (27%), Sweden (26%) and Belgium (25%). In seven countries, more than one in five respondents did not know whether to agree or disagree, the highest proportions of don t know observed in the United Kingdom (25%), France (23%), Sweden (23%) and Spain (23%).
 and Hungary (72%) the countries with the highest levels of agreement from respondents, in comparison with Estonia (40%) Denmark (43%) and Bulgaria (48%) where the relative majority of")
45 42 Mitigating the impact of climate change: at least 50% of respondents in 23 countries agree the CAP is contributing to mitigating the impact of climate change with Malta (76%), Italy (74%), Germany (72%) and Hungary (72%) the countries with the highest levels of agreement from respondents, in comparison with Estonia (40%) Denmark (43%) and Bulgaria (48%) where the relative majority of respondents also agree. Opinion is more divided in Latvia (38% agree, 39% disagree) and France (39% agree, 40% disagree). Several countries have high proportions of respondents who disagree the CAP is contributing to mitigating climate change with respondents in Denmark with the highest proportion of respondents of disagree (41%) 13% totally disagree whilst 28% tend to disagree. Other countries with high proportions of respondents who disagree not already mentioned include Greece (35%), Sweden (35%) and Slovenia (35%). In seven countries, one in five respondents did not know how to answer, the highest proportion of don t know responses observed in Estonia (35%), Bulgaria (28%) and the United Kingdom (27%). Extending Coverage of broadband Internet and communication services in rural areas: in 26 countries, more respondents agree than disagree that the CAP is contributing to extending the coverage of broadband Internet with respondents in Poland (69%), Italy (66%) and Hungary (66%) more likely to agree, than respondents in Sweden (39%) and France (42%) where most still agree. Large proportions of respondents in Denmark don t know (40%) or disagree (31%) with this view and only 29% agree. Similarly in Bulgaria, a relative majority of respondents don t know (46%), although a larger proportion agree (44%) than disagree (10%). Countries with the highest proportions of respondents who disagree include Denmark (31%), the Czech Republic (30%), Luxembourg (30%), and Sweden, France, Belgium, Slovenia (all 29%). More than one in five respondents in 22 countries answer don t know. Of all of the topics asked of respondents in this section, this particular topic had higher proportions of respondents who don t know.
.")
46 43 A socio demographic analysis reveals generally few variations between categories, though some can be highlighted: Respondents who think the CAP benefits all European citizens are more inclined to agree the CAP contributes to extending coverage of Internet services in rural areas (62% agree vs 47% agree for respondents who do not think the CAP benefits all citizens). These respondents also are more inclined to agree the CAP contributes to mitigating climate change (68% vs 48%), improving trade relations (74% vs. 54%), helping the smooth running of the EU Single Market (74% vs. 53%) and boosting the economy and number of jobs in the sector (74% vs. 52%); The respondents who consider agriculture and rural areas as important, are more likely to agree the CAP contributes across all of the mentioned areas. In particular, with helping the smooth running of the EU Single Market (66% for 50% for those respondents who do not consider agriculture and rural areas as important).
47 44
48 45 5 Does the CAP only benefit farmers? The majority of Europeans continue to agree the CAP benefits all citizens and not only farmers, however support has declined since 2013 Respondents were asked to what extent they agreed the Common Agricultural Policy (CAP) benefits all European citizens and not only farmers 12. This question was also asked during the previous survey conducted in November More than six Europeans in ten (62%) agree that the CAP benefits all European citizens and not only farmers. Since the last survey conducted in 2013, there is a 15-point decline in total agreement. The proportion of respondents who disagree with the statement has increased by six percentage points (from 16% up to 22%) since Respondents are also more likely to respond with don t know (16%, +9pp). 12 QC3 To what extent do you agree or disagree with the following statement: the Common Agricultural Policy (CAP) benefits all European citizens and not only farmers. ANSWERS Totally agree, Tend to Agree, Tend to disagree, Totally disagree, Don t know.
 and Cyprus (80%) are most likely to agree with this statement with very high levels of respondents who totally agree (Malta 52% and Cyprus 48%).")
49 46 A country analysis reveals: In all EU countries with the exception of two, more than half of the respondents agree that the CAP benefits all European citizens. Respondents in Malta (87%) and Cyprus (80%) are most likely to agree with this statement with very high levels of respondents who totally agree (Malta 52% and Cyprus 48%). In comparison, less than half of respondents in France (45%) and the United Kingdom (49%) agree that the CAP benefits all, with only 11% of respondents in each country strongly agreeing. There are 17 countries where one in five respondents disagree the statement that the CAP benefits all European citizens, and not only farmers. Highest proportions of respondents who disagree are observed in France (36%, +9 percentage points since 2013), Sweden (34%, +11pp), Spain (26%, +12pp) and Latvia (26%, +13pp). Almost one third of respondents in the United Kingdom (29%) did not know whether the CAP benefited all Europeans. High proportions of respondents in Italy and France also shared the same view (19%). Across most countries, there are notable declines in the proportion of respondents who agree with the statement since the last survey. Malta is the only country where there is an increase in the proportion of respondents who agree the CAP benefits all citizens, not only farmers (87%, +3pp), whereas this proportion stays stable in Croatia (75%, unchanged). There are 13 Member States with greater than a 10-point decline since 2013 in the proportion of respondents who agree with the statement. Most important declines are seen in the United Kingdom (49%, -21 percentage points since 2013), Belgium (65%, -20pp), Spain (58%, -19pp) and France (45%, -19pp). In the United Kingdom, the proportion of respondents who answered don t know has increased since 2013 (from 12% up to 29%). To a lesser extent, there were similar trends for respondents who answered with don t know in France (19%, +10pp) and Belgium (10% +9pp).
50 47 A socio demographic analysis shows some differences across groups but very little differences in terms of gender and age: At least two thirds of managers, self-employed respondents (both 67%) and other white collar workers (66%) agree that the CAP benefits all European citizens and not just farmers compared to less than six in 10 house persons (58%) and those who are unemployed (59%). More educated Europeans are more likely to agree the CAP benefits all European citizens (65% who completed their studies 20+ for 57% who completed studies 15-); Respondents who consider agriculture and rural areas as important are more likely to agree with this view (64% for 37% who view agriculture and rural areas as not important); Europeans who think EU aid to farmers should decrease are less likely to agree the CAP benefits all Europeans citizens, than those who think EU aid to farmers should increase or
.")
51 48 those that think no change is required (52%, compared with 65% increase, and 70% no change); Similarly, the respondents who have heard about the EU support to farmers are more likely to agree than those who have not heard about it at all (68% for 51%).
52 49 III. FINANCIAL AID FOR FARMERS AND THE CAP BUDGET The next section of the report aims to assess Europeans opinion about the financial aid provided to farmers and the proportion of the EU budget that this support represents. How do Europeans see the future financial support to farmers? And what are their opinions about specific mechanisms such as cross-compliance or greening? 1 Financial aid for farmers The larger proportion of Europeans think that the amount of financial support the EU gives to farmers is about right After explaining level of support the EU provides farmers, Europeans were asked whether the financial support provided to farmers by the EU is too low, about right or too high 13. Over four Europeans in ten consider the financial support provided to farmers to be about right (41%, -4pp) with just under a third considering it be too low (29%, +3pp) and 13% mentioning it be too high. The proportion of respondents who responded with don t know is high at 17%, increasing by 1 percentage point since the last survey in In 19 Member States, the relative majority of respondents consider the financial aid provided by the EU to be about right. This is particularly the case in Czech Republic (53%), Finland (53%) and Ireland (52%). 13 QC9 The EU gives financial support to farmers to help them stabilise their incomes. This aid represents around 1% of the combined public expenditure of the 28 Member States of the EU and almost 40% of the total EU budget. Do you think this support is too low, about right or too high? ANSWER Too low; About right; Too high; Don t know.
 and Cyprus (45%, +8pp). Since 2013, the majority view in these two latter countries has changed from about right to too low.")
53 50 The four countries where the proportion of respondents who consider the financial support to be too low are Latvia (66%, +17 percentage points since 2013), Romania (57%, +14pp) Estonia (45%, +12pp) and Cyprus (45%, +8pp). Since 2013, the majority view in these two latter countries has changed from about right to too low. In Belgium and Luxembourg, opinions is somewhat divided between about right and too low each with a similar proportion of respondents: Belgium (41% too low, 40% about right ), Luxembourg (35% too low and 34% about right ). In Bulgaria, respondents are divided across three responses, with the highest proportion responding with don t know (34%) followed by 32% who consider the EU financial aid to be too low and 31% who consider it to be about right. A large proportion of respondents in Sweden (31%), the Netherlands (31%), Denmark (31%) think the aid is too high, and similarly, to a lesser extent, so do 22% of respondents in Luxembourg.
54 51
; Respondents who think the CAP benefits all")
55 52 A socio demographic analysis shows some variations between categories: More men are inclined to think the financial support provided to farmers is too high (15% man for 10% woman); Respondents that live in rural villages are more likely to say the financial support provided to farmers is too low (34% in rural villages for 26% in large towns); Respondents who think the CAP benefits all European citizens are more likely to say the financial support is about right, than those who do not think the CAP benefits all (48% for 33% who do not think the CAP benefits all).
56 53 2 Reasons justifying the CAP s share of the total EU budget Agriculture requires heavy human and financial investment - almost a third of Europeans now consider this as one of the main reasons for the EU attributing a large proportion of its budget to CAP. Europeans were asked what they think are the main reasons why the EU spends a significant proportion of its budget on the Common Agricultural Policy (CAP). The most mentioned reason is financial aid to farmers makes it possible to guarantee the food supply of Europeans (40%); however support for this reason has declined by four percentage points since the last survey. A similar decline has been observed for the second most mentioned reason, ensure the sustainable production of food products (33%, -5 percentage points since 2013). Compared with 2013, a greater proportion of respondents now recognise the heavy human and financial investments in agriculture as a reason why the EU spends a large proportion of its budget on the CAP (32%, +4).
57 54 A country analysis shows that financial aid to farmers makes it possible to guarantee the food supply of Europeans is the leading reason mentioned in 12 Member States, with considerable support from respondents in the United Kingdom (53%, +13 percentage points since 2013), Ireland (52%, +1pp) and Finland (50%, -5pp). There were percentage point declines in support for this particular reason observed within 23 countries, with the largest declines amongst respondents in Slovenia (29%, -22pp), Estonia (27%, -15pp), Austria (42%, -14pp) and Slovakia (32%, -14pp). Financial aid to farmers makes it possible to ensure the sustainable production of food products is most mentioned in eight countries as the leading reason why respondents think the EU spends a significant amount of its budget on the CAP. Support for this reason has decreased in 20 EU countries since Cyprus (50%, -5pp) has the highest proportion of respondents mentioning this reason followed by Austria (46%, -1pp). Conversely, this reason is less mentioned in the United Kingdom (22%, -13pp), Slovenia (29%, -14pp), Bulgaria (29%, -1pp) and Italy (29%, -8pp). The third most mentioned reason across Europe, agriculture requires heavy human and financial investments is the top answer in eight countries. Bulgaria has the highest proportion of respondents (44%, -4pp), followed by Lithuania (41%, +5pp), Slovakia (41%, +7pp) and Cyprus (41%, +8pp). Since 2013, respondents in 19 countries have increased their support for this particular reason with many countries observing greater than five-point increases. Countries with the highest increases include the Luxembourg (40%, +16pp), United Kingdom (30%, +13pp) and Spain (38%, +11pp). The production of food products in the EU is more expensive than in other countries because of stricter standards, e.g. animal welfare is mentioned by less than a quarter of Europeans (23%). This is not the top reason in any country however, in two countries it is the second most mentioned reason: France (38%, +1pp) and Denmark (38%, -4pp). Lowest proportions of respondents giving this reason are found in the United Kingdom (12%, -13pp), Portugal (12%, - 1pp), and Croatia (12%, -14pp). In the latter country, there is a significant percentage point decline of 14 points for this reason since the survey of Agriculture is a sector financed almost entirely by the EU budget, rather than at national or local level is not the top most mentioned reason in any of the EU Member states. Less than one in five Europeans considered this as a main reason why the EU spends a significant proportion of its budget on the CAP, however support for this particular reason increased across the majority of countries. Ireland (22%, +11pp) and Croatia (21%, +11pp) in particular had the greatest increases in support by respondents.
58 55
59 56 A socio-demographic analysis shows little difference between categories for this question, however, some variations can be highlighted: Respondents who agree the CAP benefits all European citizens, not just farmers, are more likely to think the main reason the EU spends a significant amount of its budget on the CAP is because financial aid makes it possible to guarantee the food supply to Europeans (44% for 33% who don t agree the CAP benefits all citizens). A similar view is held by Europeans who think EU aid to farmers should not be changed (44%) and should increase, with 42% of respondents mentioning this reason in comparison to 32% who think EU aid should decrease.
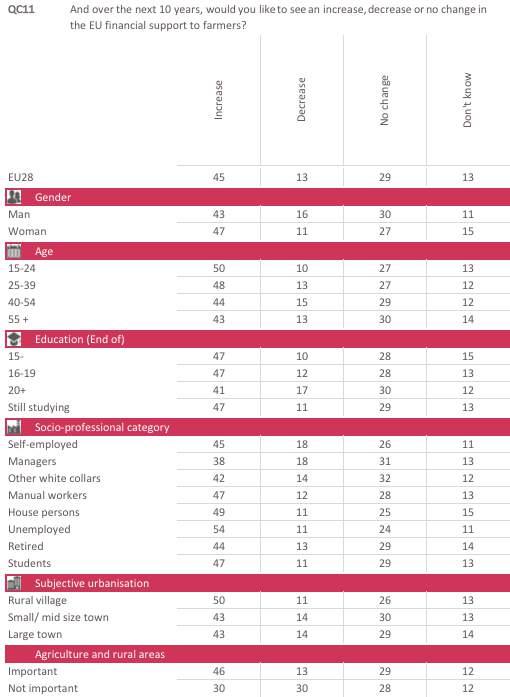
60 57 3 Future financial support to farmers Europeans would like to see an increase in EU financial support for farmers over the next ten years Europeans were then asked whether they would like to see an increase, decrease or no change in the EU financial support to farmers over the next ten years 14. This question was also asked during the Special Eurobarometer survey of November 2009 and November A relative majority of Europeans (45%) would like to see an increase to the EU financial support for farmers over the next ten years. This opinion has increased since 2009 (+6 percentage points) and 2007 (+16pp). Just 13% would like a decrease in the EU financial support (-1 since 2009). Slightly less than three Europeans in ten (29%, -4pp since 2009) consider no change being required. 14 QC11 And over the next ten years, would you like to see an increase, decrease or no change in the EU financial support to farmers?
, Romania (84%, +22pp) and Estonia (76%, +7pp), and slightly less in Malta (74%, +15pp) and Cyprus (74%, +24pp).")
61 58 The relative majority of respondents from 24 Member States are of the view that there should be an increase in EU financial support for farmers, with more than three out of four respondents thinking this in Latvia (84%, +22 percentage points since 2009), Romania (84%, +22pp) and Estonia (76%, +7pp), and slightly less in Malta (74%, +15pp) and Cyprus (74%, +24pp). Whilst a relative majority of respondents also hold this view in Luxembourg (42%, +14pp) and Austria (38%, +4pp), there is also a high proportion of respondents in these countries who believe no change is required (Luxembourg 39%, -7pp and Austria 33%, -7pp). In Finland (46%, -6pp), Germany (37%, -3pp), Ireland (36%, +9pp) and the Netherlands (36%, +4pp) most respondents think that no change is required in the level of EU financial support. Denmark is the only country where most respondents think that there should be a decrease in the EU financial support for farmers over the next ten years, however opinion does seem to be divided. More than a third of respondents in Denmark (36%, +4pp) believe there should be a decrease, less than a third believe no change is required (31%, -12pp) and (24%, +9pp) believe there should be an increase. A large proportion of respondents in Bulgaria (28%) and Portugal (18%) did not know how to answer.
62 59 In 22 Member States, the proportion of respondents who would like to see an increase of EU financial support to farmers has increased since the last survey in Most important increases are seen in Cyprus (74%, +24 percentage points), Latvia (84%, +22pp), Romania (84%, +22pp) and France (45%, +20pp). In Bulgaria (52%, -21pp), Poland (37%, -13pp), Greece (64%, -10pp), but also Hungary (42%, -7pp) and Czech Republic (49%, -2pp), support for an increase in EU financial support has declined.
63 60 A socio demographic analysis shows some variations between categories: Slightly more women than men are in favour of an increase in EU support to farmers (47%, compared with 43% of men); Older respondents are less likely to favour an increase in EU support to farmers (43% of respondents aged 55 or over for 50% of the younger age bracket, 15-24); Respondents who have stayed longer at school are less likely to favour an increase in EU support (41% of respondents who completed their studies aged 20+ for 47% of those that finished their studies aged 19 or younger and those who still studying); Managers (38%) are less likely to favour an increase in EU support to farmers than manual workers (47%), students (47%), house persons (49%) or the unemployed (54%); A higher proportion of respondents who live in rural villages (50%) favour an increase in EU support than those respondents that live in small or mid-sized towns or large towns (43%); Respondents who think agriculture and rural areas are important are more likely to favour an increase in EU support than those who think these areas are not important (46% compared with 30%). Despite these differences in categories above, a relative majority of respondents in all categories are in favour of an increase in EU support for the farmers.
64 61
65 62 4 Opinions on the cross-compliance mechanism The majority of Europeans believe it is justified to reduce farmers payments if they do not respect environment, food safety and animal welfare rules After they were given an explanation of cross-compliance, respondents were asked for their opinion whether they think it is justified or not, to reduce payments to farmers who do not respect animal welfare, environmental and food safety standards 15. This question was also asked in the Eurobarometer survey conducted in Across all criteria, more than four out of five European respondents consider it is justified to reduce farmers subsidy payments if they do not respect the rules. There has been very little change overall since November 2007: animal welfare standards (87%, +1 percentage point), environmental standards (87%, +2pp) and food safety standards (87%, -1pp). However, the proportion of respondents who think it is totally justified has increased quite markedly for environmental standards (+7pp) and to a lesser extent for animal welfare standards (+4pp). The strength of opinion respondents have with regards to food safety standards has slightly changed since 2007, with a decline in the proportion of Europeans who consider it is totally justified (56%, -7pp) to an increase in somewhat justified (31%, +6pp). A country analysis reveals some variations between countries: Food Safety Standards: the large majority of respondents from all EU countries are of the view that farmers subsidy payments should be reduced to farmers who do not respect the food safety standards, with respondents in some countries holding a stronger view than others. Whilst 82% of respondents in the Netherlands and Sweden believe it is totally justified to reduce farmers 15 QC14. Under the rules of the Common Agricultural Policy (CAP), farmers payments are linked to the requirements to comply with rules for the environment, food safety and animal welfare (so called cross compliance ). To what extent do you think that it is justified or unjustified to reduce farmers subsidy payments to farmers who do not respect.? Food Safety Standards, Environmental Standards, Animal Welfare Standards ANSWER Totally justified; Somewhat justified; Somewhat unjustified; Totally unjustified; Don t know.
66 63 subsidy payments for those who do not respect the rules, in comparison to countries such as Italy where 44% of respondents think it is totally justified. Countries with the highest proportions who think it is unjustified are Latvia (12%), Croatia (11%), Spain (10%) and Italy (10%). More than one in ten respondents in Romania (13%) and Spain (11%) responded with don t know. Animal Welfare Standards: in every EU country with the exception of two (Italy 78% and Romania 74%), more than four out of five respondents believe it is justified that farmers should have their subsidy payments reduced if they do not respect the animal welfare standards. Again there are stronger views from respondents across EU countries with regards to the levels of justification. A high proportion of respondents in Sweden (88%), Denmark (79%) and the Netherlands (77%) are of the view it is totally justified with very low not justified proportions in each (3%). By comparison, only 45% of respondents in Italy and Slovakia believe it is totally justified for farmers to have their subsidies reduced, with 33% of the view it is somewhat justified in Italy and 42% in Slovakia.

67 64 Environmental standards: Finland has the highest proportion of respondents who believe it is justified to reduce farmers subsidy payments if they do not abide by the rules in regards to environmental standards, with 64% of respondents with a stronger view, considering it to be totally justified to reduce payments and 31% believe it to be somewhat justified. The lowest proportion of respondents who believe it is justified to reduce farmers subsidy payments if they do not respect the environmental standards is observed in Italy (78%) and Romania (77%). The view is stronger amongst respondents in Sweden (81% totally justified) and Cyprus (77% totally justified). There are three countries where slightly more than one in ten respondents believe it is not justified to reduce farmers subsidy payments: Austria (11%), Croatia (11%) and Italy (11%). In 20 Member states, there has been little movement up or down, in the proportion of respondents who believe it is justified to reduce farmers subsidies if they do not respect the rules since the last survey in The largest increases in respondents who are of the view it is justified to reduce subsidies if farmers don t respect the rules are observed in Bulgaria - food safety standards (90%, +13 percentage points), animal welfare standards (80%, +13pp) and environmental standards (89%, +14pp) and in Ireland - food safety standards (91%, +12pp), animal welfare standards (89%, +11pp) and environmental standards (89%, +13pp). In Belgium, the level of support for the EU to reduce payments for non-compliance is very high, although it has declined since 2007 across all three areas: food safety standards (91%, -5pp), animal welfare standards (87%, -7pp) and environmental standards (89%, -5pp).
68 65
69 A socio demographic analysis revealed few differences across gender, age, occupation or urbanisation for this question, however: Respondents who have heard of the EU s support to farmers are more likely than those who have not, to think it is justified to reduce payments to farmers who do not respect animal welfare, and environmental and food safety rules (90% compared with 80% for animal welfare and environmental, 91% for 81% for food safety standards); Europeans who consider agriculture and rural areas to be important are more likely to consider it to be justified to reduce farmer payments, than those who do not (88% for 77% food safety, 87% compared with 78% animal welfare and 88% compared with 78% environmental). 66
70 5 Opinions on payments given to farmers for implementing environmentally-friendly practices Europeans in favour of the EU continuing payments to farmers for for carrying out agricultural practices beneficial to the climate and the environment After being explained that the EU is currently giving payments to farmers for carrying out agricultural practices beneficial to the climate and the environment (so called greening ), respondents were then asked whether they were in favour or opposed to the EU continuing to do so 16. A large majority of Europeans are in favour of this policy continuing, with 87% of respondents in favour and only 6% opposed across Europe. 44% of respondents are totally in favour and 43% were somewhat in favour. More than four out of five respondents are in favour of the payments continuing across all Member States with the highest proportions in Sweden (96%), Malta (94%) and Cyprus (93%). These countries had a higher proportion of respondents who are totally in favour than many of the other countries: Sweden (77%), Cyprus (72%) and Malta (63%). The countries with the highest proportions of respondents who are opposed include Austria (12%), Germany (10%) and Slovenia (10%). 16 QC15. The EU is currently giving payments to farmers for carrying out agricultural practices beneficial to the climate and the environment (so called greening ), such as crop diversification and maintenance of permanent grassland. Are you in favour or opposed to the EU continuing to do so? ANSWER. Totally in favour; Somewhat in favour; Somewhat opposed; Totally opposed; Don t know. 67
 are more likely to be in favour of the EU continuing with payments to farmers for carrying out practices")
71 68 A socio demographic analysis reveals generally little difference across gender, age, occupation or urbanisation. However, it can be noted that: Respondents who think EU aid to farmers should increase (92%) are more likely to be in favour of the EU continuing with payments to farmers for carrying out practices that are beneficial to the environment. Europeans who think agriculture and rural areas are important are more likely to be in favour of the EU continuing these payments, than those who consider these areas not important (89% compared with 68%).
72 69 IV. INFORMATION ABOUT THE CAP Another objective this survey has is to assess if EU public opinion would like to be more informed about the CAP. 1 The wish to receive more information about the CAP Two thirds of Europeans would NOT like to receive further information about the CAP Europeans were asked whether they would like to receive more information about the Common Agricultural Policy 17. Almost two thirds of Europeans (65%) say that they would not like to receive more information about the CAP, whilst 30% indicate they would like to receive additional information, and 5% say that they don t know. In three countries, more than one in two respondents say that they would like more information about the CAP: Sweden (53%), Greece (53%) and Cyprus (51%). In 24 Member States, at least half of respondents answer that they would not like more information about the Common Agricultural Policy. The view is strongest in the United Kingdom where 81% of respondents would not like to receive more information about the CAP. Similarly, more than three quarters of respondents in Slovenia (79%), Finland (78%), Ireland (77%) and Hungary (76%) would not like to receive more information. The view is split in Romania where 47% of respondents indicated they would like further information, and 47% indicated they would not. Responses were also very close in Malta where 50% were not in favour of receiving more information and 48% of respondents indication they would like more information. In Italy and Bulgaria, at least one respondent in ten answer that they don t know. 17 QC16 Would you like to receive more information about the Common Agricultural Policy? ANSWER Yes, No, Don t Know

73 70 A socio demographic analysis reveals generally few differences across gender and age. However, it reveals: Respondents who studied longer are more likely to be interested in receiving more information about the CAP (36% of respondents who have completed their studies at the age of 20 or after for 24% of respondents who completed studies at the age of 15 or under); Managers (35%) and self-employed (35%) are more likely to be interested in receiving more information than house persons (27%) or retirees (26%); Politically aware respondents are more inclined to be interested in receiving more information (40% of respondents with strong political interest for 27% with low political interest and for 18% with none at all); Respondents who have heard of the EU s support to farmers are more likely to be interested in receiving more information than those who have not heard about the EU support (34% who have heard of EU support for 20% who have not heard); Respondents who believe EU aid to farmers should decrease, are less likely to be interested in receiving more information than those who think EU aid should increase (25% of respondents who think EU aid should decrease for 36% of respondents who think EU aid should increase).
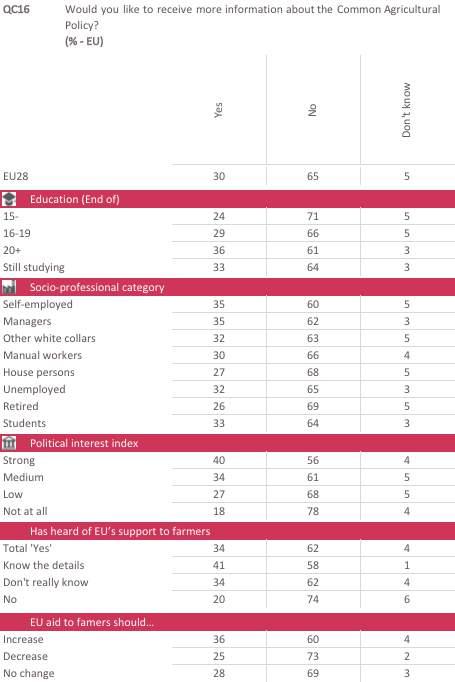
74 71
75 72 2 The type of information respondents would be willing to receive Europeans are most interested in receiving more information about the role of the CAP in guaranteeing food safety Europeans who indicated they would like to receive more information about the CAP, were then asked how interested they would be in receiving more information about the role of the CAP in supporting farmers, guaranteeing food safety and boosting the rural economy 18. More than four out of five of these respondents expressed interest in receiving more information about all of the topics. Guaranteeing food safety had the highest proportion of Europeans who were very interested (55%) followed by boosting the rural economy (39%) and supporting the farmers (31%). One in ten European respondents are not very interested in more information about boosting the rural economy (10%) or supporting farmers (11%). Respondents who would like to receive more information about the CAP (30% of the total sample) 18 QC17 How interested would you be in receiving more information about the role of the Common Agricultural Policy (CAP) in.? Supporting farmers; Boosting the rural economy; Guaranteeing food safety ANSWERS: Very interested, Fairly interested; Not very interested; Not at all interested; Don t know

76 73 A country analysis reveals some variations between Member States: Guaranteeing food safety and the role of the CAP is a topic more than nine of ten respondents from nearly all Member States are interested in receiving more information about. More than half of respondents across 23 Member States indicated they are very interested in receiving more information about guaranteeing food safety, with large proportions of respondents in Cyprus (76%), Bulgaria (75%) and the Czech Republic (74%) indicating they are very interested. Countries with a highest proportion of respondents who are fairly interested compared to very interested include Estonia (49% fairly interested and 39% very interested) and Denmark (49% fairly interested and 40% very interested). Respondents who would like to receive more information about the CAP (30% of the total sample) There are only few variations between gender, age, occupational categories and urbanisation. There are 27 Member States where more than four out of five respondents are interested in receiving more information about the role of the CAP in boosting the rural economy. Countries with the highest proportions of interested respondents include Spain (95%), Bulgaria (95%) and Hungary (94%). In all three cases, the proportion of respondents who are very interested in receiving more information about this topic exceeds 50% and together with Romania (55% very interested) and Cyprus (54% very interested) are the countries with the highest level of interest expressed. There are 10 countries where one in ten or more respondents claim they are not very interested in this topic, with Germany (19%) and Denmark (16%) having the highest rate of not very interested respondents across all Member States.

77 74 Respondents who would like to receive more information about the CAP (30% of the total sample) A socio demographic analysis reveals very little difference across categories, with large majorities being interested in receiving information about the role of the CAP in boosting the rural economy.

78 75 Across the Member States, of the respondents who would like to receive more information about the CAP, the majority are interested in receiving more information about the role of the Common Agricultural Policy in supporting farmers. There are three countries where more than nine out of ten respondents are interested in receiving more information about supporting farmers: Spain (94% interested ), Ireland (91%) and the United Kingdom (90%). Romania (48%), Ireland (48%) and Cyprus (48%) have the highest rates of respondents who are very interested in receiving more information about the role of the CAP in supporting the farmers whilst in Denmark, only 18% were very interested in more information about this issue. Whilst the majority of respondents in Lithuania and Denmark are interested in receiving more information about the role of the CAP in supporting the farmers, more than one in five respondents are not very interested (Lithuania 25%, Denmark 21%). These countries have the highest proportion of not interested respondents in the European Union. Respondents who would like to receive more information about the CAP (30% of the total sample)
; Respondents who think EU aid to farmers should increase are more likely to be interested in receiving more information about supporting farmers,")
79 76 A socio demographic analysis reveals: Respondents living in rural villages are more interested in receiving more information about the role of the CAP in supporting farmers than respondents living in large towns (89% compared with 83% in large towns); Respondents who think EU aid to farmers should increase are more likely to be interested in receiving more information about supporting farmers, compared to respondents who believe EU aid to farmers should decrease (90% of respondents who think EU aid should increase for 78% of respondents who think EU aid to farmers should decrease); Similarly, respondents who have heard of EU s support to farmers and know the details are more likely to be interested in receiving more information about supporting farmers (93% of respondents who know the details for 84% who have not heard of the EU s support to farmers).
80 77 V. THE BENEFITS PROVIDED BY FORESTS Europeans were asked what they think are the most important benefits provided by forests. Two thirds of Europeans believe the main benefits of forests are to absorb carbon dioxide to fight climate change. The important benefit provided by forests mentioned the most, by two thirds of European respondents is absorbing carbon dioxide, contributing to fight climate change and its detrimental effects (66%). It is followed by providing the animals natural habitats, preserving the different types of animals and plants and conserving nature, cited by 63% of respondents. These two first benefits are much more cited than the others. Two out of five respondents also mentioned an important benefit forest provides is protecting people from natural disasters such as floods and avalanches (40%). At least one in five Europeans believe the benefits forests provide include providing renewable energy using wood as fuel (24%), providing wood to produce furniture and other products (22%) and providing healthy leisure activities (20%). Few respondents felt contributing to jobs and rural development is an important benefit that forests provide, with only 16% mentioning this.
81 78 In 16 Member States, absorbing carbon dioxide, contributing to fight climate change and its detrimental effects is most likely to be mentioned as being the most important benefit provided by forests. This view is particularly strong with four out of five respondents mentioning this benefit from within the Netherlands (85%), Luxembourg (80%) and Cyprus (80%). The country with the lowest rate of respondents mentioning this as being the most important benefit provided by forests is Bulgaria (53%). With the exception of Romania (46%), at least half of respondents in every Member State think that providing animals with natural habitats, preserving the different types of animals and plants and conserving nature is one of the most important benefits of forests and in 11 Member States, this is the most mentioned response. The highest proportion of respondents is from within the Netherlands where 86% share the view, this is one of the most important benefits forests provide. A high proportion of respondents in Denmark (80%) and Sweden (78%) also consider this to be the most important benefit forests provide. There are only two countries where respondents consider protecting people from natural disasters such as floods and avalanches as the most important benefit forests provide: Greece (71%) and Romania (61%). In ten countries, less than a third of their respondents consider this to be an important benefit provided by forests, with only 9% of respondents in Estonia and 11% in Finland mentioning it. Providing renewable energy using wood as fuel is mentioned the most as an important benefit forest provide by respondents in Finland, where 57% hold this view. It is not a commonly held view amongst other countries however, with less than a third of respondents mentioning this benefit in almost every country, with the exception of Slovenia where 44% of respondents mentioned this as a benefit forests provide. This however is the third most popular view for respondents in Slovenia. Only 7% of respondents in the Netherlands consider the most important benefit of forests to provide renewable energy using wood as fuel. Whilst not the top response in Finland, 45% of respondents consider providing wood to produce furniture, paper or construction material as an important benefit forests provide. 41% of respondents in Estonia and Slovenia share this view. Providing healthy leisure activities is not the most mentioned response amongst any countries, however 41% of respondents in Denmark consider this to be one of the most important benefits forests provide. Conversely, only 10% of respondents in Italy view the benefit forests provide, as providing healthy leisure activities. The benefit least mentioned overall in Europe is contributing to jobs and rural development. There are nine countries where one in five respondents consider this to be the most important benefit forests provide. The country where respondents mention it the most is Finland (31%) and only 3% of respondents in the Netherlands consider contributing to jobs and rural development to be a main benefit forests provide.
82 79
83 80 A socio demographic analysis reveals: Younger respondents aged are more likely to think the most important benefits forests provide are providing animal natural habitats, preserving different types of animals etc. (66%-67% of respondents aged in comparison to 59% of respondents aged 55 or over); Conversely, older respondents are more likely to think one of the most important benefits provided by forests are to protect people from natural disasters (43% of respondents aged 55 or over for 34% of those aged 15-24); Managers are more likely than house persons to think the most important benefits provided by forests are to provide animals natural habitats (managers, 70% compared with house persons, 57%) and absorb carbon dioxide, to contribute to fight climate change (managers, 76% compared with house persons, 58%). The self-employed (45%) are more likely than manual workers (37%) and students (35%) to mention that forests protect people from natural disasters such as floods; Respondents who have difficulty paying bills, are less likely to think forests provide animals natural habitats (58%) than those who almost/never have difficulty paying bills (65%); The respondents with a strong political view, are more likely to think the benefit forests provide is to absorb carbon dioxide, contributing to fight climate change (75%) than those with a low political view (66%); Respondents who have heard about the EU support to farmers, are also more likely to think forests provide animals with natural habits (66%) than those who have not heard about the CAP at all (57%). Similarly, for the benefit absorbing carbon dioxide to fight climate change, respondents aware of the EU support to farmers are more likely to mention this than unaware respondents (71%, for. 56%); Europeans who consider agriculture and rural areas as important are more likely to have the view that the benefit forests provide is to provide animals with natural habitats (64% consider agriculture important for 54% of respondents who do not) and absorb carbon dioxide (67% of respondents that consider agriculture important for 59% who do not).
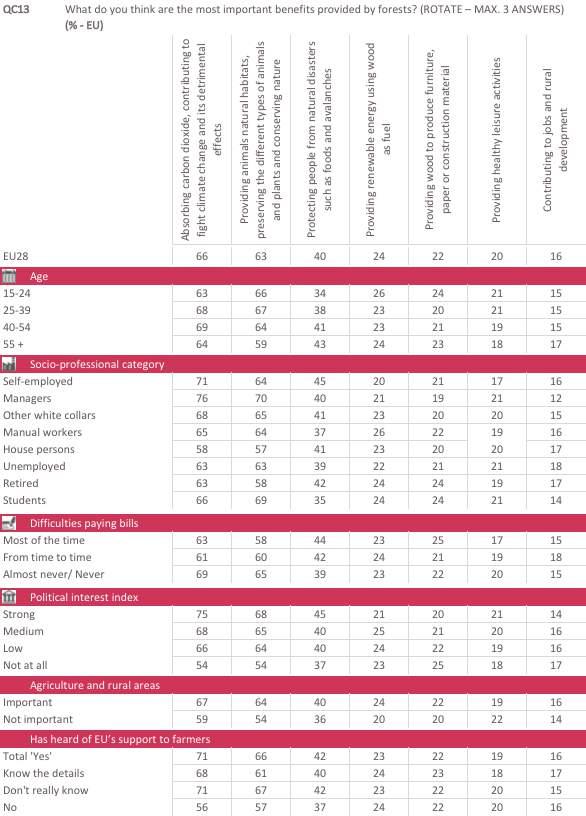
84 81
85 82 VI. RECOGNITION OF QUALITY LABELS European respondents were shown a number of logos and they were asked which of the logos they aware of. This question, was also asked during the Eurobarometer surveys of March 2012 and November Almost two thirds of Europeans are aware of at least one logo Slightly more than six out of ten Europeans (63%) are aware of at least one logo, which is a trend that is unchanged since the survey in A third of Europeans spontaneously said they recognised none of the logos, which is two percentage points less than the result in the 2013 survey. The Fairtrade logo remains the most recognised logo (37%, no change from 2013, +1 percentage point since 2012), followed by the Organic farming logo in second place, which has experienced a decline since previous surveys (23%,-2 since 2013, -1 since 2012). In third place, with the largest increase in recognition since 2013, is the Protected designation of origin (20%, +7pp since 2013; +6pp, 2012) logo with one in five Europeans now recognizing it, up seven percentage points from 2013, and up six points from The Protected geographical indication logo (17%, +3pp since 2013, +3pp 2012) and Traditional specialty guaranteed (15%, +3pp since 2013) logos both had three point increases in the proportion of respondents that recognise them since the last survey in In six Member States, over 80% of respondents are aware of at least one logo: Sweden (90%), Luxembourg (88%), Austria (88%), Ireland (86%), the United Kingdom (85%) and the Netherlands (84%).
86 83 Lithuania has had the largest increase in awareness since the last survey in 2013, with an increase of 28 percentage points to 74% of respondents being aware of at least one logo. Other large increases are observed in Portugal (45%, +19 percentage points), Croatia (47%, +13pp), Greece (48%, +13pp), Slovenia (55%, +13pp), Romania (36%, +10pp), Cyprus (44%, +10pp), France (69%, +10pp), Slovakia (55%, +10pp) and Malta (50%, +10pp). Conversely, the proportion of respondents aware of at least one logo has decreased importantly in Italy (52%, -10pp). A detailed country analysis reveals varying levels of recognition for each of the logos. Fairtrade: there are four EU Member States where more than 80% of respondents recognise the Fairtrade logo: Sweden (84%, +7pp), the United Kingdom (83%, no change), Luxembourg (81%, +7pp) and Austria (81%, +4) have the highest awareness levels. There are however, eight countries where less than 10% of the respondents recognise it for example, Spain (4%, no change) and Romania (5%, no change). Countries with largest increases of the awareness level of the Fair trade logo since 2013 are Slovakia (20%, +8pp), Sweden (84%, +7pp), Luxembourg (81%, +7pp) and Finland (60%, +7pp). Croatia has also increased by eight percentage points, however only 14% of respondents are aware of the Fair trade logo. Organic farming: Lithuania has experienced the greatest increase in awareness of the organic farming logo and has the highest awareness level across all countries (56%, +25pp since 2013 survey). The country with the highest awareness level during the last survey, Austria has experienced the largest decrease in awareness during the 2015 survey (47%, -13pp). Protected designation of origin: awareness levels of respondents have increased across 25 of the 28 Member States with large percentage point increases in a number of countries since the last survey. Respondents within six countries have experienced greater than ten point increases with the largest being France (45%, +25pp) which also is the country with the highest level of awareness for this particular logo, followed by Luxembourg (24%, +19pp) and Greece (29%, +14pp). Few respondents in the United Kingdom (3%, -1pp), Latvia (6%, +3pp) and Denmark (6%, +2pp) are aware of this logo. Protected geographical indication: the highest level of awareness observed is from respondents in France (31%, +12pp), which is also one of the countries with the highest percentage point increase since the last survey in There are increased levels of awareness observed from respondents in Portugal (21%, +15pp), Slovakia (27%, +14pp), Croatia (24%, +11pp) and Cyprus (16%, +11pp). Traditional specialty guaranteed: whilst this particular logo is recognised the least overall by Europeans, there have been increases in awareness levels observed in the majority of EU countries. Lithuania, for example, which now has the highest proportion of respondents aware of this logo, also has observed the highest percentage point increase (43%, +25pp) of all EU countries. Other countries such as Portugal (23%, +17pp), Cyprus (28%, +16pp), Romania (24%, +12pp) and Slovakia (30%, +10pp) have all had greater than 10 percentage point increases observed for this logo.
87 84
88 85 A socio demographic analysis reveals: Recognition of at least one logo is lower amongst older respondents aged 55 or over (56% recognise at least one logo compared with 68% of year olds); A greater proportion of respondents who completed their studies aged 20 or above, are aware of at least one logo (74% of respondents aged 20 or over for 45% of respondents who completed studies aged 15 or under); Managers are more likely to recognise at least one logo than unemployed or house persons (81% of managers for 52% of house persons); Respondents living in large or small/mid-size towns have a higher level of recognition than those living in rural villages (65% in large towns for 59% living in rural villages); Politically aware respondents are more likely to recognise at least one logo (74% with strong political interests for 63% with low political interest, or 49% with none at all). In particular, politically aware respondents are more like to recognise the Organic farming and Fair trade logos (Organic farming 31% of respondents with strong interests for 22% with low political interest, or for 16% with none at all; Fair trade 49% of respondents with strong political interest for 34% of respondents with low political interest, or 24% with none at all); Similarly, respondents who are aware of the details of the CAP are more likely to recognise at least one logo (76% of respondents who know the CAP details for 51% who have never heard of the CAP before); Respondents who believe there should be a decrease in the EU aid provided to farmers through the CAP, are more likely to recognise the Fair trade logo than respondents who believe aid should be increased (46% of respondents who think there should be a decrease in EU aid for 32% who consider EU aid should increase).
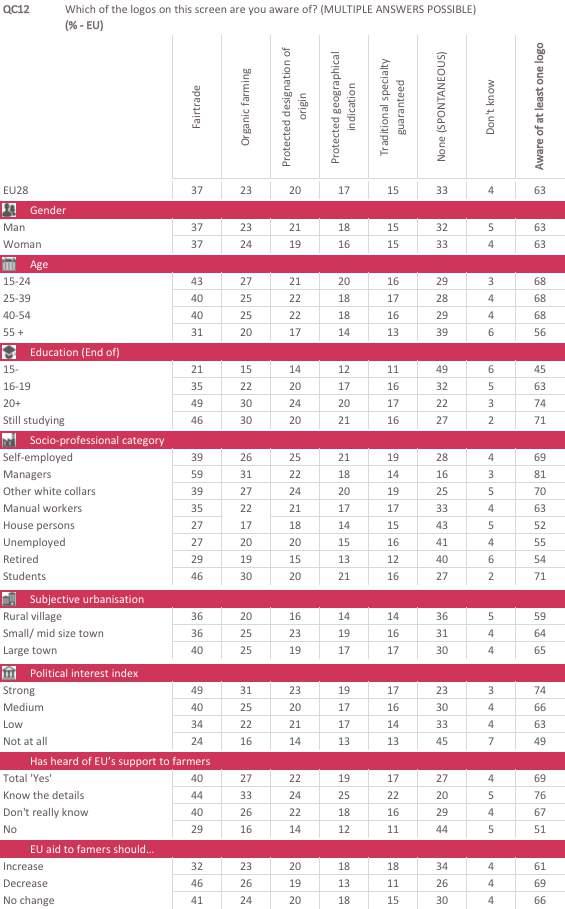
89 86
90 87 CONCLUSION The objectives of this Special Eurobarometer survey were to understand the relationship between Europeans and agriculture within the EU by exploring the level of importance they attach to agriculture, understanding their view of the role of the farmer and what they believe are the main objectives of the EU with regards to agriculture. Determining what Europeans know about the Common Agricultural Policy (CAP) and their views was also a key objective, as well assessing public opinion on the various forms of financial aid provided to farmers. European perception about the role forests play in society was also explored, and how well they recognise various quality logos and labels. By analysing the results from this survey against previous Eurobarometer surveys (2007, 2009, 2012, 2013) we are able to track how public opinion has evolved over time. Generally, Europeans show an increasing concern for agriculture and rural areas. Their views seem to be aligned with regards to what they consider the main responsibility for the farmer and the main objective for the EU; that is, supplying and ensuring products are of good quality, healthy and safe. In this context, it is perhaps surprising that whilst a clear majority of EU citizens continue to agree the CAP benefits all citizens and not only farmers, support has declined considerably since Overall, Europeans have become more aware of the CAP since 2013, although very few claim to know the details. Public opinion is generally positive in reference to whether the EU is fulfilling its role in securing and ensuring products are of good quality, healthy and safe. Whilst not the majority view, a considerable proportion of Europeans think that the EU is not fulfilling its role in providing a fair standard of living for farmers. With this in mind, it is interesting to observe the strengthening the farmer s role in the food chain as one of the top two priorities for the CAP mentioned by Europeans as being important. The other key priority mentioned by Europeans in this survey is the need for investment into rural areas to stimulate economic growth and job creation. In terms of the contribution of the CAP to the EU, the large majority of respondents believe that it improves trade relations between the EU and the rest of the world (66% agree) and helps with the smooth running of the EU single market (65% agree). Europeans believe the reason the EU spends a considerable amount of its budget on the CAP is because by supporting the farmers with financial aid, they are able to guarantee a sustainable food supply for EU citizens. Increasingly so since the last survey in 2013, Europeans understand that in order to achieve this, agriculture requires heavy human and financial investment. Perhaps as a result of this changing view, the majority would like to see EU support for farmers increase in time, however right now they are most likely to think it is about right. There is an increasing proportion of respondents since the last survey holding the view it is too low. Europeans are also generally supportive of the payments made to farmers for carrying out agricultural practices that are beneficial to the environment. They also think that it is justified for the EU to reduce subsidies if farmers do not respect food safety, animal welfare and environmental standards. With regards to forests, Europeans believe they provide mainly environmental benefits such as absorbing carbon dioxide to fight climate change, conserving nature and providing natural animal habitats. The most recognised logo continued to be the Fairtrade logo, however more Europeans recognised the Protected Designation of Origin logo compared to the last survey in 2013.

91 Technical specifications TECHNICAL SPECIFICATIONS Between the 17 th and the 26 th of, TNS opinion & social, a consortium created between TNS political & social, TNS UK and TNS opinion, carried out the wave 84.2 of the EUROBAROMETER survey, on request of the EUROPEAN COMMISSION, Directorate-General for Communication, Strategy, Corporate Communication Actions and Eurobarometer Unit. The wave 84.2 includes the SPECIAL EUROBAROMETER 440 and covers the population of the respective nationalities of the European Union Member States, resident in each of the 28 Member States and aged 15 years and over. TS 1
 and to population density.")
92 Technical specifications The basic sample design applied in all states is a multi-stage, random (probability) one. In each country, a number of sampling points was drawn with probability proportional to population size (for a total coverage of the country) and to population density. In order to do so, the sampling points were drawn systematically from each of the "administrative regional units", after stratification by individual unit and type of area. They thus represent the whole territory of the countries surveyed according to the EUROSTAT NUTS II 1 (or equivalent) and according to the distribution of the resident population of the respective nationalities in terms of metropolitan, urban and rural areas. In each of the selected sampling points, a starting address was drawn, at random. Further addresses (every Nth address) were selected by standard "random route" procedures, from the initial address. In each household, the respondent was drawn, at random (following the "closest birthday rule"). All interviews were conducted face-to-face in people's homes and in the appropriate national language. As far as the data capture is concerned, CAPI (Computer Assisted Personal Interview) was used in those countries where this technique was available. For each country a comparison between the sample and the universe was carried out. The Universe description was derived from Eurostat population data or from national statistics offices. For all countries surveyed, a national weighting procedure, using marginal and intercellular weighting, was carried out based on this Universe description. In all countries, gender, age, region and size of locality were introduced in the iteration procedure. For international weighting (i.e. EU averages), TNS opinion & social applies the official population figures as provided by EUROSTAT or national statistic offices. The total population figures for input in this post-weighting procedure are listed here. Readers are reminded that survey results are estimations, the accuracy of which, everything being equal, rests upon the sample size and upon the observed percentage. With samples of about 1,000 interviews, the real percentages vary within the following confidence limits: 1 Figures updated in August 2015 TS 2
Special Eurobarometer 464b. Report
 Europeans attitudes towards security Survey requested by the European Commission, Directorate-General for Migration and Home Affairs and co-ordinated by the Directorate-General for Communication This document
Special Eurobarometer 461. Report. Designing Europe s future:
 Designing Europe s future: Trust in institutions Globalisation Support for the euro, opinions about free trade and solidarity Fieldwork Survey requested by the European Commission, Directorate-General
EUROPEANS ATTITUDES TOWARDS SECURITY
 Special Eurobarometer 432 EUROPEANS ATTITUDES TOWARDS SECURITY REPORT Fieldwork: March 2015 Publication: April 2015 This survey has been requested by the European Commission, Directorate-General for Migration
Special Eurobarometer 467. Report. Future of Europe. Social issues
 Future of Europe Social issues Fieldwork Publication November 2017 Survey requested by the European Commission, Directorate-General for Communication and co-ordinated by the Directorate- General for Communication
Special Eurobarometer 455
 EU Citizens views on development, cooperation and November December 2016 Survey conducted by TNS opinion & social at the request of the European Commission, Directorate-General for International Cooperation
Standard Eurobarometer 89 Spring Report. European citizenship
 European citizenship Fieldwork March 2018 Survey requested and co-ordinated by the European Commission, Directorate-General for Communication This document does not represent the point of view of the European
EU DEVELOPMENT AID AND THE MILLENNIUM DEVELOPMENT GOALS
 Special Eurobarometer 405 EU DEVELOPMENT AID AND THE MILLENNIUM DEVELOPMENT GOALS REPORT Fieldwork: May - June 2013 Publication: November 2013 This survey has been requested by the European Commission,
Special Eurobarometer 469. Report
 Integration of immigrants in the European Union Survey requested by the European Commission, Directorate-General for Migration and Home Affairs and co-ordinated by the Directorate-General for Communication
PUBLIC PERCEPTIONS OF SCIENCE, RESEARCH AND INNOVATION
 Special Eurobarometer 419 PUBLIC PERCEPTIONS OF SCIENCE, RESEARCH AND INNOVATION SUMMARY Fieldwork: June 2014 Publication: October 2014 This survey has been requested by the European Commission, Directorate-General
Flash Eurobarometer 430. Summary. European Union Citizenship
 European Union Citizenship Survey requested by the European Commission, Directorate-General for Justice and Consumers and co-ordinated by the Directorate-General for Communication This document does not
Flash Eurobarometer 431. Report. Electoral Rights
 Electoral Rights Survey requested by the European Commission, Directorate-General for Justice and Consumers and co-ordinated by the Directorate-General for Communication This document does not represent
Special Eurobarometer 428 GENDER EQUALITY SUMMARY
 Special Eurobarometer 428 GENDER EQUALITY SUMMARY Fieldwork: November-December 2014 Publication: March 2015 This survey has been requested by the European Commission, Directorate-General for Justice and
INTERNAL SECURITY. Publication: November 2011
 Special Eurobarometer 371 European Commission INTERNAL SECURITY REPORT Special Eurobarometer 371 / Wave TNS opinion & social Fieldwork: June 2011 Publication: November 2011 This survey has been requested
Flash Eurobarometer 430. Report. European Union Citizenship
 European Union Citizenship Survey requested by the European Commission, Directorate-General for Justice and Consumers and co-ordinated by the Directorate-General for Communication This document does not
CITIZENS AWARENESS AND PERCEPTIONS OF EU REGIONAL POLICY
 Flash Eurobarometer CITIZENS AWARENESS AND PERCEPTIONS OF EU REGIONAL POLICY REPORT Fieldwork: June 2015 Publication: September 2015 This survey has been requested by the European Commission, Directorate-General
MEDIA USE IN THE EUROPEAN UNION
 Standard Eurobarometer 76 Autumn 2011 MEDIA USE IN THE EUROPEAN UNION REPORT Fieldwork: November 2011 Publication: March 2012 This survey has been requested and co-ordinated by Directorate-General for
Special Eurobarometer 468. Report. Attitudes of European citizens towards the environment
 Attitudes of European citizens towards the environment Fieldwork September- Publication November 2017 Survey requested by the European Commission, Directorate-General for Environment and co-ordinated by
Standard Eurobarometer 89 Spring Report. Europeans and the future of Europe
 Fieldwork March 2018 Survey requested and co-ordinated by the European Commission, Directorate-General for Communication This document does not represent the point of view of the European Commission. The
Special Eurobarometer 470. Summary. Corruption
 Corruption Survey requested by the European Commission, Directorate-General for Migration and Home Affairs and co-ordinated by the Directorate-General for Communication This document does not represent
Flash Eurobarometer 431. Summary. Electoral Rights
 Survey requested by the European Commission, Directorate-General for Justice and Consumers and co-ordinated by the Directorate-General for Communication This document does not represent the point of view
Standard Eurobarometer 88 Autumn Report. Media use in the European Union
 Media use in the European Union Fieldwork November 2017 Survey requested and co-ordinated by the European Commission, Directorate-General for Communication This document does not represent the point of
Special Eurobarometer 471. Summary
 Fairness, inequality and intergenerational mobility Survey requested by the European Commission, Joint Research Centre and co-ordinated by the Directorate-General for Communication This document does not
EUROPEAN UNION CITIZENSHIP
 Flash Eurobarometer EUROPEAN UNION CITIZENSHIP REPORT Fieldwork: November 2012 Publication: February 2013 This survey has been requested by the European Commission, Directorate-General Justice and co-ordinated
EUROBAROMETER The European Union today and tomorrow. Fieldwork: October - November 2008 Publication: June 2010
 EUROBAROMETER 66 Standard Eurobarometer Report European Commission EUROBAROMETER 70 3. The European Union today and tomorrow Fieldwork: October - November 2008 Publication: June 2010 Standard Eurobarometer
EUROPEAN CITIZENSHIP
 Standard Eurobarometer 78 Autumn 2012 EUROPEAN CITIZENSHIP REPORT Fieldwork: November 2012 This survey has been requested and co-ordinated by the European Commission, Directorate-General for Communication.
Directorate General for Communication Direction C - Relations avec les citoyens PUBLIC OPINION MONITORING UNIT 27 March 2009
 Directorate General for Communication Direction C - Relations avec les citoyens PUBLIC OPINION MONITORING UNIT 27 March 2009 EUROPEANS AND THE ECONOMIC CRISIS Standard Eurobarometer (EB 71) Population:
ATTITUDES OF EUROPEAN CITIZENS TOWARDS THE ENVIRONMENT
 Special Eurobarometer 416 ATTITUDES OF EUROPEAN CITIZENS TOWARDS THE ENVIRONMENT SUMMARY Fieldwork: April - May 2014 Publication: September 2014 This survey has been requested by the European Commission,
PATIENTS RIGHTS IN CROSS-BORDER HEALTHCARE IN THE EUROPEAN UNION
 Special Eurobarometer 425 PATIENTS RIGHTS IN CROSS-BORDER HEALTHCARE IN THE EUROPEAN UNION SUMMARY Fieldwork: October 2014 Publication: May 2015 This survey has been requested by the European Commission,
EUROPEANS, THE EUROPEAN UNION AND THE CRISIS
 Standard Eurobarometer 80 Autumn 2013 EUROPEANS, THE EUROPEAN UNION AND THE CRISIS REPORT Fieldwork: November 2013 This survey has been requested and co-ordinated by the European Commission, Directorate-General
Firearms in the European Union
 Flash Eurobarometer 383 Firearms in the European Union SUMMARY Fieldwork: September 2013 Publication: October 2013 This survey has been requested by the European Commission, Directorate-General for Home
Flash Eurobarometer 364 ELECTORAL RIGHTS REPORT
 Flash Eurobarometer ELECTORAL RIGHTS REPORT Fieldwork: November 2012 Publication: March 2013 This survey has been requested by the European Commission, Directorate-General Justice and co-ordinated by Directorate-General
The European emergency number 112
 Flash Eurobarometer The European emergency number 112 REPORT Fieldwork: December 2011 Publication: February 2012 Flash Eurobarometer TNS political & social This survey has been requested by the Directorate-General
Special Eurobarometer 469
 Summary Integration of immigrants in the European Union Survey requested by the European Commission, Directorate-General for Migration and Home Affairs and co-ordinated by the Directorate-General for Communication
Flash Eurobarometer 429. Summary. The euro area
 LOGO CE_Vertical_EN_NEG_quadri rouge Summary Survey requested by the European Commission, Directorate-General for Economic and Financial Affairs and co-ordinated by the Directorate-General for Communication
Europeans attitudes towards climate change
 Special Eurobarometer 313 EUROPEAN PARLIAMENT EUROPEAN COMMISSION Europeans attitudes towards climate change Special Eurobarometer 313 / Wave 71.1 TNS Opinion & Social Report Fieldwork: January - February
The European Emergency Number 112. Analytical report
 Flash Eurobarometer 314 The Gallup Organization Gallup 2 Flash Eurobarometer N o 189a EU communication and the citizens Flash Eurobarometer European Commission The European Emergency Number 112 Analytical
Special Eurobarometer 474. Summary. Europeans perceptions of the Schengen Area
 Summary Europeans perceptions of the Schengen Area Survey requested by the European Commission, Directorate-General for Migration and Home Affairs and co-ordinated by the Directorate-General for Communication
EUROPEAN YOUTH: PARTICIPATION IN DEMOCRATIC LIFE
 Flash Eurobarometer 375 EUROPEAN YOUTH: PARTICIPATION IN DEMOCRATIC LIFE SUMMARY Fieldwork: April 2013 Publication: May 2013 This survey has been requested by the European Commission, Directorate-General
Flash Eurobarometer 408 EUROPEAN YOUTH SUMMARY
 Flash Eurobarometer 408 EUROPEAN YOUTH SUMMARY Fieldwork: December 2014 Publication: April 2015 This survey has been requested by the European Commission, Directorate-General for Education and Culture
The. Special Eurobarometer 368. Special Eurobarometer 368 / Wave EB 75.3 TNS opinion & social. This document. of the authors.
 Special Eurobarometer 368 European Commission The Common Agricultural Policy REPORT Special Eurobarometer 368 / Wave TNS opinion & social Fieldwork: May 2011 Publication: September 2011 This survey has
EUROPEAN CITIZENSHIP
 Standard Eurobarometer 80 Autumn 2013 EUROPEAN CITIZENSHIP REPORT Fieldwork: November 2013 This survey has been requested and co-ordinated by the European Commission, Directorate-General for Communication.
EUROPEAN CITIZENSHIP
 Standard Eurobarometer 81 Spring 2014 EUROPEAN CITIZENSHIP REPORT Fieldwork: June 2014 This survey has been requested and co-ordinated by the European Commission, Directorate-General for Communication.
WOMEN IN DECISION-MAKING POSITIONS
 Special Eurobarometer 376 WOMEN IN DECISION-MAKING POSITIONS SUMMARY Fieldwork: September 2011 Publication: March 2012 This survey has been requested by Directorate-General Justice and co-ordinated by
EUROPEAN CITIZENSHIP
 Standard Eurobarometer 82 Autumn 2014 EUROPEAN CITIZENSHIP REPORT Fieldwork: November 2014 This survey has been requested and co-ordinated by the European Commission, Directorate-General for Communication.
Women in the EU. Fieldwork : February-March 2011 Publication: June Special Eurobarometer / Wave 75.1 TNS Opinion & Social EUROPEAN PARLIAMENT
 EUROPEAN PARLIAMENT Women in the EU Eurobaromètre Spécial / Vague 74.3 TNS Opinion & Social Fieldwork : February-March 2011 Publication: June 2011 Special Eurobarometer / Wave 75.1 TNS Opinion & Social
The Rights of the Child. Analytical report
 Flash Eurobarometer 273 The Gallup Organisation Analytical Report Flash EB N o 251 Public attitudes and perceptions in the euro area Flash Eurobarometer European Commission The Rights of the Child Analytical
PUBLIC OPINION IN THE EUROPEAN UNION
 Standard Eurobarometer 81 Spring 2014 PUBLIC OPINION IN THE EUROPEAN UNION FIRST RESULTS Fieldwork: June 2014 Publication: July 2014 This survey has been requested and co-ordinated by the European Commission,
Context Indicator 17: Population density
 3.2. Socio-economic situation of rural areas 3.2.1. Predominantly rural regions are more densely populated in the EU-N12 than in the EU-15 Context Indicator 17: Population density In 2011, predominantly
A. The image of the European Union B. The image of the European Parliament... 10
 Directorate General for Communication Direction C Relations with citizens PUBLIC OPINION MONITORING UNIT EUROPEAN ELECTIONS 2009 25/05/2009 Pre electoral survey First wave First results: European average
September 2012 Euro area unemployment rate at 11.6% EU27 at 10.6%
 STAT/12/155 31 October 2012 September 2012 Euro area unemployment rate at 11.6% at.6% The euro area 1 (EA17) seasonally-adjusted 2 unemployment rate 3 was 11.6% in September 2012, up from 11.5% in August
PUBLIC OPINION IN THE EUROPEAN UNION
 Standard Eurobarometer 77 Spring 2012 PUBLIC OPINION IN THE EUROPEAN UNION REPORT Fieldwork: May 2012 This survey has been requested and co-ordinated by the European Commission, Directorate-General for
Euro area unemployment rate at 9.9% EU27 at 9.4%
 STAT/11/76 April 2011 Euro area unemployment rate at 9.9% EU27 at 9.4% The euro area 1 (EA17) seasonally-adjusted 2 unemployment rate 3 was 9.9% in April 2011, unchanged compared with March 4. It was.2%
Standard Eurobarometer 85. Public opinion in the European Union
 Public opinion in the European Union Fieldwork: May 2016 Survey conducted by TNS opinion & social at the request of the European Commission, Directorate-General for Communication Survey coordinated by
CITIZENS AWARENESS AND PERCEPTIONS OF EU REGIONAL POLICY
 Flash Eurobarometer 384 CITIZENS AWARENESS AND PERCEPTIONS OF EU REGIONAL POLICY SUMMARY Fieldwork: September 2013 Publication: December 2013 This survey has been requested by the European Commission,
Employment and Social Policy
 Special Eurobarometer 77 European Commission Employment and Social Policy SUMMARY Special Eurobarometer 77 / Wave EB76. TNS opinion & social Fieldwork: September- October 0 Publication: November 0 This
EUROBAROMETER 72 PUBLIC OPINION IN THE EUROPEAN UNION. Autumn The survey was requested and coordinated by Directorate-General Communication
 Standard Eurobarometer EUROBAROMETER 72 PUBLIC OPINION IN THE EUROPEAN UNION Autumn 2009 NATIONAL REPO Standard Eurobarometer 72 / Autumn 2009 TNS Opinion & Social UNITED KINGDOM The survey was requested
Standard Eurobarometer 89 Spring Public opinion in the European Union
 Public opinion in the European Union Fieldwork March 2018 Survey requested and co-ordinated by the European Commission, Directorate-General for Communication This document does not represent the point
Europeans and the crisis
 EUROPEAN PARLIAMENT Europeans and the crisis Report Fieldwork: August September 2010 Publication: November 2010 Special Eurobarometer/Wave 74.1 TNS Opinion & Social Eurobaromètre spécial / Vague 74.1 TNS
Special Eurobarometer 468. Attitudes of European citizens towards the environment
 Attitudes of European citizens towards the environment Fieldwork September- Publication November 2017 Survey requested by the European Commission, Directorate-General for Environment and co-ordinated by
Europeans attitudes towards climate change
 Special Eurobarometer European Commission Europeans attitudes towards climate change Fieldwork: August - September 2009 Publication: November 2009 Special Eurobarometer 322 / Wave 72.1 TNS Opinion & Social
Data Protection in the European Union. Data controllers perceptions. Analytical Report
 Gallup Flash Eurobarometer N o 189a EU communication and the citizens Flash Eurobarometer European Commission Data Protection in the European Union Data controllers perceptions Analytical Report Fieldwork:
Making a difference in the world: Europeans and the future of development aid
 Special Eurobarometer 375 European Commission Making a difference in the world: Europeans and the future of development aid REPORT Special Eurobarometer 375 / Wave 7.61 TNS opinion & social Fieldwork:
Young people and science. Analytical report
 Flash Eurobarometer 239 The Gallup Organization The Gallup Organization Flash EB N o 187 2006 Innobarometer on Clusters Flash Eurobarometer European Commission Young people and science Analytical report
The European Emergency Number 112
 Gallup 2 Flash Eurobarometer N o 189a EU communication and the citizens Flash Eurobarometer European Commission The European Emergency Number 112 Summary Fieldwork: January 2008 Publication: February 2008
The Rights of the Child. Analytical report
 The Gallup Organization Flash EB N o 187 2006 Innobarometer on Clusters Flash Eurobarometer European Commission The Rights of the Child Analytical report Fieldwork: February 2008 Report: April 2008 Flash
Views on European Union Enlargement
 Flash Eurobarometer 257 The Gallup Organization Flash EB N o 255 Dual circulation period, Slovakia Flash Eurobarometer European Commission Views on European Union Enlargement Analytical Report Fieldwork:
EUROPEAN CITIZENSHIP
 Standard Eurobarometer 77 Spring 2012 EUROPEAN CITIZENSHIP REPORT Fieldwork: May 2012 This survey has been requested and co-ordinated by the European Commission, Directorate-General for Communication.
EUROBAROMETER 72 PUBLIC OPINION IN THE EUROPEAN UNION Volume 2
 Standard Eurobarometer European Commission EUROBAROMETER 72 PUBLIC OPINION IN THE EUROPEAN UNION Volume 2 REPORT Fieldwork: October - November 2009 Standard Eurobarometer 72 / Autumn 2009 - TNS opinion
Alternative views of the role of wages: contours of a European Minimum Wage
 Alternative views of the role of wages: contours of a European Minimum Wage Europe at a crossroads which way to quality jobs and prosperity? ETUI-ETUC Conference Brussels, 24-26 September 2014 Dr. Torsten
PUBLIC OPINION IN THE EUROPEAN UNION
 Standard Eurobarometer 79 Spring 2013 PUBLIC OPINION IN THE EUROPEAN UNION FIRST RESULTS Fieldwork: May 2013 Publication: July 2013 This survey has been requested and co-ordinated by the European Commission,
of the European Commission. and the Communication. This document of the authors. Standard Eurobarometer 75 / Spring 2011 TNS opinion & social
 Standard Eurobarometer European Commission EUROBAROMETER 75 SPRING 2011 Europeans, the European Union crisis and the REPORT Standard Eurobarometer 75 / Spring 2011 TNS opinion & social Fieldwork: May 2011
of the European Commission. Communication. This document of the authors. Standard Eurobarometer 75 / Spring 2011 TNS opinion & social
 Standard Eurobarometer European Commission EUROBAROMETER 75 SPRING 2011 Europe 2020 REPORT Standard Eurobarometer 75 / Spring 2011 TNS opinion & social Fieldwork: May 2011 Publication: August 2011 This
SPECIAL EUROBAROMETER 360
 Special Eurobarometer European Commission SPECIAL EUROBAROMETER 360 Consumer understanding of labels and the safe use of chemicals REPORT Special Eurobarometer 360 / Wave TNS Opinion & Social Fieldwork:
Civil protection Full report
 Special Eurobarometer European Commission Civil protection Full report Fieldwork: September-October 2009 Publication: November 2009 Special Eurobarometer 328 / Wave TNS Opinion & Social This survey was
ENTREPRENEURSHIP IN THE EU AND BEYOND
 Flash Eurobarometer 354 ENTREPRENEURSHIP IN THE EU AND BEYOND COUNTRY REPORT JAPAN Fieldwork: July 2012 This survey has been requested by the European Commission, Directorate-General Enterprise and Industry
CULTURAL ACCESS AND PARTICIPATION
 Special Eurobarometer 399 CULTURAL ACCESS AND PARTICIPATION SUMMARY Fieldwork: April May 2013 Publication: November 2013 This survey has been requested by the European Commission, Directorate-General for
Convergence: a narrative for Europe. 12 June 2018
 Convergence: a narrative for Europe 12 June 218 1.Our economies 2 Luxembourg Ireland Denmark Sweden Netherlands Austria Finland Germany Belgium United Kingdom France Italy Spain Malta Cyprus Slovenia Portugal
ERGP REPORT ON CORE INDICATORS FOR MONITORING THE EUROPEAN POSTAL MARKET
 ERGP (15) 27 Report on core indicators for monitoring the European postal market ERGP REPORT ON CORE INDICATORS FOR MONITORING THE EUROPEAN POSTAL MARKET 3 December 2015 CONTENTS 1. EXECUTIVE SUMMARY...
Data Protection in the European Union. Citizens perceptions. Analytical Report
 Gallup Flash Eurobarometer N o 189a EU communication and the citizens Flash Eurobarometer European Commission Data Protection in the European Union Citizens perceptions Analytical Report Fieldwork: January
Flash Eurobarometer 405 THE EURO AREA SUMMARY
 Flash Eurobarometer 405 THE EURO AREA SUMMARY Fieldwork: October 2014 Publication: October 2014 This survey has been requested by the European Commission, Directorate-General for Economic and Financial
EUROBAROMETER 73 FIRST RESULTS
 Standard Eurobarometer European Commission EUROBAROMETER 73 PUBLIC OPINION IN THE EUROPEAN UNION FIRST RESULTS Fieldwork: May 2010 Publication: August 2010 Standard Eurobarometer 73/ Spring 2010 - TNS
SPECIAL EUROBAROMETER 365
 Special Eurobarometer European Commission SPECIAL EUROBAROMETER 365 Attitudes of European citizens towards the environment SUMMARY Fieldwork: April May 2011 Special Eurobarometer 365 / Wave 75.2 TNS Opinion
The Unitary Patent and the Unified Patent Court. Dr. Leonard Werner-Jones
 The Unitary Patent and the Unified Patent Court Dr. Leonard Werner-Jones Background The Past: No centralization at all Prosecution country-by-country Litigation country-by-country Patents actions 2 Background
Electoral rights of EU citizens. Analytical Report
 Flash Eurobarometer 292 The Gallup Organization Flash EB No 292 Electoral Rights Analytical Report Flash Eurobarometer European Commission Electoral rights of EU citizens Analytical Report Fieldwork: March
Views on European Union enlargement
 Flash Eurobarometer 257 The Gallup Organization Flash EB N o 257 Views on European Union enlargement Flash Eurobarometer European Commission Views on European Union enlargement Fieldwork: February 2009
EUROBAROMETER 69 SPRING 2008 NATIONAL REPORT UNITED KINGDOM. Standard Eurobarometer PUBLIC OPINION IN THE EUROPEAN UNION
 Standard Eurobarometer 69 / Spring 2008 TNS Opinion & Social Standard Eurobarometer European Commission EUROBAROMETER 69 PUBLIC OPINION IN THE EUROPEAN UNION SPRING 2008 NATIONAL REPORT UNITED KINGDOM
Special Eurobarometer 459. Climate change
 Climate change Survey requested by the European Commission, Directorate-General for Climate Action and co-ordinated by the Directorate- General for Communication This document does not represent the point
EUROBAROMETER 68 AUTUMN 2007 NATIONAL REPORT UNITED KINGDOM. Standard Eurobarometer PUBLIC OPINION IN THE EUROPEAN UNION
 Standard Eurobarometer European Commission EUROBAROMETER 68 PUBLIC OPINION IN THE EUROPEAN UNION AUTUMN 2007 Standard Eurobarometer 68 / Autumn 2007 TNS Opinion & Social NATIONAL REPORT UNITED KINGDOM
European Parliament Eurobarometer (EB79.5) ONE YEAR TO GO TO THE 2014 EUROPEAN ELECTIONS Economic and social part DETAILED ANALYSIS
 ONE YEAR TO GO TO THE 2014 EUROPEAN ELECTIONS Economic and social part DETAILED ANALYSIS") Directorate-General for Communication Public Opinion Monitoring Unit Brussels, 18 October 2013 European Parliament Eurobarometer (EB79.5) ONE YEAR TO GO TO THE 2014 EUROPEAN ELECTIONS Economic and social
Directorate-General for Communication Public Opinion Monitoring Unit Brussels, 18 October 2013 European Parliament Eurobarometer (EB79.5) ONE YEAR TO GO TO THE 2014 EUROPEAN ELECTIONS Economic and social
ENTREPRENEURSHIP IN THE EU AND BEYOND
 Flash Eurobarometer 354 ENTREPRENEURSHIP IN THE EU AND BEYOND COUNTRY REPORT GERMANY Fieldwork: June 2012 This survey has been requested by the European Commission, Directorate-General Enterprise and Industry
Standard Eurobarometer 77 Spring 2012 EUROPE 2020 REPORT
 Standard Eurobarometer 77 Spring 2012 EUROPE 2020 REPORT Fieldwork: May 2012 This survey has been requested and co-ordinated by the European Commission, Directorate-General for Communication. http://ec.europa.eu/public_opinion/index_en.htm
Territorial Evidence for a European Urban Agenda
 ESPON Workshop: Territorial Evidence for a European Urban Agenda The territorial and urban issues in the 6th Cohesion Report Alexandros Karvounis Economic Analysis Unit, DG REGIO 25 November 2014, Brussels
Flash Eurobarometer 354. Entrepreneurship COUNTRY REPORT GREECE
 Flash Eurobarometer 354 Entrepreneurship COUNTRY REPORT GREECE Fieldwork: June 2012 This survey has been requested by the European Commission, Directorate-General Enterprise and Industry and co-ordinated
Report on women and men in leadership positions and Gender equality strategy mid-term review
 EUROPEAN COMMISSION MEMO Brussels, 14 October 2013 Report on women and men in leadership positions and Gender equality strategy mid-term review 1. New Report on Women in Decision-Making: What is the report
ATTITUDES OF EUROPEANS TOWARDS TOURISM
 Flash Eurobarometer 370 ATTITUDES OF EUROPEANS TOWARDS TOURISM SUMMARY Fieldwork: January 2013 Publication: March 2013 This survey has been requested by the European Commission, Directorate-General for
PUBLIC OPINION IN THE EUROPEAN UNION
 Standard Eurobarometer 77 Spring 2012 PUBLIC OPINION IN THE EUROPEAN UNION FIRST RESULTS Fieldwork: May 2012 Publication: July 2012 This survey has been requested and co-ordinated by the European Commission,
I m in the Dublin procedure what does this mean?
 EN I m in the Dublin procedure what does this mean? B Information for applicants for international protection found in a Dublin procedure, pursuant to article 4 of Regulation (EU) No 604/2013 1 You have
Objective Indicator 27: Farmers with other gainful activity
 3.5. Diversification and quality of life in rural areas 3.5.1. Roughly one out of three farmers is engaged in gainful activities other than farm work on the holding For most of these farmers, other gainful
EU, December Without Prejudice
 Disclaimer: The negotiations between the EU and Japan on the Economic Partnership Agreement (the EPA) have been finalised. In view of the Commission's transparency policy, we are hereby publishing the
What does the Tourism Demand Surveys tell about long distance travel? Linda Christensen Otto Anker Nielsen
 What does the Tourism Demand Surveys tell about long distance travel? Linda Christensen Otto Anker Nielsen Overview of the presentation 1. The Tourism Demand Survey 2. Data 3. Share of respondents travelling