EUROPEAN CITIZENSHIP
|
|
|
- Gerald Black
- 5 years ago
- Views:
Transcription


1 Standard Eurobarometer 82 Autumn 2014 EUROPEAN CITIZENSHIP REPORT Fieldwork: November 2014 This survey has been requested and co-ordinated by the European Commission, Directorate-General for Communication. This document does not represent the point of view of the European Commission. The interpretations and opinions contained in it are solely those of the authors. Standard Eurobarometer 82 / Autumn 2014 TNS opinion & social
2 Project title Linguistic Version Catalogue Number Special Eurobarometer 82 European citizenship EN NA EN-N ISBN DOI /14950 European Union, 2015
3 Standard Eurobarometer 82 Autumn 2014 European Citizenship Survey conducted by TNS opinion & social at the request of the European Commission, Directorate-General Communication Survey coordinated by the European Commission, Directorate-General Communication (DG COMM "Strategy, Corporate Communication Actions and Eurobarometer" Unit) 0
4 TABLE OF CONTENTS TABLE OF CONTENTS... 1 INTRODUCTION... 2 I. ATTACHMENT TO THE EUROPEAN UNION... 5 II. THE EUROPEAN UNION S ACHIEVEMENTS III. EUROPEAN CITIZENSHIP THE SENSE OF EUROPEAN CITIZENSHIP UPDATE ON THE SENSE OF EUROPEAN CITIZENSHIP THE SENSE OF EUROPEAN CITIZENSHIP COMPARED WITH NATIONAL CITIZENSHIP LEVERS FOR STRENGTHENING THE SENSE OF EUROPEAN CITIZENSHIP RIGHTS AS EUROPEAN CITIZENS IV. THE OPENNESS OF EUROPEANS TO OTHERS V. VALUES ANNEXES Technical specifications 1
5 INTRODUCTION This Standard Eurobarometer survey was carried out between 8 and 17 November in 35 countries and territories: the 28 Member States of the European Union, the six candidate countries (the Former Yugoslav Republic of Macedonia, Turkey, Iceland, Montenegro, Serbia and Albania) and the Turkish Cypriot Community in the part of the country not controlled by the government of the Republic of Cyprus. The European Commission presided over by Jean-Claude Junker took office on 1 November As the votes cast by European citizens in the European elections of May had influenced the choice of President of the Commission, it is interesting to analyse the evolutions in their answers to the questions on the theme of European citizenship was marked by the centenary commemoration of the outbreak of the First World War 3. Simultaneously, the Ukrainian crisis represents the return of armed conflict on the European Union s doorstep. As peace between the Member States is perceived as one of the main achievements of European integration, it is appropriate to examine any changes in the way Europeans define European identity and its values. This Standard Eurobarometer survey of autumn 2014 provides some answers, and approaches the theme of European citizenship from the following angles: - Attachment to the European Union; - Perceptions of the European Union s achievements: what do European citizens see as the European Union s most positive results? - The concepts of European citizenship and identity: do Europeans see themselves as European citizens? How can this feeling be strengthened? Do they know their rights as European citizens? Do they want more information on the subject? - The openness of Europeans: have Europeans travelled to neighbouring EU countries or socialised with other EU citizens, do they take an interest in European culture or shop in other EU countries? - Values: what values do Europeans most readily associate with the European Union? What are their personal values? 1 Please consult the technical specifications for the exact dates of the fieldwork in each country The EU leaders attending the European Council of June 2014 commemorated the beginning of the First World War at a ceremony in the city of Ypres (Belgium) on 26 June. 2
6 The full report of the Standard Eurobarometer 82 consists of several volumes. The first volume presents the main public opinion trends in the European Union. Three other volumes present the opinions of Europeans on other themes: the Europe 2020 strategy; European citizenship; and media use in the European Union. This volume is devoted to European citizenship. The general analysis and the socio-demographic analyses are based on the average results of the 28 Member States. This average is weighted so that it reflects the population of each Member State. The averages for the previous surveys represent the results obtained in all the Member States of the European Union, as it was composed at the time the survey was conducted. 3
7 The methodology used is that of the Standard Eurobarometer surveys of the Directorate- General Communication ( Strategy, Corporate Communication Actions and Eurobarometer Unit) 4. A technical note on the interviewing methods of the institutes of the TNS opinion & social network is attached to this report. This note also specifies the confidence intervals 5, which are used to assess the accuracy of the results of a survey, according to the size of the sample interviewed in relation to the total size of the population studied. The abbreviations used in this report correspond to: ABBREVIATIONS BE Belgium LV Latvia BG Bulgaria LU Luxembourg CZ Czech Republic HU Hungary DK Denmark MT Malta DE Germany NL The Netherlands EE Estonia AT Austria EL Greece PL Poland ES Spain PT Portugal FR France RO Romania HR Croatia SI Slovenia IE Ireland SK Slovakia IT Italy FI Finland CY Republic of Cyprus* SE Sweden LT Lithuania UK United Kingdom CY (tcc) Turkish Cypriot Community EU28 European Union weighted average for the 28 Member States TR Turkey MK Former Yugoslav Republic of Macedonia ** IS Iceland ME Montenegro RS Serbia AL Albania Euro area Noneuro area BE, FR, IT, LU, DE, AT, ES, PT, IE, NL, FI, EL, EE, SI, CY, MT, SK, LV BG, CZ, DK, HR, LT, HU, PL, RO, SE, UK * Cyprus as a whole is one of the 28 European Union Member States. However, the acquis communautaire has been suspended in the part of the country which is not controlled by the government of the Republic of Cyprus. For practical reasons, only the interviews carried out in the part of the country controlled by the government of the Republic of Cyprus are included in the CY category and in the EU28 average. The interviews carried out in the part of the country that is not controlled by the government of the Republic of Cyprus are included in the CY(tcc) [tcc: Turkish Cypriot Community) category] ** Provisional abbreviation which in no way prejudges the definitive name of this country, which will be agreed once the current negotiations at the United Nations have been completed * * * * * We wish to thank all the people interviewed throughout Europe who took the time to participate in this survey. Without their active participation, this survey would not have been possible The results tables are annexed. It should be noted that the total of the percentages indicated in the tables in this report may exceed 100% where respondents were able to choose several answers to one question. 4

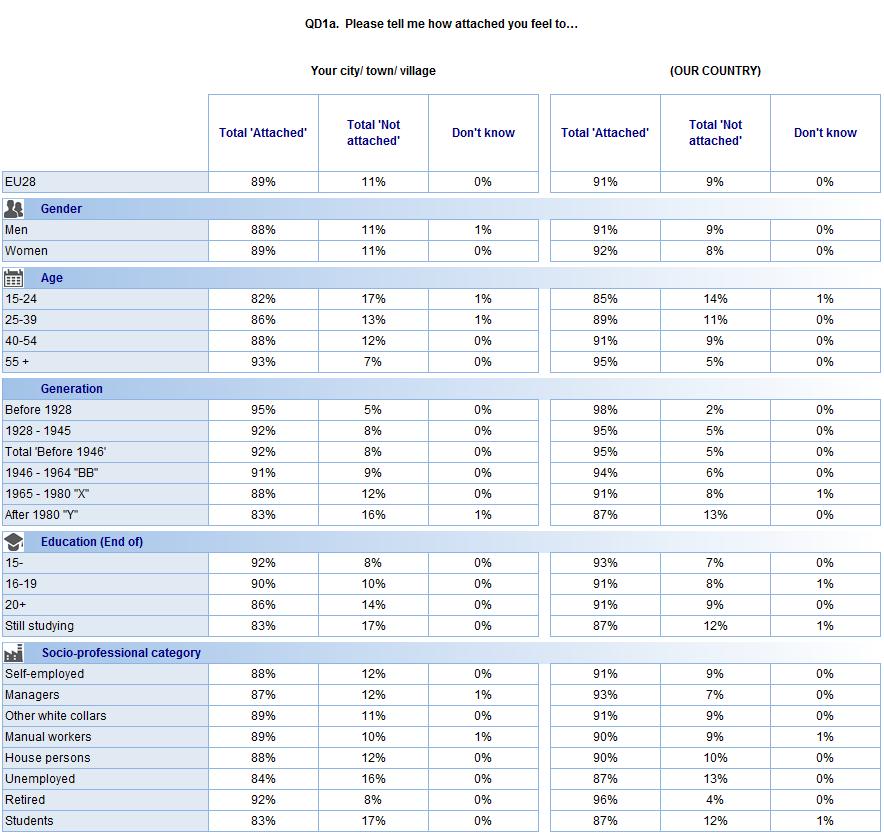
8 I. ATTACHMENT TO THE EUROPEAN UNION A majority of Europeans are attached to Europe, but only a minority feel attached to the European Union The attachment of Europeans to their city/town/village and country Almost nine out of ten Europeans are attached to their city/town/village, a slightly higher proportion than in autumn 2013, but still slightly below the level of attachment to their country (89%, +2 percentage points). An absolute majority of Europeans now feel very attached to their city/town/village (52%, +3). A very large majority of Europeans feel attached to their country (91%, versus 9% who are not attached, unchanged since the Standard Eurobarometer survey of autumn 2013) 6. More than half of Europeans feel very attached to their country (54%, unchanged). 6 QD1. Please tell me how attached you feel to 5
9 Although Europeans in general are slightly less likely to feel attached to their city/town/village than to their country, more than 80% of respondents in 25 Member States nevertheless do feel attached to their city/town/village, most notably in Portugal (97%, +3 percentage points since autumn 2013), Bulgaria (96%, unchanged) and Greece (96%, =). This attachment also exceeds 70% in three other Member States: the Netherlands, (74%, +3), Estonia (78%, -3) and Malta (79%, -1). Here again, levels of attachment have changed only slightly since autumn 2013, with the biggest increase in Italy (92%, +5) and the biggest decrease in Sweden (85%, -4). 6
10 As was the case the last time this indicator was measured in the Standard Eurobarometer survey of autumn 2013 (EB80), more than 80% of respondents in every Member State are attached to their country, with the highest scores in Denmark (98%, +2 percentage points since autumn 2013), Greece (97%, -1) and Portugal (97%, +1). Attachment is relatively less pronounced in Belgium (83%, -1), Spain (83%, unchanged) and the Netherlands (86%, +2). Evolutions since the autumn 2013 survey are relatively modest: Cyprus (93%, -5) and Croatia (87%, -5) recorded the biggest decreases. In almost all the Member States, respondents are more likely to feel attached to their country than to their city/town/village. There are three exceptions: Spain (92% feel attached to their city/town/village compared with 83% to their country), Croatia (91% versus 87%) and Romania (93% versus 92%). 7
11 In the candidate countries, the situation is different since respondents in five countries feel more attached to their city/town/village than to their country: in Albania, where the survey was conducted for the first time (95% of respondents are attached to their city/town/village compared with 94% who are attached to their country), the former Yugoslav Republic of Macedonia (92%, versus 84%), Montenegro (92%, versus 86%), Turkey (90%, versus 79%, the widest difference) and Serbia (84%, versus 81%). Only respondents in Iceland feel more attached to their country (96%) than to their city/town/village (82%). A socio-demographic analysis reveals that: - Attachment to the city/town/village increases with age, rising from 82% of year-olds to 86% of year-olds, 88% of year-olds and 93% of those in the 55-plus age group; and from 83% of those born after 1980 to 92% of those born before It is also more pronounced among those who left school at the age of 15 or earlier (92%) than among those who studied up to the age of 20 and beyond (86%), and among manual workers and white-collar workers (both 89% ) than among unemployed people (84%); - Attachment to the country also increases with age: 85% of year-olds feel attached to their country, compared with 89% of year-olds, 91% of year-olds and 95% of the 55-plus age group. It reaches 95% among those born before 1946 compared with 87% of members of generation Y, those born after Attachment is also slightly more prevalent among managers (93%) than among unemployed people (87%). 8
12 9
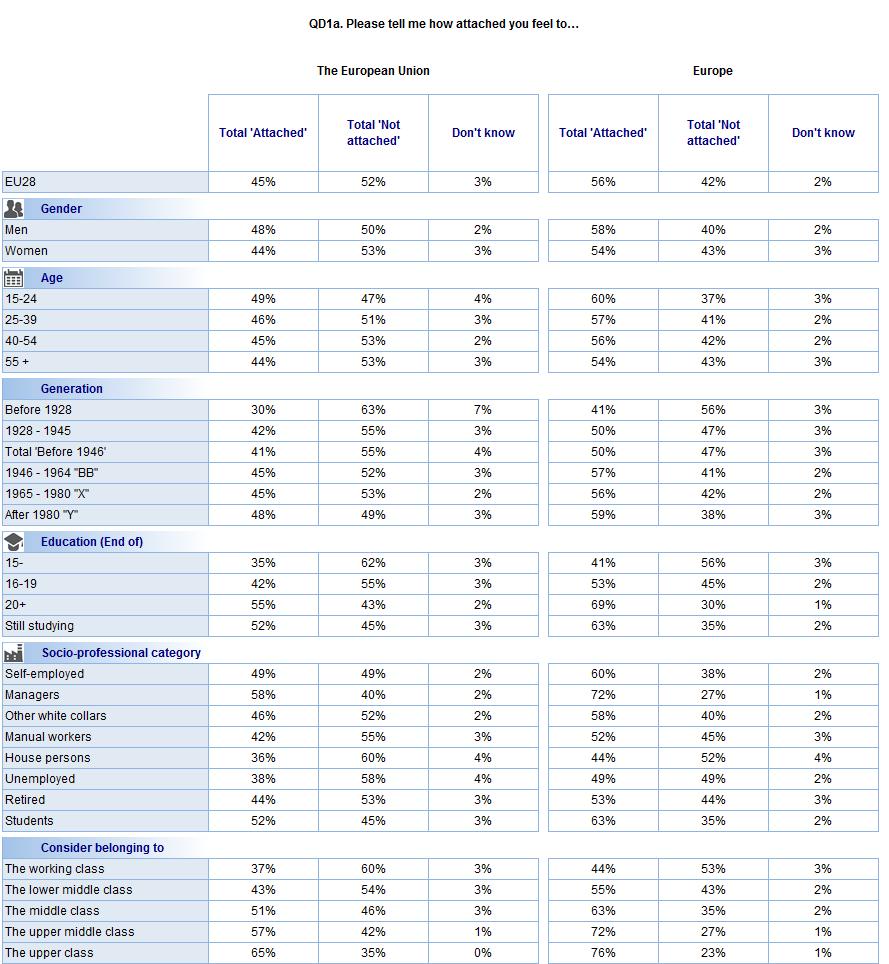
13 Attachment to the European Union and Europe Attachment to the European Union is more or less unchanged since the Standard Eurobarometer survey of autumn 2013: 45% of respondents feel attached to the European Union (-1 percentage point), while 52% do not (unchanged). Almost one in ten Europeans feel very attached to the EU (9%, =). Europeans were also asked about their attachment to Europe : 56% of respondents feel attached to Europe, a decline of 11 percentage points since the Special Eurobarometer survey of February-March , while 42% (+10) feel no such attachment. Furthermore, the proportion of respondents who feel very attached to Europe is now only slightly higher than the proportion who are not at all attached to it (13%, -7, versus 12%, +6). 7 Special Eurobarometer survey 278 (EB67.1): European cultural values 10
 and Estonia (50% versus 47%, compared with 46%")
14 A majority of respondents in 11 Member States feel attached to the European Union, up from ten in autumn A majority of respondents now feel attached to the EU in France (51% attached versus 46% not attached, compared with 49% versus 50% in autumn 2013) and Estonia (50% versus 47%, compared with 46% versus 53%), but only a minority now do so in Bulgaria (44% versus 53%, compared with 53% versus 43%). A majority of respondents continue to feel attachment to the EU in Luxembourg (72%, +5 percentage points), Latvia (63%, +6), Poland (59%, +2), Romania (58%, +10), Malta (55%, +5), Slovakia (54%, +3), Belgium (51%, -8), Hungary (51%, -3) and Germany (49%, -6, versus 48%, +5). While attachment has gained some ground, respondents in Cyprus (27%, +3 percentage points) and Greece (30%, +3) remain the least likely to say they feel attached to the EU. Attachment has gained ground in 16 Member States, led by Romania (58%, +10 percentage points), the United Kingdom (36%, +7) and Latvia (63%, +6). However, it has decreased significantly in Bulgaria (44%, -9), Belgium (51%, -8) and Germany (49%, -6). 11
15 A majority of respondents in 22 Member States feel attached to Europe, and there is even an absolute majority in 21 of them, most notably in Luxembourg (79%, -3 percentage points since February-March 2007), Sweden (75%, -2) and Denmark (72%, -8). Only minorities do so in Cyprus (35% attached versus 64% not attached, compared with 40% versus 60% in February-March 2007), Greece (37% versus 63%, compared with 48% versus 52%), Slovenia (44% versus 54%, compared with 66% versus 33%), Portugal (45% versus 54%, compared with 63% versus 36%), the United Kingdom (45% versus 53%, compared with 52% versus 47%) and Italy (47% versus 50%, compared with 69% versus 30%). In terms of changes since February-March 2007, attachment to Europe has decreased in 24 Member States (out of 27, as Croatia was not a member of the EU at that time), and by more than ten percentage points in 11 of them, led by Italy (47%, -22 percentage points), Slovenia (44%, -22), Hungary (69%, -19), Spain (50%, -19) and Portugal (45%, -18). It has increased significantly only in Latvia (65%, +11), although it has also gained ground, albeit only slightly, in Lithuania (49%, +3) and Estonia (52%, +1). In 27 Member States, respondents are more likely to feel attached to Europe than to the European Union. This is particularly true in the Nordic countries: there is a difference of 35 percentage points in Sweden (75% attached to Europe versus 40% attached to the EU), 34 percentage points in Finland (69% versus 35%) and 27 percentage points in Denmark (72% versus 45%). Portugal is the only country where respondents feel equally attached to the EU and Europe (45%, representing a minority in both cases). 12
 to 15% in Turkey (versus 77%).")
16 *NA = Not Asked: This question was not asked in this country in the previous survey In all the candidate countries, only a minority of respondents feel attached to the European Union, with scores ranging from 44% in Albania (versus 53% not attached ) to 15% in Turkey (versus 77%). However, majorities feel attached to Europe in three of the candidate countries: most strikingly in Iceland (73% attached versus 26% not attached ), but also in the Former Yugoslav Republic of Macedonia (52% versus 45%) and Albania (49% versus 48%). In all the candidate countries, respondents are more likely to feel attached to Europe than to the EU, particularly in Iceland (73% feel attached to Europe versus 18% attached to the EU, a difference of 55 percentage points). 13
17 A socio-demographic analysis reveals that: - Attachment to the European Union is: o o o o o Slightly more widespread among men than among women (48% versus 44%), although it is the minority position in both cases; Shared by a majority of year-olds (49% versus 47%), compared with a minority of respondents in all the other age groups; The minority position in all generations, most notably among those born before 1946 (41% versus 55%); far more prevalent and the majority position among respondents who studied up to the age of 20 and beyond (55%) than among those who left school at the age of 15 or earlier, among whom it is the minority position (35% versus 62%); Shared by a majority of managers (58%) and students (52%), compared with a minority of white-collar workers (46% versus 52%), pensioners (44% versus 53%), manual workers (42% versus 55%), unemployed people (38% versus 58%) and housepersons (36% versus 60%); Also shared by a majority of Europeans who see themselves as upper class (65%), upper middle class (57%) and middle class (51%), compared with a minority of those who say they are lower middle class (43% versus 54%) and working class (37% versus 60%). - A majority of respondents in the following categories feel attached to Europe: o Both men (58%) and women (54%); o All age groups: from 60% among year-olds to 54% of those aged 55 or over; o o o All generations, most notably among members of generation Y, those born after 1980 (59%, compared with 50% of those born before 1946); Those who studied up to the age of 20 and beyond (69%) and who completed their studies between the ages of 16 and 19 (53%), whereas this attachment is felt by only a minority of those who left school at the age of 15 or earlier (41% versus 56%); Most socio-professional categories, from 72% of managers to 52% of manual workers, the exceptions being unemployed people (49% versus 49%) and housepersons (44% versus 52%); o The Europeans who consider that they belong to the higher class (76%), upper middle class (72%), middle class (63%) and lower middle class (55%), compared with a minority of those who see themselves as working class (44% versus 53%). 14
18 15

19 The following tables show the results by socio-demographic criteria for the European Union as a whole (EU28 average), for the six largest EU countries and for countries which have received or currently receive European Union support for tackling the financial and economic crisis. 16
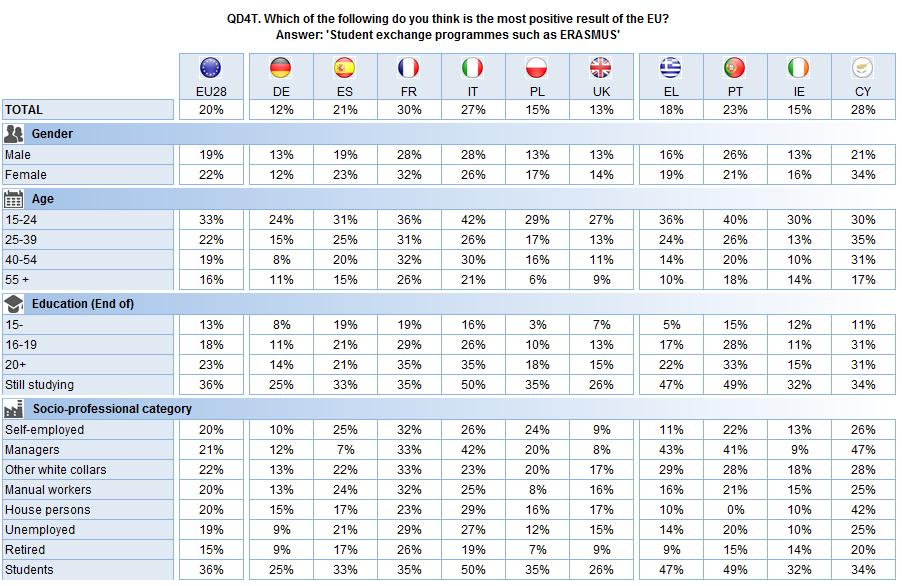
20 II. THE EUROPEAN UNION S ACHIEVEMENTS - Europeans now see peace among Member States as the main positive result of the EU, just ahead of freedom of movement - For the first time since the Standard Eurobarometer survey of spring 2012 (EB77), peace among Member States (56%, +2 percentage points since spring 2014) is once again seen as the most positive result of the EU by Europeans, just ahead of the free movement of people, goods and services within the EU (55%, -1) 8. The euro (24%, -1 percentage point) is in third place, a long way behind. A group of four positive results follow with similar scores, namely student exchange programmes such as ERASMUS (20%, -3 percentage points), the economic power of the EU (20%, unchanged), the political and diplomatic influence of the EU in the rest of the world (19%, -1) and the level of social welfare (healthcare, education and pensions) in the EU (18%, =). In last place, the Common Agricultural Policy is now mentioned by fewer than one in ten Europeans (8%, -2 percentage points). Europeans are also less likely to be unable to spontaneously identify any positive results of the EU (8% said none, -2 percentage points). Total of the Firstly and And then answers (MAXIMUM 3 ANSWERS) 8 QD4. Which of the following do you think is the most positive result of the EU? Firstly? And then? 17
21 Respondents in the euro area countries and those in the non-euro area countries rank the results of the European Union in a different order. In the euro area countries, peace among Member States stands in first place (57%, +1 percentage point since spring 2014) ahead of freedom of movement (55%, unchanged). This order is reversed in the non-euro area countries, where respondents rank freedom of movement (55%, -1) ahead of peace (54%, +4). This difference existed in the previous Standard Eurobarometer survey of spring 2014 (EB81): nevertheless, the proportion of respondents mentioning peace has increased the most perceptibly in the non-euro area countries. The most striking difference between these two groups of countries concerns the euro: respondents in the euro area countries rank the single currency in third place (30%, -1 percentage point since spring 2014), whereas those in the non-euro area countries rank it in seventh place (12%, +1), only ahead of the Common Agricultural Policy (10%, -2). Respondents in the non-euro area countries (22%, +1, in third place) are also far more likely than euro area respondents (16%, -1, in seventh place) to mention the level of social welfare. Total of the Firstly and And then answers (MAXIMUM 3 ANSWERS) A national analysis shows that, in the 28 Member States, the most positive result of the European Union is either peace among the EU Member States or freedom of movement. 18
, Germany (72%, -2), Denmark (69%, +3), Finland (66%, +15), Luxembourg (65%, +4), France")
22 Peace among the Member States of the EU tops the list of positive results in ten Member States. It is also ranked in joint first place with freedom of movement in Slovenia (both 60%). Peace was mentioned by more than 60% of respondents in Sweden (75%, +1 percentage point since spring 2014), Germany (72%, -2), Denmark (69%, +3), Finland (66%, +15), Luxembourg (65%, +4), France (64%, +3) and the Netherlands (63%, +6, where it is nevertheless ranked behind freedom of moevement). The proportion of respondents mentioning peace has increased in 20 Member States since spring 2014, including Finland (66%, +15 percentage points), Poland (57%, +9), Croatia (48%, +8) and Ireland (44%, +8), but has decreased in Austria (52%, -8) and Slovakia (42%, -7). 19
23 The free movement of people, goods and services within the EU is seen as the main positive result of the EU in 17 Member States (excluding Slovenia where this achievement is ranked equally with peace). It was mentioned by at least seven out of ten respondents in three countries: Bulgaria (72%, +2 percentage points), Slovakia (71%, -2) and Lithuania (70%, -5). This item has gained ground in 14 Member States since spring 2014, most notably in Austria (60%, +6 percentage points), Denmark (55%, +6) and Italy (48%, +6); it has lost the most ground in Cyprus (51%, -9), the Czech Republic (63%, -6) and Lithuania (70%, -5). 20
24 The euro was mentioned by at least 40% of respondents in six countries, all euro area members: Luxembourg (48%, unchanged), Ireland (48%, +3 percentage points), Belgium (48%, +1), Finland (47%, =), Slovakia (44%, -1) and the Netherlands (40%, +1). The proportion of respondents mentioning the single currency has increased in Hungary (19%, +4 percentage points), but has decreased in Greece (20%, -8), Slovenia (37%, -6) and France (27%, -5). 21

25 Total of the Firstly and And then answers First three items mentioned (MAXIMUM 3 ANSWERS) 22
26 A socio-demographic analysis reveals that: year-olds are most likely to mention student exchange programmes (33%, versus 16% of those aged 55 or over); - Those aged 55 or over are more attached to peace among Member States (63%, versus 49% of year-olds); - However, these two age groups are less likely than average to mention freedom of movement (53% of year-olds and 52% of those aged 55 or over, versus 59% of year-olds and 58% of year-olds); - More broadly, Europeans who studied up to the age of 20 and beyond, those without financial difficulties and those who consider that they belong to the higher social classes are more likely to acknowledge the positive results of the European Union: they mention most of these items more than the average. In contrast, Europeans who left school at the age of 15 or earlier are more likely to say spontaneously that none of the items represent positive achievements of the EU, as are those who struggle to pay their bills most of the time and those who see themselves as working class (12% in all three cases, compared with 8% on average). 23

27 First four items mentioned 24
28 The following tables show the average results by socio-demographic criteria for the European Union as a whole (EU28), for the six largest EU countries and for countries which have received or currently receive European Union support for tackling the financial and economic crisis. 25
29 26

30 III. EUROPEAN CITIZENSHIP 1. THE SENSE OF EUROPEAN CITIZENSHIP 1.1. Update on the sense of European citizenship - The sense of European citizenship is predominant, but in slight decline - More than six out of ten Europeans feel that they are citizens of the European Union 9, slightly down on the Standard Eurobarometer survey of spring 2014 (EB81) (63%, -2 percentage points, versus 35%, +1) 10. This decline in the sense of European citizenship concerns those Europeans who consider that they are definitely citizens of the EU (23%, -3), whereas the proportion who see themselves as citizens of the EU to some extent has increased slightly (40%, +1). 9 QD2.1. For each of the following statements, please tell me to what extent it corresponds or not to your own opinion. You feel you are a citizen of the EU 10 The sense of European citizenship as discussed in this chapter is based on the combined Yes, definitely and Yes, to some extent answers. 27
31 As in the previous two surveys, the feeling of being a citizen of the EU is more widespread in the euro area countries (64%, -3 percentage points since spring 2014) than in the non-euro area countries (62%, +1). However, the sense of European citizenship continues to gain ground in the non-euro area countries: from 54% in autumn 2013, to 61% in spring 2014, and 62% in autumn As in spring 2014, the sense of European citizenship is shared by a majority of respondents in 25 Member States, with scores of more than 75% in five of them (compared with eight in spring 2014): Luxembourg (89%, +4 percentage points), Malta (85%, -2), Estonia (78%, +2), Finland (76%, -3) and Sweden (76%, -1). On the other hand, it is shared by only a minority of respondents in Greece (45%, -4 percentage points, versus 55%, +4), Italy (47%, unchanged, versus 51%, +1) and Bulgaria (48%, +2, versus 51%, -2). Since spring 2014, the sense of European citizenship has gained ground in Hungary (67%, +8 percentage points), Romania (68%, +7) and Latvia (68%, +6). However, it is now less widespread in Germany (74%, -5), Austria (73%, -4), Ireland (70%, -4), the Netherlands (61%, -4) and Greece (45%, -4). 28
, Portugal (15%, -8) and Poland")
32 In terms of the European average, the decreased sense of European citizenship is most perceptible among those who feel that they are definitely citizens of the EU (23%, -3 percentage points). A national analysis shows that this group of respondents has declined in 18 Member States, most notably in Germany (30%, -8 percentage points for the definitely answer), Portugal (15%, -8) and Poland (21%, -7). Conversely, the sense of European citizenship has increased significantly only in Romania (25%, +6). A socio-demographic analysis reveals that: - The sense of European citizenship decreases with age, and is felt by 71% of year-olds, 66% of year-olds, 64% of year-olds and 59% of those in the 55-plus age group; 70% of those born after 1980 (generation Y ), 64% of those born between 1965 and 1980 (generation X ), 63% of those born between 1946 and 1964 (baby-boomers) and 55% of those born before 1946; - It is also more prevalent among those who studied up to the age of 20 and beyond (73%) than among those who left school at the age of 15 or earlier (50% versus 48%); - The feeling of being a citizen of the EU is also more pronounced among managers (76%) and students (74%) than among self-employed people (66%), white-collar workers (65%) and manual workers (62%), and is least widespread among unemployed people (60%), pensioners (58%) and housepersons (53%). Despite these variations, a majority of Europeans in all the socio-professional categories share a sense of European citizenship; - There are also significant differences in accordance with the financial situation of respondents: 69% of those who almost never have financial difficulties see themselves as citizens of the EU, compared with a minority (45% versus 54%) of those who struggle to pay their bills most of the time; 29
, compared with 61% of Europeans in the")
33 - The social class to which respondents consider they belong also influences their sense of European citizenship, since more than 70% of the Europeans who consider that they belong to the more privileged social classes feel that they are citizens of the EU (73% of those in the upper class, 75% of the upper middle class and 72% of the middle class), compared with 61% of Europeans in the lower middle class and 53% of those who see themselves as working class; - Lastly, Europeans who are in favour of the euro (78%) are more likely to feel that they are citizens of the EU than those who oppose it, only a minority of whom do so (45%, versus 53%); - The feeling of European citizenship cuts across the socio-demographic categories, and is shared by the majority in almost all categories except those who regularly struggle to pay their bills. 30
34 The following tables show the average results by socio-demographic criteria for the European Union as a whole (EU28), for the six largest EU countries and for countries which have received or currently receive European Union support for tackling the financial and economic crisis. 31
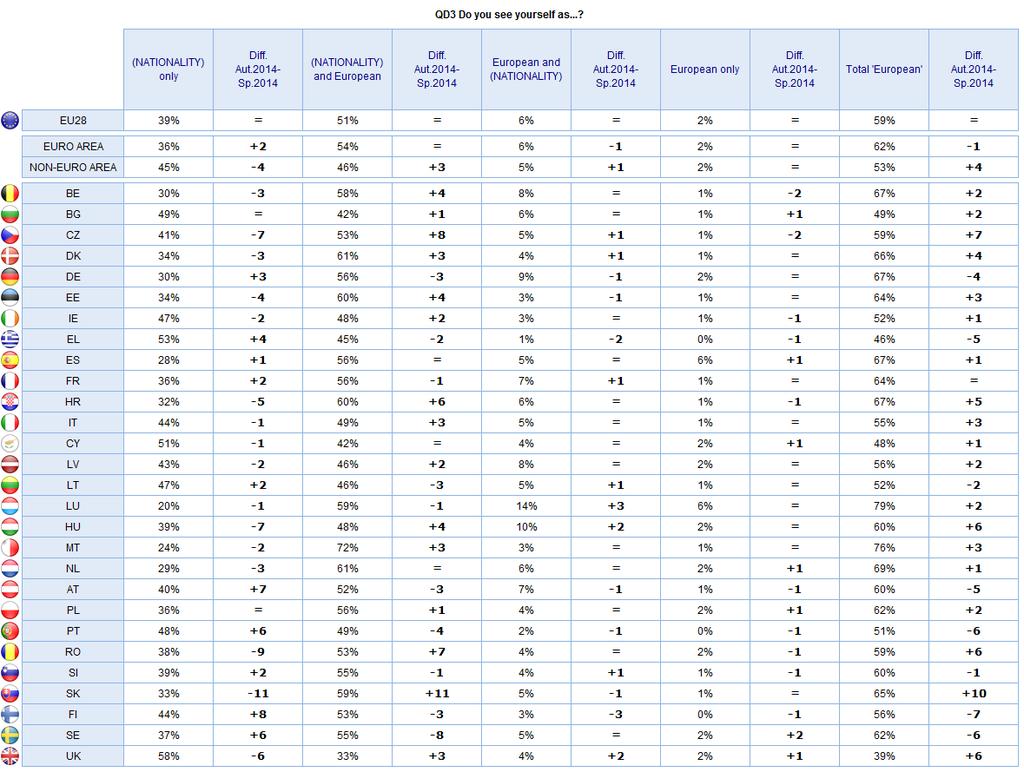
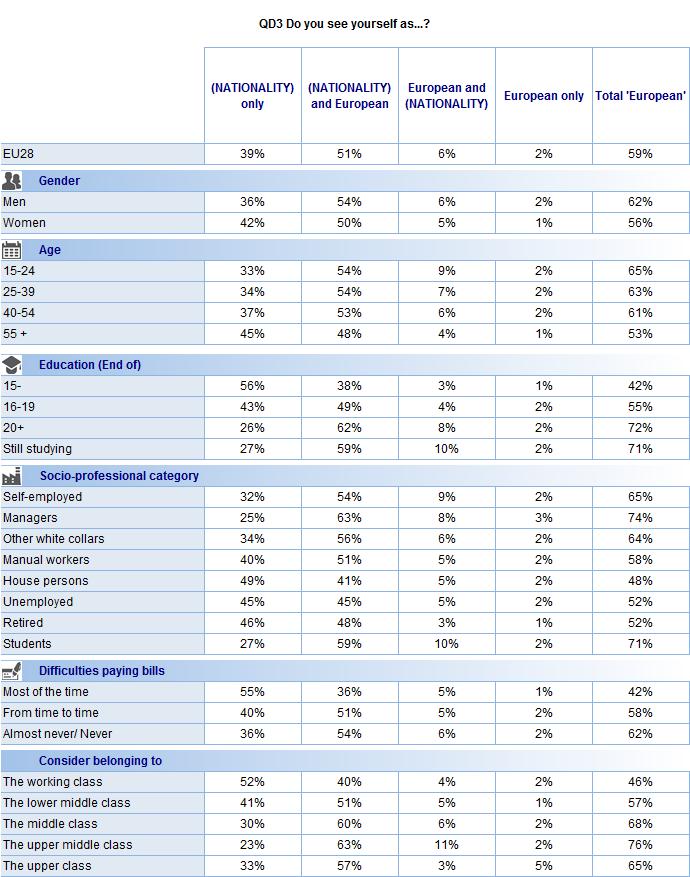
35 1.2. The sense of European citizenship compared with national citizenship A comparison of the sense of European citizenship and the sense of national citizenship shows that a majority of respondents continue to see themselves as European citizens. 59% (unchanged since spring 2014) of Europeans choose to define themselves in terms of nationality and European, European and nationality or European only. However, almost four out of ten Europeans define themselves solely by their nationality (39%, =) 11. A closer analysis of the strength of this sense of European citizenship shows that: - An absolute majority of respondents define themselves first by their nationality and then as Europeans (51%, unchanged); - Respondents who define themselves first as European citizens and then by their nationality remain in a minority (6%, unchanged); - Lastly, as in spring 2014, only 2% of respondents define themselves as European only (unchanged). At national level, the sense of European citizenship is predominant in a very large majority of Member States (24 out of 28). A majority of respondents define themselves solely by their nationality in three Member States: the United Kingdom (58%, -6 percentage points since spring 2014), Greece (53%, +4) and Cyprus (51%, -1). In Bulgaria, identical proportions of respondents define themselves solely by their nationality (49%, unchanged) and as citizens of the EU (49%, +2, for the combined nationality and European, European and nationality and European only answers). In detail, respondents in seven Member States are more likely than average to answer European and nationality : Luxembourg (14%, +3 percentage points), Hungary (10%, +2), Germany (9%, -1), Latvia (8%, unchanged), Belgium (8%, =), France (7%, +1) and Austria (7%, -1). As was the case in the Standard Eurobarometer survey of spring 2014, respondents in Luxembourg (6%, =) and Spain (6%, +1) are the most likely to define themselves as European only. 11 QD3. Do you see yourself as? 32
36 33
37 A socio-demographic analysis reveals that: - The sense of European citizenship: o Is more prevalent among men than among women (62% versus 56%); o o o Decreases with age, from 65% of year-olds to 53% of those in the 55-plus age group; Is more pronounced among the most privileged categories of the population, exceeding 70% among those who studied up to the age of 20 and beyond (72%), managers (74%) and students (71%), and among those who see themselves as belonging to the upper middle class (76%); Varies considerably with the household s financial situation: 62% of those who never or almost never have difficulties paying their bills define themselves as Europeans, compared with 42% of those who struggle to pay their bills most of the time. - In contrast, the respondents who define themselves solely by their nationality: o o o Are more likely to be women than men (42% versus 36%), but are in the minority in both cases; Are likely to be older: 45% of respondents in the 55-plus age group see themselves solely as citizens of their country, compared with only 33% of year-olds; Mostly left school at the age of 15 or earlier (56%, 30 percentage points higher than for those who studied up to the age of 20 and beyond, 26%); o Represent a narrow majority of housepersons (49% versus 48%) compared with a minority in all the other socio-professional categories, especially managers (25%), students (27%), self-employed people (32%) and white-collar workers (34%); o Lastly, this feeling is also shared by a majority of those who struggle to pay their bills most of the time (55%) and those who see themselves as working class (52%). 34
38 35
39 The following tables show the average results by socio-demographic criteria for the European Union as a whole (EU28), for the six largest EU countries and for countries which have received or currently receive European Union support for tackling the financial and economic crisis. 36
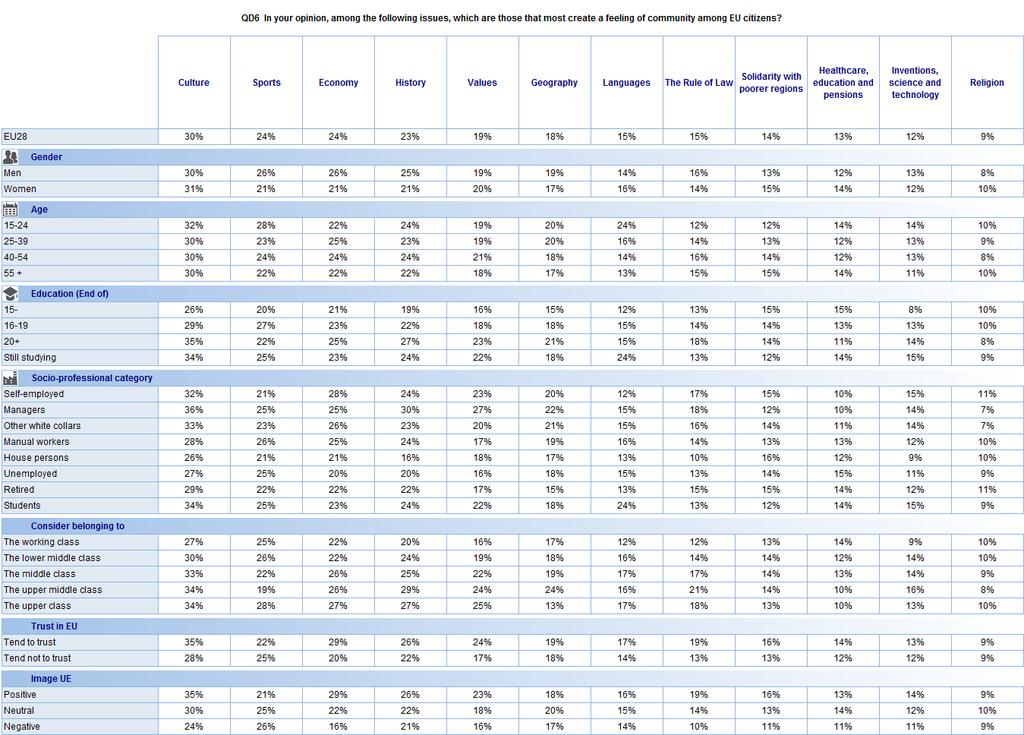
40 1.3. Levers for strengthening the sense of European citizenship The most effective means of creating a feeling of community - Europeans see culture as the most effective means of creating a feeling of community among EU citizens - When asked to identify the means best suited to creating a feeling of community within the European Union, respondents put culture at the top of their list. This item is mentioned by three out of ten Europeans (30%) 12, and is followed by: - A group of three items, each with score of just under 25%: the economy and sports are mentioned by 24% of respondents, in joint second place, just ahead of history (23%); - Next, in fifth place among the most unifying factors, come values (19%), just ahead of geography (18%); - Next, five items obtained scores of between 15% and 10%: languages, level with the rule of law 13 (both 15%), then solidarity with poorer regions (14%), healthcare, education and pensions (13%) and inventions, science and technology (12%); - Finally, in twelfth and last place, fewer than one respondent in ten mentioned religion as a means of strengthening the feeling of community among EU ctizens (9%). Following a change in the wording of one item ( legislation replaced by the rule of law ), it is not possible to measure the evolution of the results since spring 2014 exactly, because it is not possible to determine to what extent the changes measured result from this change in wording. A comparison between the two surveys reveals that culture continues to be seen as the most effective means of creating a feeling of community among EU citizens. Another noteworthy change concerns sports which are now in second place, jointly with the economy. Otherwise, the ranking of these unifying factors remains broadly unchanged, except that healthcare, education and pensions have moved up one place to tenth, overtaking inventions, science and technology. 12 QD6. In your opinion, among the following issues, which are those that most create a feeling of community among European Union citizens? 13 Since the Standard Eurobarometer survey of spring 2014 (EB81), the item legislation has been replaced by the rule of law 37
41 (MAXIMUM 3 REPONSES) At national level, culture is seen as the most effective means of creating a feeling of community among EU citizens in 13 Member States: Luxembourg (41%), France (38%), Germany (37%), Latvia (36%), Denmark (35%), Greece (34%), Cyprus (34%), Belgium (33%), the Czech Republic (32%), Austria (30%), Malta (30%), Portugal (28%) and Romania (24%). The economy is seen as the most unifying factor in six Member States: Estonia (36%), Lithuania (35%), Poland (31%), Spain (29%), Hungary (28%) and Italy (27%). In Bulgaria, the economy is ranked joint first with geography (24%). With the same score as the economy at European level, sports are seen as the most effective means of creating a feeling of community among EU citizens in only four Member States: Ireland (40%), Slovenia (33%), the United Kingdom (31%) and Croatia (28%). Sweden is the only Member States in which history tops the list of unifying factors (35%). The same applies to values in Finland (36%). Lastly, geography tops the list in two Member States: the Netherlands (37%) and Slovakia (37%). As we have seen, this item was ranked joint first with the economy in Bulgaria (24%). None of the other items topped the list in any Member State, although some of them were mentioned significantly more frequently in some countries, for example languages in Luxembourg (31% versus 15% on average) and solidarity with poorer regions in Portugal (26% versus 14% on average). 38
, Germany (21%), Croatia (17%), Malta (17%), the Netherlands (17%), Sweden (17%) and Spain (17%).")
42 The rule of law, which was included for this first time in this survey, did not top the list in any Member State. However, it was mentioned more than average in seven countries: Finland (26% versus 15% on average), Germany (21%), Croatia (17%), Malta (17%), the Netherlands (17%), Sweden (17%) and Spain (17%). On the other hand, fewer than one in ten respondents mentioned this item in Lithuania (4%), Slovenia (6%), Austria (9%) and Latvia (9%). Healthcare, education and pensions were frequently mentioned in Malta (26% versus 13% on average), as were inventions, science and technology in Lithuania (24% versus 12% on average) and, lastly, religion in Cyprus (17% versus 9% on average) and Greece (16%). (MAXIMUM 3 ANSWERS) 39
43 A socio-demographic analysis reveals that, broadly speaking, the results are fairly consistent across the various categories. There are, however, some differences: - Culture tops the list of means of creating a feeling of community among EU citizens in all socio-demographic categories. Nevertheless, it is more likely to strike a chord with those who studied up to the age of 20 and beyond (35% versus 30% on average), managers (36%) and those for whom the EU conjures up a positive image (35%); - Self-employed people are more likely than average to mention the economy (28% versus 24% on average), as are people who trust the European Union (29%) and those for whom the EU s image is positive (29%); - Young people (28% of year-olds versus 24% on average) and the respondents who see themselves as belonging to the upper class (28%) are more likely to mention sports; - Lastly, history is particularly recognised as a means of creating a feeling of community among EU citizens by those who studied up to the age of 20 and beyond (27% versus 23% on average), managers (30%), and those who consider that they belong to the upper class (27%) and upper middle class (29%). 40
44 41
45 STANDARD EUROBAROMETER EUROPEAN CITIZENSHIP AUTUMN 2014 The elements which would best strengthen the sense of European citizenship - Europeans consider that a harmonised European social welfare system would best strengthen their sense of European citizenship - Among the elements most likely to strengthen their sense of European citizenship, respondents tend to give preference to social aspects and those affecting their everyday lives 14 : - A European social welfare system harmonised between the Member States (healthcare, education, pensions, etc.) tops the list of elements which Europeans feel would strengthen their sense of European citizenship and was mentioned by almost a third of Europeans (32%); - Next, Europeans mentioned being able to move to any EU country after retirement and to take your pension with you (27%); - This was followed by three items that were mentioned by at least one in five Europeans: being able to use your mobile phone in all EU countries at the same price (23%), a European emergency response service to fight international natural disasters (22%) and having a European ID card in addition to national ID cards (20%); - Next, in joint sixth place, Europeans mentioned an economic theme, being able to shop online from all EU countries at the same price and with the same consumer protection legislation (16%), and an aspect of the political life of the European Union, a President of the EU directly elected by the citizens of all Member States (16%); - In similar proportions and in joint eighth place, respondents mentioned an educational item, a European civic education course for children of primary school age (15%), and a defence item, the creation of a European army (15%); - Next, two political themes, with slightly lower scores, but nevertheless mentioned by more than one in ten Europeans: the right to vote in all elections organised in the Member State where you live even if you are not a citizen of that Member State (13%), followed by participating in national debates about the future of Europe (11%); - Finally, in twelfth and last place, the creation of EU embassies in non-eu countries: only 6% of respondents believe that this would strengthen the sense of European citizenship. 14 QD7. Which of the following elements would best strengthen your feeling about being a European citizen? 42

46 (MAXIMUM 4 ANSWERS) A similar question was asked in the Standard Eurobarometer survey of spring 2012 (EB77). However, because of the deletion of three items 15, it is not possible to measure the evolution of the results, since it is impossible to determine to what extent the changes noted have been influenced by the deletion of these items. However, in comparing the two surveys, we note that the creation of a harmonised European social welfare system and being able to go and live in any EU country after retirement are still the two most frequently mentioned elements seen as capable of strengthening the sense of European citizenship. It may also be noted that being able to use your mobile phone in all EU countries at the same price is now ranked in third place, having overtaken a European emergency response service in this survey. Similarly, the creation of a European army has gained two places to to ninth place. A national analysis shows that the creation of a European social welfare system harmonised between the Member States is ranked in first place in 16 Member States: Greece (50%), Bulgaria (50%), Slovakia (41%), Spain (39%), Lithuania (39%), Cyprus (38%), the Czech Republic (37%), Croatia (37%), Portugal (37%), Germany (36%), Poland (35%), Estonia (35%), Hungary (34%), Romania (32%), Italy (31%) and Slovenia (31%). Being able to move to any EU country after retirement and to take your pension with you is ranked in first place in Sweden (42%, one percentage point more than for the social welfare system). However, this element is also ranked in first place in Finland (38%) and the United Kingdom (23%), but jointly with being able to use your mobile phone in all EU countries at the same price; this item also came in first place in seven other countries: the Netherlands (42%), Denmark (39%), Luxembourg (38%), Ireland (37%), Malta (37%), Belgium (35%) and Latvia (35%). 15 Three items used in question QD6 of the Standard Eurobarometer survey of spring 2012 (EB77) were not used in this survey: A European Parliament that had the right to decide on taxes raised in the European Union ; Seeing the President of the European Commission on TV delivering a general policy speech in front of the European Parliament; and Seeing a European researcher winning a Nobel prize. 43
47 Austria is the only country where respondents give preference to the creation of a European emergency response service to fight international natural disasters (38%). In Austria, an above average number of respondents mentioned a European civic education course for children of primary school age (24%, the same as in Denmark, versus 15% on average) and EU embassies in non-eu countries (10%, same score as in Estonia, versus 6% on average). Lastly, the introduction of a European ID card in addition to national ID cards was the most frequently mentioned item in France (36%), where respondents are also more likely than average to mention a President of the EU directly elected by the citizens of all Member States (23% versus 16% on average). The idea of a directly elected President also appealed to more than one in five respondents in Germany (21%) and Greece (21%). The four remaining items obtained above-average scores in some countries, but without being ranked in first place: for example, being able to shop online from all EU countries at the same price and with the same consumer protection legislation in Malta (32% versus 16% on average), and the creation of a European army in the Netherlands (29% versus 15% on average), Cyprus (27%) and France (25%). Respondents in Sweden stand out by attaching greater than average importance to participating in national debates about the future of Europe (22%, same proportion as in Greece, versus 11% on average) and being able to vote in all elections organised in the Member State where you live, even if you are not a citizen of that Member State (21% versus 13% on average). 44
")
48 (MAXIMUM 4 ANSWERS) 45
49 A socio-demographic analysis reveals that: - A European social welfare system harmonised between the Member States is seen as the most effective way of strengthening the sense of European citizenship in almost all the socio-demographic categories. The only exceptions are Europeans in the age-group (29% versus 32% on average), members of generation Y, i.e. those born after 1980 (30%), students (30%) and those who see themselves as belonging to the upper class (26%); - Being able to use your mobile phone in all EU countries at the same price is ranked in first place in these same four categories: 33% of the age group (versus 23% on average), 32% among the members of generation Y, 33% of students and 28% among the Europeans who consider that they belong to the upper class; - Being able to move to any EU country after retirement and to take your pension with you was mentioned more than average (27%) by those who studied up to the age of 20 and beyond (32%, versus 21% of those who left school at the age of 15 or earlier), managers and self-employed people (34% and 31% respectively, versus 23% of housepersons and unemployed people), and by respondents belonging to the upper middle class (34%, versus 22% of those who see themselves as working class). It is interesting to note that this item is not ranked in first place in any country, although it is ranked in second place at European level; - Lastly, Europeans for whom the EU conjures up a positive image (26%, versus 18% of those for whom the EU s image is negative) are most likely to mention a European emergency response service to fight international natural disasters. 46

50 Five most frequently mentioned items 47
, versus 51%, +1) 16.")
 17.")
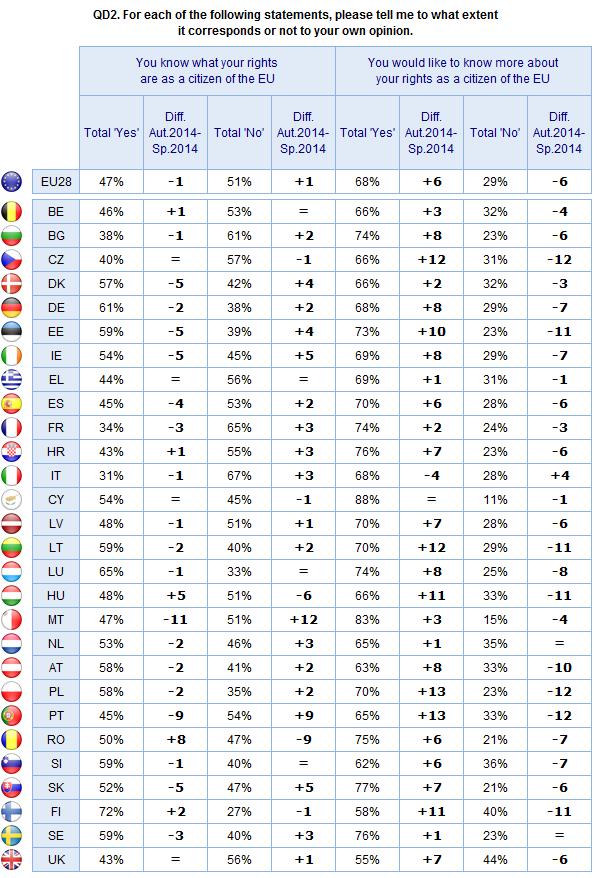
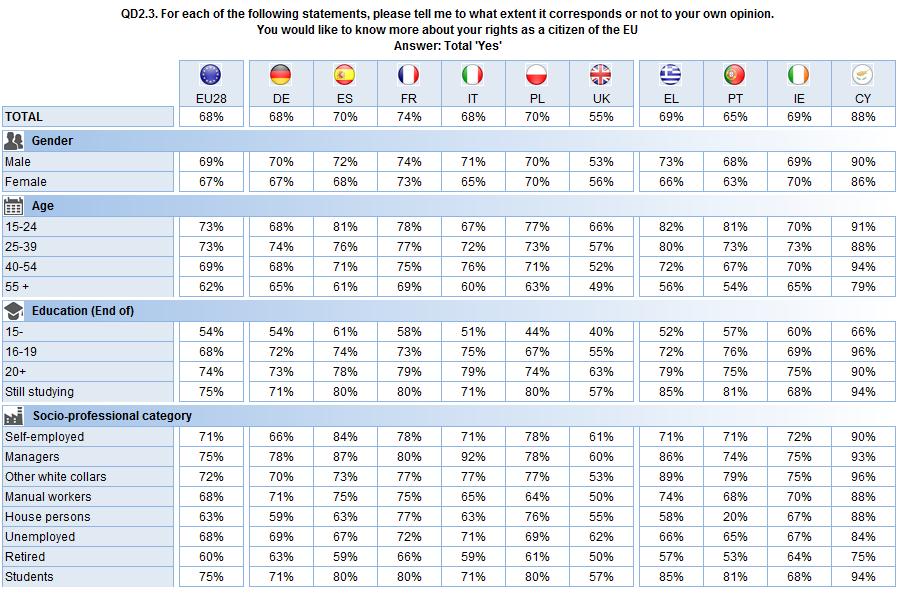
51 2. RIGHTS AS EUROPEAN CITIZENS - Almost half of Europeans are aware of their rights as citizens of the EU; more than two-thirds would like more information on these rights - A minority of Europeans feel that they know their rights as citizens of the European Union (47%, -1 percentage point since the Standard Eurobarometer survey of spring 2014 (EB81), versus 51%, +1) 16. Fewer than one in ten respondents answered yes, definitely (9%, -2). After a sharp increase since spring 2014, more than two-thirds of Europeans would now like more information on their rights as a citizen of the EU (68%, +6 percentage points) 17. More than a quarter of Europeans answered yes, definitely (28%, +2). 16 QD2.2. For each of the following statements, please tell me to what extent it corresponds or not to your opinion... You know what your rights are as a citizen of the EU 17 QD2.3. For each of the following statements, please tell me to what extent it corresponds or not to your opinion. You would like to know more about your rights as a citizen of the EU 48
.")
52 A national analysis shows that a majority of respondents say that they know their rights as citizens of the EU in 15 Member States, led by Finland (72%, +2 percentage points), Luxembourg (65%, -1) and Germany (61%, -2). However, only a minority of respondents are familiar with their rights in the remaining 13 Member States, with the lowest scores in Italy (31%, -1 percentage point), France (34%, -3) and Bulgaria (38%, -1). Since spring 2014, the feeling of familiarity with these rights as citizens of the EU has gained ground in only five Member States (compared with 23 between autumn 2013 and spring 2014), most notably in Romania (50%, +8 percentage points), where it is now the majority position, and Hungary (48%, +5). In contrast, this feeling has decreased significantly and is now the minority position in Malta (47%, -11) and Portugal (45%, -9). 49
, Slovakia (77%, +7), Croatia (76%, +7), Sweden (76%, +1) and Romania (75%, +6).")
53 A large majority of respondents in the 28 Member States want more information on their rights as EU citizens, with scores of 75% or more in six countries: Cyprus (88%, unchanged), Malta (83%, +3 percentage points), Slovakia (77%, +7), Croatia (76%, +7), Sweden (76%, +1) and Romania (75%, +6). The proportion of respondents wanting more information has increased in 26 Member States, and by at least ten percentage points in seven of them: Poland (70%, +13 percentage points), Portugal (65%, +13), Lithuania (70%, +12), the Czech Republic (66%, +12), Hungary (66%, +11), Finland (58%, +11) and Estonia (73%, +10). As a result of these increases, this is now the majority position in the two countries where respondents wanting more information were in a minority in spring 2014, namely Finland (58%, +11) and the United Kingdom (55%, +7). It has lost ground only in Italy (68%, -4 percentage points) and is stable in Cyprus (88%, unchanged), which is also the country with not only the highest overall score, but also the highest proportion of respondents saying yes, definitely (76%, =). 50
54 51
55 The following tables show the average results by socio-demographic criteria for the European Union as a whole (EU28), for the six largest EU countries and for countries which have received or currently receive European Union support for tackling the financial and economic crisis. 52
56 53
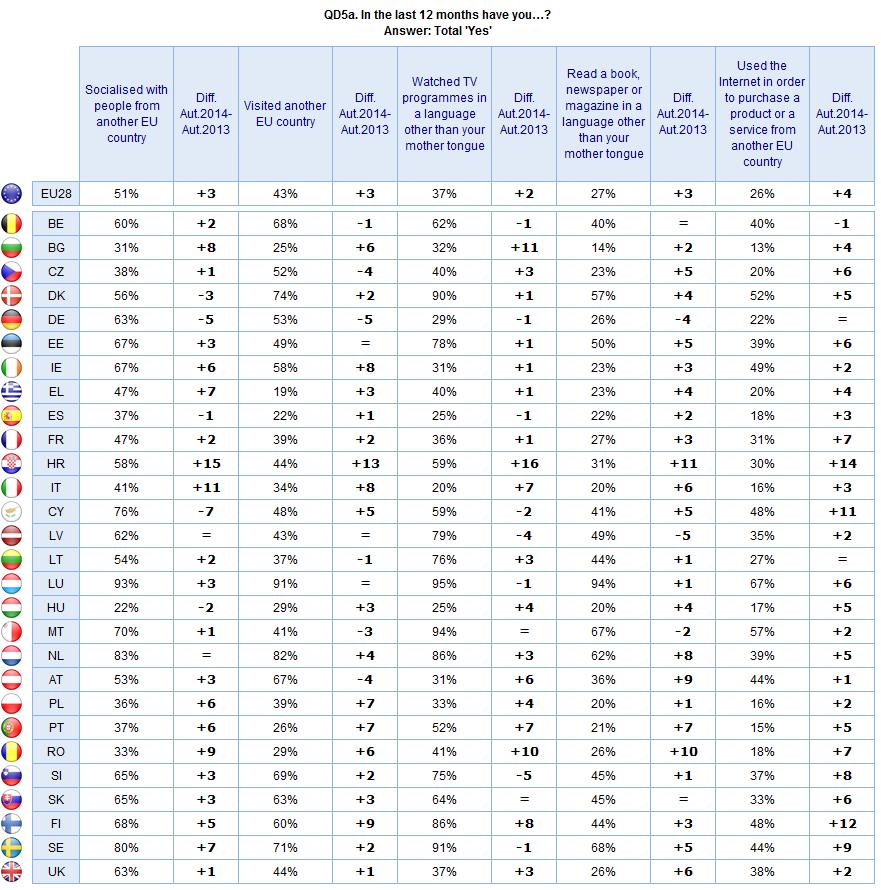
57 IV. THE OPENNESS OF EUROPEANS TO OTHERS - Europeans are now more open to other countries - Since autumn 2013 (EB80), the proportion of Europeans whose practices in five areas during the previous 12 months reflect a certain openness to the other European Union Member States has increased 18 : - For the first time since this question was first asked (Standard Eurobarometer survey of February-March ), a majority of respondents have socialised with people from another EU country during the 12 months preceding the survey (51%, +3 percentage points compared with autumn 2013, including 30% on several occasions, unchanged); - More Europeans although still a minority have visited another EU country (43%, +3 percentage points, compared with 57%, -2, who have not done so); - More than a third of respondents have now watched a TV programme in a language other than their mother tongue (37%, +2 percentage points, versus 62%, -3); - Lastly, more than a quarter of respondents have read a book, magazine or newspaper in a language other than their mother tongue (27%, +3 percentage points, versus 72%, -4), and have also used the Internet to buy a product or service in another EU country (26%, +4, versus 73%, -4). 18 QD5a. In the last twelve months, have you? 19 Special Eurobarometer survey 251 (EB65.1): The future of Europe 54
, the Netherlands (83%, unchanged), Sweden (80%, +7) and Cyprus (76%, -7).")
58 An analysis of the results by country shows that in 18 Member States (compared with 17 in autumn 2013), a majority of respondents have socialised with people from another EU country during the 12 months preceding the survey, with scores in excess of 75% in Luxembourg (93%, +3 percentage points), the Netherlands (83%, unchanged), Sweden (80%, +7) and Cyprus (76%, -7). In contrast, a third or fewer respondents have done so in Hungary (22%, -2), Bulgaria (31%, +8) and Romania (33%, +9). The proportion of respondents who have socialised in this way has increased in 21 Member States, led by Croatia (58%, +15), where it is now the majority position, and Italy (41%, +11). It has decreased the most sharply in Cyprus (76%, -7) and Germany (63%, -5). 55
59 In 12 Member States (unchanged since autumn 2013), a majority of respondents have visited another EU country during the last 12 months. This is the case for more than seven out of ten people in Luxembourg (91%, unchanged), the Netherlands (82%, +4 percentage points), Denmark (74%, +2) and Sweden (71%, +2). However, fewer than than 25% of respondents have done so in Greece (19%, +3), Spain (22%, +1) and Bulgaria (25%, +6). This proportion has gained ground in 19 Member States, most notably in Croatia (44%, +13), Finland (60%, +9), Italy (34%, +8) and Ireland (58%, +8), and has decreased the most sharply in Germany (53%, -5), Austria (67%, -4) and the Czech Republic (52%, -4). A majority of respondents in 15 Member States (compared with 13 in autumn 2013) have watched a TV programme in a language other than their mother tongue during the last twelve months, with the highest scores in Luxembourg (95%, -1 percentage point), Malta (94%, unchanged), Sweden (91%, -1), Denmark (90%, +1), the Netherlands (86%, +3) and Finland (86%, +8). In contrast, a quarter of respondents or less have done so in Italy (20%, +7), Spain (25%, -1) and Hungary (25%, +4). This practice has also gained ground in 18 Member States, with increases of at least ten percentage points in Croatia (59%, +16) where it is now the majority position, Bulgaria (32%, +11) and Romania (41, +10). It is also now the majority position in Portugal (52%, +7). In contrast, it has lost the most ground in Slovenia (75%, -5) and Latvia (79%, -4). A majority of respondents say that they have read a book, newspaper or magazine in a language other than their mother tongue in five Member States (compared with six in autumn 2013): Luxembourg (94%, +1 percentage point), far ahead of Sweden (68%, +5), Malta (67%, -2), the Netherlands (62%, +8) and Denmark (57%, +4). In contrast, one in five respondents or less have done so in Bulgaria (14%, +2), Italy (20%, +6), Hungary (20%, +4) and Poland (20%, +1). This practice has gained ground in 23 Member States, most notably in Croatia (61%, +11) and Romania (26%, +10), while the most significant decreases were recorded in Latvia (49%, -5), where it is now the minority position, and Germany (26%, -4). Lastly, majorities of respondents have now used the Internet to buy a product or service in another EU country in three Member States (compared with two in autumn 2013): Luxembourg (67%, +6 percentage points), Malta (57%, +2) and Denmark (52%, +5). This practice remains relatively marginal although it is increasing in Bulgaria (13%, +4), Portugal (15%, +5), Italy (16%, +3) and Poland (16%, +2). The practice of using the Internet for purchases in another Member State has gained ground in almost all EU countries (25), and by more than ten percentage points in Croatia (30%, +14), Finland (48%, +12) and Cyprus (48%, +11). 56
60 57

61 The index of openness to other countries These five questions have been used to construct an index of openness to other European Union countries. For each of the five practices of openness analysed in this survey, points have been attributed as follows: 2 points for every yes, on several occasions answer; 1 point for every yes, once or twice answer, otherwise 0 points. Each individual could therefore score between 0 and 10 points. Scores of 0 to 3 points correspond to a low international openness index, 4 to 6 to a moderate international openness index and 7 to 10 to a high international openness index. A large majority of Europeans continue to have a low openness index, although the proportion has decreased slightly since autumn 2013 (64%, -2 percentage points). The proportions of respondents with a moderate (21%, +1) or high (15%, +1) openness index have both increased very slightly, but these two categories are still very much in the minority. A national analysis of the various openness practices has already revealed the special situation in Luxembourg, where respondents recorded the highest score for each of the five practices analysed. The openness index highlights this special position: 84% of respondents in Luxembourg have a high openness index (+4 percentage points), around 40 percentage points higher than in the countries with the next highest openness indices, Sweden (48%, +7), the Netherlands (47%, +5), Denmark (47%, +2) and Malta (45%, +1). In contrast, fewer than one in ten respondents have a high openness index in Italy (5%, +2 percentage points), Bulgaria (5%, +2), Hungary (6%, unchanged), Portugal (9%, +3), Romania (9%, +1), Poland (9%, =) and Spain (9%, -1). 58
. Conversely, high proportions have decreased the most sharply in Lithuania (18%, -5 percentage points), Latvia (27%, -3), Belgium (24, -3) and Germany (14%, -3).")
62 In terms of evolutions, the proportions of respondents with a high openness index have increased in 20 countries, most notably in Sweden (48%, +7 percentage points), Croatia (17%, +7) and the Netherlands (47%, +5). Conversely, high proportions have decreased the most sharply in Lithuania (18%, -5 percentage points), Latvia (27%, -3), Belgium (24, -3) and Germany (14%, -3). The countries with the highest proportions of low indices are Italy (82%, -5 percentage points), Hungary (82%, -1) and Bulgaria (81%, -4). 59
, while the ranking is relatively unchanged 20 : - Peace remains the value that")
63 V. VALUES The values that best represent the European Union - Peace, human rights and democracy are the values that best represent the European Union - All the values that Europeans associate with the European Union have gained ground or remained stable since the Standard Eurobarometer survey of spring 2014 (EB81), while the ranking is relatively unchanged 20 : - Peace remains the value that Europeans associate first and foremost with the European Union: it was mentioned by four out of ten respondents and has strengthened its position as the most frequently mentioned value (40%, +3 percentage points since spring 2014); - Human rights (36%, +2 percentage points) and democracy (31%, +1), both with a slight increase, complete the top three values associated with the EU; 20 QD8. In the following list, which values best represent the EU? 60
64 - The other values which were suggested to respondents were mentioned by fewer than two in ten Europeans. Three of them obtained scores of more than 15%: the rule of law (18%, unchanged), individual freedom (17%, =) and respect for human life (17%, +1 percentage point, now in sixth place, jointly with individual freedom); - Next, four values were mentioned by more than one in ten respondents, and it is within this group that the ranking order has changed the most significantly: solidarity is now ranked in seventh place (15%, +2 percentage points), just ahead of respect for other cultures (14%, unchanged), while equality (13%, +3) has overtaken tolerance (11%, =); - Self-fulfilment (4%, unchanged) and religion (3%, =) are less associated with the EU, and are mentioned by fewer than one in twenty Europeans. First six items mentioned Although the scores recorded for six of the twelve values have increased since spring 2014 (while those of the six others are unchanged), 5% (unchanged) of Europeans continue to say spontaneously that they do not associate any of these values with the European Union. 61
65 A national analysis shows that peace tops the list of values the most frequently associated with the EU in 16 Member States. It was mentioned by an absolute majority of respondents in Sweden (55%, +4 percentage points), France (54%, +7), Slovenia (54%, +2), Luxembourg (53%, +5) and Germany (52%, +1). In contrast, it was mentioned by 25% or fewer respondents in the United Kingdom (24%, unchanged) and Romania (25%, =). The proportion of respondents mentioning peace has increased in 24 Member States, most notably in Greece (49%, +9), Belgium (44%, +9), Lithuania (42%, +9), Finland (48%, +8), Croatia (33%, +8), France (54%, +7), Portugal (34%, +7) and Bulgaria (34%, +7). In two Member States, peace and human rights are ranked in joint first place: Lithuania (42%, +9 percentage points for peace and +1 for human rights) and Cyprus (35%, +1 and -4 respectively). Human rights top the list in nine Member States: Finland (53%, +9 percentage points), Romania (43%, +2), Malta (42%, unchanged), Estonia (41%, +3), Ireland (40%, +4), Latvia (39%, +5), the United Kingdom (37%, -4), Poland (37%, +8) and Croatia (34%, -1). This item was also mentioned by at least four out of ten respondents in Luxembourg (47%, +8), France (44%, +1), Belgium (41%, -1), the Netherlands (41%, -2), Sweden (41%, =), Denmark (41%, -3) and Germany (40%, +5). However, the proportion of respondents who mentioned this value was ten percentage points below the European average in Italy (26%, +3) and Greece (26%, +1). Human rights obtained a higher score than in spring 2014 in 17 Member States, including Finland (53%, +9), Austria (36%, +9), Luxembourg (47%, +8) and Poland (37%, +8), but lost ground in the United Kingdom (37%, -4), Cyprus (35%, -4) and Bulgaria (32%, -4). Denmark is the only country where democracy is ranked in first place (48%, +3 percentage points). While not in first position, this value was nevertheless mentioned by more than four out of ten respondents in Sweden (44%, -1), Germany (43%, +5) and the Netherlands (42%, unchanged). In contrast, it was mentioned by 20% or fewer respondents in Slovenia (19%, -1) and the United Kingdom (20%, =). Since spring 2014, the proportion of people mentioning democracy has increased in 17 Member States, most notably in Austria (39%, +11), Malta (36%, +6) and the Czech Republic (35%, +6), but has decreased in France (25%, -6), Spain (30%, -5 since spring 2014 when democracy was ranked in first place) and Hungary (23%, -5). None of the nine other values suggested was ranked in first place in any Member State. However, three of them were mentioned by at least 30% of respondents in some countries: for example, the rule of law in Finland (34%, +2 percentage points), individual freedom in Lithuania (33%, +2) and Latvia (31%, +2), and respect for human life in Malta (30%, +3). 62
, Italy (11%, -6) and Slovenia (10%, -6); individual freedom has gained ground in Croatia (26%, +8), as has solidarity in Bulgaria (22%, +8) and Lithuania")
66 The scores recorded for some of these values have changed significantly since spring 2014: for example, the rule of law has gained ground in Spain (27%, +7 percentage points) and Estonia (21%, +7), but has lost ground in Croatia (15%, -12), Italy (11%, -6) and Slovenia (10%, -6); individual freedom has gained ground in Croatia (26%, +8), as has solidarity in Bulgaria (22%, +8) and Lithuania (24%, +6), equality in Portugal (19%, +6) and Romania (15%, +6), and finally tolerance in Croatia (15%, +6). (MAXIMUM 3 ANSWERS) 63
67 A socio-demographic analysis reveals that: - Peace tops the list of values associated with the European Union in every sociodemographic category: among men and women alike, and across all age groups and generations, with the exception of Europeans aged 25 to 39 (35% versus 40% on average) and members of generation Y, i.e. those born after 1980 (36%). Another exception is those who studied up to the age of 20 and beyond, who also ranked peace in second place among the values associated with the European Union (40%); - Human rights are ranked in first place in these last three categories in almost identical proportions to those recorded for peace: 36% among year-olds (versus 36% on average), 37% among members of generation Y and 41% among Europeans who studied up to the age of 20 and beyond; - Men (33%) are slightly more likely than women (29%) to mention democracy. Managers (38% compared 31% on average, and 26% of housepersons and unemployed people), as are those who see themselves as belonging to the middle class (35%), upper middle class (39%) and upper class (37%, versus 26% of those who see themselves as working class) are more likely than average to mention this value. Europeans for whom the EU conjures up a positive image are also more likely to mention this value (39%, versus 19% among those for whom it has a negative image). Ultimately, democracy does not top the list of values in any of the socio-demographic categories. 64

68 Six most frequently mentioned items 65
69 The following tables show the average results by socio-demographic criteria for the European Union as a whole (EU28), for the six largest EU countries and for countries which have received or currently receive European Union support for tackling the financial and economic crisis. 66
70 67
71 68
72 Personal values - Peace, human rights and respect for human life are the three most important personal values for Europeans - The order in which Europeans rank the values which are the most important for them personally has changed since the Standard Eurobarometer survey of spring 2013 (EB79) 21 : - After recording the sharpest increase among the personal values of Europeans, peace is now in first place (44%, +5 percentage points since spring 2013); - Human rights (40%, -1 percentage point) have remained relatively stable, and were mentioned by four out of ten respondents. However, they have now fallen to second place following the sharp rise in mentions of peace; - Respect for human life (34%, -3 percentage points) remains in the (MAXIMUM 3 ANSWERS) top three personal values despite a slight decrease in the proportion of respondents mentioning this item; - Two values share joint fourth place, and are mentioned by a quarter of Europeans: democracy, which has lost a little ground since spring 2013 (25%, -1 percentage point), and individual freedom, which has gained ground slightly (25%, +1); 21 QD9. In the following list, which are the three most important values for you personally? 69
73 - Next, four values obtained scores of between 20% and 15%: while equality (20%, -1 percentage point) remains in sixth place, solidarity (18%, +1) and tolerance (17%, +1) have each gained one place, while the rule of law (15%, -3), has fallen by two places to ninth; - The three remaining values suggested to respondents were mentioned by fewer than one in ten Europeans: respect for other cultures (9%, -2 percentage points) and self-fulfilment (9%, unchanged) are ranked in joint tenth place; finally, religion (6%, +1) is the last-ranked personal value, as it was in spring It is also the last-placed of the values which best represent the European Union. Six most frequently mentioned items A comparison between the order in which Europeans rank their personal values and the the values they associate with the European Union (possible because the items used for these questions are identical) shows that respondents are more likely to mention nine of the twelve proposed values as personal values than as values associated with the EU. This applies in particular to respect for human life (34% as a personal value versus 17% as a value characteristic of the EU), considerably ahead of individual freedom (25% versus 17%) and equality (20% versus 13%). The three values more associated with the EU are democracy (31% as an EU value versus 25% as a personal value), respect for other cultures (14% versus 9%) and the rule of law (18% versus 15%). The rule of law is also the value whose position differs the most in the two ranking orders: it is in fourth place among the values associated with the EU, but only in ninth place among personal values. 70
74 A national analysis shows that peace is the most frequently mentioned personal value in 15 Member States. It was also mentioned by an absolute majority of respondents in eight of them: Luxembourg (58%, +13 percentage points), Germany (58%, +1), Estonia (55%, +19), Slovenia (54%, +11), Slovakia (53%, +14), Austria (53%, +3), Denmark (51%, +5) and France (50%, +7). Though not the most important value, it was also mentioned by at least half the respondents in Sweden (51%, +5) and Finland (50%, +5). However, this item was mentioned by 30% or fewer respondents in Romania (29%, -2), the only country to record a lower score than in spring 2013, and Bulgaria (30%, +1). It has therefore gained ground in 27 Member States, and by more than ten percentage points in six of them: Estonia (55%, +19), Lithuania (45%, +15), Slovakia (53%, +14), Luxembourg (58%, +13), Slovenia (54%, +11) and Poland (44%, +11). In Latvia, peace (46%, +7 percentage points) and human rights (46%, +2) are ranked joint first; however, it is peace that has gained the most ground there since spring Human rights are ranked in first place in eight Member States: Sweden (58%, -5 percentage points), Finland (51%, +5), Cyprus (47%, -13), Lithuania (46%, +1), Spain (44%, -2), Croatia (42%, -6), Romania (41%, -5) and Italy (39%, +3). This item was also mentioned by at least four out of ten respondents in Slovenia (44%, -6), Denmark (43%, +2), Poland (42%, -4), Greece (41%, +2), Germany (41%, -2), Portugal (40%, +3), Estonia (40%, +1) and France (40%, -4). In contrast, fewer than a third of respondents mentioned human rights in Hungary (32%, +2) or the Czech Republic (32%, -3). The proportion of respondents mentioning this item has fallen since spring 2013 in 16 countries, most notably in Cyprus (47%, -13), Bulgaria (42%, -9), Luxembourg (37%, -9) and Belgium (33%, -7). Attachment to this value has increased significantly in only Finland (51%, +5), Ireland (39%, +4) and Slovakia (39%, +4). In Bulgaria, human rights (42%, -9 percentage points) and individual freedom (42%, +6) are ranked in joint first place. More than 40% of respondents also mentioned individual freedom in Austria (48%, -4), Lithuania (43%, +3) and the Czech Republic (43%, unchanged). However, fewer than one in five respondents in Poland (17%, -1), Spain (18%, +1), Sweden (19%, +2) and France (19%, -7) mentioned this item. The proportion of respondents mentioning this value has increased in 15 Member States, most notably in Italy (25%, +7), Bulgaria (42%, +6), Croatia (35%, +6) and Portugal (23%, +6), while the sharpest falls were recorded in France (19%, -7) and Ireland (24%, -5). 71
75 Respect for human life is ranked first in three Member States: Greece (48%, +8 percentage points), Ireland (46%, -4) and the United Kingdom (37%, -5). It was also mentioned by more than four out of ten respondents in Cyprus (43%, -4), France (42%, -6) and Spain (41%, +1). However, the proportion of respondents mentioning this item has fallen sharply to less than quarter in Slovakia (21%, -13) and the Czech Republic (24%, -10). In total this value has lost ground in 22 Member States, and in addition to Slovakia and the Czech Republic by at least ten percentage points in Luxembourg (38%, -12), Malta (36%, -11) and Romania (29%, -11). Its score has increased significantly only in Greece (48%, +8), Italy (37%, +5) and Slovenia (38%, +4). None of the eight other personal values was ranked in first place in any Member State. However, democracy was mentioned by more than four out of ten respondents in Sweden (46%, -3 percentage points) and Denmark (43%, -1), and by at least three out of ten in Germany (34%, unchanged), Greece (33%, +4) and Italy (30%, +3). Other values were mentioned by approximately three out of ten respondents: the rule of law in Finland (30%, +3); equality in Portugal (29%, -5); solidarity in France (29%, +5) and Portugal (29%, -5); tolerance in Belgium (28%, +1). Some of these eight values have seen significant evolutions since spring 2013: this is particularly true for the rule of law, which has gained ground in the Netherlands (15%, +7 percentage points), but has lost ground very dramatically in Slovenia (11%, -29), Italy (6%, -23), Croatia (14%, -19) and, to a lesser extent, in Lithuania (5%, -9), Denmark (13%, -8), Romania (12%, -8) and Cyprus (19%, -7). The proportion of respondents mentioning democracy has decreased in Bulgaria (15%, -8), while the score for solidarity has increased in Luxembourg (26%, +8) and the Netherlands (22%, +7), as have mentions of tolerance in Austria (21%, +7). 72
")
76 (MAXIMUM 3 ANSWERS) 73
77 A socio-demographic analysis reveals that: - Peace tops the list in the majority of socio-demographic categories. Respondents in the 55 or over age group (51% versus 44% on average), those belonging to the generations born before 1946 (53%), retired people (51%) and those who see themselves as belonging to the upper class (49%) are far more likely than average to mention peace; - Human rights are nevertheless ranked in first place in several categories, in particular by Europeans aged (42% versus 40% on average) and year-olds (41%), by members of generation Y, i.e. those born after 1980 (42%), and by students (42%) and self-employed people (41%); - Lastly, respect for human life, while not ranked in first place by any sociodemographic category, is mentioned more by women (37% versus 34% on average) than by men (31%); by housepersons (39%) and manual workers (37%) than by students (27%); and by the Europeans who see themselves as working class (37%) than by those who see themselves as belonging to the upper class (25%). 74

78 Six most frequently mentioned items 75
79 The following tables show the average results by socio-demographic criteria for the European Union as a whole (EU28), for the six largest EU countries and for countries which have received or currently receive European Union support for tackling the financial and economic crisis. 76
80 77
81 78
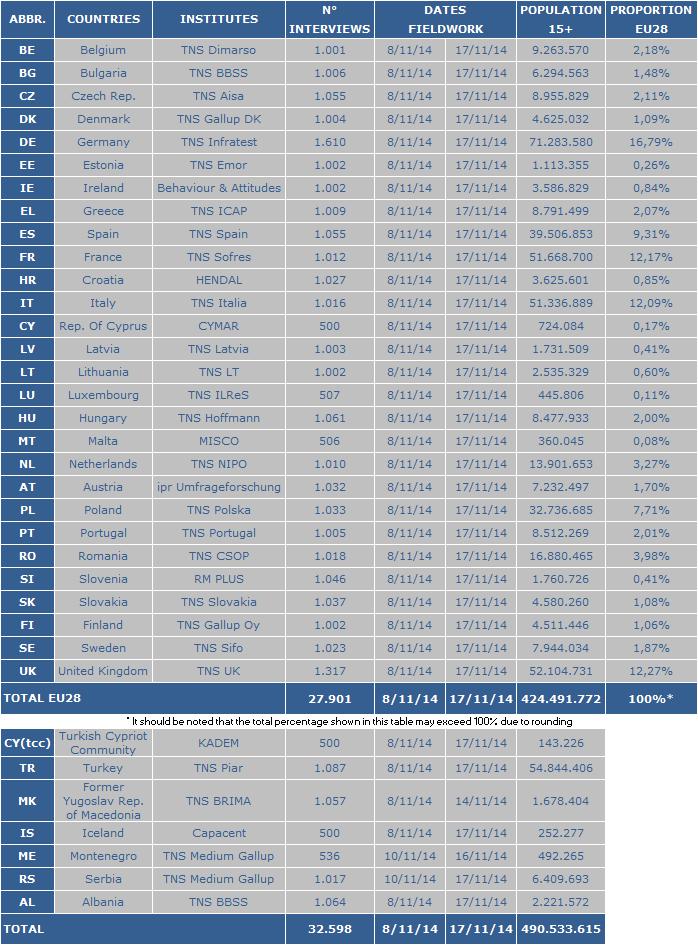
82 STANDARD EUROBAROMETER 82 Public opinion in the European Union TECHNICAL SPECIFICATIONS Between the 8 th of the 17 th of November 2014, TNS opinion & social, a consortium created between TNS political & social, TNS UK and TNS opinion, carried out the wave 82.3 of the EUROBAROMETER survey, on request of the EUROPEAN COMMISSION, Directorate-General for Communication, Strategy, Corporate Communication Actions and Eurobarometer unit. The wave 82.3 is the STANDARD EUROBAROMETER 82 survey and covers the population of the respective nationalities of the European Union Member States, resident in each of the Member States and aged 15 years and over. The STANDARD EUROBAROMETER 82 survey has also been conducted in the six candidate countries (Turkey, the Former Yugoslav Republic of Macedonia, Iceland, Montenegro, Serbia and Albania) and in the Turkish Cypriot Community. In these countries, the survey covers the national population of citizens and the population of citizens of all the European Union Member States that are residents in these countries and have a sufficient command of the national languages to answer the questionnaire. The basic sample design applied in all states is a multi-stage, random (probability) one. In each country, a number of sampling points was drawn with probability proportional to population size (for a total coverage of the country) and to population density. In order to do so, the sampling points were drawn systematically from each of the "administrative regional units", after stratification by individual unit and type of area. They thus represent the whole territory of the countries surveyed according to the EUROSTAT NUTS II (or equivalent) and according to the distribution of the resident population of the respective nationalities in terms of metropolitan, urban and rural areas. In each of the selected sampling points, a starting address was drawn, at random. Further addresses (every Nth address) were selected by standard "random route" procedures, from the initial address. In each household, the respondent was drawn, at random (following the "closest birthday rule"). All interviews were conducted face-to-face in people's homes and in the appropriate national language. As far as the data capture is concerned, CAPI (Computer Assisted Personal Interview) was used in those countries where this technique was available. For each country a comparison between the sample and the universe was carried out. The Universe description was derived from Eurostat population data or from national statistics offices. For all countries surveyed, a national weighting procedure, using marginal and intercellular weighting, was carried out based on this Universe description. In all countries, gender, age, region and size of locality were introduced in the iteration procedure. For international weighting (i.e. EU averages), TNS Opinion & Social applies the official population figures as provided by EUROSTAT or national statistic offices. The total population figures for input in this post-weighting procedure are listed below. TS1
83 Readers are reminded that survey results are estimations, the accuracy of which, everything being equal, rests upon the sample size and upon the observed percentage. With samples of about 1,000 interviews, the real percentages vary within the following confidence limits: Statistical Margins due to the sampling process (at the 95% level of confidence) various sample sizes are in rows various observed results are in columns 5% 10% 15% 20% 25% 30% 35% 40% 45% 50% 95% 90% 85% 80% 75% 70% 65% 60% 55% 50% N=50 6,0 8,3 9,9 11,1 12,0 12,7 13,2 13,6 13,8 13,9 N=50 N=500 1,9 2,6 3,1 3,5 3,8 4,0 4,2 4,3 4,4 4,4 N=500 N=1000 1,4 1,9 2,2 2,5 2,7 2,8 3,0 3,0 3,1 3,1 N=1000 N=1500 1,1 1,5 1,8 2,0 2,2 2,3 2,4 2,5 2,5 2,5 N=1500 N=2000 1,0 1,3 1,6 1,8 1,9 2,0 2,1 2,1 2,2 2,2 N=2000 N=3000 0,8 1,1 1,3 1,4 1,5 1,6 1,7 1,8 1,8 1,8 N=3000 N=4000 0,7 0,9 1,1 1,2 1,3 1,4 1,5 1,5 1,5 1,5 N=4000 N=5000 0,6 0,8 1,0 1,1 1,2 1,3 1,3 1,4 1,4 1,4 N=5000 N=6000 0,6 0,8 0,9 1,0 1,1 1,2 1,2 1,2 1,3 1,3 N=6000 N=7000 0,5 0,7 0,8 0,9 1,0 1,1 1,1 1,1 1,2 1,2 N=7000 N=7500 0,5 0,7 0,8 0,9 1,0 1,0 1,1 1,1 1,1 1,1 N=7500 N=8000 0,5 0,7 0,8 0,9 0,9 1,0 1,0 1,1 1,1 1,1 N=8000 N=9000 0,5 0,6 0,7 0,8 0,9 0,9 1,0 1,0 1,0 1,0 N=9000 N= ,4 0,6 0,7 0,8 0,8 0,9 0,9 1,0 1,0 1,0 N=10000 N= ,4 0,6 0,7 0,7 0,8 0,9 0,9 0,9 0,9 0,9 N=11000 N= ,4 0,5 0,6 0,7 0,8 0,8 0,9 0,9 0,9 0,9 N=12000 N= ,4 0,5 0,6 0,7 0,7 0,8 0,8 0,8 0,9 0,9 N=13000 N= ,4 0,5 0,6 0,7 0,7 0,8 0,8 0,8 0,8 0,8 N=14000 N= ,3 0,5 0,6 0,6 0,7 0,7 0,8 0,8 0,8 0,8 N= % 10% 15% 20% 25% 30% 35% 40% 45% 50% 95% 90% 85% 80% 75% 70% 65% 60% 55% 50% TS2
84 TS3
Standard Eurobarometer 89 Spring Report. European citizenship
 European citizenship Fieldwork March 2018 Survey requested and co-ordinated by the European Commission, Directorate-General for Communication This document does not represent the point of view of the European
EUROPEAN CITIZENSHIP
 Standard Eurobarometer 80 Autumn 2013 EUROPEAN CITIZENSHIP REPORT Fieldwork: November 2013 This survey has been requested and co-ordinated by the European Commission, Directorate-General for Communication.
EUROPEAN CITIZENSHIP
 Standard Eurobarometer 78 Autumn 2012 EUROPEAN CITIZENSHIP REPORT Fieldwork: November 2012 This survey has been requested and co-ordinated by the European Commission, Directorate-General for Communication.
EUROPEAN CITIZENSHIP
 Standard Eurobarometer 81 Spring 2014 EUROPEAN CITIZENSHIP REPORT Fieldwork: June 2014 This survey has been requested and co-ordinated by the European Commission, Directorate-General for Communication.
EUROPEAN CITIZENSHIP
 Standard Eurobarometer 77 Spring 2012 EUROPEAN CITIZENSHIP REPORT Fieldwork: May 2012 This survey has been requested and co-ordinated by the European Commission, Directorate-General for Communication.
MEDIA USE IN THE EUROPEAN UNION
 Standard Eurobarometer 76 Autumn 2011 MEDIA USE IN THE EUROPEAN UNION REPORT Fieldwork: November 2011 Publication: March 2012 This survey has been requested and co-ordinated by Directorate-General for
Standard Eurobarometer 88 Autumn Report. Media use in the European Union
 Media use in the European Union Fieldwork November 2017 Survey requested and co-ordinated by the European Commission, Directorate-General for Communication This document does not represent the point of
Special Eurobarometer 461. Report. Designing Europe s future:
 Designing Europe s future: Trust in institutions Globalisation Support for the euro, opinions about free trade and solidarity Fieldwork Survey requested by the European Commission, Directorate-General
PUBLIC OPINION IN THE EUROPEAN UNION
 Standard Eurobarometer 81 Spring 2014 PUBLIC OPINION IN THE EUROPEAN UNION FIRST RESULTS Fieldwork: June 2014 Publication: July 2014 This survey has been requested and co-ordinated by the European Commission,
EUROPEANS, THE EUROPEAN UNION AND THE CRISIS
 Standard Eurobarometer 80 Autumn 2013 EUROPEANS, THE EUROPEAN UNION AND THE CRISIS REPORT Fieldwork: November 2013 This survey has been requested and co-ordinated by the European Commission, Directorate-General
Standard Eurobarometer 89 Spring Report. Europeans and the future of Europe
 Fieldwork March 2018 Survey requested and co-ordinated by the European Commission, Directorate-General for Communication This document does not represent the point of view of the European Commission. The
Standard Eurobarometer 85. Public opinion in the European Union
 Public opinion in the European Union Fieldwork: May 2016 Survey conducted by TNS opinion & social at the request of the European Commission, Directorate-General for Communication Survey coordinated by
EUROPEANS ATTITUDES TOWARDS SECURITY
 Special Eurobarometer 432 EUROPEANS ATTITUDES TOWARDS SECURITY REPORT Fieldwork: March 2015 Publication: April 2015 This survey has been requested by the European Commission, Directorate-General for Migration
EUROBAROMETER The European Union today and tomorrow. Fieldwork: October - November 2008 Publication: June 2010
 EUROBAROMETER 66 Standard Eurobarometer Report European Commission EUROBAROMETER 70 3. The European Union today and tomorrow Fieldwork: October - November 2008 Publication: June 2010 Standard Eurobarometer
Special Eurobarometer 467. Report. Future of Europe. Social issues
 Future of Europe Social issues Fieldwork Publication November 2017 Survey requested by the European Commission, Directorate-General for Communication and co-ordinated by the Directorate- General for Communication
Special Eurobarometer 464b. Report
 Europeans attitudes towards security Survey requested by the European Commission, Directorate-General for Migration and Home Affairs and co-ordinated by the Directorate-General for Communication This document
Flash Eurobarometer 431. Report. Electoral Rights
 Electoral Rights Survey requested by the European Commission, Directorate-General for Justice and Consumers and co-ordinated by the Directorate-General for Communication This document does not represent
Special Eurobarometer 440. Report. Europeans, Agriculture and the CAP
 Survey requested by the European Commission, Directorate-General for Agriculture and Rural Development and co-ordinated by the Directorate-General for Communication This document does not represent the
PUBLIC OPINION IN THE EUROPEAN UNION
 Standard Eurobarometer 77 Spring 2012 PUBLIC OPINION IN THE EUROPEAN UNION REPORT Fieldwork: May 2012 This survey has been requested and co-ordinated by the European Commission, Directorate-General for
Special Eurobarometer 455
 EU Citizens views on development, cooperation and November December 2016 Survey conducted by TNS opinion & social at the request of the European Commission, Directorate-General for International Cooperation
Flash Eurobarometer 430. Summary. European Union Citizenship
 European Union Citizenship Survey requested by the European Commission, Directorate-General for Justice and Consumers and co-ordinated by the Directorate-General for Communication This document does not
EU DEVELOPMENT AID AND THE MILLENNIUM DEVELOPMENT GOALS
 Special Eurobarometer 405 EU DEVELOPMENT AID AND THE MILLENNIUM DEVELOPMENT GOALS REPORT Fieldwork: May - June 2013 Publication: November 2013 This survey has been requested by the European Commission,
INTERNAL SECURITY. Publication: November 2011
 Special Eurobarometer 371 European Commission INTERNAL SECURITY REPORT Special Eurobarometer 371 / Wave TNS opinion & social Fieldwork: June 2011 Publication: November 2011 This survey has been requested
Special Eurobarometer 469. Report
 Integration of immigrants in the European Union Survey requested by the European Commission, Directorate-General for Migration and Home Affairs and co-ordinated by the Directorate-General for Communication
Flash Eurobarometer 431. Summary. Electoral Rights
 Survey requested by the European Commission, Directorate-General for Justice and Consumers and co-ordinated by the Directorate-General for Communication This document does not represent the point of view
Standard Eurobarometer 89 Spring Public opinion in the European Union
 Public opinion in the European Union Fieldwork March 2018 Survey requested and co-ordinated by the European Commission, Directorate-General for Communication This document does not represent the point
Flash Eurobarometer 430. Report. European Union Citizenship
 European Union Citizenship Survey requested by the European Commission, Directorate-General for Justice and Consumers and co-ordinated by the Directorate-General for Communication This document does not
Special Eurobarometer 428 GENDER EQUALITY SUMMARY
 Special Eurobarometer 428 GENDER EQUALITY SUMMARY Fieldwork: November-December 2014 Publication: March 2015 This survey has been requested by the European Commission, Directorate-General for Justice and
EUROBAROMETER 72 PUBLIC OPINION IN THE EUROPEAN UNION Volume 2
 Standard Eurobarometer European Commission EUROBAROMETER 72 PUBLIC OPINION IN THE EUROPEAN UNION Volume 2 REPORT Fieldwork: October - November 2009 Standard Eurobarometer 72 / Autumn 2009 - TNS opinion
PUBLIC PERCEPTIONS OF SCIENCE, RESEARCH AND INNOVATION
 Special Eurobarometer 419 PUBLIC PERCEPTIONS OF SCIENCE, RESEARCH AND INNOVATION SUMMARY Fieldwork: June 2014 Publication: October 2014 This survey has been requested by the European Commission, Directorate-General
EUROPEAN UNION CITIZENSHIP
 Flash Eurobarometer EUROPEAN UNION CITIZENSHIP REPORT Fieldwork: November 2012 Publication: February 2013 This survey has been requested by the European Commission, Directorate-General Justice and co-ordinated
Special Eurobarometer 471. Summary
 Fairness, inequality and intergenerational mobility Survey requested by the European Commission, Joint Research Centre and co-ordinated by the Directorate-General for Communication This document does not
PUBLIC OPINION IN THE EUROPEAN UNION
 Standard Eurobarometer 79 Spring 2013 PUBLIC OPINION IN THE EUROPEAN UNION FIRST RESULTS Fieldwork: May 2013 Publication: July 2013 This survey has been requested and co-ordinated by the European Commission,
Special Eurobarometer 470. Summary. Corruption
 Corruption Survey requested by the European Commission, Directorate-General for Migration and Home Affairs and co-ordinated by the Directorate-General for Communication This document does not represent
EUROBAROMETER 72 PUBLIC OPINION IN THE EUROPEAN UNION. Autumn The survey was requested and coordinated by Directorate-General Communication
 Standard Eurobarometer EUROBAROMETER 72 PUBLIC OPINION IN THE EUROPEAN UNION Autumn 2009 NATIONAL REPO Standard Eurobarometer 72 / Autumn 2009 TNS Opinion & Social UNITED KINGDOM The survey was requested
PUBLIC OPINION IN THE EUROPEAN UNION
 Standard Eurobarometer 77 Spring 2012 PUBLIC OPINION IN THE EUROPEAN UNION FIRST RESULTS Fieldwork: May 2012 Publication: July 2012 This survey has been requested and co-ordinated by the European Commission,
PATIENTS RIGHTS IN CROSS-BORDER HEALTHCARE IN THE EUROPEAN UNION
 Special Eurobarometer 425 PATIENTS RIGHTS IN CROSS-BORDER HEALTHCARE IN THE EUROPEAN UNION SUMMARY Fieldwork: October 2014 Publication: May 2015 This survey has been requested by the European Commission,
A. The image of the European Union B. The image of the European Parliament... 10
 Directorate General for Communication Direction C Relations with citizens PUBLIC OPINION MONITORING UNIT EUROPEAN ELECTIONS 2009 25/05/2009 Pre electoral survey First wave First results: European average
CITIZENS AWARENESS AND PERCEPTIONS OF EU REGIONAL POLICY
 Flash Eurobarometer CITIZENS AWARENESS AND PERCEPTIONS OF EU REGIONAL POLICY REPORT Fieldwork: June 2015 Publication: September 2015 This survey has been requested by the European Commission, Directorate-General
Women in the EU. Fieldwork : February-March 2011 Publication: June Special Eurobarometer / Wave 75.1 TNS Opinion & Social EUROPEAN PARLIAMENT
 EUROPEAN PARLIAMENT Women in the EU Eurobaromètre Spécial / Vague 74.3 TNS Opinion & Social Fieldwork : February-March 2011 Publication: June 2011 Special Eurobarometer / Wave 75.1 TNS Opinion & Social
Firearms in the European Union
 Flash Eurobarometer 383 Firearms in the European Union SUMMARY Fieldwork: September 2013 Publication: October 2013 This survey has been requested by the European Commission, Directorate-General for Home
Europeans attitudes towards climate change
 Special Eurobarometer 313 EUROPEAN PARLIAMENT EUROPEAN COMMISSION Europeans attitudes towards climate change Special Eurobarometer 313 / Wave 71.1 TNS Opinion & Social Report Fieldwork: January - February
Standard Eurobarometer 77 Spring 2012 EUROPE 2020 REPORT
 Standard Eurobarometer 77 Spring 2012 EUROPE 2020 REPORT Fieldwork: May 2012 This survey has been requested and co-ordinated by the European Commission, Directorate-General for Communication. http://ec.europa.eu/public_opinion/index_en.htm
The European emergency number 112
 Flash Eurobarometer The European emergency number 112 REPORT Fieldwork: December 2011 Publication: February 2012 Flash Eurobarometer TNS political & social This survey has been requested by the Directorate-General
Standard Eurobarometer 88 Autumn Public opinion in the European Union
 Public opinion in the European Union Fieldwork November 2017 Survey requested and co-ordinated by the European Commission, Directorate-General for Communication This document does not represent the point
Flash Eurobarometer 364 ELECTORAL RIGHTS REPORT
 Flash Eurobarometer ELECTORAL RIGHTS REPORT Fieldwork: November 2012 Publication: March 2013 This survey has been requested by the European Commission, Directorate-General Justice and co-ordinated by Directorate-General
EUROPEAN YOUTH: PARTICIPATION IN DEMOCRATIC LIFE
 Flash Eurobarometer 375 EUROPEAN YOUTH: PARTICIPATION IN DEMOCRATIC LIFE SUMMARY Fieldwork: April 2013 Publication: May 2013 This survey has been requested by the European Commission, Directorate-General
Special Eurobarometer 474. Summary. Europeans perceptions of the Schengen Area
 Summary Europeans perceptions of the Schengen Area Survey requested by the European Commission, Directorate-General for Migration and Home Affairs and co-ordinated by the Directorate-General for Communication
of the European Commission. Communication. This document of the authors. Standard Eurobarometer 75 / Spring 2011 TNS opinion & social
 Standard Eurobarometer European Commission EUROBAROMETER 75 SPRING 2011 Europe 2020 REPORT Standard Eurobarometer 75 / Spring 2011 TNS opinion & social Fieldwork: May 2011 Publication: August 2011 This
ATTITUDES OF EUROPEAN CITIZENS TOWARDS THE ENVIRONMENT
 Special Eurobarometer 416 ATTITUDES OF EUROPEAN CITIZENS TOWARDS THE ENVIRONMENT SUMMARY Fieldwork: April - May 2014 Publication: September 2014 This survey has been requested by the European Commission,
The Rights of the Child. Analytical report
 Flash Eurobarometer 273 The Gallup Organisation Analytical Report Flash EB N o 251 Public attitudes and perceptions in the euro area Flash Eurobarometer European Commission The Rights of the Child Analytical
Flash Eurobarometer 408 EUROPEAN YOUTH SUMMARY
 Flash Eurobarometer 408 EUROPEAN YOUTH SUMMARY Fieldwork: December 2014 Publication: April 2015 This survey has been requested by the European Commission, Directorate-General for Education and Culture
Special Eurobarometer 468. Report. Attitudes of European citizens towards the environment
 Attitudes of European citizens towards the environment Fieldwork September- Publication November 2017 Survey requested by the European Commission, Directorate-General for Environment and co-ordinated by
Standard Eurobarometer 90 Autumn Public opinion in the European Union
 Autumn 2018 Public opinion in the European Union Fieldwork November 2018 Survey requested and co-ordinated by the European Commission, Directorate-General for Communication This document does not represent
Special Eurobarometer 469
 Summary Integration of immigrants in the European Union Survey requested by the European Commission, Directorate-General for Migration and Home Affairs and co-ordinated by the Directorate-General for Communication
of the European Commission. and the Communication. This document of the authors. Standard Eurobarometer 75 / Spring 2011 TNS opinion & social
 Standard Eurobarometer European Commission EUROBAROMETER 75 SPRING 2011 Europeans, the European Union crisis and the REPORT Standard Eurobarometer 75 / Spring 2011 TNS opinion & social Fieldwork: May 2011
September 2012 Euro area unemployment rate at 11.6% EU27 at 10.6%
 STAT/12/155 31 October 2012 September 2012 Euro area unemployment rate at 11.6% at.6% The euro area 1 (EA17) seasonally-adjusted 2 unemployment rate 3 was 11.6% in September 2012, up from 11.5% in August
Europeans and the crisis
 EUROPEAN PARLIAMENT Europeans and the crisis Report Fieldwork: August September 2010 Publication: November 2010 Special Eurobarometer/Wave 74.1 TNS Opinion & Social Eurobaromètre spécial / Vague 74.1 TNS
EUROBAROMETER 64 FIRST RESULTS
 Standard Eurobarometer European Commission PUBLIC OPINION IN THE EUROPEAN UNION FIRST RESULTS Fieldwork : October-November 2005 Publication : December 2005 Standard Eurobarometer 64 / Autumn 2005 - TNS
EUROBAROMETER 73 FIRST RESULTS
 Standard Eurobarometer European Commission EUROBAROMETER 73 PUBLIC OPINION IN THE EUROPEAN UNION FIRST RESULTS Fieldwork: May 2010 Publication: August 2010 Standard Eurobarometer 73/ Spring 2010 - TNS
Directorate General for Communication Direction C - Relations avec les citoyens PUBLIC OPINION MONITORING UNIT 27 March 2009
 Directorate General for Communication Direction C - Relations avec les citoyens PUBLIC OPINION MONITORING UNIT 27 March 2009 EUROPEANS AND THE ECONOMIC CRISIS Standard Eurobarometer (EB 71) Population:
Euro area unemployment rate at 9.9% EU27 at 9.4%
 STAT/11/76 April 2011 Euro area unemployment rate at 9.9% EU27 at 9.4% The euro area 1 (EA17) seasonally-adjusted 2 unemployment rate 3 was 9.9% in April 2011, unchanged compared with March 4. It was.2%
Autumn 2018 Standard Eurobarometer: Positive image of the EU prevails ahead of the European elections
 European Commission - Press release Autumn 2018 Standard Eurobarometer: Positive image of the EU prevails ahead of the European elections Brussels, 21 December 2018 According to a new Eurobarometer survey
Flash Eurobarometer 429. Summary. The euro area
 LOGO CE_Vertical_EN_NEG_quadri rouge Summary Survey requested by the European Commission, Directorate-General for Economic and Financial Affairs and co-ordinated by the Directorate-General for Communication
The Unitary Patent and the Unified Patent Court. Dr. Leonard Werner-Jones
 The Unitary Patent and the Unified Patent Court Dr. Leonard Werner-Jones Background The Past: No centralization at all Prosecution country-by-country Litigation country-by-country Patents actions 2 Background
STANDARD EUROBAROMETER 74 INFORMATION ON EUROPEAN MATTERS - AUTUMN 2010 EUROBAROMETER 74 AUTUMN 2010 INFORMATION ON EUROPEAN POLITICAL MATTERS
 Standard Eurobarometer European Commission EUROBAROMETER 74 AUTUMN 2010 INFORMATION ON EUROPEAN POLITICAL MATTERS REPORT Fieldwork: November 2010 Publication: February 2011 Standard Eurobarometer 74 /
CITIZENS AWARENESS AND PERCEPTIONS OF EU REGIONAL POLICY
 Flash Eurobarometer 384 CITIZENS AWARENESS AND PERCEPTIONS OF EU REGIONAL POLICY SUMMARY Fieldwork: September 2013 Publication: December 2013 This survey has been requested by the European Commission,
Data Protection in the European Union. Data controllers perceptions. Analytical Report
 Gallup Flash Eurobarometer N o 189a EU communication and the citizens Flash Eurobarometer European Commission Data Protection in the European Union Data controllers perceptions Analytical Report Fieldwork:
The European Emergency Number 112. Analytical report
 Flash Eurobarometer 314 The Gallup Organization Gallup 2 Flash Eurobarometer N o 189a EU communication and the citizens Flash Eurobarometer European Commission The European Emergency Number 112 Analytical
ERGP REPORT ON CORE INDICATORS FOR MONITORING THE EUROPEAN POSTAL MARKET
 ERGP (15) 27 Report on core indicators for monitoring the European postal market ERGP REPORT ON CORE INDICATORS FOR MONITORING THE EUROPEAN POSTAL MARKET 3 December 2015 CONTENTS 1. EXECUTIVE SUMMARY...
ATTITUDES OF EUROPEANS TOWARDS TOURISM
 Flash Eurobarometer 370 ATTITUDES OF EUROPEANS TOWARDS TOURISM SUMMARY Fieldwork: January 2013 Publication: March 2013 This survey has been requested by the European Commission, Directorate-General for
WOMEN IN DECISION-MAKING POSITIONS
 Special Eurobarometer 376 WOMEN IN DECISION-MAKING POSITIONS SUMMARY Fieldwork: September 2011 Publication: March 2012 This survey has been requested by Directorate-General Justice and co-ordinated by
EUROBAROMETER 68 AUTUMN 2007 NATIONAL REPORT UNITED KINGDOM. Standard Eurobarometer PUBLIC OPINION IN THE EUROPEAN UNION
 Standard Eurobarometer European Commission EUROBAROMETER 68 PUBLIC OPINION IN THE EUROPEAN UNION AUTUMN 2007 Standard Eurobarometer 68 / Autumn 2007 TNS Opinion & Social NATIONAL REPORT UNITED KINGDOM
ENTREPRENEURSHIP IN THE EU AND BEYOND
 Flash Eurobarometer 354 ENTREPRENEURSHIP IN THE EU AND BEYOND COUNTRY REPORT JAPAN Fieldwork: July 2012 This survey has been requested by the European Commission, Directorate-General Enterprise and Industry
European Parliament Eurobarometer (EB79.5) ONE YEAR TO GO UNTIL THE 2014 EUROPEAN ELECTIONS Institutional Part ANALYTICAL OVERVIEW
 ONE YEAR TO GO UNTIL THE 2014 EUROPEAN ELECTIONS Institutional Part ANALYTICAL OVERVIEW") Directorate-General for Communication Public Opinion Monitoring Unit Brussels, 21 August 2013. European Parliament Eurobarometer (EB79.5) ONE YEAR TO GO UNTIL THE 2014 EUROPEAN ELECTIONS Institutional
Directorate-General for Communication Public Opinion Monitoring Unit Brussels, 21 August 2013. European Parliament Eurobarometer (EB79.5) ONE YEAR TO GO UNTIL THE 2014 EUROPEAN ELECTIONS Institutional
EUROBAROMETER 69 SPRING 2008 NATIONAL REPORT UNITED KINGDOM. Standard Eurobarometer PUBLIC OPINION IN THE EUROPEAN UNION
 Standard Eurobarometer 69 / Spring 2008 TNS Opinion & Social Standard Eurobarometer European Commission EUROBAROMETER 69 PUBLIC OPINION IN THE EUROPEAN UNION SPRING 2008 NATIONAL REPORT UNITED KINGDOM
Making a difference in the world: Europeans and the future of development aid
 Special Eurobarometer 375 European Commission Making a difference in the world: Europeans and the future of development aid REPORT Special Eurobarometer 375 / Wave 7.61 TNS opinion & social Fieldwork:
The Rights of the Child. Analytical report
 The Gallup Organization Flash EB N o 187 2006 Innobarometer on Clusters Flash Eurobarometer European Commission The Rights of the Child Analytical report Fieldwork: February 2008 Report: April 2008 Flash
Flash Eurobarometer 354. Entrepreneurship COUNTRY REPORT GREECE
 Flash Eurobarometer 354 Entrepreneurship COUNTRY REPORT GREECE Fieldwork: June 2012 This survey has been requested by the European Commission, Directorate-General Enterprise and Industry and co-ordinated
Civil protection Full report
 Special Eurobarometer European Commission Civil protection Full report Fieldwork: September-October 2009 Publication: November 2009 Special Eurobarometer 328 / Wave TNS Opinion & Social This survey was
ENTREPRENEURSHIP IN THE EU AND BEYOND
 Flash Eurobarometer 354 ENTREPRENEURSHIP IN THE EU AND BEYOND COUNTRY REPORT GERMANY Fieldwork: June 2012 This survey has been requested by the European Commission, Directorate-General Enterprise and Industry
CULTURAL ACCESS AND PARTICIPATION
 Special Eurobarometer 399 CULTURAL ACCESS AND PARTICIPATION SUMMARY Fieldwork: April May 2013 Publication: November 2013 This survey has been requested by the European Commission, Directorate-General for
Flash Eurobarometer 405 THE EURO AREA SUMMARY
 Flash Eurobarometer 405 THE EURO AREA SUMMARY Fieldwork: October 2014 Publication: October 2014 This survey has been requested by the European Commission, Directorate-General for Economic and Financial
Context Indicator 17: Population density
 3.2. Socio-economic situation of rural areas 3.2.1. Predominantly rural regions are more densely populated in the EU-N12 than in the EU-15 Context Indicator 17: Population density In 2011, predominantly
Malta-Valletta: Provision of interim services for EASO 2017/S Contract award notice. Results of the procurement procedure.
 1 / 10 This notice in TED website: http://ted.europa.eu/udl?uri=ted:notice:241884-2017:text:en:html Malta-Valletta: Provision of interim services for EASO 2017/S 120-241884 Contract award notice Results
Employment and Social Policy
 Special Eurobarometer 77 European Commission Employment and Social Policy SUMMARY Special Eurobarometer 77 / Wave EB76. TNS opinion & social Fieldwork: September- October 0 Publication: November 0 This
Convergence: a narrative for Europe. 12 June 2018
 Convergence: a narrative for Europe 12 June 218 1.Our economies 2 Luxembourg Ireland Denmark Sweden Netherlands Austria Finland Germany Belgium United Kingdom France Italy Spain Malta Cyprus Slovenia Portugal
Europeans attitudes towards climate change
 Special Eurobarometer European Commission Europeans attitudes towards climate change Fieldwork: August - September 2009 Publication: November 2009 Special Eurobarometer 322 / Wave 72.1 TNS Opinion & Social
Report on women and men in leadership positions and Gender equality strategy mid-term review
 EUROPEAN COMMISSION MEMO Brussels, 14 October 2013 Report on women and men in leadership positions and Gender equality strategy mid-term review 1. New Report on Women in Decision-Making: What is the report
EUROBAROMETER 66 PUBLIC OPINION IN THE EUROPEAN UNION AUTUMN
 Standard Eurobarometer European Commission EUROBAROMETER 66 PUBLIC OPINION IN THE EUROPEAN UNION AUTUMN 2006 NATIONAL REPORT Standard Eurobarometer 66 / Autumn 2006 TNS Opinion & Social EXECUTIVE SUMMARY
Special Eurobarometer 468. Attitudes of European citizens towards the environment
 Attitudes of European citizens towards the environment Fieldwork September- Publication November 2017 Survey requested by the European Commission, Directorate-General for Environment and co-ordinated by
Malta-Valletta: Provision of interim services for EASO 2017/S Contract award notice. Results of the procurement procedure.
 1 / 8 This notice in TED website: http://ted.europa.eu/udl?uri=ted:notice:339167-2017:text:en:html Malta-Valletta: Provision of interim services for EASO 2017/S 165-339167 Contract award notice Results
The European Emergency Number 112
 Gallup 2 Flash Eurobarometer N o 189a EU communication and the citizens Flash Eurobarometer European Commission The European Emergency Number 112 Summary Fieldwork: January 2008 Publication: February 2008
HB010: Year of the survey
 F4: Quality of life HB010: Year of the survey Year (four digits) Flags 2018 Operation 158 F4: Quality of life HB020: Country Reference period Constant Mode of collection Frame BE Belgique/Belgïe BG Bulgaria
Young people and science. Analytical report
 Flash Eurobarometer 239 The Gallup Organization The Gallup Organization Flash EB N o 187 2006 Innobarometer on Clusters Flash Eurobarometer European Commission Young people and science Analytical report
Post-electoral survey 2009
 Special Eurobarometer EUROPEAN PARLIAMENT European Commission Post-electoral survey 2009 Report Fieldwork: June-July 2009 Publication: November 2009 Special Eurobarometer 320/ Wave TNS opinion & social
Data Protection in the European Union. Citizens perceptions. Analytical Report
 Gallup Flash Eurobarometer N o 189a EU communication and the citizens Flash Eurobarometer European Commission Data Protection in the European Union Citizens perceptions Analytical Report Fieldwork: January
Alternative views of the role of wages: contours of a European Minimum Wage
 Alternative views of the role of wages: contours of a European Minimum Wage Europe at a crossroads which way to quality jobs and prosperity? ETUI-ETUC Conference Brussels, 24-26 September 2014 Dr. Torsten
The. Special Eurobarometer 368. Special Eurobarometer 368 / Wave EB 75.3 TNS opinion & social. This document. of the authors.
 Special Eurobarometer 368 European Commission The Common Agricultural Policy REPORT Special Eurobarometer 368 / Wave TNS opinion & social Fieldwork: May 2011 Publication: September 2011 This survey has
European Parliament Eurobarometer (EB79.5) ONE YEAR TO GO TO THE 2014 EUROPEAN ELECTIONS Economic and social part DETAILED ANALYSIS
 ONE YEAR TO GO TO THE 2014 EUROPEAN ELECTIONS Economic and social part DETAILED ANALYSIS") Directorate-General for Communication Public Opinion Monitoring Unit Brussels, 18 October 2013 European Parliament Eurobarometer (EB79.5) ONE YEAR TO GO TO THE 2014 EUROPEAN ELECTIONS Economic and social
Directorate-General for Communication Public Opinion Monitoring Unit Brussels, 18 October 2013 European Parliament Eurobarometer (EB79.5) ONE YEAR TO GO TO THE 2014 EUROPEAN ELECTIONS Economic and social