Standard Eurobarometer 89 Spring Report. Europeans and the future of Europe
|
|
|
- Duane Byrd
- 5 years ago
- Views:
Transcription

1 Fieldwork March 2018 Survey requested and co-ordinated by the European Commission, Directorate-General for Communication This document does not represent the point of view of the European Commission. The interpretations and opinions contained in it are solely those of the authors. Wave EB89.1 Kantar Public Brussels on behalf of TNS opinion & social
2 Fieldwork: March 2018 Survey conducted by Kantar Public Brussels on behalf of TNS opinion & social at the request of the European Commission, Directorate-General for Communication Survey co-ordinated by the European Commission, Directorate-General for Communication (DG COMM Media monitoring, media analysis and Eurobarometer Unit)
3 Project number Project title Language version EN Catalogue number NA EN-N ISBN doi: / European Union,
4 TABLE OF CONTENTS INTRODUCTION 2 I. THE EUROPEAN UNION IN The EU s main assets 4 2 The EU s main challenges 12 II. LIFE IN THE EU 21 1 Are Europeans happy? 21 2 The benefits of the EU s achievements 28 III. THE FUTURE OF EUROPE 36 1 What life in the EU for those who are children today? 36 2 More or less EU decision-making? 42 3 What would be most helpful for the future of Europe? 49 ANNEXES Technical specifications 1
5 INTRODUCTION The Standard Eurobarometer survey 89 was carried out between 13 and 28 March in 34 countries and territories: the 28 Member States of the European Union, the five candidate countries (the former Yugoslav Republic of Macedonia, Turkey, Montenegro, Serbia and Albania) and the Turkish Cypriot Community in the part of the country not controlled by the government of the Republic of Cyprus. The full survey report consists of several volumes. The first volume presents the results of the general questions on the state of public opinion in the European Union, and economic issues in the European Union. Four other volumes present the views of Europeans on the following subjects: the European Union s priorities, the budget of the European Union, European citizenship and. This fifth volume is devoted to Europeans and the future of Europe. Several special Eurobarometer surveys about Future of Europe have been conducted in , , , , , and This report can be considered as the eighth one of the series and presents a snapshot of the way Europeans perceive the EU and its future direction. The first chapter of this report considers citizen s views of the EU s present circumstances including their opinions about the EU s main assets and its main challenges. The second chapter focusses on life in the EU whether Europeans are happy, and whether they have benefited from a number of the EU s achievements. In the final chapter, the focus shifts to Europe s future. A range of topics are covered, including the prospects for young people in the Europe of the future, whether there should be more or less EUlevel decision-making, and the factors that would be most helpful for Europe s future. 1 Please refer to the technical specifications for information on the exact dates of the interviews in each country. 2 Special Eurobarometer 251: 3 Standard Eurobarometer 71 Spring 2009 Future of Europe report: 4 Special Eurobarometer 379: 5 Special Eurobarometer 394: 6 Special Eurobarometer 413: 7 Special Eurobarometer 451: 8 Special Eurobarometer 467: 2
6 The methodology used is that of the Standard Eurobarometer surveys carried out by the Directorate-General for Communication ( Media monitoring, media analysis and Eurobarometer Unit) 9. It is the same for all countries and territories covered in the survey. A technical note concerning the interviews conducted by the member institutes of the TNS Opinion & Social network is annexed to this report. It also specifies the confidence intervals 10. Note: In this report, countries are referred to by their official abbreviation. The abbreviations used in this report correspond to: Belgium BE Lithuania LT Bulgaria BG Luxembourg LU Czech Republic CZ Hungary HU Denmark DK Malta MT Germany DE The Netherlands NL Estonia EE Austria AT Ireland IE Poland PL Greece EL Portugal PT Spain ES Romania RO France FR Slovenia SI Croatia HR Slovakia SK Italy IT Finland FI Republic of Cyprus CY * Sweden SE Latvia LV United Kingdom UK European Union weighted average for the 28 Member States BE, FR, IT, LU, DE, AT, ES, PT, IE, NL, FI, EL, EE, SI, CY, MT, SK, LV, LT BG, CZ, DK, HR, HU, PL, RO, SE, UK EU28 Euro area Non euro area * Cyprus as a whole is one of the 28 European Union Member States. However, the acquis communautaire has been suspended in the part of the country which is not controlled by the government of the Republic of Cyprus. For practical reasons, only the interviews carried out in the part of the country controlled by the government of the Republic of Cyprus are included in the CY category and in the EU28 average. ] We wish to thank the people throughout the European Union who have given their time to take part in this survey. Without their active participation, this study would not have been possible The results tables are annexed. It should be noted that the total of the percentages indicated in the tables in this report may exceed 100% when the respondent was able to choose several answers to the same question. 3
.")
.")
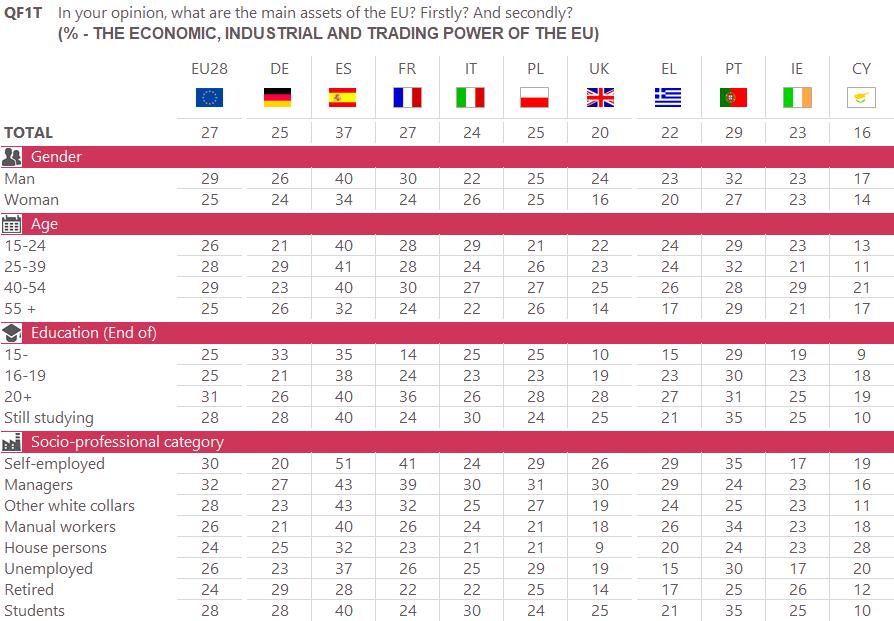
7 I. THE EUROPEAN UNION IN The EU s main assets The EU s respect for democracy, human rights and the rule of law is still considered to be its main assets Respondents were asked what they thought were the main assets of the EU. They were able to give two answers 11. The chart below shows the overall results for all answers (first and second mentioned assets). Just over three in ten respondents mention the EU's respect for democracy, human rights and the rule of law (31%). More than one quarter mention the good relationship between the EU's Member States, or the economic, industrial and trading power of the EU (both 27%). More than one in five (22%) mention the standard of living of EU citizens. Almost one in five (17%) say the EU's ability to promote peace and democracy outside its borders is a main asset, while 11% mention the quality of infrastructure in the EU, the EU's commitment to environmental responsibility, or the skills and talents of EU citizens. One in ten (10%) mention the EU's capacity for research and innovation. The results have generally remained stable since 2017, although respondents are slightly less likely to mention the economic, industrial and trading power of the EU (-3 percentage points), or the EU's capacity for research and innovation (-2). They are slightly more likely to mention the good relationship between the EU s Member States (+2). 11 QF1T In your opinion, what are the main assets of the EU? Firstly? And secondly? 4
, while 16% mention the good relationship between the EU's Member States, and 15% mention the")
.")
8 Focusing on the first asset mentioned, the analysis shows little difference in terms of the ranking of assets compared to the overall results. Almost one in five mention the EU's respect for democracy, human rights and the rule of law (18%), while 16% mention the good relationship between the EU's Member States, and 15% mention the economic, industrial and trading power of the EU. Just over one in ten (11%) mention the standard of living of EU citizens. Other items are mentioned by less than 10%. Compared to the last survey in September-October 2017, respondents are now more likely to first mention the good relationship between the EU s Member States (+3 percentage points). They are less likely to first mention the economic, industrial and trading power of the EU (-2). 5

9 Across the EU as a whole, there are 12 countries where respondents are most likely to say the EU's respect for democracy, human rights and the rule of law is the main asset. In eight EU countries, respondents are most likely to mention the good relationship between the EU s Member States, while respondents in a further five are most likely to mention the standard of living of EU citizens. Spain is the only country where respondents are most likely to mention the economic, industrial and trading power of the EU. In Cyprus, respondents are equally likely to mention the EU's respect for democracy, human rights and the rule of law and the good relationship between the EU s Member States. In Ireland and Malta respondents are equally likely to mention the EU's respect for democracy, human rights and the rule of law and the standard of living of EU citizens. 6
10 The EU's respect for democracy, human rights and the rule of law is most likely to be considered a main asset by respondents in Sweden (53%) and in Denmark and Germany (both 48%), while those in Slovakia (21%), the United Kingdom, Spain and Greece (all 23%) are the least likely to think this way. Compared to September-October 2017, respondents in 18 EU Member States are now more likely to mention the EU's respect for democracy, human rights and the rule of law, and this is particularly the case in Latvia (37%, +7 percentage points) and Lithuania (34%, +7). In contrast, those in the United Kingdom (23%, -9) are less likely to mention this as an asset. Respondents in Luxembourg (39%), Belgium (38%) and in Lithuania and the Czech Republic (both 37%) are the most likely to say the good relationship between the EU's Member States is one of its main assets. Respondents in Spain (21%) and in the United Kingdom and Hungary (both 22%) are the least likely to mention this. Compared to 2017, respondents in 19 countries are now more likely to mention the good relationship between the EU's Member States as an asset, with the largest increases observed in Belgium (38%, +10) and Luxembourg (39%, +9). Spain (37%) is the only country where respondents are most likely to mention the economic, industrial and trading power of the EU, although this is also widely mentioned in the Netherlands (38%) and in Croatia (34%). In contrast, 13% in Malta, 16% in Cyprus and 20% in the United Kingdom mention this as a main asset. In 23 countries, respondents are now less likely to mention this than they were in 2017, and this is particularly the case amongst those in the Netherlands (38%, -8), in Austria (21%, -8) and in the United Kingdom (20%, -8). Across the EU, more than one third of respondents in Latvia (44%), Croatia (41%) and Slovenia Romania and Lithuania (all 35%) say the standard of living of EU citizens is one of its main assets. Those in Italy and Sweden (both 13%) and in Greece (14%) are the least likely to mention this. Respondents in Lithuania (35%, -8) and Malta (26%, -8) are now less likely to mention the standard of living of EU citizens as a main asset, compared to Respondents in Germany (24%), Lithuania (22%) and Romania, Austria and Luxembourg (all 20%) are the most likely to say the EU's ability to promote peace and democracy outside its borders is one of its main assets. This compares to 12% of respondents in Estonia, Malta and Poland. Changes since 2017 are generally minor, with the largest a six-point decline in mentions amongst respondents in Sweden (16%). Respondents in Ireland (20%) and in Greece and Poland (both 17%) are the most likely to say the quality of infrastructure in the EU is one of its main assets. Those in Denmark (3%), Sweden (4%) and Finland (6%) are the least likely to mention this. Changes since 2017 are generally minor, with the largest a seven-point decline in mentions amongst respondents in Poland (17%). The EU s commitment to environmental responsibility is most likely to be mentioned as a main asset by respondents in Denmark (20%) Portugal (19%) and Sweden and the Netherlands (both 17%). Itis the least likely to be mentioned by those in Estonia (4%) and the United Kingdom and Lithuania (both 6%). Respondents in Portugal (19%, +8) are now more likely to mention this as a main asset, while those in Malta (9%, -11) and Sweden (17%, -8) are now less likely to do so. Respondents in Ireland and Malta (both 23%) and in Hungary (18%) are the most likely to consider the skills and talents of EU citizens as one of its main assets. Those in Denmark (5%), on the other hand, are the least likely to do so. Compared to 2017, respondents in Malta are now more likely to mention this as a main asset (23%, +10). 7
.")
11 The EU's capacity for research and innovation is most likely to be considered a main asset by respondents in Cyprus and Greece (both 16%) and in Italy (15%) and least likely to be mentioned by respondents in Latvia (5%). In 24 countries, it is now less likely to be mentioned, with the largest decreases seen amongst those in Slovenia (7%, -6) and Austria (11%, -6). 8
12 The socio-demographic results show few differences based on age or gender, and no consistent patterns based on education level, occupation, household financial situation or class. 9
13 The following tables show the average results for the three most mentioned items by sociodemographic criteria in the European Union as a whole (EU28), in the six largest EU countries and in the countries benefiting or having benefited from European Union support to deal with the financial and economic crisis. 10
14 11
 are the most likely to be mentioned, closely followed by unemployment (33%) and migration issues (32%).")
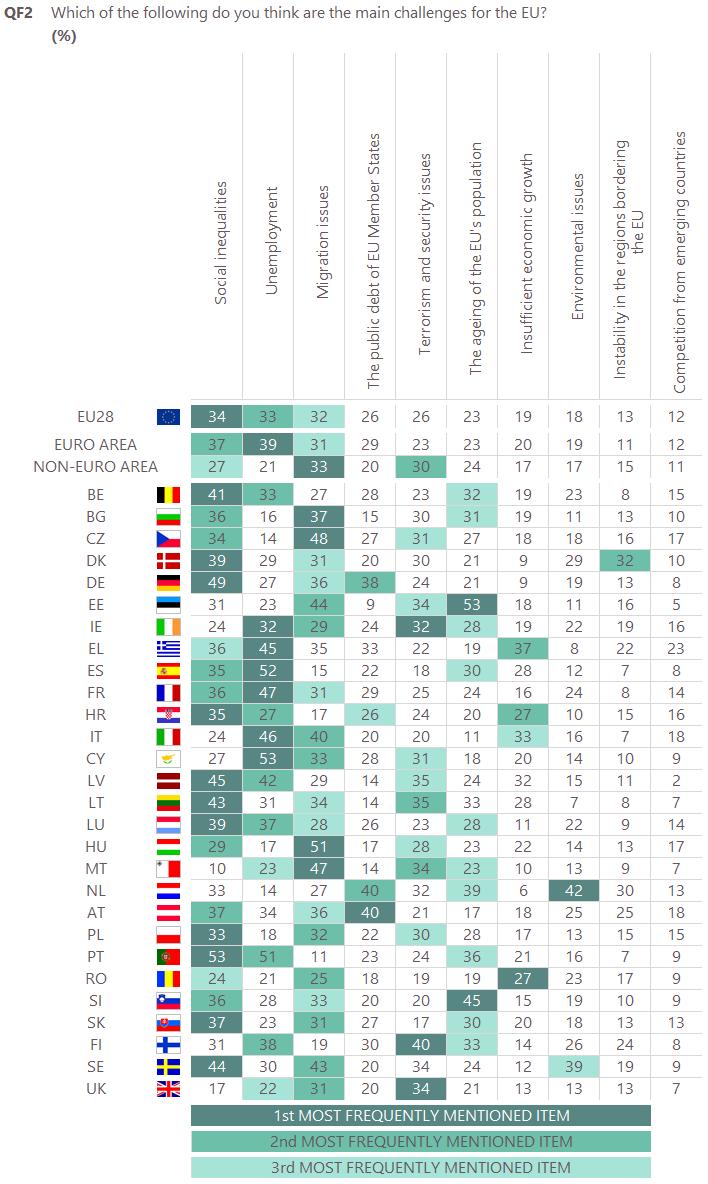
15 2 The EU s main challenges Social inequalities, unemployment and migration issues are the main challenges faced by the EU Respondents were asked to identify up to three main challenges currently faced by the EU 12. Social inequalities (34%) are the most likely to be mentioned, closely followed by unemployment (33%) and migration issues (32%). Just over one quarter (26%) mention the public debt of EU Member States and the same proportion mention terrorism and security issues. More than one in five consider the ageing of the EU s population (23%) to be one of the main challenges for the EU. Almost one in five mention insufficient economic growth (19%) or environmental issues (18%), while more than one in ten mention instability in the regions bordering the EU (13%), or competition from emerging countries (12%). Compared to September-October 2017, respondents are now less likely to mention unemployment, or terrorism and security issues (both -6), but they are more likely to mention the ageing of the EU s population (+5) and the public debt of EU Member States (+4). 12 QF2 Which of the following do you think are the main challenges for the EU? (MAX. 3 ANSWERS) 12
16 Although the same challenges appear in the top six for both euro and non-euro area countries, there are several notable differences. Respondents in the euro area are much more likely to say unemployment is one of the EU s main challenges, compared to those outside the euro area (39% vs. 21%). Those within the euro area are also more likely to say social inequalities (37% vs. 27%) or the public debt of EU Member States (29% vs. 20%) are main challenges for the EU. Respondents outside the euro area are more likely to mention terrorism and security issues (30% vs. 23%), and they are also slightly more likely to mention migration issues (33% vs. 31%) and the ageing of the EU s population (24% vs. 23%). 13

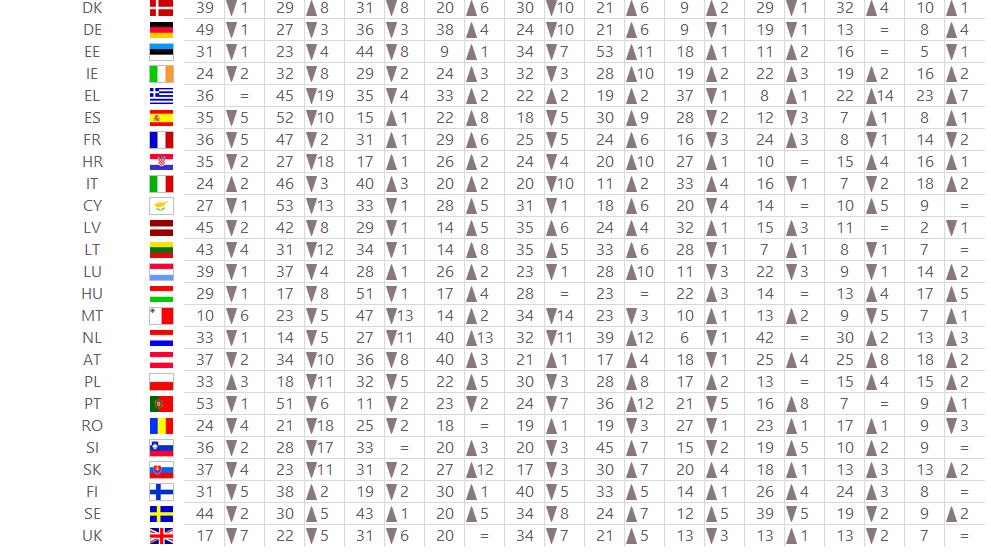
17 In 12 EU Member States, respondents are most likely to say social inequalities are one of the main challenges for the EU. In five countries, respondents are most likely to mention unemployment, while in a further four countries migration issues are the most mentioned. Terrorism and security issues and the ageing of the EU s population are most mentioned in two countries each. In Ireland, unemployment and terrorism and security issues are equally mentioned. Respondents in Austria are most likely to mention the public debt of EU Member States, while those in Romania are most likely to mention insufficient economic growth and those in the Netherlands are most likely to mention environmental issues. Social inequalities are most widely considered a challenge by respondents in Portugal (53%), Germany (49%) and Latvia (45%). They are least likely to be mentioned by those in Malta (10%) and the United Kingdom (17%). In 22 countries, respondents are less likely to mention social inequalities than they were in 2017, and this is particularly the case in the United Kingdom (-7 percentage points). Respondents in Cyprus (53%), Spain (52%) and Portugal (51%) are the most likely to say unemployment is one of the main challenges for the EU, compared to 14% in the Netherlands and the Czech Republic and 16% in Bulgaria. In 25 EU Member States, respondents are now less likely to consider this one of the EU s main challenges, with a decrease of at least ten percentage points in ten countries the largest in Greece (45%, -19), Croatia (27%, -18) and Romania (21%, -18). Migration issues are the most mentioned challenge by more than half of all respondents in Hungary (51%), as well as 48% in the Czech Republic and 47% in Malta. Respondents in Portugal (11%), Spain (15%) and Croatia (17%) are the least likely to consider this one of the main challenges for the EU. Compared to 2017, respondents in 20 countries are now less likely to mention migration issues, and this is particularly the case in Malta (47%, -13) and in the Netherlands (27%, -11). The public debt of EU Member States is most likely to be considered one of the EU s main challenges by respondents in Austria and the Netherlands (both 40%) and in Germany (38%). It is least likely to be mentioned by respondents in Estonia (9%). In 25 EU Member States, respondents are now more likely to mention this than they were in 2017, with the largest increases observed in the Netherlands (40%, +13) and Slovakia (27%, +12). 14
18 Respondents in Finland (40%) and in Lithuania and Latvia (both 35%) are the most likely to think terrorism and security issues are one of the main challenges faced by the EU. Respondents in Slovakia (17%), Spain (18%) and Romania (19%) are the least likely to mention this. In 22 countries, respondents are now less likely to mention terrorism and security issues than they were in 2017, and this is especially the case in Malta (34%, -14), the Netherlands (32%, -11), Italy (20%, -10), Germany (24%, -10) and Denmark (30%, -10). Opinion about the ageing of the EU s population as one of its main challenges varies widely across countries. More than half of all respondents in Estonia (53%) mention it, as do 45% in Slovenia and 39% in the Netherlands. This compares to 11% in Italy, 17% in Austria and 18% in Cyprus. In 26 countries, respondents are now more likely to consider this a main challenge, compared to The largest changes are seen amongst those in Portugal (36%, +12), the Netherlands (39%, +12), Estonia (53%, +11), Luxembourg (28%, +10) and Ireland (28%, +10). At least three in ten respondents in Greece (37%), Italy (33%) and Latvia (32%) think insufficient economic growth is one of the EU s main challenges. In contrast, 6% in the Netherlands and 9% in Denmark and Germany think the same way. Changes since the 2017 survey are generally small. Environmental issues are most likely to be considered one of the EU s main challenges by respondents in the Netherlands (42%), Sweden (39%) and Denmark (29%). In contrast, they are least likely to be mentioned by those in Lithuania (7%), Greece (8%) and Croatia (10%). Changes since 2017 are generally small, with the largest observed in Portugal (16%, +8). At least one quarter of respondents in Denmark (32%), the Netherlands (30%) and Austria (25%) say instability in the regions bordering the EU is one of the EU s main challenges. In contrast, 7% of respondents in Spain, Portugal and Italy say the same. Compared to 2017, respondents in Greece (22%, +14) are now more likely to mention this as a challenge. More than one in five respondents in Greece (23%), as well as 18% in Austria and Italy, say competition from emerging countries is one of the EU s main challenges. This compares to 2% in Latvia and 5% in Estonia. Respondents in Greece are also more likely to mention this than they were in 2017 (23%, +7). 15
19 16
20 17

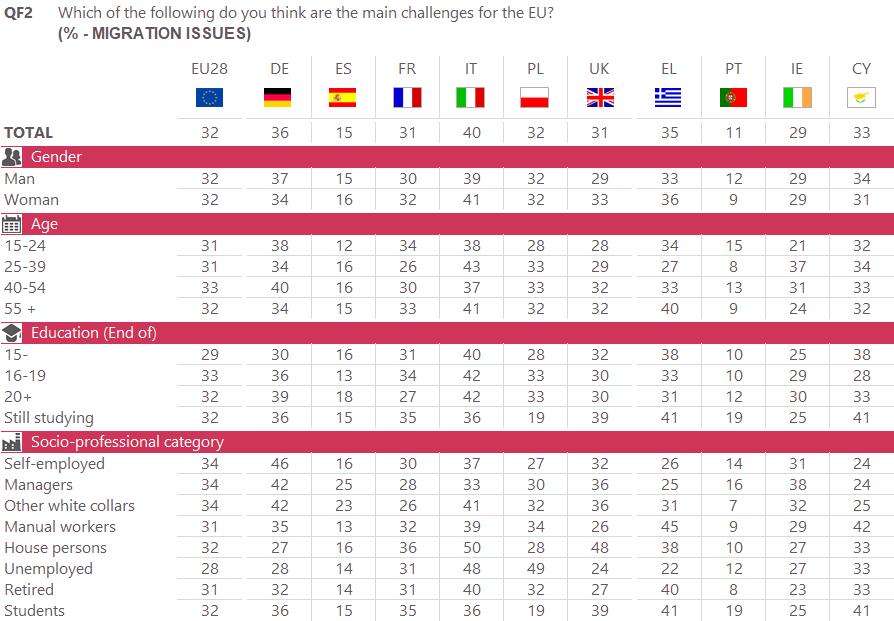
21 The socio-demographic analysis shows that across the EU as a whole, respondents who completed their education aged 20+ are the most likely to consider social inequalities a main challenge, but are the least likely to say this about unemployment. The unemployed and those with the most difficulties paying bills are the most likely to see unemployment as a main challenge. For instance, 43% of those who have trouble paying bills most of the time see unemployment as a main challenge, compared to 30% of those who experience the least financial difficulties. 18

22 The following tables show the average results for the three most mentioned items by sociodemographic criteria in the European Union as a whole (EU28), in the six largest EU countries and in the countries benefiting or having benefited from European Union support to deal with the financial and economic crisis. 19
23 20
24 II. LIFE IN THE EU 1 Are Europeans happy? Large majorities are happy living in their country and in the EU Respondents were asked whether they were happy living in the country they live in, and if they were happy living in the EU 13. More than nine in ten say they are happy living in their country (91%), while three quarters say they are happy living in the EU (75%). The trend results show relatively small changes. Compared to September-October 2017, respondents are now slightly more likely to agree they are happy living in their country (+2 percentage points), but slightly less likely to agree when it comes to living in the EU (-3). 13 QF7 Please tell me to what extent you agree or disagree with each of the following statements. 1. You are happy living in (OUR COUNTRY); 2. You are happy living in the EU. 21


, the Netherlands")
,")
25 More than six in ten respondents in each EU Member State agree they are happy living in their country. Proportions range from 99% in Ireland, the Netherlands and Denmark to 64% in Hungary and 71% in Romania and Bulgaria. More than half of all respondents in each EU Member State say they are happy living in the European Union. Respondents in Luxembourg (95%), the Netherlands (91%), Ireland and Denmark (both 90%) are the most likely to agree, while those in Hungary (52%), Romania (54%) and Greece (59%) are the least likely to do so. 22
26 Compared to September-October 2017, respondents in 24 Member States of the EU are now more likely to agree they are happy living in their country, and this is particularly the case in the Czech Republic (86%, +9 percentage points). On the other hand, in 23 countries, respondents are now less likely to agree they are happy living in the EU than they were in 2017, with the largest decreases observed amongst respondents in Romania (54%, -8) and Finland (81%, -7). 23
27 24
 or in the EU (54%); Respondents aged 15-24 (83%), who completed education aged 20+ (85%), and who are students (87%) or")
28 The socio-demographic analysis illustrates that respondents across all demographic groups are happy to be living in their country, and in the EU: Respondents who experience the most difficulties paying bills are the least likely to be happy living in their country (81%) or in the EU (54%); Respondents aged (83%), who completed education aged 20+ (85%), and who are students (87%) or managers (86%) are the most likely to say they are happy living in the EU. The same pattern does not occur for living in their country. 25

29 The following tables show the average results by socio-demographic criteria in the European Union as a whole (EU28), in the six largest EU countries and in the countries benefiting or having benefited from European Union support to deal with the financial and economic crisis. 26
30 27

.")
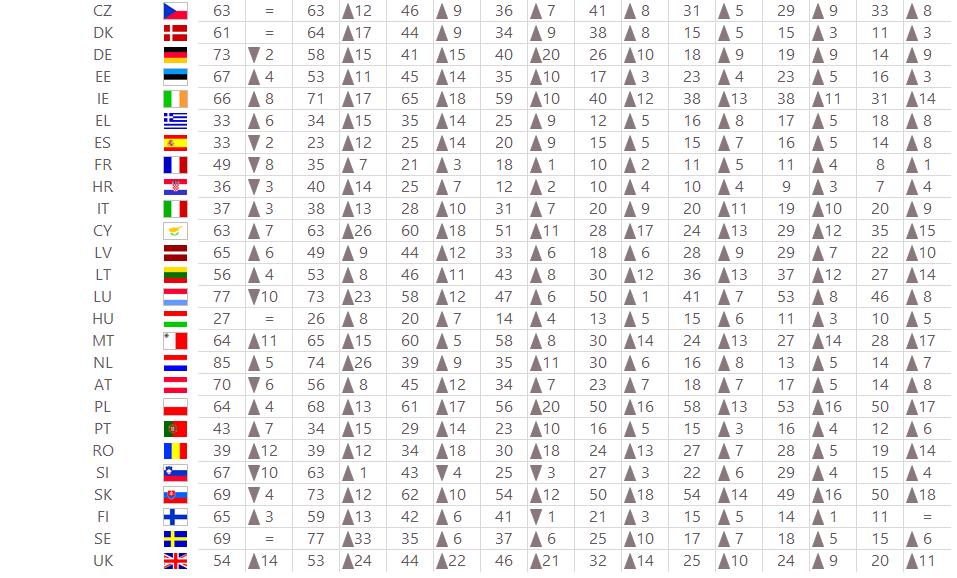
31 2 The benefits of the EU s achievements Respondents are most likely to have benefited from no/ less border controls when travelling abroad Respondents were asked to identify the achievements of the European Union that have directly benefited them 14. Just over half have directly benefited from no/ less border controls when travelling abroad (53%), while almost half say they have benefited from cheaper calls when using a mobile phone in another EU country (48%). More than one third say they have benefited from improved consumer rights when buying products or services in another EU country (37%), or from strengthened rights of air transport passengers in the EU (34%). One quarter have benefited from receiving medical assistance in another EU country (25%), while 22% say this about living or working in another EU country. Almost one in five (19%) have benefited from studying in another EU country. Compared to Spring , respondents are now more likely to say they have benefited from each of these initiatives: cheaper mobile calls in another EU country (+14 percentage points), improved consumer rights (+13), strengthened rights of air passengers (+12), receiving medical assistance in another EU country (+9) or working (+8), living (+8) or studying (+8) in another EU country. 14 QF6. For each of the following achievements of the EU, could you tell me whether you have benefited from it or not. 1. No\less border controls when travelling abroad; 2. Improved consumers rights when buying products or services in another EU country; 3. Cheaper calls when using a mobile phone in another EU country; 4. Receiving medical assistance in another EU country; 5. Strengthened rights of air transport passengers in the EU; 6. Working in another EU country; 7. Living in another EU country; 8. Studying in another EU country. 15 Standard Eurobarometer survey of spring 2014, 31 May-9 June 2014: 28
32 With the exception of no/ less border controls when travelling abroad, respondents living outside the euro area are more likely to say they have benefited from each of these initiatives, compared to those living in the euro area. The largest differences are observed for working in another EU country (31% outside the euro area versus 18% in the euro area), receiving medical assistance in another EU country (33% versus 21%), improved consumer rights (43% versus 33%), strengthened rights of air transport passengers (41% versus 31%), living in another EU country (29% versus 18%) and studying in another EU country (26% versus 16%). Respondents in 16 EU Member States are most likely to say they have benefited from no/ less border controls when travelling abroad, with those in the Netherlands (85%), Luxembourg (77%) and Germany (73%) the most likely to say this. At the other end of the scale, 27% in Hungary and 33% in Spain and Greece say they have benefited from this achievement. Compared to September-October 2017, respondents in 16 countries are now more likely to say they have benefited from no/ less border controls when travelling abroad, with the largest increases seen in the United Kingdom (54%, +14 percentage points), Romania (39%, +12) and Malta (64%, +11). In contrast, respondents in Luxembourg (77%, -10) and Slovenia (67%, -10) are now much less likely to say they have benefited from this. Respondents in the Czech Republic (63%), Cyprus (63%) and Romania (39%) are equally likely to mention no/ less border controls and cheaper calls when using a mobile phone in another EU country. In a further nine countries, respondents are most likely to mention cheaper mobile calls. Overall, respondents in Sweden (77%), the Netherlands (74%) and Luxembourg and Slovakia (both 73%) are the most likely to say they have benefited from this, while those in Spain (23%), Hungary (26%) and Bulgaria (30%) are the least likely to do so. Compared to 2017, respondents in all EU Member States are now more likely to say they have benefited from cheaper calls when using a mobile phone in another EU country, and this is particularly the case in Sweden (77%, +33), Cyprus (63%, +26) and the Netherlands (74%, +26). 29
33 Greece is the only country where respondents are most likely to say they have benefited from improved consumer rights when buying products or services in another EU country (37%), but this achievement is most likely to be mentioned by respondents in Ireland (65%), Slovakia (62%) and Poland (61%). At the other end of the scale, 20% in Hungary, 21% in France and 22% in Bulgaria say they have benefited from this. Respondents in the United Kingdom (44%, +22), Romania (34%, +18), Cyprus (60%, +18) and Ireland (65%, +18) are much more likely than they were in 2017 to say they have benefited from this achievement. Respondents in Ireland (59%), Malta (58%) and Poland (56%) are the most likely to say they have benefited from strengthened rights of air transport passengers in the EU, while those in Croatia (12%), Hungary (14%) and Bulgaria (16%) are the least likely to do so. In 26 countries, respondents are now more likely to say they have benefited from this achievement, compared to 2017, with those in the United Kingdom (46%, +21), Poland (56%, +20) and Germany (40%, +20) the most likely to do so. Half of all respondents in Poland, Slovakia and Luxembourg (all 50%) say they have benefited from receiving medical assistance in another EU country, compared to 10% in Croatia, Bulgaria and France. Compared to 2017, respondents in all 28 countries are now more likely to say they have benefited from this, with the largest increases observed amongst those in Slovakia (50%, +18), Poland (50%, +16), the United Kingdom (32%, +14) and Malta (30%, +14). Poland (58%) and Slovakia (54%) are the only countries where at least half say they have benefited from working in another EU country. At the other end of the scale, 10% in Croatia, 11% in France and 14% in Bulgaria say the same. Respondents in all 28 countries are now more likely to say they have benefited from this achievement, compared to The largest increases are seen in Belgium (37%, +17), Ireland (38%, +13), Cyprus (24%, +13), Lithuania (36%, +13), Malta (24%, +13) and Poland (58%, +13). Respondents in Poland and Luxembourg (both 53%) and in Slovakia (49%) are the most likely to say they have benefited from living in another EU country, while those in Croatia (9%) and in France and Hungary (both 11%) are the least likely to do so. Compared to 2017, respondents in all 28 countries are now more likely to say they have benefited from this, with those in Poland (53%, +16), Slovakia (49%, +16), Malta (27%, +14) and Belgium (35%, +14) the most likely to say this. Finally, respondents in Poland and Slovakia (both 50%) and in Luxembourg (46%) are the most likely to say they have benefited from studying in another EU country particularly compared to those in Croatia (7%) and in France and Bulgaria (both 8%). In all but one country, respondents are more likely to say they have benefited from this, compared to 2017, with the largest increases in Slovakia (50%, +18), Poland (50%, +17) and Malta (28%, +17). The exception is Finland, where there has been no change (11%). 30
34 31
35 32

36 The analysis by socio-demographic criteria shows that younger respondents, those who continued their studies at least to age 20, those who experience the least financial difficulties and those who position themselves higher up the social scale are the most likely to say they have benefited from the achievements of the EU. For example, 60% of year olds say they have benefited from no/ less border controls when travelling abroad, compared to 45% of those aged
37 The following tables shows the results by socio-demographic criteria in the European Union as a whole (EU28 average), in the six largest EU countries and in the countries benefiting or having benefited from European Union support to deal with the financial and economic crisis. 34
38 35
39 III. THE FUTURE OF EUROPE 1 What life in the EU for those who are children today? A majority think the life of the young generation will be more difficult than the life of their own generation Just over half of all respondents think the life of today s children in the EU will be more difficult than the life of those from their own generation (51%) 16. This represents a slight decrease since September-October 2017 (-3 percentage points). Just over one in five think life will be easier for the young generation (21%, +2). The proportion who thinks life will be about the same has increased by two percentage points to 24%. 16 QF4 Generally speaking, do you think that the life of those in the EU who are children today will be easier, more difficult or about the same as the life of those from your own generation? 36
40 The longer-term trend shows the proportion of respondents who think life for today s children in the EU will be more difficult than their own generation remains well below the levels seen between 2006 and Furthermore, this proportion has been steadily decreasing since The proportion of respondents who think life for today s children will be easier remains lower than the highs of 2014 and
, Poland (43%) and Latvia")


, Poland (25%) and Latvia (27%).")
, Croatia (39%) and Finland (38%).")
41 There are only three EU Member States where a majority of respondents believe the life of children in the EU today will be easier than their own: Lithuania (47%), Poland (43%) and Latvia (41%). At the other end of the scale, 8% in Belgium and 10% in Austria and France think the same way. In 22 EU Member States, majorities consider life will be more difficult for today s children in the EU. Respondents in Belgium (77%), Luxembourg (73%) and France (68%) are the most likely to say this, particularly compared to respondents in Lithuania (24%), Poland (25%) and Latvia (27%). In three countries, majorities think life for today s children will be the same as their own generation: Denmark (40%), Croatia (39%) and Finland (38%). Respondents in Austria (40%) are also likely to think this way. In contrast, those in Luxembourg (13%) and Malta and Belgium (both 15%) are the least likely to think life will be the same. Order on Easier Order on More difficult 38
42 Although at an overall EU level there have only been minor changes in opinion since 2017, there have been larger changes at a country level: In 18 EU Member States, respondents are now more likely to say life for children in the EU today will be easier, most notably in Hungary (33%, +8 percentage points). In 20 countries, respondents are now less likely to say life will be more difficult, most notably in Romania (39%, -13 percentage points). In 19 EU Member States, respondents are now more likely to think life for today s children will be the same, most notably in Romania (33%, +10 percentage points). 39

43 At an overall EU level, the socio-demographic analysis illustrates that the majority of each group thinks life will be more difficult, with the exception of students: 37% think it will be about the same and 36% think it will be more difficult. There are differences, however, between those who think life will be more difficult and those who think it will be about the same: the older the respondent, the longer they remained in education, or the more financial difficulties a respondent experiences, the more likely they are to say life will be more difficult, and the less likely they are to say it will be about the same. For instance, 59% of those who completed education aged 15 or younger think life will be more difficult, compared to 48% who completed education aged

44 The following tables shows the results by socio-demographic criteria in the European Union as a whole (EU28 average), in the six largest EU countries and in the countries benefiting or having benefited from European Union support to deal with the financial and economic crisis. 41

, while more than three quarters say this about protecting the environment (79%) or")
45 2 More or less EU decision-making? At least six in ten respondents support more European level decision-making in a range of areas Respondents were asked if more or less decision-making should take place at a European level across a range of areas 17. In each case, the majority think there should be more European level decision-making. Just over eight in ten think there should be more European level decision-making on fighting terrorism (81%), while more than three quarters say this about protecting the environment (79%) or promoting democracy and peace (77%). More than seven in ten think there should be more European level decision-making when it comes to securing energy supply (73%), dealing with migration issues from outside the EU (72%) or promoting equal treatment of men and women (70%). Almost two thirds think there should be more EU level decision-making about stimulating investment and job creation (65%), and 60% say this about dealing with health and social security issues. There have generally only been small changes in opinion since 2017 the exception is a five-point increase in the proportion of those thinking there should be more EU level decision-making about securing energy supply. There has also been a three-point increase in the proportion of those thinking there should be more European level decision-making when it comes to protecting the environment. 17 QF3 For each of the following areas, please tell me if you believe that more decision-making should take place at a European level or on the contrary that less decision-making should take place at a European level. 1. Fighting terrorism; 2. Dealing with health and social security issues; 3. Promoting equal treatment of men and women; 4. Promoting democracy and peace; 5. Securing energy supply; 6. Dealing with migration issues from outside the EU; 7. Protecting the environment; 8. Stimulating investment and job creation. 42

 are now more likely to say there")


46 At least seven in ten respondents in each EU Member State think there should be more European level decision-making about fighting terrorism, ranging from 94% in Cyprus, 93% in Spain and 92% in Portugal to 70% in the United Kingdom and Austria and 71% in Slovakia. Compared to September-October 2017, respondents in Portugal (92%, +9 percentage points) are now more likely to say there should be more EU level decision-making in this area, while those in Slovenia (76%, -8) are now less likely to say this. At least six in ten respondents in each country think there should be more decision-making at a European level about protecting the environment, ranging from 91% in Cyprus and Spain and 90% in Portugal to 60% in Estonia, 63% in Austria and 64% in Slovakia. In 17 EU Member States, respondents are now more likely to say there should be more EU level decision-making about protecting the environment, compared to 2017, and this is particularly the case in Portugal (90%, +11). 43
 and in Portugal and Spain (both 90%) think this way, as do 61% in the United Kingdom, 65% in Austria and 66% in Estonia.")
 and Slovenia (70%, -7) are now less likely to say this.")

47 More than six in ten respondents in each country think there should be more decision-making at European level about promoting democracy and peace. At least nine in ten respondents in Cyprus (91%) and in Portugal and Spain (both 90%) think this way, as do 61% in the United Kingdom, 65% in Austria and 66% in Estonia. Compared to 2017, respondents in Portugal are now more likely to say there should be more EU level decision-making promoting democracy and peace (90%, +9), while those in the United Kingdom (61%, -8) and Slovenia (70%, -7) are now less likely to say this. The majority of respondents in each EU Member State think there should be more European level decision-making about securing energy supply, ranging from 87% in Cyprus and Portugal and 85% in Spain to 56% in Austria and 61% in the United Kingdom and Slovakia. In 24 countries, respondents are now more likely to say there should be more decision-making at a European level when it comes to securing energy supply, compared to This is particularly the case in Poland (75%, +10) and in Portugal (87%, +9). 44
, Spain (88%), Portugal (85%) and Germany (82%) think this way, as do 53% in Austria, 57% in the United")
, respondents are now more likely to say there should be more EU level decision-making in dealing with")
, France (68%, -7) and the Czech Republic (63%, -7).")
, Cyprus (88%) and Spain (87%) the most likely to think this way. The exception is Estonia, where 32% think this way.")
48 More than half the respondents in each EU Member State think there should be more European level decision-making in dealing with migration issues from outside the EU. More than eight in ten respondents in Cyprus (89%), Spain (88%), Portugal (85%) and Germany (82%) think this way, as do 53% in Austria, 57% in the United Kingdom and 59% in Slovakia. In 12 countries, and particularly in Portugal (85%, +10), respondents are now more likely to say there should be more EU level decision-making in dealing with migration issues from outside the EU. However, in 16 countries respondents are now less likely to say this than they were in The largest declines are observed in Slovenia (67%, -10), France (68%, -7) and the Czech Republic (63%, -7). In all but one EU Member State, majorities of respondents think there should be more European level decision-making promoting equal treatment of men and women, with respondents in Portugal (89%), Cyprus (88%) and Spain (87%) the most likely to think this way. The exception is Estonia, where 32% think this way. Compared to 2017, respondents in Portugal (89%, +11) are now more likely to say there should be more EU level decision-making in promoting equal treatment of men and women, while those in Estonia (32%, -12) are now less likely to do so. 45

, France (60%, -8) and Slovenia (67%, -8), on the other hand, are now less likely to think this way.")
, Portugal (89%) and Spain (80%).")
49 In all countries, respondents are most likely to think there should be more European decisionmaking about stimulating investment and job creation, although proportions range widely: from 90% in both Portugal and Cyprus and 85% in Spain to 44% in Estonia, 47% in Denmark and 50% in Austria. Compared to 2017, respondents in Portugal (90%, +8) and Cyprus (90%, +8) are now more likely to think there should be more decision-making at a European level when it comes to stimulating investment and job creation. Those in Estonia (44%, -9), France (60%, -8) and Slovenia (67%, -8), on the other hand, are now less likely to think this way. There is more diversity in opinion about whether there should be more European level decisionmaking dealing with health and social security issues. A majority in 24 EU Member States think there should be, with the highest proportions in Cyprus (91%), Portugal (89%) and Spain (80%). In the remaining four countries, a majority think there should be less European level decision-making in this area: Sweden (66%), Finland (63%), Austria (48%) and Denmark (45%). Respondents in Portugal (89%, +13) are now much more likely to think there should be more European level decision-making dealing with health and social security issues, while those in Slovenia (58%, -12) and Sweden (26%, -12) are less likely to do so. 46
50 47

51 The socio-demographic analysis illustrates no notable differences based on gender, and no consistent differences based on occupation. However, it does show the following: Those under 55 are the most likely to think there should be more EU level decision-making in each of these areas, with the exception of fighting terrorism, where there is little difference. For example, 67% of year olds think there should be more European level decisionmaking dealing with health and social security issues, compared to 57% of those aged 55+.; The longer respondents remained in education, the more likely they are to think there should be more European level decision-making in each of these areas, with the exception of stimulating investment and job creation and dealing with health and social security issues; Respondents who experience the least financial difficulties are the most likely to think there should be more European level decision-making in almost all of these areas, with the exception of stimulating investment and job creation, and dealing with health and social security issues. 48
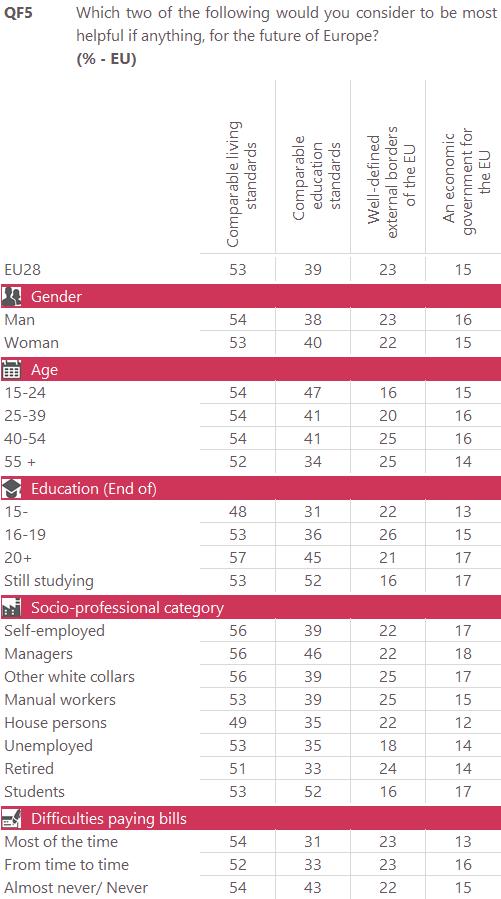
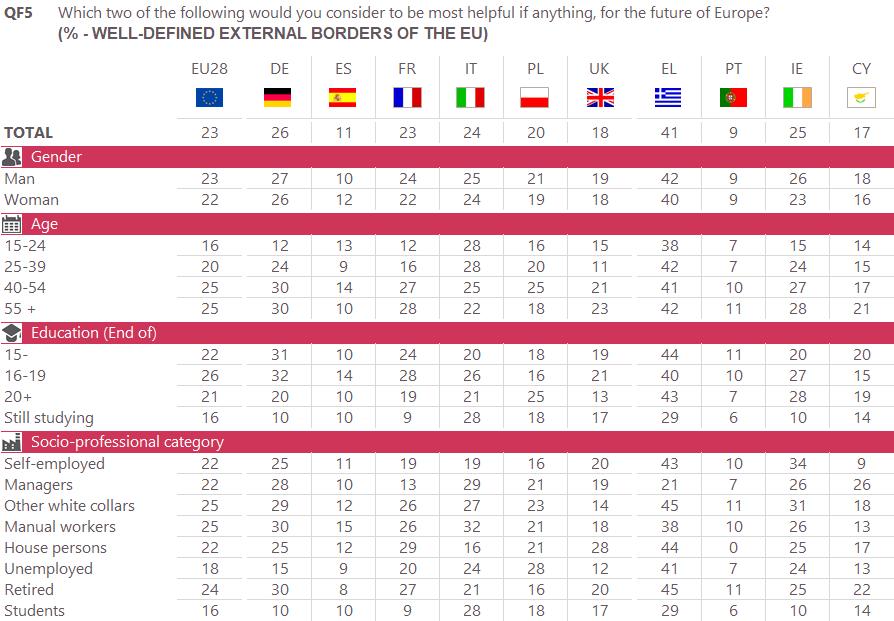
52 3 What would be most helpful for the future of Europe? Comparable living standards are considered the most helpful for the future of Europe More than half of all respondents say comparable living standards would be most helpful for the future of Europe (53%), while more than a third say comparable education standards would be most helpful (39%). 18 More than one in five say well-defined external borders of the EU (23%) would be most helpful for the future of Europe, while at least one in ten mention an economic government for the EU (15%), the introduction of the euro in all EU countries (13%) or a common army (12%). There have only been small shifts in opinion since The largest increase is observed for comparable education standards (+4 percentage points), while the largest decrease is for proportion mentioning an economic government for the EU (-3). 18 QF5 Which two of the following would you consider to be most helpful if anything, for the future of Europe? (MAX. 2 ANSWERS) 49

53 Comparable living standards are the most mentioned item in 22 Member States of the EU, while in five EU Member States respondents are most likely to mention comparable education standards. Austria is the only country where well-defined external borders of the EU are most likely to be mentioned. At least seven in ten respondents in Lithuania (76%) and Bulgaria (71%) say comparable living standards would be the most helpful for the future of Europe, as do 69% of those in Slovenia. Respondents in Malta (33%) and in Luxembourg and Denmark (both 44%) are the least likely to mention this, although these proportions still represent at least one third of the respondents in each country. In 15 EU Member States, respondents are now more likely to say comparable living standards would be the most helpful for the future of Europe, compared to This is most notable in the Netherlands (58%, +5) and in Slovakia (61%, +5). In contrast, mentions have declined in nine countries, particularly in Malta (33%, -10) and Croatia (57%, -9). Comparable education standards are mentioned by at least half of all respondents in four countries: Sweden (59%), Spain (58%), Germany (57%) and Luxembourg (50%). At the other end of the scale, 19% in Hungary and Slovakia and 20% in Croatia also mention these. Compared to 2017, respondents in 17 countries are now more likely to mention comparable education standards, and this is particularly the case in Luxembourg (50%, +10), Latvia (33%, +10) and Spain (58%, +10). In eight countries, on the other hand, respondents are now less likely to mention this, with the largest declines observed in Malta (46%, -13). Respondents in Austria (47%), Greece (41%) and Hungary (39%) are the most likely to mention well-defined external borders of the EU. Respondents in Portugal (9%), Lithuania (10%) and Spain (11%) are the least likely to mention this. Respondents in 21 EU Member States are now less likely to mention this, with the largest decreases seen amongst those in Estonia (23%, -8). Respondents in Greece, on the other hand, are now more likely to mention this (41%, +11). 50
54 At least one in five respondents in Belgium, Italy, Cyprus (all 21%) and Lithuania (20%) mention an economic government for the EU, compared to 7% in Sweden and 9% in Austria and Finland. Compared to 2017, respondents in 20 countries are now less likely to mention this, with the largest decrease observed in Malta (17%, -8). Respondents in Ireland and Romania (both 27%) and in Slovakia (23%) are the most likely to say the introduction of the euro in all EU countries would be the most helpful for the future of Europe. Respondents in the United Kingdom (4%), Spain (6%) and the Czech Republic (7%) are the least likely to say this. In 15 countries, respondents are now more likely to mention the introduction of the euro, and this is particularly the case in Croatia (20%, +8). A common army is mentioned by more than one quarter of respondents in the Netherlands and Cyprus (both 26%), but by just 3% in Spain. Compared to 2017, respondents in Cyprus (26%, +9) are now more likely to mention this as being helpful for the future of Europe. 51
55 52
56 The socio-demographic analysis reveals no differences based on gender, and no consistent trends based on age, education level, occupation, household financial situation or perceived social class. However, the analysis does illustrate the following: The younger the respondents, the more likely they are to think comparable education standards would be most helpful for the future of Europe, and the less likely they are to mention well-defined external borders of the EU; The longer respondents remained in education, the more likely they are to mention comparable living standards or comparable education standards. For example, 45% of respondents who completed their education aged 20 or after mention comparable education standards, compared to 31% of those who completed their education aged 15 or younger. Students (52%) and managers (46%) are more likely than other occupation groups to mention comparable education standards. Respondents who experience the least financial difficulties are the most likely to mention comparable education standards (43% vs. 31%-33% of those who experience greater difficulties). 53
57 54
, in the")

58 The following tables shows the result by socio-demographic criteria for the most mentioned item in the European Union as a whole (EU28 average), in the six largest EU countries and in the countries benefiting or having benefited from European Union support to deal with the financial and economic crisis. 55
59 56
60 Technical specifications TECHNICAL SPECIFICATIONS Between the 13 th and the 28 th March 2018, TNS opinion & social, a consortium created between TNS political & social, TNS UK and Kantar Belgium, and represented by the Kantar Belgium S.A. coordination centre, carried out the wave 89.1 of the EUROBAROMETER survey, on request of the EUROPEAN COMMISSION, Directorate-General for Communication, Media monitoring, media analysis and Eurobarometer Unit. The wave 89.1 is the STANDARD EUROBAROMETER 89 and covers the population of the respective nationalities of the European Union Member States, resident in each of the 28 Member States and aged 15 years and over. The STANDARD EUROBAROMETER 89 survey has also been conducted in five candidate countries (Turkey, the Former Yugoslav Republic of Macedonia, Montenegro, Serbia and Albania) and in the Turkish Cypriot Community. In these countries and in the Turkish Cypriot Community, the survey covers the national population of citizens and the population of citizens of all the European Union Member States that are residents in these countries and territories and have a sufficient command of the national languages to answer the questionnaire. COUNTRIES INSTITUTES N DATES POPULATION PROPORTION INTERVIEWS FIELDWORK 15+ EU28 BE Belgium Kantar Belgium (Kantar TNS) 1,028 14/03/ /03/2018 9,693, % BG Bulgaria Kantar TNS BBSS 1,032 14/03/ /03/2018 6,537, % CZ Czech Rep. Kantar CV 1,047 15/03/ /03/2018 9,238, % DK Denmark Kantar Gallup 1,015 13/03/ /03/2018 4,838, % DE Germany Kantar Deutschland 1,509 14/03/ /03/ ,160, % EE Estonia AS Emor, Kantar Emor 1,021 14/03/ /03/2018 1,160, % IE Ireland Behaviour & Attitudes 1,007 14/03/ /03/2018 3,592, % EL Greece Taylor Nelson Sofres Market Research 1,012 14/03/ /03/2018 9,937, % ES Spain TNS Investigación de Mercados y Opinión 1,019 16/03/ /03/ ,445, % FR France Kantar Public France 1,020 14/03/ /03/ ,097, % HR Croatia Hendal 1,056 14/03/ /03/2018 3,796, % IT Italy Kantar Italia 1,023 13/03/ /03/ ,334, % CY Rep. Of Cyprus CYMAR Market Research /03/ /03/ , % LV Latvia Kantar TNS Latvia 1,006 14/03/ /03/2018 1,707, % LT Lithuania TNS LT 1,003 13/03/ /03/2018 2,513, % LU Luxembourg ILReS /03/ /03/ , % HU Hungary Kantar Hoffmann 1,048 15/03/ /03/2018 8,781, % MT Malta MISCO International /03/ /03/ , % NL Netherlands TNS NIPO (trading under Kantar Public) 1,060 13/03/ /03/ ,979, % AT Austria Info Research Austria Institut für Marktund Meinungsforschung 1,039 13/03/ /03/2018 7,554, % PL Poland Kantar Polska 1,013 16/03/ /03/ ,444, % PT Portugal Marktest Marketing, Organização e Formação 1,087 14/03/ /03/2018 8,480, % RO Romania Centrul Pentru Studierea Opiniei si Pietei (CSOP) 1,030 14/03/ /03/ ,852, % SI Slovenia Institute for market and media research, Mediana 1,027 13/03/ /03/2018 1,760, % SK Slovakia Kantar Slovakia 1,019 13/03/ /03/2018 4,586, % FI Finland Kantar TNS Oy 1,009 13/03/ /03/2018 4,747, % SE Sweden Kantar Sifo 1,005 13/03/ /03/2018 7,998, % UK United Kingdom The Kantar Group UK 1,337 14/03/ /03/ ,651, % TOTAL EU28 27,988 13/03/ /03/ ,452, %* * It should be noted that the total percentage shown in this table may exceed 100% due to rounding CY(tcc) Turkish Cypriot Community Lipa Consultancy /03/ /03/ ,226 TR Turkey TNS Piar 1,003 15/03/ /03/ ,770,205 MK Former Yugoslav Republic of Macedonia TNS BRIMA 1,050 13/03/ /03/2018 1,721,528 ME Montenegro TNS Medium Gallup /03/ /03/ ,030 RS Serbia TNS Medium Gallup 1,019 13/03/ /03/2018 6,161,584 AL Albania TNS BBSS 1,048 15/03/ /03/2018 2,221,572 TOTAL 5,142 13/03/ /03/ ,971,364 TS1
Special Eurobarometer 467. Report. Future of Europe. Social issues
 Future of Europe Social issues Fieldwork Publication November 2017 Survey requested by the European Commission, Directorate-General for Communication and co-ordinated by the Directorate- General for Communication
Standard Eurobarometer 89 Spring Report. European citizenship
 European citizenship Fieldwork March 2018 Survey requested and co-ordinated by the European Commission, Directorate-General for Communication This document does not represent the point of view of the European
Standard Eurobarometer 88 Autumn Report. Media use in the European Union
 Media use in the European Union Fieldwork November 2017 Survey requested and co-ordinated by the European Commission, Directorate-General for Communication This document does not represent the point of
Special Eurobarometer 461. Report. Designing Europe s future:
 Designing Europe s future: Trust in institutions Globalisation Support for the euro, opinions about free trade and solidarity Fieldwork Survey requested by the European Commission, Directorate-General
Firearms in the European Union
 Flash Eurobarometer 383 Firearms in the European Union SUMMARY Fieldwork: September 2013 Publication: October 2013 This survey has been requested by the European Commission, Directorate-General for Home
EUROPEAN YOUTH: PARTICIPATION IN DEMOCRATIC LIFE
 Flash Eurobarometer 375 EUROPEAN YOUTH: PARTICIPATION IN DEMOCRATIC LIFE SUMMARY Fieldwork: April 2013 Publication: May 2013 This survey has been requested by the European Commission, Directorate-General
EUROPEANS ATTITUDES TOWARDS SECURITY
 Special Eurobarometer 432 EUROPEANS ATTITUDES TOWARDS SECURITY REPORT Fieldwork: March 2015 Publication: April 2015 This survey has been requested by the European Commission, Directorate-General for Migration
EUROPEAN CITIZENSHIP
 Standard Eurobarometer 81 Spring 2014 EUROPEAN CITIZENSHIP REPORT Fieldwork: June 2014 This survey has been requested and co-ordinated by the European Commission, Directorate-General for Communication.
Flash Eurobarometer 431. Report. Electoral Rights
 Electoral Rights Survey requested by the European Commission, Directorate-General for Justice and Consumers and co-ordinated by the Directorate-General for Communication This document does not represent
Standard Eurobarometer 90 Autumn Public opinion in the European Union
 Autumn 2018 Public opinion in the European Union Fieldwork November 2018 Survey requested and co-ordinated by the European Commission, Directorate-General for Communication This document does not represent
Special Eurobarometer 464b. Report
 Europeans attitudes towards security Survey requested by the European Commission, Directorate-General for Migration and Home Affairs and co-ordinated by the Directorate-General for Communication This document
Special Eurobarometer 455
 EU Citizens views on development, cooperation and November December 2016 Survey conducted by TNS opinion & social at the request of the European Commission, Directorate-General for International Cooperation
Flash Eurobarometer 431. Summary. Electoral Rights
 Survey requested by the European Commission, Directorate-General for Justice and Consumers and co-ordinated by the Directorate-General for Communication This document does not represent the point of view
EU DEVELOPMENT AID AND THE MILLENNIUM DEVELOPMENT GOALS
 Special Eurobarometer 405 EU DEVELOPMENT AID AND THE MILLENNIUM DEVELOPMENT GOALS REPORT Fieldwork: May - June 2013 Publication: November 2013 This survey has been requested by the European Commission,
PUBLIC OPINION IN THE EUROPEAN UNION
 Standard Eurobarometer 79 Spring 2013 PUBLIC OPINION IN THE EUROPEAN UNION FIRST RESULTS Fieldwork: May 2013 Publication: July 2013 This survey has been requested and co-ordinated by the European Commission,
Special Eurobarometer 440. Report. Europeans, Agriculture and the CAP
 Survey requested by the European Commission, Directorate-General for Agriculture and Rural Development and co-ordinated by the Directorate-General for Communication This document does not represent the
Flash Eurobarometer 408 EUROPEAN YOUTH SUMMARY
 Flash Eurobarometer 408 EUROPEAN YOUTH SUMMARY Fieldwork: December 2014 Publication: April 2015 This survey has been requested by the European Commission, Directorate-General for Education and Culture
Standard Eurobarometer 88 Autumn Public opinion in the European Union
 Public opinion in the European Union Fieldwork November 2017 Survey requested and co-ordinated by the European Commission, Directorate-General for Communication This document does not represent the point
EUROPEAN CITIZENSHIP
 Standard Eurobarometer 78 Autumn 2012 EUROPEAN CITIZENSHIP REPORT Fieldwork: November 2012 This survey has been requested and co-ordinated by the European Commission, Directorate-General for Communication.
PUBLIC PERCEPTIONS OF SCIENCE, RESEARCH AND INNOVATION
 Special Eurobarometer 419 PUBLIC PERCEPTIONS OF SCIENCE, RESEARCH AND INNOVATION SUMMARY Fieldwork: June 2014 Publication: October 2014 This survey has been requested by the European Commission, Directorate-General
EUROBAROMETER The European Union today and tomorrow. Fieldwork: October - November 2008 Publication: June 2010
 EUROBAROMETER 66 Standard Eurobarometer Report European Commission EUROBAROMETER 70 3. The European Union today and tomorrow Fieldwork: October - November 2008 Publication: June 2010 Standard Eurobarometer
Flash Eurobarometer 430. Summary. European Union Citizenship
 European Union Citizenship Survey requested by the European Commission, Directorate-General for Justice and Consumers and co-ordinated by the Directorate-General for Communication This document does not
EUROPEANS, THE EUROPEAN UNION AND THE CRISIS
 Standard Eurobarometer 80 Autumn 2013 EUROPEANS, THE EUROPEAN UNION AND THE CRISIS REPORT Fieldwork: November 2013 This survey has been requested and co-ordinated by the European Commission, Directorate-General
ATTITUDES OF EUROPEANS TOWARDS TOURISM
 Flash Eurobarometer 370 ATTITUDES OF EUROPEANS TOWARDS TOURISM SUMMARY Fieldwork: January 2013 Publication: March 2013 This survey has been requested by the European Commission, Directorate-General for
Standard Eurobarometer 77 Spring 2012 EUROPE 2020 REPORT
 Standard Eurobarometer 77 Spring 2012 EUROPE 2020 REPORT Fieldwork: May 2012 This survey has been requested and co-ordinated by the European Commission, Directorate-General for Communication. http://ec.europa.eu/public_opinion/index_en.htm
Special Eurobarometer 469. Report
 Integration of immigrants in the European Union Survey requested by the European Commission, Directorate-General for Migration and Home Affairs and co-ordinated by the Directorate-General for Communication
PUBLIC OPINION IN THE EUROPEAN UNION
 Standard Eurobarometer 77 Spring 2012 PUBLIC OPINION IN THE EUROPEAN UNION FIRST RESULTS Fieldwork: May 2012 Publication: July 2012 This survey has been requested and co-ordinated by the European Commission,
EUROPEAN CITIZENSHIP
 Standard Eurobarometer 80 Autumn 2013 EUROPEAN CITIZENSHIP REPORT Fieldwork: November 2013 This survey has been requested and co-ordinated by the European Commission, Directorate-General for Communication.
EUROPEAN CITIZENSHIP
 Standard Eurobarometer 82 Autumn 2014 EUROPEAN CITIZENSHIP REPORT Fieldwork: November 2014 This survey has been requested and co-ordinated by the European Commission, Directorate-General for Communication.
PUBLIC OPINION IN THE EUROPEAN UNION
 Standard Eurobarometer 81 Spring 2014 PUBLIC OPINION IN THE EUROPEAN UNION FIRST RESULTS Fieldwork: June 2014 Publication: July 2014 This survey has been requested and co-ordinated by the European Commission,
MEDIA USE IN THE EUROPEAN UNION
 Standard Eurobarometer 76 Autumn 2011 MEDIA USE IN THE EUROPEAN UNION REPORT Fieldwork: November 2011 Publication: March 2012 This survey has been requested and co-ordinated by Directorate-General for
EUROPEAN UNION CITIZENSHIP
 Flash Eurobarometer EUROPEAN UNION CITIZENSHIP REPORT Fieldwork: November 2012 Publication: February 2013 This survey has been requested by the European Commission, Directorate-General Justice and co-ordinated
INTERNAL SECURITY. Publication: November 2011
 Special Eurobarometer 371 European Commission INTERNAL SECURITY REPORT Special Eurobarometer 371 / Wave TNS opinion & social Fieldwork: June 2011 Publication: November 2011 This survey has been requested
WOMEN IN DECISION-MAKING POSITIONS
 Special Eurobarometer 376 WOMEN IN DECISION-MAKING POSITIONS SUMMARY Fieldwork: September 2011 Publication: March 2012 This survey has been requested by Directorate-General Justice and co-ordinated by
Standard Eurobarometer 85. Public opinion in the European Union
 Public opinion in the European Union Fieldwork: May 2016 Survey conducted by TNS opinion & social at the request of the European Commission, Directorate-General for Communication Survey coordinated by
CITIZENS AWARENESS AND PERCEPTIONS OF EU REGIONAL POLICY
 Flash Eurobarometer 384 CITIZENS AWARENESS AND PERCEPTIONS OF EU REGIONAL POLICY SUMMARY Fieldwork: September 2013 Publication: December 2013 This survey has been requested by the European Commission,
Flash Eurobarometer 430. Report. European Union Citizenship
 European Union Citizenship Survey requested by the European Commission, Directorate-General for Justice and Consumers and co-ordinated by the Directorate-General for Communication This document does not
of the European Commission. and the Communication. This document of the authors. Standard Eurobarometer 75 / Spring 2011 TNS opinion & social
 Standard Eurobarometer European Commission EUROBAROMETER 75 SPRING 2011 Europeans, the European Union crisis and the REPORT Standard Eurobarometer 75 / Spring 2011 TNS opinion & social Fieldwork: May 2011
Special Eurobarometer 471. Summary
 Fairness, inequality and intergenerational mobility Survey requested by the European Commission, Joint Research Centre and co-ordinated by the Directorate-General for Communication This document does not
Special Eurobarometer 428 GENDER EQUALITY SUMMARY
 Special Eurobarometer 428 GENDER EQUALITY SUMMARY Fieldwork: November-December 2014 Publication: March 2015 This survey has been requested by the European Commission, Directorate-General for Justice and
Standard Eurobarometer 89 Spring Public opinion in the European Union
 Public opinion in the European Union Fieldwork March 2018 Survey requested and co-ordinated by the European Commission, Directorate-General for Communication This document does not represent the point
Special Eurobarometer 470. Summary. Corruption
 Corruption Survey requested by the European Commission, Directorate-General for Migration and Home Affairs and co-ordinated by the Directorate-General for Communication This document does not represent
ENTREPRENEURSHIP IN THE EU AND BEYOND
 Flash Eurobarometer 354 ENTREPRENEURSHIP IN THE EU AND BEYOND COUNTRY REPORT JAPAN Fieldwork: July 2012 This survey has been requested by the European Commission, Directorate-General Enterprise and Industry
ENTREPRENEURSHIP IN THE EU AND BEYOND
 Flash Eurobarometer 354 ENTREPRENEURSHIP IN THE EU AND BEYOND COUNTRY REPORT GERMANY Fieldwork: June 2012 This survey has been requested by the European Commission, Directorate-General Enterprise and Industry
CULTURAL ACCESS AND PARTICIPATION
 Special Eurobarometer 399 CULTURAL ACCESS AND PARTICIPATION SUMMARY Fieldwork: April May 2013 Publication: November 2013 This survey has been requested by the European Commission, Directorate-General for
Special Eurobarometer 474. Summary. Europeans perceptions of the Schengen Area
 Summary Europeans perceptions of the Schengen Area Survey requested by the European Commission, Directorate-General for Migration and Home Affairs and co-ordinated by the Directorate-General for Communication
Flash Eurobarometer 354. Entrepreneurship COUNTRY REPORT GREECE
 Flash Eurobarometer 354 Entrepreneurship COUNTRY REPORT GREECE Fieldwork: June 2012 This survey has been requested by the European Commission, Directorate-General Enterprise and Industry and co-ordinated
Flash Eurobarometer 364 ELECTORAL RIGHTS REPORT
 Flash Eurobarometer ELECTORAL RIGHTS REPORT Fieldwork: November 2012 Publication: March 2013 This survey has been requested by the European Commission, Directorate-General Justice and co-ordinated by Directorate-General
of the European Commission. Communication. This document of the authors. Standard Eurobarometer 75 / Spring 2011 TNS opinion & social
 Standard Eurobarometer European Commission EUROBAROMETER 75 SPRING 2011 Europe 2020 REPORT Standard Eurobarometer 75 / Spring 2011 TNS opinion & social Fieldwork: May 2011 Publication: August 2011 This
PATIENTS RIGHTS IN CROSS-BORDER HEALTHCARE IN THE EUROPEAN UNION
 Special Eurobarometer 425 PATIENTS RIGHTS IN CROSS-BORDER HEALTHCARE IN THE EUROPEAN UNION SUMMARY Fieldwork: October 2014 Publication: May 2015 This survey has been requested by the European Commission,
Flash Eurobarometer 405 THE EURO AREA SUMMARY
 Flash Eurobarometer 405 THE EURO AREA SUMMARY Fieldwork: October 2014 Publication: October 2014 This survey has been requested by the European Commission, Directorate-General for Economic and Financial
Europeans attitudes towards climate change
 Special Eurobarometer 313 EUROPEAN PARLIAMENT EUROPEAN COMMISSION Europeans attitudes towards climate change Special Eurobarometer 313 / Wave 71.1 TNS Opinion & Social Report Fieldwork: January - February
Special Eurobarometer 468. Attitudes of European citizens towards the environment
 Attitudes of European citizens towards the environment Fieldwork September- Publication November 2017 Survey requested by the European Commission, Directorate-General for Environment and co-ordinated by
PUBLIC OPINION IN THE EUROPEAN UNION
 Standard Eurobarometer 77 Spring 2012 PUBLIC OPINION IN THE EUROPEAN UNION REPORT Fieldwork: May 2012 This survey has been requested and co-ordinated by the European Commission, Directorate-General for
The European emergency number 112
 Flash Eurobarometer The European emergency number 112 REPORT Fieldwork: December 2011 Publication: February 2012 Flash Eurobarometer TNS political & social This survey has been requested by the Directorate-General
CITIZENS AWARENESS AND PERCEPTIONS OF EU REGIONAL POLICY
 Flash Eurobarometer CITIZENS AWARENESS AND PERCEPTIONS OF EU REGIONAL POLICY REPORT Fieldwork: June 2015 Publication: September 2015 This survey has been requested by the European Commission, Directorate-General
EUROPEAN CITIZENSHIP
 Standard Eurobarometer 77 Spring 2012 EUROPEAN CITIZENSHIP REPORT Fieldwork: May 2012 This survey has been requested and co-ordinated by the European Commission, Directorate-General for Communication.
EUROBAROMETER 66 PUBLIC OPINION IN THE EUROPEAN UNION AUTUMN
 Standard Eurobarometer European Commission EUROBAROMETER 66 PUBLIC OPINION IN THE EUROPEAN UNION AUTUMN 2006 NATIONAL REPORT Standard Eurobarometer 66 / Autumn 2006 TNS Opinion & Social EXECUTIVE SUMMARY
EUROBAROMETER 72 PUBLIC OPINION IN THE EUROPEAN UNION Volume 2
 Standard Eurobarometer European Commission EUROBAROMETER 72 PUBLIC OPINION IN THE EUROPEAN UNION Volume 2 REPORT Fieldwork: October - November 2009 Standard Eurobarometer 72 / Autumn 2009 - TNS opinion
Women in the EU. Fieldwork : February-March 2011 Publication: June Special Eurobarometer / Wave 75.1 TNS Opinion & Social EUROPEAN PARLIAMENT
 EUROPEAN PARLIAMENT Women in the EU Eurobaromètre Spécial / Vague 74.3 TNS Opinion & Social Fieldwork : February-March 2011 Publication: June 2011 Special Eurobarometer / Wave 75.1 TNS Opinion & Social
September 2012 Euro area unemployment rate at 11.6% EU27 at 10.6%
 STAT/12/155 31 October 2012 September 2012 Euro area unemployment rate at 11.6% at.6% The euro area 1 (EA17) seasonally-adjusted 2 unemployment rate 3 was 11.6% in September 2012, up from 11.5% in August
EUROBAROMETER 72 PUBLIC OPINION IN THE EUROPEAN UNION. Autumn The survey was requested and coordinated by Directorate-General Communication
 Standard Eurobarometer EUROBAROMETER 72 PUBLIC OPINION IN THE EUROPEAN UNION Autumn 2009 NATIONAL REPO Standard Eurobarometer 72 / Autumn 2009 TNS Opinion & Social UNITED KINGDOM The survey was requested
STANDARD EUROBAROMETER 74 INFORMATION ON EUROPEAN MATTERS - AUTUMN 2010 EUROBAROMETER 74 AUTUMN 2010 INFORMATION ON EUROPEAN POLITICAL MATTERS
 Standard Eurobarometer European Commission EUROBAROMETER 74 AUTUMN 2010 INFORMATION ON EUROPEAN POLITICAL MATTERS REPORT Fieldwork: November 2010 Publication: February 2011 Standard Eurobarometer 74 /
The European Emergency Number 112. Analytical report
 Flash Eurobarometer 314 The Gallup Organization Gallup 2 Flash Eurobarometer N o 189a EU communication and the citizens Flash Eurobarometer European Commission The European Emergency Number 112 Analytical
Special Eurobarometer 459. Climate change
 Climate change Survey requested by the European Commission, Directorate-General for Climate Action and co-ordinated by the Directorate- General for Communication This document does not represent the point
The Unitary Patent and the Unified Patent Court. Dr. Leonard Werner-Jones
 The Unitary Patent and the Unified Patent Court Dr. Leonard Werner-Jones Background The Past: No centralization at all Prosecution country-by-country Litigation country-by-country Patents actions 2 Background
A. The image of the European Union B. The image of the European Parliament... 10
 Directorate General for Communication Direction C Relations with citizens PUBLIC OPINION MONITORING UNIT EUROPEAN ELECTIONS 2009 25/05/2009 Pre electoral survey First wave First results: European average
Euro area unemployment rate at 9.9% EU27 at 9.4%
 STAT/11/76 April 2011 Euro area unemployment rate at 9.9% EU27 at 9.4% The euro area 1 (EA17) seasonally-adjusted 2 unemployment rate 3 was 9.9% in April 2011, unchanged compared with March 4. It was.2%
The Rights of the Child. Analytical report
 Flash Eurobarometer 273 The Gallup Organisation Analytical Report Flash EB N o 251 Public attitudes and perceptions in the euro area Flash Eurobarometer European Commission The Rights of the Child Analytical
Flash Eurobarometer 429. Summary. The euro area
 LOGO CE_Vertical_EN_NEG_quadri rouge Summary Survey requested by the European Commission, Directorate-General for Economic and Financial Affairs and co-ordinated by the Directorate-General for Communication
Special Eurobarometer 469
 Summary Integration of immigrants in the European Union Survey requested by the European Commission, Directorate-General for Migration and Home Affairs and co-ordinated by the Directorate-General for Communication
ATTITUDES OF EUROPEAN CITIZENS TOWARDS THE ENVIRONMENT
 Special Eurobarometer 416 ATTITUDES OF EUROPEAN CITIZENS TOWARDS THE ENVIRONMENT SUMMARY Fieldwork: April - May 2014 Publication: September 2014 This survey has been requested by the European Commission,
EUROBAROMETER 64 FIRST RESULTS
 Standard Eurobarometer European Commission PUBLIC OPINION IN THE EUROPEAN UNION FIRST RESULTS Fieldwork : October-November 2005 Publication : December 2005 Standard Eurobarometer 64 / Autumn 2005 - TNS
International Trade. Summary. Fieldwork: August - September 2010 Publication: November Special Eurobarometer 357
 Special Eurobarometer 357 European Commission International Trade Fieldwork: August - September 2010 Publication: November 2010 Special Eurobarometer 357 / Wave 74.1 TNS Opinion & Social Summary This survey
HB010: Year of the survey
 F4: Quality of life HB010: Year of the survey Year (four digits) Flags 2018 Operation 158 F4: Quality of life HB020: Country Reference period Constant Mode of collection Frame BE Belgique/Belgïe BG Bulgaria
Special Eurobarometer 468. Report. Attitudes of European citizens towards the environment
 Attitudes of European citizens towards the environment Fieldwork September- Publication November 2017 Survey requested by the European Commission, Directorate-General for Environment and co-ordinated by
ERGP REPORT ON CORE INDICATORS FOR MONITORING THE EUROPEAN POSTAL MARKET
 ERGP (15) 27 Report on core indicators for monitoring the European postal market ERGP REPORT ON CORE INDICATORS FOR MONITORING THE EUROPEAN POSTAL MARKET 3 December 2015 CONTENTS 1. EXECUTIVE SUMMARY...
Alternative views of the role of wages: contours of a European Minimum Wage
 Alternative views of the role of wages: contours of a European Minimum Wage Europe at a crossroads which way to quality jobs and prosperity? ETUI-ETUC Conference Brussels, 24-26 September 2014 Dr. Torsten
Data Protection in the European Union. Data controllers perceptions. Analytical Report
 Gallup Flash Eurobarometer N o 189a EU communication and the citizens Flash Eurobarometer European Commission Data Protection in the European Union Data controllers perceptions Analytical Report Fieldwork:
The Rights of the Child. Analytical report
 The Gallup Organization Flash EB N o 187 2006 Innobarometer on Clusters Flash Eurobarometer European Commission The Rights of the Child Analytical report Fieldwork: February 2008 Report: April 2008 Flash
Convergence: a narrative for Europe. 12 June 2018
 Convergence: a narrative for Europe 12 June 218 1.Our economies 2 Luxembourg Ireland Denmark Sweden Netherlands Austria Finland Germany Belgium United Kingdom France Italy Spain Malta Cyprus Slovenia Portugal
Malta-Valletta: Provision of interim services for EASO 2017/S Contract award notice. Results of the procurement procedure.
 1 / 10 This notice in TED website: http://ted.europa.eu/udl?uri=ted:notice:241884-2017:text:en:html Malta-Valletta: Provision of interim services for EASO 2017/S 120-241884 Contract award notice Results
The European Emergency Number 112
 Gallup 2 Flash Eurobarometer N o 189a EU communication and the citizens Flash Eurobarometer European Commission The European Emergency Number 112 Summary Fieldwork: January 2008 Publication: February 2008
Employment and Social Policy
 Special Eurobarometer 77 European Commission Employment and Social Policy SUMMARY Special Eurobarometer 77 / Wave EB76. TNS opinion & social Fieldwork: September- October 0 Publication: November 0 This
EUROBAROMETER 69 SPRING 2008 NATIONAL REPORT UNITED KINGDOM. Standard Eurobarometer PUBLIC OPINION IN THE EUROPEAN UNION
 Standard Eurobarometer 69 / Spring 2008 TNS Opinion & Social Standard Eurobarometer European Commission EUROBAROMETER 69 PUBLIC OPINION IN THE EUROPEAN UNION SPRING 2008 NATIONAL REPORT UNITED KINGDOM
Directorate General for Communication Direction C - Relations avec les citoyens PUBLIC OPINION MONITORING UNIT 27 March 2009
 Directorate General for Communication Direction C - Relations avec les citoyens PUBLIC OPINION MONITORING UNIT 27 March 2009 EUROPEANS AND THE ECONOMIC CRISIS Standard Eurobarometer (EB 71) Population:
Malta-Valletta: Provision of interim services for EASO 2017/S Contract award notice. Results of the procurement procedure.
 1 / 8 This notice in TED website: http://ted.europa.eu/udl?uri=ted:notice:339167-2017:text:en:html Malta-Valletta: Provision of interim services for EASO 2017/S 165-339167 Contract award notice Results
EUROBAROMETER 73 FIRST RESULTS
 Standard Eurobarometer European Commission EUROBAROMETER 73 PUBLIC OPINION IN THE EUROPEAN UNION FIRST RESULTS Fieldwork: May 2010 Publication: August 2010 Standard Eurobarometer 73/ Spring 2010 - TNS
Europeans attitudes towards climate change
 Special Eurobarometer European Commission Europeans attitudes towards climate change Fieldwork: August - September 2009 Publication: November 2009 Special Eurobarometer 322 / Wave 72.1 TNS Opinion & Social
Fieldwork November - December 2009 Publication June 2010
 Special Eurobarometer 337 European Commission Geographical and labour market mobility Summary Fieldwork November - December 2009 Publication June 2010 Special Eurobarometer 337 / Wave 72.5 TNS Opinion
Young people and science. Analytical report
 Flash Eurobarometer 239 The Gallup Organization The Gallup Organization Flash EB N o 187 2006 Innobarometer on Clusters Flash Eurobarometer European Commission Young people and science Analytical report
EUROBAROMETER 68 AUTUMN 2007 NATIONAL REPORT UNITED KINGDOM. Standard Eurobarometer PUBLIC OPINION IN THE EUROPEAN UNION
 Standard Eurobarometer European Commission EUROBAROMETER 68 PUBLIC OPINION IN THE EUROPEAN UNION AUTUMN 2007 Standard Eurobarometer 68 / Autumn 2007 TNS Opinion & Social NATIONAL REPORT UNITED KINGDOM
Data Protection in the European Union. Citizens perceptions. Analytical Report
 Gallup Flash Eurobarometer N o 189a EU communication and the citizens Flash Eurobarometer European Commission Data Protection in the European Union Citizens perceptions Analytical Report Fieldwork: January
Europeans and the crisis
 EUROPEAN PARLIAMENT Europeans and the crisis Report Fieldwork: August September 2010 Publication: November 2010 Special Eurobarometer/Wave 74.1 TNS Opinion & Social Eurobaromètre spécial / Vague 74.1 TNS
What does the Tourism Demand Surveys tell about long distance travel? Linda Christensen Otto Anker Nielsen
 What does the Tourism Demand Surveys tell about long distance travel? Linda Christensen Otto Anker Nielsen Overview of the presentation 1. The Tourism Demand Survey 2. Data 3. Share of respondents travelling
Views on European Union Enlargement
 Flash Eurobarometer 257 The Gallup Organization Flash EB N o 255 Dual circulation period, Slovakia Flash Eurobarometer European Commission Views on European Union Enlargement Analytical Report Fieldwork:
The. Special Eurobarometer 368. Special Eurobarometer 368 / Wave EB 75.3 TNS opinion & social. This document. of the authors.
 Special Eurobarometer 368 European Commission The Common Agricultural Policy REPORT Special Eurobarometer 368 / Wave TNS opinion & social Fieldwork: May 2011 Publication: September 2011 This survey has
"Science, Research and Innovation Performance of the EU 2018"
 "Science, Research and Innovation Performance of the EU 2018" Innovation, Productivity, Jobs and Inequality ERAC Workshop Brussels, 4 October 2017 DG RTD, Unit A4 Key messages More robust economic growth
European patent filings
 Annual Report 07 - European patent filings European patent filings Total filings This graph shows the geographic origin of the European patent filings. This is determined by the country of residence of
Making a difference in the world: Europeans and the future of development aid
 Special Eurobarometer 375 European Commission Making a difference in the world: Europeans and the future of development aid REPORT Special Eurobarometer 375 / Wave 7.61 TNS opinion & social Fieldwork: