Special Eurobarometer 467. Report. Future of Europe. Social issues
|
|
|
- Adam Walsh
- 5 years ago
- Views:
Transcription


1 Future of Europe Social issues Fieldwork Publication November 2017 Survey requested by the European Commission, Directorate-General for Communication and co-ordinated by the Directorate- General for Communication This document does not represent the point of view of the European Commission. The interpretations and opinions contained in it are solely those of the authors. Wave EB88.1 TNS opinion & social
2 Future of Europe Social issues Survey conducted by TNS political & social at the request of the European Commission, Directorate-General for Communication Survey co-ordinated by the European Commission, Directorate-General for Communication (DG COMM Media monitoring and analysis Unit)
3 Project title Future of Europe Social issues Linguistic version EN European Union,
4 TABLE OF CONTENTS INTRODUCTION 2 KEY FINDINGS 4 I. THE EUROPEAN UNION AND SOCIAL ISSUES 5 1 The EU s main assets 5 2 The EU s main challenges 8 3 The EU vis-à-vis major global challenges: where should the emphasis lie? 16 4 European societies in 2030: solidarity vs. individualism 19 II. EUROPEANS VIEWS ON SOCIAL ISSUES 22 1 Are Europeans happy? 22 a. Satisfaction with their family life 23 b. Satisfaction with their current occupation 26 c. Satisfaction with life in their country 30 d. Satisfaction with life in the European Union 34 2 Free-market economy and social protection 39 3 Does everyone have a chance to succeed in life? 41 4 Health and social security: more or less EU decision-making? 47 5 Europeans expectations on social welfare systems 50 III. EUROPEANS AND THE FUTURE OF EUROPE 56 1 Prospects for young Europeans 56 2 What would be most helpful for the future of Europe? 68 CONCLUSION 74 ANNEXES Technical specifications 1
5 INTRODUCTION This report presents the results of the Special Eurobarometer survey on the Future of Europe, with a special focus on questions dealing with social issues. The survey was carried out between 23 September and 2 October 2017 and interviews were conducted in the 28 Member States of the European Union (EU). The full report, of which the present report is an extract, is the seventh in the Future of Europe series, and follows from previous surveys in , , , , and This survey was conducted after that the European Commission released a White paper on the Future of Europe 7, setting out challenges and opportunities for Europe in the coming decade. On 26 April 2017, the European Commission published a reflection paper on the social dimension of Europe 8, which represents a contribution to the debate on how to sustain the Europeans standards of living, and how to address major issues in the social and employment fields. The reflection paper followed a public consultation on the European Pillar of Social Rights, culminating in a concluding conference in January The joint proclamation of the European Pillar of Social Rights 9 by the European Parliament, the Council and the European Commission on 17 November 2017, at the occasion of first Social Summit in 20 years 10 (initiated by President of the European Commission Jean-Claude Juncker and Sweden s Prime Minister Stefan Löfven), represents a new milestone. The first chapter of this report considers citizens views of the EU, with particular attention paid to the place of social issues in the European Union. This includes respondents opinions about the EU s main assets. Citizens views of the main challenges facing the EU are also considered as well as their preferences for European society in The second chapter focusses on Europeans views on social issues, and in particular, views about social protection and citizens opportunities to succeed in life. Citizens levels of satisfaction with various facets of their life will be considered, as will their expectations on the harmonisation of social welfare systems within the EU and on European decision-making in the area of health and social security. In the final chapter, the focus shifts to Europe s future, particularly in relation to the prospects for young people in the Europe of the future and the factors that would be most helpful for Europe s future. 1 Special Eurobarometer 251: 2 Standard Eurobarometer 71 Spring 2009 Future of Europe report: 3 Special Eurobarometer 379: 4 Special Eurobarometer 394: 5 Special Eurobarometer 413: 6 Special Eurobarometer 451:
6 The methodology used is that of the Standard Eurobarometer surveys carried out by the Directorate-General for Communication ( Media monitoring and analysis Unit) 11. It is the same for all countries and territories covered in the survey. A technical note concerning the interviews conducted by the member institutes of the TNS Opinion & Social network is annexed to this report. It also specifies the confidence intervals 12. Note: In this report, countries are referred to by their official abbreviation. The abbreviations used in this report correspond to: Belgium BE Lithuania LT Bulgaria BG Luxembourg LU Czech Republic CZ Hungary HU Denmark DK Malta MT Germany DE The Netherlands NL Estonia EE Austria AT Ireland IE Poland PL Greece EL Portugal PT Spain ES Romania RO France FR Slovenia SI Croatia HR Slovakia SK Italy IT Finland FI Republic of Cyprus CY * Sweden SE Latvia LV United Kingdom UK European Union weighted average for the 28 EU Member States EU28 * Cyprus as a whole is one of the 28 European Union Member States. However, the acquis communautaire has been suspended in the part of the country which is not controlled by the government of the Republic of Cyprus. For practical reasons, only the interviews carried out in the part of the country controlled by the government of the Republic of Cyprus are included in the CY category and in the EU28 average. We wish to thank the people throughout the European Union who have given their time to take part in this survey. Without their active participation, this study would not have been possible The results tables are annexed. It should be noted that the total of the percentages indicated in the tables in this report may exceed 100% when the respondent was able to choose several answers to the same question. 3
7 KEY FINDINGS The European Union and social issues More than one fifth of the respondents mention the standard of living of EU citizens (22%) as one of the EU s main assets. At least one quarter consider the EU's respect for democracy, human rights and the rule of law (31%), the economic, industrial and trading power of the EU (30%) and the good relationship between the EU's Member States (25%) as the EU s main assets. Respondents consider the main challenges facing the EU to be unemployment (39%) and social inequalities (36%). Respondents are less likely to mention unemployment than they were in 2016 (-6 percentage points). To face major global challenges, 45% think social equality and solidarity should be emphasised. 35% say protecting the environment, 30% mention progress and innovation and 23% say free trade/market economy should be emphasised. Respondents prefer a Europe in 2030 where more importance is placed on solidarity (62%) than individualism (13%), while 18% prefer that both have equal importance. Europeans views on social issues More than nine in ten respondents (91%) agree they are happy with their family life and 64% are happy with their current occupation. Large majorities also agree they are happy living in the country they currently live in (89%) or in the EU (78%). A large majority of respondents agree the free-market economy should go with a high level of social protection (83%), with more than one third totally agreeing (38%). Just over half of all respondents agree that in their country everyone has a chance to succeed in life (51%), an increase of five percentage points since The majority (60%) support more European-level decision-making in dealing with health and social security issues. Around one third (32%) think the opposite. More than six in ten respondents (64%) are in favour of the harmonisation of social welfare systems within the European Union, with 19% saying they are strongly in favour. The future of Europe Two thirds of respondents agree the European Union project offers a future perspective for Europe s youth (66%), an increase of six percentage points since A majority of respondents think the life of today s children in the EU will be more difficult than the life of those from their own generation (54%). The majority think comparable living standards would be most helpful for the future of Europe (52%), and more than one third mention comparable education standards (35%). 4
8 I. THE EUROPEAN UNION AND SOCIAL ISSUES This chapter considers the opinions of and perceptions about the EU, including its assets, values and challenges. Views about the EU as a place of stability in the world and perceptions about globalisation are also discussed. 1 The EU s main assets - Around one fifth consider the standard of living of EU citizens as one of the EU s main assets - Respondents were asked what they thought were the main assets of the EU. They were able to give two answers 13. The chart below shows the overall results for all answers (first and second mentioned assets). Around one fifth of the respondents (22%) mention the standard of living of EU citizens as one of the EU s main assets. This answer is less frequently-mentioned than the EU's respect for democracy, human rights and the rule of law (31%) or the economic, industrial and trading power of the EU (30%). One quarter say also the good relationship between the EU's Member States (25%) is one of the main assets of the EU. Nonetheless, the standard of living of EU citizens is still more frequently-mentioned than the EU's ability to promote peace and democracy outside its borders (17%), the EU's capacity for research and innovation and the quality of infrastructure in the EU (both 12%), and the skills and talents of EU citizens and the EU's commitment to environmental responsibility (both 11%). The results for all the assets tested have generally remained stable, with no change at all taking place for the proportion mentioning the standard of living of EU citizens. 13 QC1T In your opinion, what are the main assets of the EU? Firstly? And secondly? (MAX. 2 ANSWERS) 5
, Croatia and Lithuania (both 43%), Poland (36%),")
9 Respondents living in EU Member States outside the euro area are more likely to mention the standard of living of EU citizens as a main asset, compared to those in the euro area (28% vs. 19%). Across the EU as a whole, there are seven Member States where respondents are most likely to say the standard of living of EU citizens: Latvia (46%), Croatia and Lithuania (both 43%), Poland (36%), Romania (34%), Belgium (32%) and Ireland (31%). In Bulgaria, respondents are most likely to mention both the standard of living of EU citizens and the good relationship between the EU s Member States (36%). In Malta, the standard of living of EU citizens and the EU s respect for democracy, human rights and the rule of law are both the most mentioned assets by the respondents (34%). (MAX. 2 ANSWERS) 6
, Estonia (27%), Austria, the Czech Republic and Slovakia (all 29%), Estonia and Luxembourg (both 27%) and Hungary (25%).")
10 Apart from the seven countries in which respondents are the most likely to mention this asset, the standard of living of EU citizens is mentioned by at least one quarter of respondents in Slovenia (33%), Estonia (27%), Austria, the Czech Republic and Slovakia (all 29%), Estonia and Luxembourg (both 27%) and Hungary (25%). Respondents in Sweden (8%), Italy (13%) and Greece (15%) are the least likely to mention this. 7
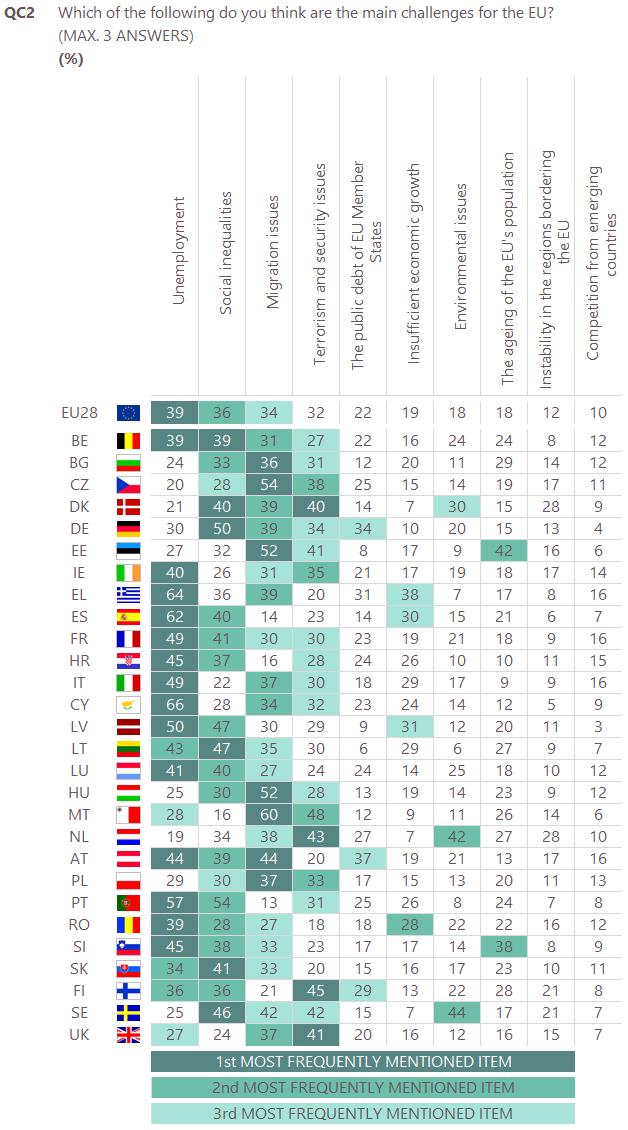
11 2 The EU s main challenges - Respondents consider unemployment the main challenge faced by the EU - Respondents were asked to identify up to three main challenges currently faced by the EU 14. As it was the case in 2016, unemployment is most likely to be regarded as the main challenge (39%), although respondents are now less likely to mention it (-6 percentage points). More than one third consider social inequalities (36%) and migration issues (34%) to be the main challenges for the EU, while just over three in ten (32%) mention terrorism and security issues. Just over one in five say the public debt of EU Member States is one of the EU s main challenges (22%), while 19% mention insufficient economic growth and 18% mention environmental issues or the ageing of the EU s population. At least one in ten respondents say instability in the regions bordering the EU (12%), or competition from emerging countries (10%) are the main challenges currently faced by the EU. As well as a decline in the mentions of unemployment, respondents are also less likely to mention the public debt of EU Member States than they were in 2016 (-4 percentage points). However, they are more likely to mention environmental issues (+5). 14 QC2 Which of the following do you think are the main challenges for the EU? (MAX. 3 ANSWERS) 8
.")
12 There are several notable differences between euro and non-euro area countries. Respondents in the euro area are much more likely to say unemployment is one of the EU s main challenges, compared to those outside the euro area (44% vs. 28%). Those within the euro area are also more likely to say social inequalities (39% vs. 29%) In 12 EU Member States, respondents are most likely to say unemployment is one of the main challenges for the EU. In four countries, respondents are most likely to mention social inequalities. 9
13 Respondents in Cyprus (66%), Greece (64%) and Spain (62%) are most likely to say unemployment is one of the main challenges for the EU, compared to 19% in the Netherlands, 20% in the Czech Republic and 21% in Denmark. In 25 EU Member States, respondents are now less likely to consider unemployment as one of the EU s main challenges than they were in 2016, with a decrease of at least ten points in 12 countries, and the largest declines observed amongst those in Poland (29%, -17 percentage points), Finland (36%, -16) and Slovakia (34%, -15). Respondents in Belgium and Romania, on the other hand, are now more likely to mention this. There is no change in Malta. Social inequalities are most widely considered a challenge by respondents in Portugal (54%), Germany (50%), Latvia and Lithuania (both 47%), and least likely to be mentioned by those in Malta (16%), Italy (22%) and the United Kingdom (24%). In 14 countries, respondents are less likely to mention social inequalities, especially in Spain (40%, -11 percentage points), while those in eight countries are now more likely to do so. There is no change in six countries. 10
14 11
15 12
.")
16 The socio-demographic analysis shows no notable differences based on gender, age or occupation, but does highlight the following: The longer respondents remained in education, the more likely they are to mention social inequalities (39% who completed education aged 20 and over, compared to 32% of those who completed education prior to age 16). The opposite pattern can be observed for those who mention unemployment as one of the main challenges of the EU (47% of those who completed their education aged 15 and before, compared to 34% who completed education aged 20 and over); The more financial difficulties respondents experience, the more likely they are to mention unemployment (51% of those who have trouble paying their bills most of the time, compared to 35% with the least financial difficulties); Respondents who consider themselves working class are the most likely to mention unemployment, particularly compared to those who classify themselves as upper class (45% vs. 21%). 13

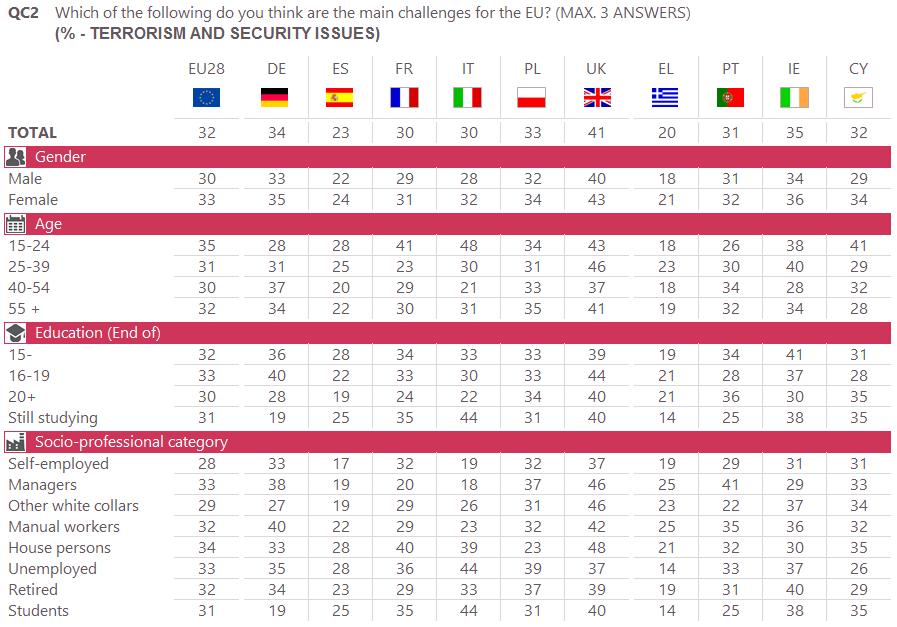
17 The following tables show the average results by socio-demographic criteria in the European Union as a whole (EU28), in the six largest EU countries and in the countries that receive or have received European aid to help them cope with the economic and financial crisis. 14
18 15
19 3 The EU vis-à-vis major global challenges: where should the emphasis lie? - Social equality and solidarity should be emphasised to face major global challenges - Respondents were asked to identify up to two areas they thought should be emphasised by society in order to face major global challenges 15. More than two in five (45%) mention social equality and solidarity. Just over one third (35%) say protecting the environment should be emphasised, while 30% mention progress and innovation and 23% say it should be free trade/market economy. Almost one in five mention cultural diversity and openness to others (19%). Respondents are least likely to say traditions should be emphasised by society in order to face major global challenges (13%). Compared to the last survey in 2016, respondents are now more likely to mention protecting the environment (+4 percentage points) and progress and innovation (+2), but they are less likely to mention cultural diversity and openness to others (-4) or free trade/market economy (-3), and also slightly less likely to cite social equality and solidarity (-1) and traditions (-1). 15 QC3 From the following items, which two should our society emphasise in order to face major global challenges? (MAX. 2 ANSWERS) 16

20 The longer-term trends show the proportion who mention free trade/market economy continues to decline, and is now at its lowest point, while the proportion mentioning social equality and solidarity has returned to the levels of In 20 EU Member States, respondents are most likely to say social equality and solidarity should be emphasised in order to face global challenges. In the Netherlands and the Czech Republic social equality and solidarity and protecting the environment are equally mentioned. 17
21 In ten countries, more than half of all respondents think social equality and solidarity should be emphasised in order to face major global challenges. Respondents in Portugal (65%), Germany (57%) and Spain and France (both 55%) are the most likely to say it, while those in Italy (27%), Romania (30%) and Poland and Hungary (both 33%) are the least likely to do so. As with evolutions at country-level, there has been a decline since 2016 in the proportion who say social equality and solidarity should be emphasised in order to meet global challenges in 19 countries, with the largest decreases observed amongst respondents in Cyprus (49%, -11 percentage points), Bulgaria (39%, -8), Spain (55%, -7) and Italy (27%, -7). Increases are observed in seven EU Member States, with the largest one in the United Kingdom (37%, +4). No change in France and the Netherlands. 18

22 4 European societies in 2030: solidarity vs. individualism - Respondents prefer Europe in 2030 to place more importance on solidarity than individualism Respondents were asked whether they would prefer a European society in 2030 where more importance is given to solidarity or to individualism 16. More than six in ten (62%, +1 percentage point since 2012) prefer more importance be given to solidarity, while 13% (no change) prefer individualism. Almost one in five (18%, +1) spontaneously prefer a society where both have equal importance. Respondents in the euro area are more likely to prefer solidarity compared to those living outside the euro area (65% vs. 57%), and they are also more likely to spontaneously prefer equal importance is given to both (21% vs. 11%). Respondents living outside the euro area are, however, more likely to prefer individualism (22% vs. 8%). 16 QC12 Let's now talk about your hopes for the future. In 2030, in the European Union, would you prefer a society where more importance is given to solidarity, or to individualism? 19
, France (86%) and Spain and Greece (both 85%) are the most likely to say this, compared to 40% in Germany, 43% in Bulgaria and 47% in Estonia.")
23 In all EU Member States but Germany, respondents are most likely to prefer a society in 2030 where more importance is placed on solidarity. Those living in Cyprus (92%), France (86%) and Spain and Greece (both 85%) are the most likely to say this, compared to 40% in Germany, 43% in Bulgaria and 47% in Estonia. Respondents in the United Kingdom and Ireland (both 29%) are the most likely to prefer more importance is given to individualism, while respondents are the most likely to prefer both have equal importance in Germany (46%, in first position before solidarity) and Bulgaria (36%). Compared to 2012, respondents in 16 EU Member States are now more likely to prefer a society with more importance placed on solidarity, with the highest increases in Austria (50%, +25 percentage points), Portugal (81%, +23), Hungary (56%, +18), Latvia (65%, +16) and Bulgaria (43%, 15). In 11 countries, respondents are now less likely to say this, most notably in Estonia (47%, -19). No change in Belgium. In 14 countries, respondents are now more likely to prefer the importance is placed on individualism, especially in Romania (20%, +11 percentage points), the Czech Republic (24%, +11) and Croatia (18%, +9). They are less likely to do so in 12 countries, most notably in Italy (10%, -8). No variation in Spain and Latvia. In 16 EU Member States, respondents are now less likely to prefer a society in 2030 where both solidarity and individualism have equal importance, with the strongest decreases in Austria (23%, -26 percentage points), Latvia (12%, -16), Slovenia (9%, -12) and Bulgaria (36%, -12). In nine Member States of the EU, respondents are now more likely to say this, most notably in Estonia (29%, +16) and Luxembourg (16%, +10). No change in Spain, Sweden and Cyprus. 20
24 21
25 II. EUROPEANS VIEWS ON SOCIAL ISSUES This second chapter of the report focusses Europeans views on social and societal issues. Levels of satisfaction with various facets of their life will be considered, as will the views respondents have about the rise of anti-establishment parties in Europe. Respondents opinions about social protection, citizen s opportunities to succeed in life, the involvement of the EU in health and social security issues and their expectations on the harmonisation of social welfare systems within the EU will also be discussed. 1 Are Europeans happy? - The majority of respondents are happy with their family life, occupation, life in the country they live in and life in the EU - Respondents were asked whether they were happy with their family life, their current occupation, living in the country they live in and living in the EU 17. More than nine in ten (91%) agree they are happy with their family life and 64% are happy with their current occupation. Large majorities also agree they are happy living in their country (89%) or happy living in the EU (78%). The trend results show relatively small changes. Compared to , respondents are now more likely to agree they are happy with their current occupation (+4 percentage points), and slightly more likely to agree they are happy with their family life (+1). Compared to 2012, respondents are slightly more likely to agree they are happy living in their country (+3) or happy living in the EU (+2). Respondents living in the euro area are more likely to agree they are happy living in the EU compared to those who live outside the euro area (81% vs. 72%). Each of these four statements will be considered in turn in the following sections. 17 QC15 Please tell me to what extent you agree or disagree with each of the following statements. You are happy with your family life; You are happy with your current occupation; You are happy living in (OUR COUNTRY); You are happy living in the EU. 18 Results from 2006 cover EU25 (excl. Croatia, Romania and Bulgaria). 22
26 a. Satisfaction with their family life More than seven in ten respondents in each EU Member State agree they are happy with their family life. Proportions range from 99% in Denmark and 97% in Ireland and Malta to 74% in Bulgaria, 79% in Lithuania and 81% in Slovakia. 23
27 In most countries, results have remained relatively stable since 2006, but there are some exceptions. For example, respondents in Austria (93%, +9 percentage points) and Latvia (87%, +9) are now more likely to agree they are happy with their family life, while those in Greece (86%, -6) are now less likely to do so. QC15.1 Please tell me to what extent you agree or disagree with each of the following statements. You are happy with your family life (%) Total 'Agree' Sept.-Oct Feb.-Mar.2006 Total 'Disagree' Sept.-Oct Feb.-Mar.2006 Not applicable (SPONTANEOUS) Sept.-Oct Feb.-Mar.2006 Don't know EU28* AT LV = 1 HU DE PL PT = 0 EE MT = 0 SI IE = 0 DK = 0 NL = 1 UK = 1 FI = CY 94 = 6 = 0 = 0 LU 94 = 4 = 1 = 1 IT 90 = = 1 SK 81 = = 1 ES = 0 BE = 0 FR = 2 LT SE = 0 CZ = 0 EL *This question was not asked in Bulgaria, Croatia and Romania in
 and other white-collar workers (95%) are the most likely to agree, particularly compared")
28 The socio-demographic analysis illustrates the following: The longer respondents remained in education, the more likely they are to agree they are happy with their family life: 94% who completed education aged 20 and after agree, compared to 87% who completed education aged 15 or before; Managers (96%) and other white-collar workers (95%) are the most likely to agree, particularly compared to the unemployed (83%); The fewer financial difficulties the respondents experience, the more likely they are to agree: 95% who experience the least difficulties paying bills do so, compared to 77% who experience the most. 25
 and Austria (79%) the most likely to say this. The exceptions are respondents in Greece (37%) and Bulgaria, France and Cyprus (all 49%).")
29 b. Satisfaction with their current occupation In all but four countries, at least half of all respondents agree they are happy with their current occupation, with respondents in Ireland (84%), Denmark (81%) and Austria (79%) the most likely to say this. The exceptions are respondents in Greece (37%) and Bulgaria, France and Cyprus (all 49%). However, in these four Member States of the EU, respondents feeling happy with their current occupation also form a majority. Respondents in Greece (26%), Romania (24%) and Italy (23%) are the most likely to disagree. 26
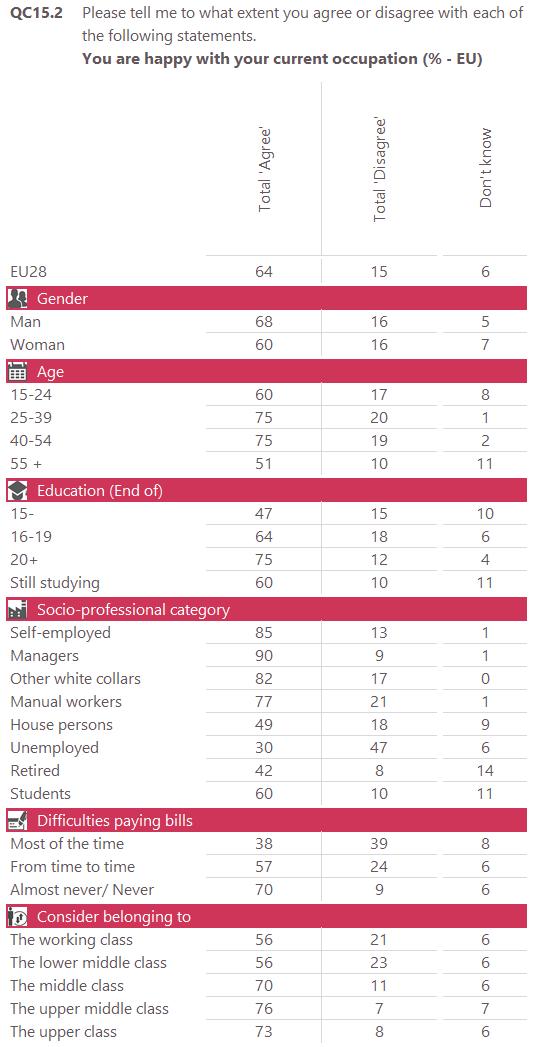
30 Compared to 2006, respondents in Poland (64%, +24 percentage points), Hungary (66%, +22) and Malta (54%, +15) are now much more likely to agree they are happy with their current occupation. Overall, respondents in 19 EU Member States are now more likely to agree. In contrast, respondents in five countries are now less likely to agree they are happy with their current occupation, with the highest decreases in Spain (72%, -13), in Italy (54%, -10) and in Greece (37%, -7). No change in Cyprus. QC15.2 Please tell me to what extent you agree or disagree with each of the following statements. You are happy with your current occupation (%) Total 'Agree' Sept.-Oct Feb.-Mar.2006 Total 'Disagree' Sept.-Oct Feb.-Mar.2006 Not applicable (SPONTANEOUS) Sept.-Oct Feb.-Mar.2006 Don't know EU28* PL = HU MT UK DE SI IE FI SE AT BE SK LV PT EE LT CZ DK LU = CY 49 = NL = FR EL IT ES *This question was not asked in Bulgaria, Croatia and Romania in
31 The socio-demographic analysis illustrates the following: Men are more likely to agree they are happy with their current occupation (68% vs. 60% of women); Respondents aged are the most likely to agree (75%); The longer respondents remained in education, the more likely they are to agree: 75% who completed education aged 20 and after agree, compared to 47% who completed education aged 15 or before; The fewer financial difficulties respondents experience, the more likely they are to agree: 70% who experience the least difficulties do so, compared to 38% who experience the most; Respondents who position themselves in the middle (70%), upper middle (76%) or upper classes (73%) are more likely to agree (compared to 56% in both the working class and the lower middle class). 28
32 29

33 c. Satisfaction with life in their country More than six in ten respondents in each EU Member State agree they are happy living in their country. Proportions range from 99% in Denmark, 98% in Ireland and 97% in both the Netherlands and Sweden to 62% in Hungary, 66% in Bulgaria and 67% in Romania. 30
34 Compared to 2012, respondents in 19 Member States of the EU are now much more likely to agree they are happy living in their country, and notably in Portugal (94%, +28 percentage points), Hungary (62%, +26), Estonia (92%, +14) and Ireland (98%, +12). In only five countries respondents are now less likely to agree, the largest decline in agreement being observed amongst respondents in Croatia (82%, -7). Opinion is unchanged in France, Germany, Belgium and Luxembourg. 31
35 The socio-demographic analysis highlights the following: Respondents aged 55 and over are the most likely to say they are happy living in their country, particularly compared to those aged (91% vs. 86%); Managers are the most likely to agree, particularly compared to the unemployed (93% vs. 82%); The fewer financial difficulties respondents experience, the more likely they are to agree: 93% who experience the least difficulties do so, compared to 76% who experience the most. 32
, in the six largest")

36 The following tables show the average results by socio-demographic criteria in the European Union as a whole (EU28), in the six largest EU countries and in the countries that receive or have received European aid to help them cope with the economic and financial crisis. 33
, Ireland (94%) and the Netherlands and Denmark (both 92%) are the most likely to agree, while those in Hungary (57%), the Czech Republic (58%) and Romania and Greece")
37 d. Satisfaction with life in the European Union More than half of the respondents in each EU Member State say they are happy living in the European Union. Respondents in Luxembourg (97%), Ireland (94%) and the Netherlands and Denmark (both 92%) are the most likely to agree, while those in Hungary (57%), the Czech Republic (58%) and Romania and Greece (both 62%) are the least likely to do so. 34
38 In 20 countries, respondents are now more likely to agree they are happy living in the EU than they were in 2012, with the largest increases observed amongst respondents in Portugal (83%, +31 percentage points), Hungary (57%, +26) and Cyprus (75%, +21). In contrast, respondents in five EU Member States are now less likely to agree, most notably in Slovakia (78%, -7). Opinion is stable in Sweden and Bulgaria. QC15.4 Please tell me to what extent you agree or disagree with each of the following statements. You are happy living in the EU (%) Total 'Agree' Sept.-Oct Nov.-Dec Total 'Disagree' Sept.-Oct Nov.-Dec Not applicable (SPONTANEOUS) Sept.-Oct Nov.-Dec Don't know EU28* PT = 3 HU = 8 CY LV = 4 IE EL LT SI FI EE = 4 AT RO CZ DK BE DE ES NL LU = 1 FR = 5 SE 90 = BG 65 = PL MT UK IT SK = *This question was not asked in Croatia in
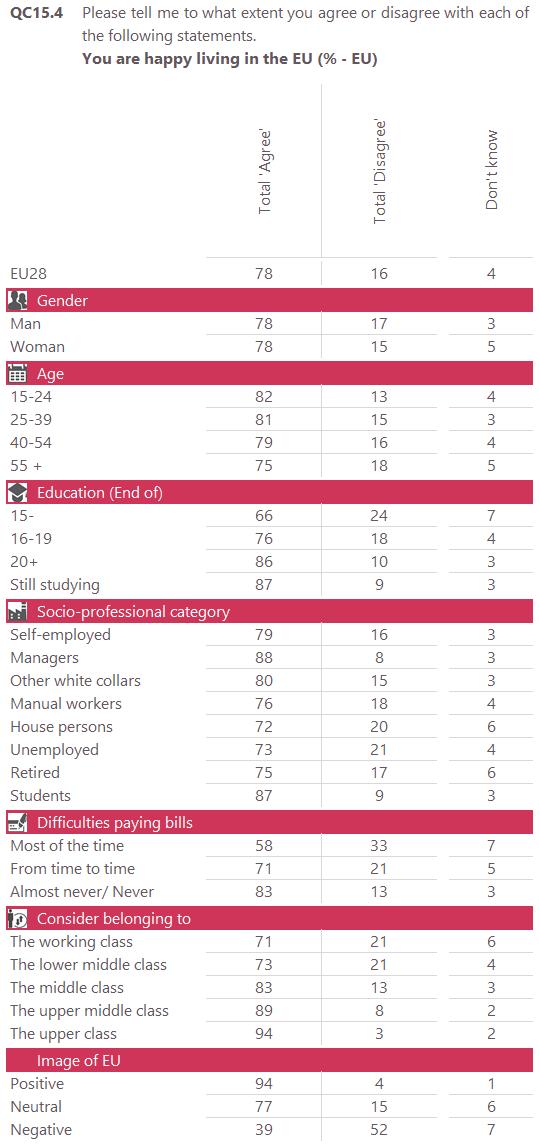
39 The socio-demographic analysis illustrates the following: Respondents aged are the most likely to agree they are happy living in the EU, particularly compared to those aged 55 and over (82% vs. 75%); The longer respondents remained in education, the more likely they are to agree: 86% who completed education aged 20 and after agree, compared to 66% who completed education aged 15 or before; The fewer financial difficulties respondents experience, the more likely they are to agree: 83% who experience the least difficulties do so, compared to 58% who experience the most; The higher respondents place themselves on the class scale, the more likely they are to agree: 94% who classify themselves as upper class do so, compared to 71% who say they are working class; Respondents who have a positive image of the EU are much more likely to agree they are happy living in the EU (94%), compared to those with a neutral (77%) or negative image (39%). 36
40 37
, in the six largest")

41 The following tables show the average results by socio-demographic criteria in the European Union as a whole (EU28), in the six largest EU countries and in the countries that receive or have received European aid to help them cope with the economic and financial crisis. 38
42 2 Free-market economy and social protection - Most think a high level of social protection should go with a free-market economy - A large majority of respondents agree the free-market economy should go with a high level of social protection (83%, +1 percentage point since 2016) 19. In fact, more than one third totally agree (38%, +1). Fewer than one in ten disagree (8%, -2). 19 QC8.2 To what extent do you agree or disagree with each of the following statements? Free-market economy should go with a high level of social protection. 39

43 A large majority of respondents in each EU Member State agree the free-market economy should go with a high level of social protection. Proportions range from 94% in Greece and 93% in both Cyprus and Germany to 74% in both Finland and the United Kingdom and 76% in Italy. At least half of all respondents in Greece and Germany (both 56%), Cyprus (55%), Bulgaria (54%) and Hungary (50%) totally agree. Compared to 2016, there have generally been small or no changes in opinion at a country level, although there are some exceptions. Respondents in 14 Member States of the EU are now more likely to agree, especially in Cyprus (93%, +7 percentage points), Poland (90%, +6) and Romania (85%, +6). They are less likely to do so in six countries, most notably in Malta (81%, -7). No variation in eight EU Member States. 40
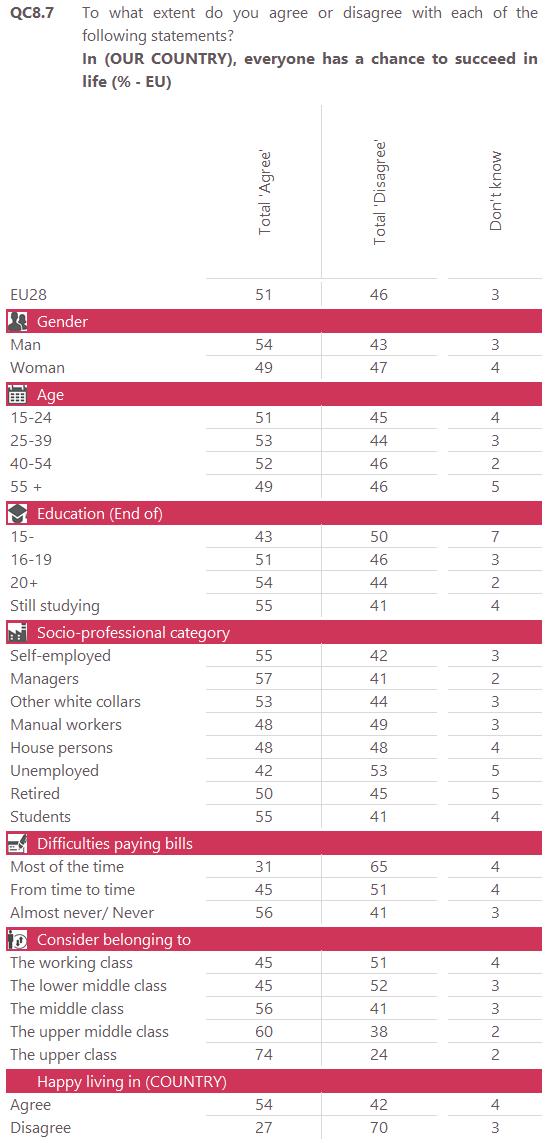
44 3 Does everyone have a chance to succeed in life? - A slight majority thinks everyone in their country has a chance to succeed in life - Just over half of all respondents agree that in their country everyone has a chance to succeed in life (51%), with 16% saying they totally agree 20. More than four in ten (46%) disagree with this statement, and 18% totally disagree. Compared to 2016, agreement has increased by five percentage points, while the proportion who disagrees has decreased by five points. Respondents living outside the euro area are more likely to agree that in their country everyone has a chance to succeed in life, compared to those living within the euro area (58% vs. 48%). 20 QC8.7 To what extent do you agree or disagree with each of the following statements? In (OUR COUNTRY), everyone has a chance to succeed in life. 41

, Austria and Luxembourg (both 69%).")
45 Opinion about whether everyone in their country has a chance to succeed in life varies widely across the EU. In 18 EU Member States, majorities of respondents agree, most likely in Malta (73%), Ireland (71%), Austria and Luxembourg (both 69%). In ten countries, majorities disagree, most notably in Portugal and Spain (both 68%) and Bulgaria (66%). 42
46 In 19 EU Member States, proportions of respondents who agree everyone in their country has a chance to succeed in life have increased, with the highest increases in Poland (65%, +23 percentage points), Romania (48%, +13), Cyprus (51%, +12) and Austria (69%, +10). The reverse is true for the majority of respondents in six countries, especially those in Sweden (67%, -6). No change in Belgium, Germany and Portugal. 43
47 The socio-demographic analysis shows that: Men are slightly more likely to agree than women (54% vs. 49%); Respondents who completed their education aged 16 or after (51%-54%) are more likely to agree than those who completed their education at 15 or before (43%); Managers are the most likely to agree, particularly compared to the unemployed (57% vs. 42%); The fewer financial difficulties respondents experience, the more likely they are to agree: 56% who experience the least difficulties do so, compared to 31% of those who experience the most difficulties; Respondents who place themselves higher up the social scale are more likely to agree. For example, 74% in the upper class do so, compared to 45% of those who identify as working class or lower middle class; Respondents who are happy living in their country are more likely to agree, compared to those who are not happy (54% vs. 27%). 44
48 45
49 The following tables show the average results by socio-demographic criteria in the European Union as a whole (EU28), in the six largest EU countries and in the countries that receive or have received European aid to help them cope with the economic and financial crisis. 46

50 4 Health and social security: more or less EU decision-making? - The majority supports more European level decision-making in dealing with health and social security issues - Respondents were asked if more or less decision-making should take place at a European level across a range of areas 21. Six in ten respondents (60%) say more decision-making should take place at a European level in dealing with health and social security issues, while around one third (32%) think that less EU decision-making should take place in this area. An equal proportion (4%) spontaneously say that no change is needed or that they don t know. There have generally only been small changes in opinion since When it comes to dealing with health and social security issues, respondents are less likely to be in favour of more European level decision-making (-4 percentage points) and slightly more likely to say the opposite (+2). Respondents living in the euro area are more likely than their non-euro area counterparts to think there should be more European level decision-making in each of the domains tested. In the case of health and social security issues, respondents in the euro area are slightly more likely to think this way compared with those in the non-euro area (61% vs. 57%). 21 QC7 For each of the following areas, please tell me if you believe that more decision-making should take place at a European level or on the contrary that less decision-making should take place at a European level; Fighting terrorism; Dealing with health and social security issues; Promoting equal treatment of men and women; Promoting democracy and peace; Securing energy supply; Dealing with migration issues from outside the EU; Protecting the environment; Stimulating investment and job creation. 47
. In two countries, a majority think there should be less European level decision-making in this area: Finland (59% vs.")
51 A majority think there should be more decision-making at a European level in dealing with health and social security issues in 25 Member States of the EU, with the highest proportions in Cyprus (83%) and Belgium and Portugal (both 76%). In two countries, a majority think there should be less European level decision-making in this area: Finland (59% vs. 33% for more European level decision-making) and Sweden (52% vs. 38%). Opinion is divided in Denmark (42% vs. 42%). In 25 countries, respondents are less likely to be in favour of more European level decision-making in dealing with health and social security issues, with the largest declines observed amongst those in Portugal (76%, -14 percentage points), Luxembourg (66%, -13), Malta (69%, -11), Spain (73%, -11) and Estonia (53%, -11). Respondents are slightly more likely to think so in Bulgaria and Greece. There is no variation in Belgium. 48

52 The socio-demographic analysis illustrates no notable differences based on gender or education. It does show: Those aged are the most likely to think there should be more decision-making at a European level in dealing with health and social security issues (66% vs. 58% of those aged 55 and over); Students and the unemployed are more likely than managers to think there should be more European level decision-making in this area (63-65% vs. 56%); Finally, respondents with a positive image of the EU are more likely to think there should be more European level decision-making in this area, compared to those with a negative image (69% vs. 39%). 49
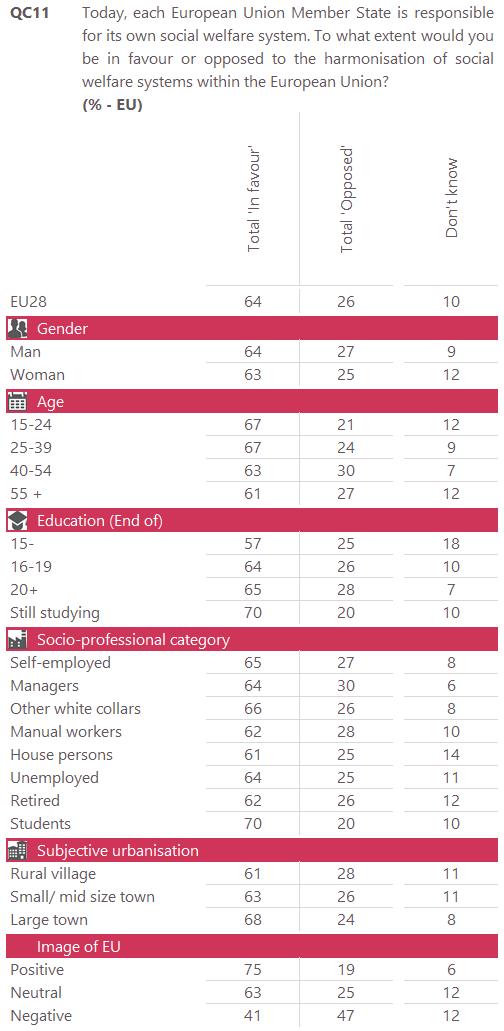
53 5 Europeans expectations on social welfare systems - Almost two thirds are in favour of harmonising social welfare systems within the EU More than six in ten respondents (64%) are in favour of the harmonisation of social welfare systems within the European Union, with 19% saying they are strongly in favour of this idea 22. Just over one quarter (26%) are opposed, 9% strongly opposed. Changes in opinion since 2006 are small, with a two-point increase in the proportion who are in favour, and a two-point decline in the proportion that are opposed QC11 Today, each European Union Member State is responsible for its own social welfare system. To what extent would you be in favour or opposed to the harmonisation of social welfare systems within the European Union? 23 Results from 2006 cover only EU25 countries and do not include Bulgaria, Croatia and Romania. 50
54 Opinion varies quite widely across EU Member States, although in all countries majorities of respondents are in favour of the harmonisation of social welfare systems within the EU. More than eight in ten respondents in Croatia (88%), Hungary (86%), Cyprus and Bulgaria (both 83%) and Latvia (81%) are in favour of harmonising social welfare systems, compared to 47% in the United Kingdom, 48% in Denmark and 53% in Germany. 51
55 Across the EU as a whole, there has only been a slight change in the proportion that is in favour of harmonising social welfare systems across the EU since However, at a country level there have been larger changes. In 14 Member States of the EU, respondents are now more likely to be in favour of harmonisation, most notably in Luxembourg (70%, +19 percentage points), Spain (76%, +14) and Slovenia (80%, +12). In 11 countries, respondents are less likely to be so, with the highest decreases in Poland (74%, -12) and the Czech Republic (61%, -11). QC11 Today, each European Union Member State is responsible for its own social welfare system. To what extent would you be in favour or opposed to the harmonisation of social welfare systems within the European Union? (%) Total 'In favour' Sept.-Oct Feb.-Mar.2006 Total 'Opposed' Sept.-Oct Feb.-Mar.2006 Don't know EU28* LU ES SI IE = 7 CY AT PT FI HU LT IT MT BE = 1 DE LV FR UK EL EE NL SK DK SE CZ PL *This question was not asked in Bulgaria, Croatia and Romania in
56 The socio-demographic analysis shows the following: Respondents aged are the most likely to be in favour of harmonised social welfare systems (67% vs. 61% of those aged 55 and over); Respondents who completed their education aged 16 or after are the most likely to be in favour (64%-65% vs. 57% of those who finished aged 15 or before); Students are the most likely to be in favour, particularly compared to house persons (70% vs. 61%); Those living in large towns are the most likely to be in favour (68% vs. 61% of those living in rural villages); In addition, respondents with a positive image of the EU (75%) are much more likely to be in favour than those with a neutral (63%) or negative (41%) view. 53
57 54

58 The following table shows the average results by socio-demographic criteria in the European Union as a whole (EU28), in the six largest EU countries and in the countries that receive or have received European aid to help them cope with the economic and financial crisis. 55
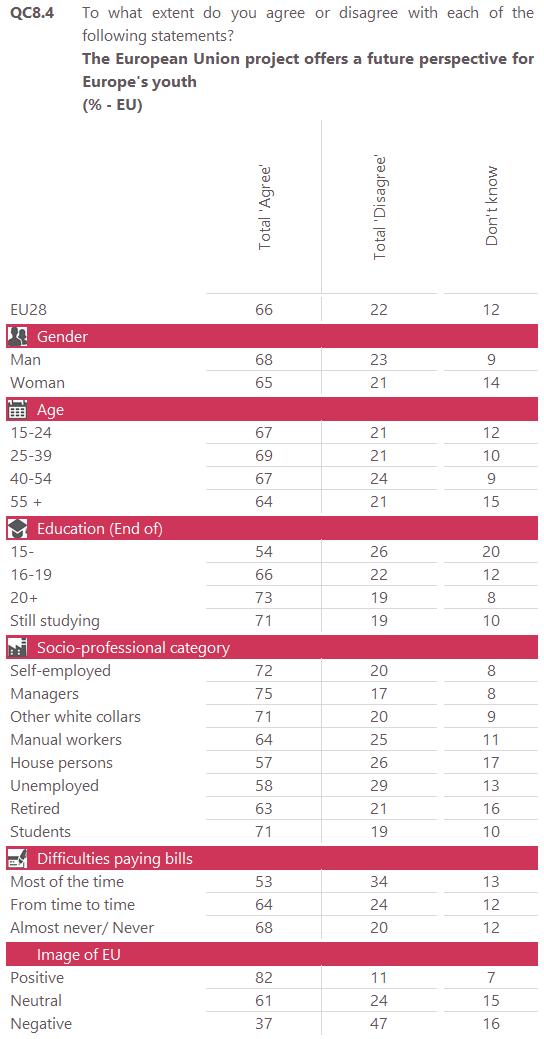
59 III. EUROPEANS AND THE FUTURE OF EUROPE The final chapter of this report focuses on Europe s future. A range of topics are covered, including the prospects for young people in the Europe of the future, and the factors that would be most helpful for Europe s future. Preferences for European society in 2030 are also considered. 1 Prospects for young Europeans - Two-thirds of respondents agree the EU project offers a future perspective for Europe s youth - A large majority of respondents agree the European Union project offers a future perspective for Europe s youth (66%), with 21% saying they totally agree 24. Just over one in five disagree (22%), with 6% saying they totally disagree. Respondents are more likely to agree the European Union project offers a future perspective for Europe s youth than they were in 2016 (+6 percentage points), and even less likely to disagree (-9). 24 QC8.4 To what extent do you agree or disagree with each of the following statements? The European Union project offers a future perspective for Europe s youth. 56
, Lithuania (83%) and Poland, Latvia and Estonia (80%) are the most likely to agree, compared to 52% in Spain, 53% in the United")
60 More than half the respondents in each country agree the European Union project offers a future perspective for Europe s youth. Respondents in Malta (86%), Lithuania (83%) and Poland, Latvia and Estonia (80%) are the most likely to agree, compared to 52% in Spain, 53% in the United Kingdom and 57% in Portugal. 57
61 In 20 EU Member States, respondents are now more likely to agree than they were in 2016, and this is particularly the case for respondents in Cyprus (74%, +16 percentage points), Poland (80%, +12), Greece (59%, +12), Italy (66%, +10), France (61%, +10) and Spain (52%, +10). In contrast, respondents in five countries are now less likely to agree, most notably those in Finland (68%, -8). This proportion of agreement remains unchanged in Estonia, Latvia and the Czech Republic. 58
62 The socio-demographic analysis shows: Respondents aged 55 and over (64%) are slightly less likely to agree than younger respondents (67%-69% of the year olds); The longer respondents remained in education, the more likely they are to agree: 73% who completed education aged 20 or after agree, compared to 54% of those who completed their education aged 15 or before; Managers are the most likely to agree, particularly compared to house persons (75% vs. 57%); The greater the financial difficulties respondents experience, the less likely they are to agree: 68% who experience the least financial difficulties do so, compared to 53% of those who experience the most difficulties; In addition, respondents with a positive image of the EU are more likely to agree (82%), compared to those who have a neutral (61%) or negative image (37%). 59
63 60

64 The following table shows the average results by socio-demographic criteria in the European Union as a whole (EU28), in the six largest EU countries and in the countries that receive or have received European aid to help them cope with the economic and financial crisis. 61
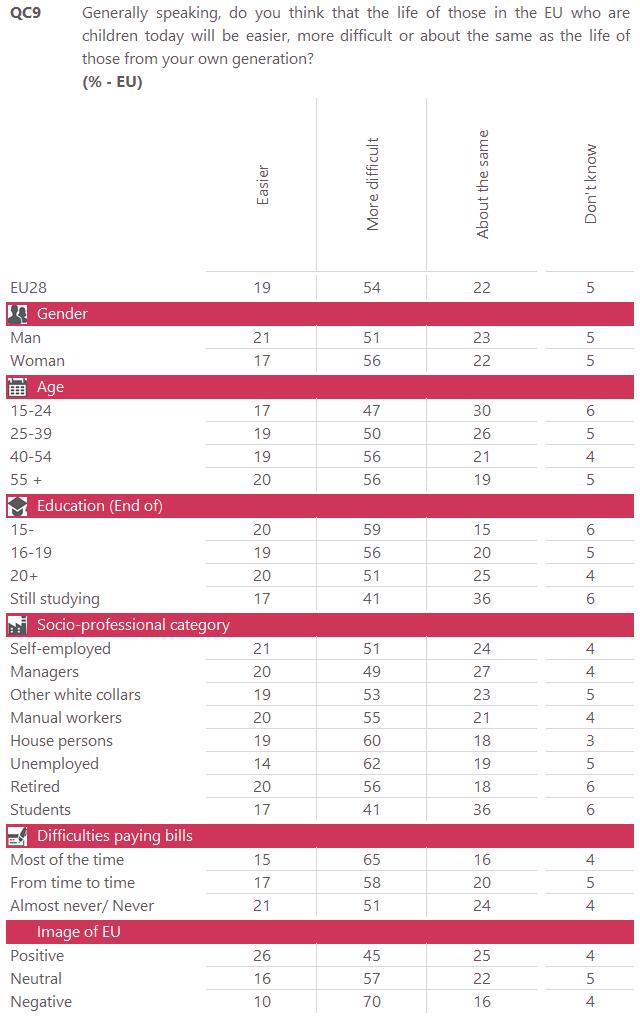
65 - A majority think that the life of the young generation will be more difficult than the life of their own generation - A slight majority of respondents think the life of today s children in the EU will be more difficult than the life of those from their own generation (54%) 25. This represents a slight decline since 2016 (-2 percentage points). Almost one in five think life will be easier for the young generation (19%), a slight decrease since 2016 (-1). The proportion who thinks life will be about the same has increased by two percentage points to 22%. The longer-term trend shows the proportion of respondents who think life for today s children in the EU will be more difficult than their own generation remains well below the levels seen between 2006 and In addition, it is the first time that this proportion has decreased since Although the proportion of respondents who think life for today s children will be easier has declined since the highs of 2014 and 2015, at 19% it is currently still slightly higher than it was in the period QC9 Generally speaking, do you think that the life of those in the EU who are children today will be easier, more difficult or about the same as the life of those from your own generation? 62
. Conversely, respondents in France (6%), Luxembourg (7%) and Belgium (9%) are the least likely to do so.")
66 In only four EU Member States, a majority of respondents believe that the life of children in the EU today will be easier than their own: Portugal and Poland (both 45%), Lithuania (40%) and Latvia (39%). Conversely, respondents in France (6%), Luxembourg (7%) and Belgium (9%) are the least likely to do so. In the 22 other EU Member States, majorities consider life will be more difficult for today s children in the EU. Respondents in France (73%), Luxembourg and Belgium (both 72%) are the most likely to say so, while those in Poland (22%), Latvia (31%) and Lithuania (32%) are the least likely to share this opinion. In two countries, majorities think life for today s children will be the same as their own generation: Denmark (40%) and Croatia (36%). Respondents in the Netherlands (35%) are also likely to think that way. Those in Malta (12%), Portugal (13%) and Greece (16%) are the least likely to think life will be the same. At an overall EU level, there have only been minor changes in opinion since 2016, but in some countries there have been larger changes. In 16 Member States of the EU, respondents are now less likely to say life for children in the EU today will be easier, most notably in Romania (19%, -8 percentage points), Luxembourg (7%, -7), Ireland (35%, -6) and Malta (29%, -6). In seven countries, they are now more likely to think this way than they were in 2016, with the highest increases in Poland (45%, +7) and Greece (16%, +7). There is no change in France, the United Kingdom, Belgium, Finland and Latvia. In 16 countries, respondents are now less likely to say life will be more difficult, most notably in Poland (22%, -11 percentage points), Greece (66%, -9), the Netherlands (52%, -8) and Spain (55%, -8). They are more likely to think so in 11 EU Member States, especially those in Romania (52%, +9), Malta (52%, +7) and Lithuania (32%, +7). No change is observed in Finland. In 16 EU Member States, respondents are now more likely to think life for today s children will be the same, most notably in Slovenia (29%, +9 percentage points), the Netherlands (35%, +9) and Luxembourg (17%, +7). Decreases are seen in seven countries and this proportion remains unchanged in the five other countries. 63
67 64
68 The socio-demographic analysis illustrates that in most cases the differences are between those who think life will be more difficult and those who think it will be about the same: The older the respondents, the more likely they are to think life will be more difficult, and the less likely they are to think it will be about the same. For example, 30% of year olds think life will be about the same, compared to 19% of those aged 55 and over; The longer respondents remained in education, the less likely they are to think life will be more difficult, and the less likely they are to think it will be about the same: 59% of those who completed education aged 15 or before think life will be more difficult, compared to 51% of those who completed education aged 20 or after; The unemployed are the most likely to think life will be more difficult (62%), while students are the most likely to think it will be about the same (36%); The more difficulties respondents experience paying their bills, the more likely they are to say life will be more difficult, and the less likely they are to say it will be the same or easier; Respondents with a positive image of the EU are more likely to think life will be easier, (26% vs. 10% of those who have a negative image), and less likely to think it will be more difficult (45% vs. 70%). 65
69 66

70 The following tables show the average results by socio-demographic criteria in the European Union as a whole (EU28), in the six largest EU countries and in the countries that receive or have received European aid to help them cope with the economic and financial crisis. 67
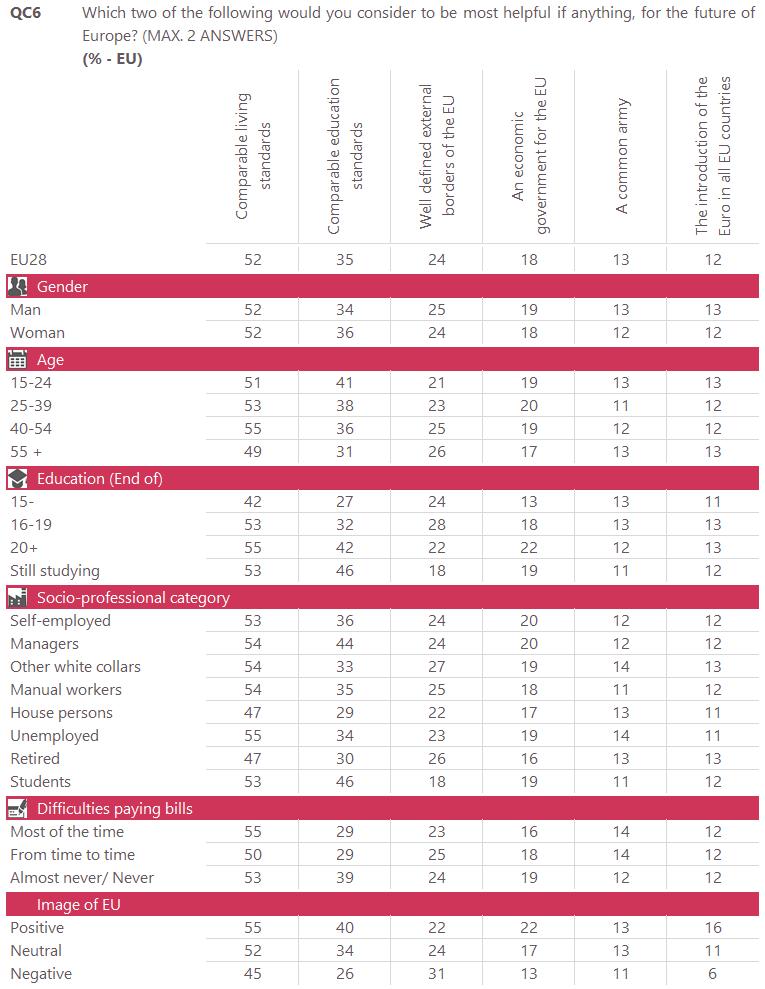
71 2 What would be most helpful for the future of Europe? - Comparable living standards considered the most helpful for the future of Europe More than half the respondents say comparable living standards would be most helpful for the future of Europe (52%), while more than a third says comparable education standards would be most helpful (35%). 26 Less than one quarter say well-defined external borders of the EU (24%), an economic government for the EU (18%), a common army (13%) or the introduction of the Euro in all EU countries (12%) would be most helpful for the future of Europe. There have been small shifts in opinion since 2016, and the proportions mentioning comparable living standards (-1 percentage point) and comparable education standards (=) have remained stable. 26 QC6 Which two of the following would you consider to be most helpful if anything, for the future of Europe? (MAX. 2 ANSWERS) 68

72 Comparable living standards are the most mentioned item in 24 Member States of the EU, while in only two EU Member States respondents are most likely to mention comparable education standards: Malta and Germany. In Denmark and Sweden these two items are mentioned equally. 69
73 In 20 EU Member States, at least half of all respondents say comparable living standards would be the most helpful for the future of Europe. At least seven in ten respondents in Lithuania (74%) and Portugal (70%) say this, as do 69% of those in both Poland and Bulgaria. Respondents in Italy (38%) and Denmark and Finland (both 41%) are the least likely to mention comparable living standards, although these results still represent more than one third of the respondents in each country. There are three EU Member States where at least half say comparable education standards would be the most helpful: Malta (59%), Sweden (58%) and Germany (50%). Respondents in Hungary (16%) and the Czech Republic and Slovakia (both 17%) are the least likely to mention this option. 70
74 Across the EU as a whole, there have only been small changes since 2016, and this is also generally true at a country level as well. There are, however, some exceptions. In 16 Member States of the EU, respondents are now less likely to mention comparable living standards, compared to 2016, most notably in Slovakia (56%, -9 percentage points) and Denmark (41%, -7). They are more likely to say so in eight countries, and no change is observed in four countries. In 14 Member States of the EU, comparable education standards are less likely to be mentioned, especially by respondents in Spain (48%, -13 percentage points), Slovenia (26%, -7) and Denmark (41%, -7). They are more likely to be mentioned by those in 12 countries, most notably in Cyprus (45%, +9). No change in Belgium and Austria. The socio-demographic analysis highlights relatively few differences in opinion: The younger the respondents, the more likely they are to think comparable education standards would be most helpful for the future of Europe: 41% of those aged mention this, compared to 31% of those aged 55 and over; The longer respondents remained in education, the more likely they are to mention comparable living standards (55% of respondents who completed their education aged 20 or after, compared to 42% of those who completed their education aged 15 or before) and comparable education standards (42% of respondents who completed their education aged 20 or after, compared to 27% of those who completed their education aged 15 or before); Students (46%) and managers (44%) are the most likely to mention comparable education standards, particularly compared to house persons (29%); Respondents who experience the least financial difficulties are the most likely to mention comparable education standards (39% vs. 29%); In addition, respondents who have a positive image of the EU are more likely to mention comparable living standards (55% vs. 45% with a negative image) and comparable education standards (40% vs. 26%). 71
75 72

76 The following table shows the average results by socio-demographic criteria in the European Union as a whole (EU28), in the six largest EU countries and in the countries that receive or have received European aid to help them cope with the economic and financial crisis. 73
Special Eurobarometer 461. Report. Designing Europe s future:
 Designing Europe s future: Trust in institutions Globalisation Support for the euro, opinions about free trade and solidarity Fieldwork Survey requested by the European Commission, Directorate-General
Special Eurobarometer 464b. Report
 Europeans attitudes towards security Survey requested by the European Commission, Directorate-General for Migration and Home Affairs and co-ordinated by the Directorate-General for Communication This document
Special Eurobarometer 440. Report. Europeans, Agriculture and the CAP
 Survey requested by the European Commission, Directorate-General for Agriculture and Rural Development and co-ordinated by the Directorate-General for Communication This document does not represent the
Standard Eurobarometer 89 Spring Report. Europeans and the future of Europe
 Fieldwork March 2018 Survey requested and co-ordinated by the European Commission, Directorate-General for Communication This document does not represent the point of view of the European Commission. The
Special Eurobarometer 455
 EU Citizens views on development, cooperation and November December 2016 Survey conducted by TNS opinion & social at the request of the European Commission, Directorate-General for International Cooperation
EUROPEANS ATTITUDES TOWARDS SECURITY
 Special Eurobarometer 432 EUROPEANS ATTITUDES TOWARDS SECURITY REPORT Fieldwork: March 2015 Publication: April 2015 This survey has been requested by the European Commission, Directorate-General for Migration
Standard Eurobarometer 89 Spring Report. European citizenship
 European citizenship Fieldwork March 2018 Survey requested and co-ordinated by the European Commission, Directorate-General for Communication This document does not represent the point of view of the European
EU DEVELOPMENT AID AND THE MILLENNIUM DEVELOPMENT GOALS
 Special Eurobarometer 405 EU DEVELOPMENT AID AND THE MILLENNIUM DEVELOPMENT GOALS REPORT Fieldwork: May - June 2013 Publication: November 2013 This survey has been requested by the European Commission,
Special Eurobarometer 469. Report
 Integration of immigrants in the European Union Survey requested by the European Commission, Directorate-General for Migration and Home Affairs and co-ordinated by the Directorate-General for Communication
Flash Eurobarometer 431. Report. Electoral Rights
 Electoral Rights Survey requested by the European Commission, Directorate-General for Justice and Consumers and co-ordinated by the Directorate-General for Communication This document does not represent
Flash Eurobarometer 431. Summary. Electoral Rights
 Survey requested by the European Commission, Directorate-General for Justice and Consumers and co-ordinated by the Directorate-General for Communication This document does not represent the point of view
Special Eurobarometer 471. Summary
 Fairness, inequality and intergenerational mobility Survey requested by the European Commission, Joint Research Centre and co-ordinated by the Directorate-General for Communication This document does not
INTERNAL SECURITY. Publication: November 2011
 Special Eurobarometer 371 European Commission INTERNAL SECURITY REPORT Special Eurobarometer 371 / Wave TNS opinion & social Fieldwork: June 2011 Publication: November 2011 This survey has been requested
EUROBAROMETER The European Union today and tomorrow. Fieldwork: October - November 2008 Publication: June 2010
 EUROBAROMETER 66 Standard Eurobarometer Report European Commission EUROBAROMETER 70 3. The European Union today and tomorrow Fieldwork: October - November 2008 Publication: June 2010 Standard Eurobarometer
Flash Eurobarometer 430. Summary. European Union Citizenship
 European Union Citizenship Survey requested by the European Commission, Directorate-General for Justice and Consumers and co-ordinated by the Directorate-General for Communication This document does not
Flash Eurobarometer 430. Report. European Union Citizenship
 European Union Citizenship Survey requested by the European Commission, Directorate-General for Justice and Consumers and co-ordinated by the Directorate-General for Communication This document does not
Special Eurobarometer 428 GENDER EQUALITY SUMMARY
 Special Eurobarometer 428 GENDER EQUALITY SUMMARY Fieldwork: November-December 2014 Publication: March 2015 This survey has been requested by the European Commission, Directorate-General for Justice and
PUBLIC PERCEPTIONS OF SCIENCE, RESEARCH AND INNOVATION
 Special Eurobarometer 419 PUBLIC PERCEPTIONS OF SCIENCE, RESEARCH AND INNOVATION SUMMARY Fieldwork: June 2014 Publication: October 2014 This survey has been requested by the European Commission, Directorate-General
Special Eurobarometer 470. Summary. Corruption
 Corruption Survey requested by the European Commission, Directorate-General for Migration and Home Affairs and co-ordinated by the Directorate-General for Communication This document does not represent
EUROPEAN UNION CITIZENSHIP
 Flash Eurobarometer EUROPEAN UNION CITIZENSHIP REPORT Fieldwork: November 2012 Publication: February 2013 This survey has been requested by the European Commission, Directorate-General Justice and co-ordinated
MEDIA USE IN THE EUROPEAN UNION
 Standard Eurobarometer 76 Autumn 2011 MEDIA USE IN THE EUROPEAN UNION REPORT Fieldwork: November 2011 Publication: March 2012 This survey has been requested and co-ordinated by Directorate-General for
Euro area unemployment rate at 9.9% EU27 at 9.4%
 STAT/11/76 April 2011 Euro area unemployment rate at 9.9% EU27 at 9.4% The euro area 1 (EA17) seasonally-adjusted 2 unemployment rate 3 was 9.9% in April 2011, unchanged compared with March 4. It was.2%
EUROPEAN CITIZENSHIP
 Standard Eurobarometer 78 Autumn 2012 EUROPEAN CITIZENSHIP REPORT Fieldwork: November 2012 This survey has been requested and co-ordinated by the European Commission, Directorate-General for Communication.
A. The image of the European Union B. The image of the European Parliament... 10
 Directorate General for Communication Direction C Relations with citizens PUBLIC OPINION MONITORING UNIT EUROPEAN ELECTIONS 2009 25/05/2009 Pre electoral survey First wave First results: European average
CITIZENS AWARENESS AND PERCEPTIONS OF EU REGIONAL POLICY
 Flash Eurobarometer CITIZENS AWARENESS AND PERCEPTIONS OF EU REGIONAL POLICY REPORT Fieldwork: June 2015 Publication: September 2015 This survey has been requested by the European Commission, Directorate-General
EUROPEAN CITIZENSHIP
 Standard Eurobarometer 81 Spring 2014 EUROPEAN CITIZENSHIP REPORT Fieldwork: June 2014 This survey has been requested and co-ordinated by the European Commission, Directorate-General for Communication.
EUROPEAN CITIZENSHIP
 Standard Eurobarometer 80 Autumn 2013 EUROPEAN CITIZENSHIP REPORT Fieldwork: November 2013 This survey has been requested and co-ordinated by the European Commission, Directorate-General for Communication.
Special Eurobarometer 474. Summary. Europeans perceptions of the Schengen Area
 Summary Europeans perceptions of the Schengen Area Survey requested by the European Commission, Directorate-General for Migration and Home Affairs and co-ordinated by the Directorate-General for Communication
EUROPEANS, THE EUROPEAN UNION AND THE CRISIS
 Standard Eurobarometer 80 Autumn 2013 EUROPEANS, THE EUROPEAN UNION AND THE CRISIS REPORT Fieldwork: November 2013 This survey has been requested and co-ordinated by the European Commission, Directorate-General
The European emergency number 112
 Flash Eurobarometer The European emergency number 112 REPORT Fieldwork: December 2011 Publication: February 2012 Flash Eurobarometer TNS political & social This survey has been requested by the Directorate-General
EUROPEAN CITIZENSHIP
 Standard Eurobarometer 82 Autumn 2014 EUROPEAN CITIZENSHIP REPORT Fieldwork: November 2014 This survey has been requested and co-ordinated by the European Commission, Directorate-General for Communication.
Flash Eurobarometer 364 ELECTORAL RIGHTS REPORT
 Flash Eurobarometer ELECTORAL RIGHTS REPORT Fieldwork: November 2012 Publication: March 2013 This survey has been requested by the European Commission, Directorate-General Justice and co-ordinated by Directorate-General
PUBLIC OPINION IN THE EUROPEAN UNION
 Standard Eurobarometer 81 Spring 2014 PUBLIC OPINION IN THE EUROPEAN UNION FIRST RESULTS Fieldwork: June 2014 Publication: July 2014 This survey has been requested and co-ordinated by the European Commission,
Firearms in the European Union
 Flash Eurobarometer 383 Firearms in the European Union SUMMARY Fieldwork: September 2013 Publication: October 2013 This survey has been requested by the European Commission, Directorate-General for Home
September 2012 Euro area unemployment rate at 11.6% EU27 at 10.6%
 STAT/12/155 31 October 2012 September 2012 Euro area unemployment rate at 11.6% at.6% The euro area 1 (EA17) seasonally-adjusted 2 unemployment rate 3 was 11.6% in September 2012, up from 11.5% in August
Standard Eurobarometer 88 Autumn Report. Media use in the European Union
 Media use in the European Union Fieldwork November 2017 Survey requested and co-ordinated by the European Commission, Directorate-General for Communication This document does not represent the point of
PATIENTS RIGHTS IN CROSS-BORDER HEALTHCARE IN THE EUROPEAN UNION
 Special Eurobarometer 425 PATIENTS RIGHTS IN CROSS-BORDER HEALTHCARE IN THE EUROPEAN UNION SUMMARY Fieldwork: October 2014 Publication: May 2015 This survey has been requested by the European Commission,
Directorate General for Communication Direction C - Relations avec les citoyens PUBLIC OPINION MONITORING UNIT 27 March 2009
 Directorate General for Communication Direction C - Relations avec les citoyens PUBLIC OPINION MONITORING UNIT 27 March 2009 EUROPEANS AND THE ECONOMIC CRISIS Standard Eurobarometer (EB 71) Population:
EUROPEAN YOUTH: PARTICIPATION IN DEMOCRATIC LIFE
 Flash Eurobarometer 375 EUROPEAN YOUTH: PARTICIPATION IN DEMOCRATIC LIFE SUMMARY Fieldwork: April 2013 Publication: May 2013 This survey has been requested by the European Commission, Directorate-General
WOMEN IN DECISION-MAKING POSITIONS
 Special Eurobarometer 376 WOMEN IN DECISION-MAKING POSITIONS SUMMARY Fieldwork: September 2011 Publication: March 2012 This survey has been requested by Directorate-General Justice and co-ordinated by
Europeans attitudes towards climate change
 Special Eurobarometer 313 EUROPEAN PARLIAMENT EUROPEAN COMMISSION Europeans attitudes towards climate change Special Eurobarometer 313 / Wave 71.1 TNS Opinion & Social Report Fieldwork: January - February
Special Eurobarometer 468. Report. Attitudes of European citizens towards the environment
 Attitudes of European citizens towards the environment Fieldwork September- Publication November 2017 Survey requested by the European Commission, Directorate-General for Environment and co-ordinated by
The European Emergency Number 112. Analytical report
 Flash Eurobarometer 314 The Gallup Organization Gallup 2 Flash Eurobarometer N o 189a EU communication and the citizens Flash Eurobarometer European Commission The European Emergency Number 112 Analytical
Standard Eurobarometer 85. Public opinion in the European Union
 Public opinion in the European Union Fieldwork: May 2016 Survey conducted by TNS opinion & social at the request of the European Commission, Directorate-General for Communication Survey coordinated by
Special Eurobarometer 469
 Summary Integration of immigrants in the European Union Survey requested by the European Commission, Directorate-General for Migration and Home Affairs and co-ordinated by the Directorate-General for Communication
PUBLIC OPINION IN THE EUROPEAN UNION
 Standard Eurobarometer 77 Spring 2012 PUBLIC OPINION IN THE EUROPEAN UNION REPORT Fieldwork: May 2012 This survey has been requested and co-ordinated by the European Commission, Directorate-General for
Women in the EU. Fieldwork : February-March 2011 Publication: June Special Eurobarometer / Wave 75.1 TNS Opinion & Social EUROPEAN PARLIAMENT
 EUROPEAN PARLIAMENT Women in the EU Eurobaromètre Spécial / Vague 74.3 TNS Opinion & Social Fieldwork : February-March 2011 Publication: June 2011 Special Eurobarometer / Wave 75.1 TNS Opinion & Social
Employment and Social Policy
 Special Eurobarometer 77 European Commission Employment and Social Policy SUMMARY Special Eurobarometer 77 / Wave EB76. TNS opinion & social Fieldwork: September- October 0 Publication: November 0 This
Standard Eurobarometer 89 Spring Public opinion in the European Union
 Public opinion in the European Union Fieldwork March 2018 Survey requested and co-ordinated by the European Commission, Directorate-General for Communication This document does not represent the point
ATTITUDES OF EUROPEAN CITIZENS TOWARDS THE ENVIRONMENT
 Special Eurobarometer 416 ATTITUDES OF EUROPEAN CITIZENS TOWARDS THE ENVIRONMENT SUMMARY Fieldwork: April - May 2014 Publication: September 2014 This survey has been requested by the European Commission,
The Rights of the Child. Analytical report
 Flash Eurobarometer 273 The Gallup Organisation Analytical Report Flash EB N o 251 Public attitudes and perceptions in the euro area Flash Eurobarometer European Commission The Rights of the Child Analytical
Flash Eurobarometer 408 EUROPEAN YOUTH SUMMARY
 Flash Eurobarometer 408 EUROPEAN YOUTH SUMMARY Fieldwork: December 2014 Publication: April 2015 This survey has been requested by the European Commission, Directorate-General for Education and Culture
CITIZENS AWARENESS AND PERCEPTIONS OF EU REGIONAL POLICY
 Flash Eurobarometer 384 CITIZENS AWARENESS AND PERCEPTIONS OF EU REGIONAL POLICY SUMMARY Fieldwork: September 2013 Publication: December 2013 This survey has been requested by the European Commission,
Data Protection in the European Union. Data controllers perceptions. Analytical Report
 Gallup Flash Eurobarometer N o 189a EU communication and the citizens Flash Eurobarometer European Commission Data Protection in the European Union Data controllers perceptions Analytical Report Fieldwork:
EUROBAROMETER 72 PUBLIC OPINION IN THE EUROPEAN UNION. Autumn The survey was requested and coordinated by Directorate-General Communication
 Standard Eurobarometer EUROBAROMETER 72 PUBLIC OPINION IN THE EUROPEAN UNION Autumn 2009 NATIONAL REPO Standard Eurobarometer 72 / Autumn 2009 TNS Opinion & Social UNITED KINGDOM The survey was requested
EUROBAROMETER 72 PUBLIC OPINION IN THE EUROPEAN UNION Volume 2
 Standard Eurobarometer European Commission EUROBAROMETER 72 PUBLIC OPINION IN THE EUROPEAN UNION Volume 2 REPORT Fieldwork: October - November 2009 Standard Eurobarometer 72 / Autumn 2009 - TNS opinion
PUBLIC OPINION IN THE EUROPEAN UNION
 Standard Eurobarometer 79 Spring 2013 PUBLIC OPINION IN THE EUROPEAN UNION FIRST RESULTS Fieldwork: May 2013 Publication: July 2013 This survey has been requested and co-ordinated by the European Commission,
Flash Eurobarometer 429. Summary. The euro area
 LOGO CE_Vertical_EN_NEG_quadri rouge Summary Survey requested by the European Commission, Directorate-General for Economic and Financial Affairs and co-ordinated by the Directorate-General for Communication
The. Special Eurobarometer 368. Special Eurobarometer 368 / Wave EB 75.3 TNS opinion & social. This document. of the authors.
 Special Eurobarometer 368 European Commission The Common Agricultural Policy REPORT Special Eurobarometer 368 / Wave TNS opinion & social Fieldwork: May 2011 Publication: September 2011 This survey has
Alternative views of the role of wages: contours of a European Minimum Wage
 Alternative views of the role of wages: contours of a European Minimum Wage Europe at a crossroads which way to quality jobs and prosperity? ETUI-ETUC Conference Brussels, 24-26 September 2014 Dr. Torsten
EUROPEAN CITIZENSHIP
 Standard Eurobarometer 77 Spring 2012 EUROPEAN CITIZENSHIP REPORT Fieldwork: May 2012 This survey has been requested and co-ordinated by the European Commission, Directorate-General for Communication.
The European Emergency Number 112
 Gallup 2 Flash Eurobarometer N o 189a EU communication and the citizens Flash Eurobarometer European Commission The European Emergency Number 112 Summary Fieldwork: January 2008 Publication: February 2008
Europeans and the crisis
 EUROPEAN PARLIAMENT Europeans and the crisis Report Fieldwork: August September 2010 Publication: November 2010 Special Eurobarometer/Wave 74.1 TNS Opinion & Social Eurobaromètre spécial / Vague 74.1 TNS
Context Indicator 17: Population density
 3.2. Socio-economic situation of rural areas 3.2.1. Predominantly rural regions are more densely populated in the EU-N12 than in the EU-15 Context Indicator 17: Population density In 2011, predominantly
Standard Eurobarometer 88 Autumn Public opinion in the European Union
 Public opinion in the European Union Fieldwork November 2017 Survey requested and co-ordinated by the European Commission, Directorate-General for Communication This document does not represent the point
Making a difference in the world: Europeans and the future of development aid
 Special Eurobarometer 375 European Commission Making a difference in the world: Europeans and the future of development aid REPORT Special Eurobarometer 375 / Wave 7.61 TNS opinion & social Fieldwork:
Convergence: a narrative for Europe. 12 June 2018
 Convergence: a narrative for Europe 12 June 218 1.Our economies 2 Luxembourg Ireland Denmark Sweden Netherlands Austria Finland Germany Belgium United Kingdom France Italy Spain Malta Cyprus Slovenia Portugal
Data Protection in the European Union. Citizens perceptions. Analytical Report
 Gallup Flash Eurobarometer N o 189a EU communication and the citizens Flash Eurobarometer European Commission Data Protection in the European Union Citizens perceptions Analytical Report Fieldwork: January
Views on European Union Enlargement
 Flash Eurobarometer 257 The Gallup Organization Flash EB N o 255 Dual circulation period, Slovakia Flash Eurobarometer European Commission Views on European Union Enlargement Analytical Report Fieldwork:
Young people and science. Analytical report
 Flash Eurobarometer 239 The Gallup Organization The Gallup Organization Flash EB N o 187 2006 Innobarometer on Clusters Flash Eurobarometer European Commission Young people and science Analytical report
of the European Commission. and the Communication. This document of the authors. Standard Eurobarometer 75 / Spring 2011 TNS opinion & social
 Standard Eurobarometer European Commission EUROBAROMETER 75 SPRING 2011 Europeans, the European Union crisis and the REPORT Standard Eurobarometer 75 / Spring 2011 TNS opinion & social Fieldwork: May 2011
PUBLIC OPINION IN THE EUROPEAN UNION
 Standard Eurobarometer 77 Spring 2012 PUBLIC OPINION IN THE EUROPEAN UNION FIRST RESULTS Fieldwork: May 2012 Publication: July 2012 This survey has been requested and co-ordinated by the European Commission,
Europeans attitudes towards climate change
 Special Eurobarometer European Commission Europeans attitudes towards climate change Fieldwork: August - September 2009 Publication: November 2009 Special Eurobarometer 322 / Wave 72.1 TNS Opinion & Social
The Unitary Patent and the Unified Patent Court. Dr. Leonard Werner-Jones
 The Unitary Patent and the Unified Patent Court Dr. Leonard Werner-Jones Background The Past: No centralization at all Prosecution country-by-country Litigation country-by-country Patents actions 2 Background
SPECIAL EUROBAROMETER 360
 Special Eurobarometer European Commission SPECIAL EUROBAROMETER 360 Consumer understanding of labels and the safe use of chemicals REPORT Special Eurobarometer 360 / Wave TNS Opinion & Social Fieldwork:
ERGP REPORT ON CORE INDICATORS FOR MONITORING THE EUROPEAN POSTAL MARKET
 ERGP (15) 27 Report on core indicators for monitoring the European postal market ERGP REPORT ON CORE INDICATORS FOR MONITORING THE EUROPEAN POSTAL MARKET 3 December 2015 CONTENTS 1. EXECUTIVE SUMMARY...
of the European Commission. Communication. This document of the authors. Standard Eurobarometer 75 / Spring 2011 TNS opinion & social
 Standard Eurobarometer European Commission EUROBAROMETER 75 SPRING 2011 Europe 2020 REPORT Standard Eurobarometer 75 / Spring 2011 TNS opinion & social Fieldwork: May 2011 Publication: August 2011 This
European Parliament Flash Eurobarometer FIRST RESULTS Focus on EE19 Lead Candidate Process and EP Media Recall
 European Parliament Flash Eurobarometer FIRST RESULTS Focus on EE19 Lead Candidate Process and EP Media Recall STUDY - Public Opinion Monitoring Series Eurobarometer survey commissioned by the European
Standard Eurobarometer 77 Spring 2012 EUROPE 2020 REPORT
 Standard Eurobarometer 77 Spring 2012 EUROPE 2020 REPORT Fieldwork: May 2012 This survey has been requested and co-ordinated by the European Commission, Directorate-General for Communication. http://ec.europa.eu/public_opinion/index_en.htm
The Rights of the Child. Analytical report
 The Gallup Organization Flash EB N o 187 2006 Innobarometer on Clusters Flash Eurobarometer European Commission The Rights of the Child Analytical report Fieldwork: February 2008 Report: April 2008 Flash
EUROBAROMETER 69 SPRING 2008 NATIONAL REPORT UNITED KINGDOM. Standard Eurobarometer PUBLIC OPINION IN THE EUROPEAN UNION
 Standard Eurobarometer 69 / Spring 2008 TNS Opinion & Social Standard Eurobarometer European Commission EUROBAROMETER 69 PUBLIC OPINION IN THE EUROPEAN UNION SPRING 2008 NATIONAL REPORT UNITED KINGDOM
ENTREPRENEURSHIP IN THE EU AND BEYOND
 Flash Eurobarometer 354 ENTREPRENEURSHIP IN THE EU AND BEYOND COUNTRY REPORT JAPAN Fieldwork: July 2012 This survey has been requested by the European Commission, Directorate-General Enterprise and Industry
European Parliament Eurobarometer (EB79.5) ONE YEAR TO GO UNTIL THE 2014 EUROPEAN ELECTIONS Institutional Part ANALYTICAL OVERVIEW
 ONE YEAR TO GO UNTIL THE 2014 EUROPEAN ELECTIONS Institutional Part ANALYTICAL OVERVIEW") Directorate-General for Communication Public Opinion Monitoring Unit Brussels, 21 August 2013. European Parliament Eurobarometer (EB79.5) ONE YEAR TO GO UNTIL THE 2014 EUROPEAN ELECTIONS Institutional
Directorate-General for Communication Public Opinion Monitoring Unit Brussels, 21 August 2013. European Parliament Eurobarometer (EB79.5) ONE YEAR TO GO UNTIL THE 2014 EUROPEAN ELECTIONS Institutional
What does the Tourism Demand Surveys tell about long distance travel? Linda Christensen Otto Anker Nielsen
 What does the Tourism Demand Surveys tell about long distance travel? Linda Christensen Otto Anker Nielsen Overview of the presentation 1. The Tourism Demand Survey 2. Data 3. Share of respondents travelling
Civil protection Full report
 Special Eurobarometer European Commission Civil protection Full report Fieldwork: September-October 2009 Publication: November 2009 Special Eurobarometer 328 / Wave TNS Opinion & Social This survey was
Flash Eurobarometer 405 THE EURO AREA SUMMARY
 Flash Eurobarometer 405 THE EURO AREA SUMMARY Fieldwork: October 2014 Publication: October 2014 This survey has been requested by the European Commission, Directorate-General for Economic and Financial
Looking Through the Crystal Ball: For Growth and Productivity, Can Central Europe be of Service?
 Looking Through the Crystal Ball: For Growth and Productivity, Can Central Europe be of Service? ARUP BANERJI REGIONAL DIRECTOR FOR EUROPEAN UNION MEMBER STATES THE WORLD BANK 6 th Annual NBP Conference
I m in the Dublin procedure what does this mean?
 EN I m in the Dublin procedure what does this mean? B Information for applicants for international protection found in a Dublin procedure, pursuant to article 4 of Regulation (EU) No 604/2013 1 You have
Standard Eurobarometer 90 Autumn Public opinion in the European Union
 Autumn 2018 Public opinion in the European Union Fieldwork November 2018 Survey requested and co-ordinated by the European Commission, Directorate-General for Communication This document does not represent
ATTITUDES OF EUROPEANS TOWARDS TOURISM
 Flash Eurobarometer 370 ATTITUDES OF EUROPEANS TOWARDS TOURISM SUMMARY Fieldwork: January 2013 Publication: March 2013 This survey has been requested by the European Commission, Directorate-General for
EUROBAROMETER 73 FIRST RESULTS
 Standard Eurobarometer European Commission EUROBAROMETER 73 PUBLIC OPINION IN THE EUROPEAN UNION FIRST RESULTS Fieldwork: May 2010 Publication: August 2010 Standard Eurobarometer 73/ Spring 2010 - TNS
Special Eurobarometer 468. Attitudes of European citizens towards the environment
 Attitudes of European citizens towards the environment Fieldwork September- Publication November 2017 Survey requested by the European Commission, Directorate-General for Environment and co-ordinated by
CULTURAL ACCESS AND PARTICIPATION
 Special Eurobarometer 399 CULTURAL ACCESS AND PARTICIPATION SUMMARY Fieldwork: April May 2013 Publication: November 2013 This survey has been requested by the European Commission, Directorate-General for
I. Overview: Special Eurobarometer surveys and reports on poverty and exclusion
 Reflection Paper Preparation and analysis of Eurobarometer on social exclusion 1 Orsolya Lelkes, Eszter Zólyomi, European Centre for Social Policy and Research, Vienna I. Overview: Special Eurobarometer
Special Eurobarometer 459. Climate change
 Climate change Survey requested by the European Commission, Directorate-General for Climate Action and co-ordinated by the Directorate- General for Communication This document does not represent the point
EUROBAROMETER 64 FIRST RESULTS
 Standard Eurobarometer European Commission PUBLIC OPINION IN THE EUROPEAN UNION FIRST RESULTS Fieldwork : October-November 2005 Publication : December 2005 Standard Eurobarometer 64 / Autumn 2005 - TNS
Report on women and men in leadership positions and Gender equality strategy mid-term review
 EUROPEAN COMMISSION MEMO Brussels, 14 October 2013 Report on women and men in leadership positions and Gender equality strategy mid-term review 1. New Report on Women in Decision-Making: What is the report
Special Eurobarometer 476. Summary. EU citizens and development cooperation
 EU citizens and development cooperation Survey requested by the European Commission, Directorate-General for International Cooperation and Development and co-ordinated by the Directorate-General for Communication
Flash Eurobarometer 354. Entrepreneurship COUNTRY REPORT GREECE
 Flash Eurobarometer 354 Entrepreneurship COUNTRY REPORT GREECE Fieldwork: June 2012 This survey has been requested by the European Commission, Directorate-General Enterprise and Industry and co-ordinated
ENTREPRENEURSHIP IN THE EU AND BEYOND
 Flash Eurobarometer 354 ENTREPRENEURSHIP IN THE EU AND BEYOND COUNTRY REPORT GERMANY Fieldwork: June 2012 This survey has been requested by the European Commission, Directorate-General Enterprise and Industry