Standard Eurobarometer 89 Spring Report. European citizenship
|
|
|
- Lenard Samuel Ray
- 5 years ago
- Views:
Transcription

1 European citizenship Fieldwork March 2018 Survey requested and co-ordinated by the European Commission, Directorate-General for Communication This document does not represent the point of view of the European Commission. The interpretations and opinions contained in it are solely those of the authors. Wave EB89.1 Kantar Public Brussels on behalf of TNS opinion & social
2 European citizenship Fieldwork: March 2018 Survey carried out by Kantar Public Brussels on behalf of TNS opinion & social at the request of the European Commission, Directorate-General for Communication Survey coordinated by the European Commission, Directorate-General for Communication (DG COMM Media Monitoring, Media Analysis and Eurobarometer unit)
3 Project number Project title European citizenship Language version EN Catalogue number NA EN-N ISBN doi: / European Union,
4 TABLE OF CONTENTS INTRODUCTION 3 I. ATTACHMENT TO THE COUNTRY, THE EUROPEAN UNION AND EUROPE 5 II. THE EUROPEAN UNION S ACHIEVEMENTS 20 III. EUROPEAN CITIZENSHIP 29 1 The sense of European citizenship 29 a. Update on the sense of European citizenship 29 b. The different levels of citizenship 35 c. The factors which do the most to create a feeling of community 41 2 Rights as European citizens 45 IV. SOCIAL ISSUES AND VALUES The existence of shared European values The personal values of Europeans 53 a. Things in common in the respondent s country 70 b. Understanding today s world 73 c. Immigrants 76 d. Refugees 79 e. The quality of life was better before 82 f. Confidence in the future 85 ANNEXES Technical specifications 2
5 INTRODUCTION The Standard Eurobarometer survey 89 was carried out between 13 and 28 March in 34 countries and territories: the 28 Member States of the European Union, the five candidate countries (the former Yugoslav Republic of Macedonia, Turkey, Montenegro, Serbia and Albania) and the Turkish Cypriot Community in the part of the country not controlled by the government of the Republic of Cyprus. This volume of the Standard Eurobarometer survey of spring 2018 (EB89) analyses the opinions of European citizens on European identity and citizenship in the following areas: Attachment to the European Union, compared in particular with their attachment to their city, village or country; Perceptions of the European Union s achievements: what are the European Union s most positive results in the eyes of Europeans? The concept of European citizenship: do Europeans see themselves as European citizens? What factors create a sense of European citizenship? Do they know their rights as European citizens? Do they want information about these rights? Societal issues and values: do Europeans feel that they have a clear understanding of what is happening in today s world? Are the Member States close or distant in terms of shared values? Do people in their country have a lot in common? What values best represent the European Union? And what are their personal values? The speed of European integration: What do Europeans think is the current speed of European integration, and what speed would they like? The full survey report consists of several volumes. The first volume presents the results of the general questions on the state of public opinion in the European Union, and economic issues in the European Union. Four other volumes present the views of Europeans on the following subjects: the European Union s priorities, the budget of the European Union, European citizenship and the future of Europe. This volume is devoted to European citizenship. 1 Please refer to the technical specifications for information on the exact dates of the interviews in each country. 3
6 The methodology used is that of the Standard Eurobarometer surveys of the Directorate-General for Communication ( Media monitoring, media analysis and Eurobarometer unit) 2. The same methodology has been applied in all the countries and territories covered by the survey. A technical note describing how the institutes within the TNS opinion & social network conduct the interviews is appended to this report. This note also indicates the confidence intervals 3 which enable us to assess the accuracy of a survey s results, according to the size of the sample polled in relation to the total size of the population studied. Note: the abbreviations used in this report correspond to: Belgium BE Lithuania LT Bulgaria BG Luxembourg LU Czech Republic CZ Hungary HU Denmark DK Malta MT Germany DE The Netherlands NL Estonia EE Austria AT Ireland IE Poland PL Greece EL Portugal PT Spain ES Romania RO France FR Slovenia SI Croatia HR Slovakia SK Italy IT Finland FI Republic of Cyprus CY* Sweden SE Latvia LV United Kingdom UK Turkish Cypriot Community CY (tcc) Albania AL Turkey TR Montenegro ME Serbia RS Former Yugoslav Republic of Macedonia MK** European Union weighted average for the 28 Member States of the European Union BE, FR, IT, LU, DE, AT, ES, PT, IE, NL, FI, EL, EE, SI, CY, MT, SK, LV, LT BG, CZ, DK, HR, HU, PL, RO, SE, UK EU28 Euro area Non-euro area * Cyprus as a whole is one of the 28 European Union Member States. However, the acquis communautaire has been suspended in the part of the country not controlled by the government of the Republic of Cyprus. For practical reasons, only the interviews carried out in the part of the country controlled by the government of the Republic of Cyprus are included in the CY category and in the EU28 average. The interviews carried out in the part of the country not controlled by the government of the Republic of Cyprus are included in the CY (tcc) category [tcc: Turkish Cypriot Community] ** Provisional abbreviation which in no way prejudges the definitive name of this country, which will be agreed once the current negotiations at the United Nations have been concluded. We wish to thank all the people interviewed throughout Europe who took the time to participate in this survey. Without their active participation, this survey would not have been possible The results tables are appended hereto. It should be noted that the total of the percentages indicated in the tables in this report may exceed 100% when respondents had the possibility to choose several answers to the same question. 4
, including 53% who feel very attached to it; 93% feel attached to their country (+1")
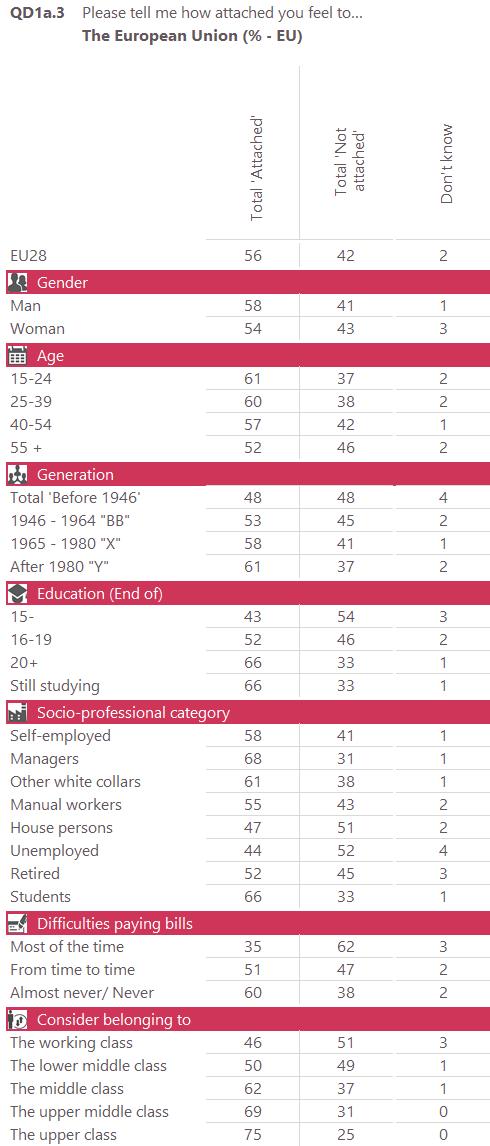
7 I. ATTACHMENT TO THE COUNTRY, THE EUROPEAN UNION AND EUROPE A majority of respondents continue to feel attached to the European Union More than half of Europeans feel attached at the four levels about which they were asked 4 : 89% feel attached to their city/town/village (unchanged since autumn 2017), including 53% who feel very attached to it; 93% feel attached to their country (+1 percentage point since autumn 2017), including 57% very attached; More than half say that they feel attached to the European Union (56%, +1), although this score remains below that for the local and national levels, especially as regards the proportion who feel very attached (14%, =); Lastly, two in three respondents feel attached to Europe (65%, +1). However, only 18% (=) feel very attached to it. 4 QD1. Please tell me how attached you feel to Your city/town/village; (OUR COUNTRY); The European Union; Europe 5
, and Austria and Cyprus (both 96%).")
, compared to a third of respondents in the")
8 The attachment of Europeans to their city/town/village and country In all of the 28 EU Member States, more than seven in ten respondents feel attached to their city/town/village, with the highest scores in Greece and Portugal (97% in both countries), and Austria and Cyprus (both 96%). In contrast, the lowest scores were recorded in the Netherlands (71%), Malta (79%), France (80%), Sweden (83%) and Belgium (84%). Respondents in Greece are the most likely to feel very attached to their city/town/village (84%), compared to a third of respondents in the Netherlands (33%) who feel the same way. 6

, and Croatia and Spain")
 and Greece (84%) are the most likely to say")
9 In all EU 28 Member States, more than 80% of respondents feel attached to their country, and this is almost unanimous in Greece, Cyprus and Portugal (99% in each country). The lowest scores were recorded in Belgium (83%), and Croatia and Spain (86% in each country). Respondents in Denmark (85%) and Greece (84%) are the most likely to say they feel very attached to their country, while only 39% of respondents in Belgium say the same. 7
10 Respondents in 21 EU Member States (compared with 20 in autumn 2017) feel more attached to their country than to their city/town/village. This is particularly true in the Netherlands (89% feel attached to their country while 71% feel attached to their city/town/village), France (93% and 80%), Malta (91% and 79%) and Sweden (94% and 83%). The situation is the opposite in five countries, where attachment to the city/town/village is stronger; this is particularly true in Spain (86% and 93%) and Croatia (86% and 91%). Lastly, respondents in Bulgaria and Slovakia feel equally attached to their city/town/village and their country. 8
, and decreases slightly with education (94% of those who left school at the age of 15 or earlier and 88% of")
11 A socio-demographic analysis shows that: A large majority in all socio-demographic categories feel attached to their city/town/village. Attachment increases with age (from 83% of year-olds to 92% among those aged 55+), and decreases slightly with education (94% of those who left school at the age of 15 or earlier and 88% of those who studied up to the age of 20 and beyond); A very large majority of respondents in all the socio-demographic categories also feel attached to their country. This attachment is particularly strong among Europeans aged 55+ (95%) and retired people (95%), as well as managers (95%). 9
12 The following tables shows the results by socio-demographic criteria in the European Union as a whole (EU28 average), in the six largest EU countries and in the countries benefiting or having benefited from European Union support to deal with the financial and economic crisis. 10
13 11
, a majority of respondents feel attached to the European Union, most strikingly in Luxembourg (79%), Poland and Latvia (71% in both countries) and")
. Respondents are evenly divided in Croatia (49% vs. 49%).")
14 Attachment to the European Union and Europe A national analysis reveals significant differences between Member States as regards attachment to the European Union. In 20 countries (compared with 19 in autumn 2017), a majority of respondents feel attached to the European Union, most strikingly in Luxembourg (79%), Poland and Latvia (71% in both countries) and Germany (69%). In seven EU Member States, a minority do so, in particular in Greece (37% attached, vs. 63% not attached ), the Czech Republic (38% vs. 60%) and Cyprus (39% vs. 60%). Respondents are evenly divided in Croatia (49% vs. 49%). Since autumn 2017 attachment to the EU has increased in 17 EU Member States, most notably in Poland (71%, +5 percentage points) and Sweden (51%, +4, where a majority of respondents now feel attached to the EU). On the other hand, it has decreased in seven countries, most strongly in Spain (64%, -7), Malta (61%, -5) and Austria (51%, -4). Lastly, it is stable in four countries: the Czech Republic, Greece, the Netherlands and Finland. 12
15 13
. However only a minority of respondents feel attached to Europe in Greece (42% attached, vs. 58% not attached ) and Cyprus (43% vs. 56%); this was also the case in autumn 2017.")
. It is unchanged in Belgium, Malta and Portugal.")
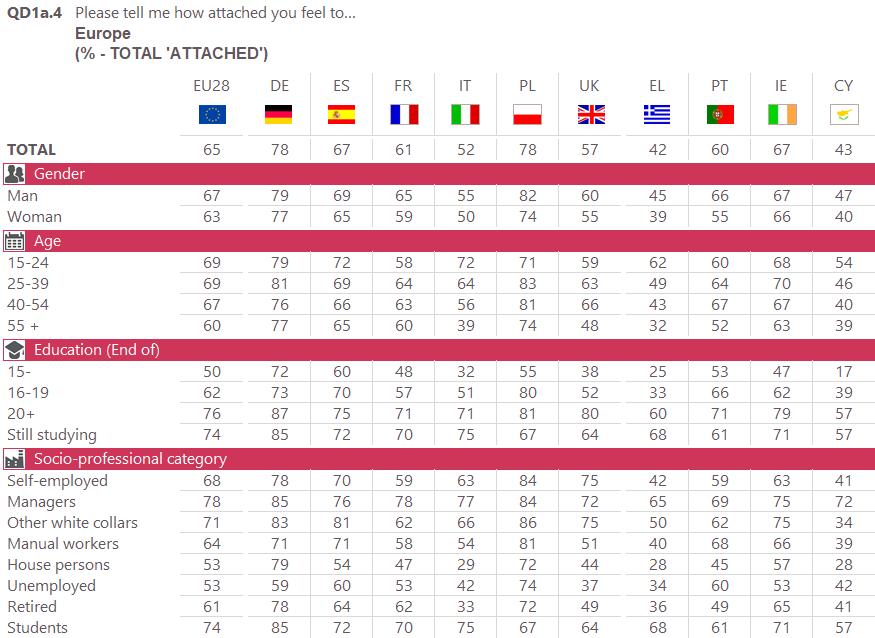
16 A majority of respondents in 26 EU Member States feel attached to Europe (the same number as in autumn 2017), with the highest levels in Denmark (81%), and Luxembourg and Sweden (80% in both countries). However only a minority of respondents feel attached to Europe in Greece (42% attached, vs. 58% not attached ) and Cyprus (43% vs. 56%); this was also the case in autumn Since autumn 2017 the proportion of respondents who feel attached to Europe has increased in 15 countries, led by Poland (78%, +6 percentage points) and Estonia (60%, +5). However, it has decreased in ten Member States, most strongly in Spain (67%, -6). It is unchanged in Belgium, Malta and Portugal. In all 28 EU Member States, respondents are more likely to feel attached to Europe than to the European Union. 14
17 15
18 A socio-demographic analysis shows that the extent to which respondents feel attached to the European Union varies considerably between categories: A majority of both men and women feel attached to the EU, although this is slightly higher for men (58% attached, vs. 41% not attached ) than women (54% vs. 43%); A majority of Europeans who studied up to the age of 20 and beyond (66% vs. 33%) feel attached to the EU, compared with only a minority of those who left school at the age of 15 or earlier (43% vs. 54%); A minority of unemployed people (44% vs. 52%) and housepersons (47% vs. 51%) feel attached to the European Union. However, a majority of respondents in the other socioprofessional categories feel attached to the EU, most notably managers (68% vs. 31%) and students (66% vs. 33%). Those who struggle to pay their bills are less likely to feel attached to the EU. A majority of those who never or almost never have such difficulties do so (60% vs. 38%), compared with a minority of those who have financial difficulties most of the time (35% vs. 62%); Lastly, this attachment is shared by a large proportion of those who see themselves as upper class (75% vs. 25%), and by a majority in other class groups, with the exception of those who see themselves as working class (46% vs. 51%); A majority of respondents feel attached to Europe in almost all socio-demographic categories, led by those who studied up to the age of 20 and beyond (76%), managers (78%), students (74%) and those who see themselves as upper middle class (78%) or upper class (79%). The only exceptions are those who have difficulties paying their bills most of the time (42% vs. 55%). Respondents in all socio-demographic categories feel more attached to Europe than to the European Union. 16
19 17
20 The following tables show the results by socio-demographic criteria in the European Union as a whole (EU28 average), in the six largest EU countries and in the countries benefiting or having benefited from European Union support to deal with the financial and economic crisis. 18
21 19

22 II. THE EUROPEAN UNION S ACHIEVEMENTS More than half of respondents think that peace and freedom of movement are the European Union s most positive results For Europeans, two achievements clearly stand out as the European Union s most positive results 5. A majority of respondents mention the free movement of people, goods and services within the EU (58%, +1 percentage point since autumn 2017) and peace among the Member States of the EU (54%, -2), both at least 30 percentage points higher than the other achievements tested. In joint third place, student exchange programmes such as ERASMUS (24%, -1 percentage point) and the euro (24%, -1) are mentioned by fewer than a quarter of respondents. These are followed by the economic power of the EU (21%, +1 percentage point) and the political and diplomatic influence of the EU in the rest of the world (21%, +1), ahead of the level of social welfare (healthcare, education, pensions) in the EU (18%, no change). The Common Agricultural Policy is mentioned by 10% of respondents (=). Lastly, 7% (=) of respondents spontaneously say that there are no positive achievements on the list. Maximum three answers 5 QD4T. Which of the following do you think is the most positive result of the EU? Firstly? And then? 20
23 The free movement of people, goods and services within the EU is seen as the most positive result in 20 EU Member States, led by Lithuania (80%), Bulgaria (75%), and Estonia and Poland (73% in both countries), with by far the lowest scores in France and Malta (40% in both countries). 21
 and Malta (48%). It is also frequently mentioned in Sweden, where it is the joint highest answer along with the free movement of people, goods and services within the EU (72% for both answers).")
24 Peace among the Member States of the EU is seen as the European Union s most positive result in seven countries: Germany (74%), Denmark (71%), Luxembourg (67%), Cyprus (64%), France (58%), Belgium (53%) and Malta (48%). It is also frequently mentioned in Sweden, where it is the joint highest answer along with the free movement of people, goods and services within the EU (72% for both answers). 22
 and the Czech Republic (37%), and the least frequently in Germany (14%) and the Netherlands (16%). 23")
25 In joint third place overall in Europe, student exchange programmes such as ERASMUS were mentioned the most frequently in Hungary (39%) and the Czech Republic (37%), and the least frequently in Germany (14%) and the Netherlands (16%). 23
26 The euro obtained its highest scores in euro area countries, most notably in Ireland (52%), Finland and Luxembourg (45% in both countries) and the Netherlands (43%). In fact, the 15 highest ranked countries are all in the euro area. The six lowest scores are all recorded in non-euro area countries, namely the United Kingdom (4%), Denmark and the Czech Republic (6% in both countries), Sweden (7%), Bulgaria (8%) and Poland (10%). Since autumn 2017, scores for the free movement of people, goods and services within the EU have increased in 17 EU Member States, in particular in Poland (73%, +7 percentage points) and Croatia (72%, +6), while the score has fallen the most in Malta (40%, -7). By contrast, scores for peace among the Member States of the EU have fallen in 17 countries, most notably in Estonia (49%, -7) and the United Kingdom (47%, -6). Scores for student exchange programmes such as ERASMUS have increased the most in Croatia (30%, +6) and have fallen the most in Malta (29%, -6). The largest increase in scores for the euro is recorded in Finland (45%, +7), while scores have fallen by an equivalent amount in Malta (39%, - 7) and Belgium (38%, -7). For both of these answers, scores have increased in 10 countries, fallen in 15 countries and stayed the same in three. 24
27 Four most frequently mentioned items Maximum three answers 25


28 A socio-demographic analysis shows that peace among the Member States and the free movement of people, goods and services within the EU are seen as the most positive results of the European Union in all categories. 26

29 The following tables show the results by socio-demographic criteria in the European Union as a whole (EU28 average), in the six largest EU countries and in the countries benefiting or having benefited from European Union support to deal with the financial and economic crisis. Maximum three answers Maximum three answers 27

30 Maximum three answers Maximum three answers 28
 feel that they are citizens of the European Union")
 answer yes, definitely.")
31 III. EUROPEAN CITIZENSHIP 1 The sense of European citizenship a. Update on the sense of European citizenship More than two-thirds of Europeans feel that they are citizens of the EU Seven in ten respondents (70%) feel that they are citizens of the European Union (unchanged since autumn 2017) 6. This is the highest score that has ever been recorded (jointly with autumn 2017), and there has been a steady increase since autumn 2015 (64%). Moreover, 29% (unchanged since autumn 2017) answer yes, definitely. However, around three in ten Europeans do not share this feeling of citizenship (29%, -1), while 1% (unchanged) gave a don t know response. 6 QD2.1. For each of the following statements, please tell me to what extent it corresponds or not to your own opinion. You feel that you are a citizen of the EU 29

, Ireland (85%), Germany (84%), Portugal (83%), and Malta and Spain (82% in both countries). This is the first time since 2010 that a majority of respondents in all EU countries feel this way.")
32 In this Standard Eurobarometer survey of spring 2018, euro area respondents (71%, -1 percentage point) are slightly more likely than non-euro area respondents (66%, +1) to feel that they are citizens of the EU. In all 28 EU Member States (compared with 27 in autumn 2017 when Greece was the one exception), a majority of respondents see themselves as citizens of the European Union, most notably in Luxembourg (93%), Ireland (85%), Germany (84%), Portugal (83%), and Malta and Spain (82% in both countries). This is the first time since 2010 that a majority of respondents in all EU countries feel this way. Respondents in Greece and Bulgaria (51% in both countries) are the least likely to feel that they are citizens of the EU, followed by those in Italy (56%), the United Kingdom (57%) and the Czech Republic (59%). 30

, followed by those in Ireland")

.")
33 Respondents in Luxembourg are by far the most likely to say that they definitely feel they are citizens of the European Union (70%), followed by those in Ireland (46%), Germany (43%) and Estonia (40%). The lowest proportions are seen in Greece (15%), and Italy and Croatia (16% in both countries). Order on Total Yes Order on Yes, definitely 31
34 Since autumn 2017 the sense of European citizenship has gained ground in 17 EU Member States, most notably in Slovakia (80%, +5 percentage points), but also in Greece where it is now the majority view (51% yes, vs. 49% no, compared with 48% vs. 52% in autumn 2017). However, it has lost ground in eight countries, in particular in Spain (82%, -6) and Bulgaria (51%, -5). It is unchanged in Estonia, the Netherlands and Slovenia. 32

35 A socio-demographic analysis shows that a majority of respondents in almost all sociodemographic categories feel that they are European citizens. Those who struggle to pay their bills most of the time are an exception to this general pattern, since only a minority of them feel that they are citizens of the EU (47% yes, vs. 51% no ). 33
36 The following tables show the results by socio-demographic criteria in the European Union as a whole (EU28 average), in the six largest EU countries and in the countries benefiting or having benefited from European Union support to deal with the financial and economic crisis. 34
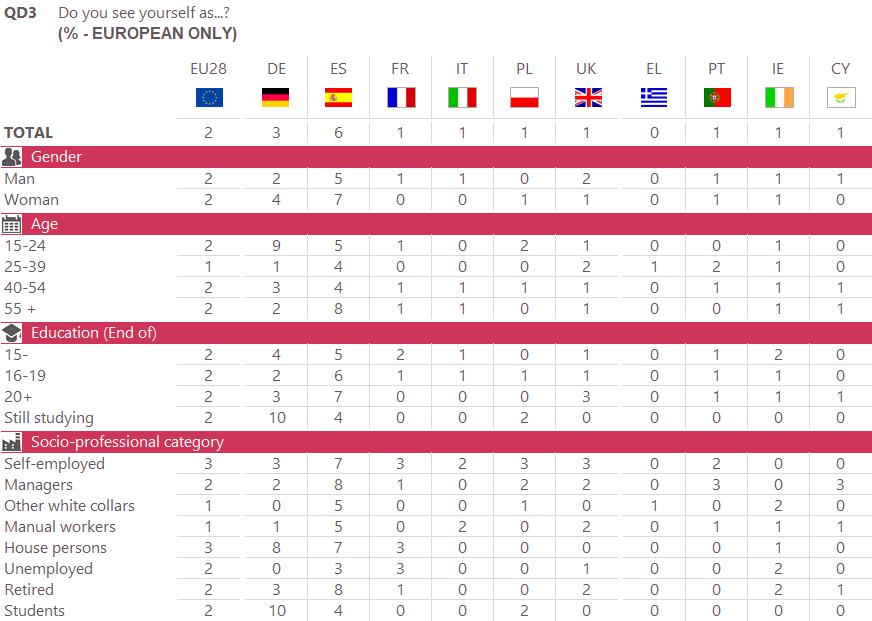
37 b. The different levels of citizenship A majority of Europeans see themselves first as citizens of their country, then as European citizens More than six in ten respondents share a sense of European citizenship (63% say they feel nationality and European, European and nationality or European only, no change since autumn 2017) 7. Conversely, more than a third define themselves solely by their nationality (35%, no change). The overall score for European citizenship combines three answers with very different figures: 55% of Europeans define themselves first of all by their nationality and then by their European citizenship ( nationality and European answer, +1 percentage point since autumn 2017); Next, to a far lesser extent, 6% see themselves first of all European citizens then as nationals of their country ( European and nationality answer, -1); Lastly, 2% see themselves as European only (=). 7 QD3. Do you see yourself as? 35
38 Euro area respondents (66%, no change since autumn 2017) are more likely than non-euro area respondents (57%, +1) to see themselves as European citizens. The overall sense of European citizenship (total of nationality and European, European and nationality and European only answers) is shared by a majority of respondents in 26 EU Member States (as in autumn 2017), led by Luxembourg (87%), Hungary (75%), Spain (74%) and Germany, the Netherlands and Malta (71% in all three countries). In the two remaining Member States, Greece and the United Kingdom, a majority of respondents see themselves as nationals only (51% of answers (NATIONALITY) only in both countries). Since autumn 2017 the sense of European citizenship has gained ground in 15 EU Member States, most strikingly in Slovakia (65%, +8 percentage points) and in Poland (67%, +5). However, it has lost ground in ten countries, most notably in Spain (74%, -8), while it is unchanged in Ireland, Malta and Romania. 36
39 37

40 A socio-demographic analysis shows that the sense of European citizenship is shared by a majority of respondents in nearly all socio-demographic categories. 38
41 The following tables show the results by socio-demographic criteria in the European Union as a whole (EU28 average), in the six largest EU countries and in the countries benefiting or having benefited from European Union support to deal with the financial and economic crisis. 39
42 40

 and values (23%, no change) are mentioned by nearly a quarter of Europeans; Two more items are also mentioned by at least one in five respondents: the economy (21%, unchanged), and geography")
43 c. The factors which do the most to create a feeling of community More than a quarter of Europeans say that culture contributes the most to creating a feeling of community among European Union citizens In order to better understand the key factors in European citizenship, respondents were asked to choose, from a list of 12 items, those that most create a feeling of community among EU citizens 8 : Culture is still the factor contributing most to a feeling of community among European Union citizens (29%, +1 percentage point since autumn 2017); In joint second place, history (23%, +1) and values (23%, no change) are mentioned by nearly a quarter of Europeans; Two more items are also mentioned by at least one in five respondents: the economy (21%, unchanged), and geography (20%, +1); The the rule of law (19%, -1) now ranks equally with sports (19%, +1); Three items are mentioned by around one in seven respondents: solidarity with poorer regions (14%, =), healthcare, education and pensions (13%, =) and inventions, science and technology (13%, +1). These are followed by languages (11%, -1); In twelfth and last place, religion is mentioned by fewer than one in ten respondents (8%, - 1). Maximum three answers 8 QD5. In your opinion, among the following issues, which are those that most create a feeling of community among European Union citizens? 41


44 The chart below showing the long-term trend reveals that culture has topped the list of items since spring 2013, following a large increase between spring 2012 and spring Maximum three answers 42
45 A national analysis reveals significant variations between Member States. Culture is in first place in 11 countries (compared with 16 in autumn 2017), with its highest score in Malta (39%) and its lowest in Croatia (20%). History tops the list in four Member States (compared with just one in autumn 2017), with its highest and lowest scores in the Czech Republic (35%) and Cyprus (12%) respectively. Values also ranks highest in four countries (compared with one in autumn 2017), with the highest score in Finland (34%), and the lowest in Latvia (14%). The economy is seen as the most unifying factor by respondents in two Member States (compared with one in autumn 2017), with its highest score in the Netherlands (34%) and its lowest score in Slovakia and Bulgaria (14% in both countries). In three countries (compared with four in autumn 2017), geography tops the list, though it ranks only fifth in the European average. Geography obtained its highest score in the Netherlands (41%) and its lowest in Cyprus (9%). Sports is ranked first in Ireland and Slovenia (32% in both countries); this was in first place in the same two countries in autumn Respondents in Bulgaria and Portugal (both 9%) are least likely to mention this item. Lastly, respondents in Italy mention culture and history jointly as the factors that most create a feeling of community among EU citizens (both 24%), while respondents in Romania do the same with culture and values (both 21%). 43

46 Maximum three answers 44
47 2 Rights as European citizens A majority of Europeans know their rights as citizens of the EU, but two-thirds say they would like to know more More than half of Europeans say that they know their rights as citizens of the European Union (54%, unchanged since autumn 2017) 9, while just under half do not share this opinion (45%, =) and 1% (=) answered don t know. However, two-thirds of respondents would like to know more about their rights as citizens of the European Union (67%, down one percentage point since autumn 2017, including 26% who answered yes, definitely, =) 10. However, almost a third of respondents do not want more information on this subject (31%, +1 percentage point). 9 QD2.2. For each of the following statements, please tell me to what extent it corresponds or not to your opinion. You know what your rights are as a citizen of the EU 10 QD2.3. For each of the following statements, please tell me to what extent it corresponds or not to your opinion. You would like to know more about your rights as a citizen of the EU 45
48 46
, Finland (73%), Poland (71%)")
, Bulgaria (63% vs. 34%), Italy (61% vs. 38%), Greece (58% vs. 42%), Croatia (54% vs.")


49 A majority of respondents in 21 EU Member States (compared with 20 in autumn 2017) feel that they know their rights as citizens of the European Union, most strikingly in Luxembourg (76%), Finland (73%), Poland (71%) and Germany (70%). This applies to only a minority of respondents in six countries: France (66% no, vs. 33% yes ), Bulgaria (63% vs. 34%), Italy (61% vs. 38%), Greece (58% vs. 42%), Croatia (54% vs. 45%) and the Czech Republic (53% vs. 45%). In Belgium, there is an even split in responses (50% vs. 50%). A majority of respondents would like to know more about their rights as citizens of the European Union in 27 EU Member States (the same number as in autumn 2017), led by Cyprus (94%), Malta (79%) and Spain (78%). As in autumn 2017, the United Kingdom is the only country where a majority do not want to learn more about their rights (45% yes, vs. 52% no ). 47
50 In terms of evolutions since autumn 2017, the proportion of respondents who say that they know their rights as citizens of the European Union has risen in 14 EU Member States, most notably in Romania (50%, +8 percentage points) and Cyprus (63%, +7), but has fallen in 12 countries, in particular in Bulgaria (34% -6), while the proportion is stable in Belgium and Denmark. The desire to learn more about the rights of citizens of the European Union has increased since autumn 2017 in 10 EU Member States, most notably in the Czech Republic (68%, +6 percentage points), but has weakened in 16 countries, in particular in Sweden (69%, -8). The desire for more information is unchanged in Latvia and Poland. 48

51 The following tables show the results by socio-demographic criteria in the European Union as a whole (EU28 average), in the six largest EU countries and in the countries benefiting or having benefited from European Union support to deal with the financial and economic crisis. 49
 of respondents consider that the Member States of the European Union are close in terms")
 answered don t know.")
, the Czech Republic (70%) and Poland (69%).")
52 IV. SOCIAL ISSUES AND VALUES 1. The existence of shared European values A majority (53%) of respondents consider that the Member States of the European Union are close in terms of shared values (+1 percentage point since autumn 2017) 11, while more than four in ten think that they are distant (41%, unchanged), and 6% (-1) answered don t know. A majority of respondents in 24 countries (compared with 22 in autumn 2017) think that the Member States of the European Union are close in terms of shared values. This view is the most widely held in Ireland (77%), the Czech Republic (70%) and Poland (69%). A majority of respondents in four countries believe that they are distant: in Latvia (64% distant, vs. 32% close ), France (56% vs. 39%), Belgium (58% vs. 41%) and Spain (52% vs. 42%). 11 QD8. In your opinion, in terms of shared values, are EU Member States...? 50
53 In terms of evolutions since autumn 2017, the feeling that the Member States of the European Union are close in terms of shared values has gained ground in 13 countries, led by Ireland (77%, +8 percentage points), Greece (51%, +8) and Poland (69%, +7), but has decreased in 10 EU Member States, most notably in Spain (42%, -10) and Belgium (41%, -6). In five countries, this feeling has remained unchanged. As a result of these evolutions, a majority of respondents now feel that Member States are close in terms of values in Greece (51% close vs. 46% distant, compared with 43% vs. 55% in autumn 2017), Cyprus (50% close vs. 45% distant, compared with 45% vs. 50% in autumn 2017) and Sweden (51% close vs. 47% distant, compared with 47% vs. 51% in autumn 2017), but this is now the minority view in Spain (42% vs. 52%, compared with 52% vs. 42%). 51
54 The following tables show the results by socio-demographic criteria in the European Union as a whole (EU28 average), in the six largest EU countries and in the countries benefiting or having benefited from European Union support to deal with the financial and economic crisis. 52

55 2. The personal values of Europeans Three values continue to head the list of values that matter most to Europeans personally: peace, human rights and respect for human life Maximum three answers In order to determine the values which matter the most to Europeans personally, respondents were asked to choose up to three values from a list of : Peace continues to top the list of the personal values of Europeans (45%, unchanged since autumn 2017), and this remains three percentage points ahead of human rights (42%, =); The only other item mentioned by more than a third of respondents, respect for human life, completes the leading trio of values that matter most to Europeans (37%, +1 percentage point); Next, three values are mentioned by more than one in five respondents: democracy (27%, -1), in fourth position ahead of individual freedom (24%, =) and equality (21%, +1); The next three values are each mentioned by around one in six respondents: the rule of law remains in seventh place (18%, =), ahead of tolerance (16%, =), still in eighth place but now equal with solidarity (16%, +1); Lastly, three other values are mentioned by fewer than one in ten respondents: respect for other cultures (9%, =), now equal in tenth place with self-fulfilment (9%, +1), ahead of religion (5%, -1), once again in twelfth and last place. 12 QD6. In the following list, which are the three most important values for you personally? 53
56 Maximum three answers The national analysis shows that the three most frequently mentioned values at European level are the only ones that also top the list of the values that matter most personally in each of the 28 EU Member States. In 16 EU Member States (compared with 18 in autumn 2017), peace is the value that matters most to respondents. It obtains its highest score in the Czech Republic and Estonia (56% in both countries), and its lowest in Romania (26%). Human rights occupy first place in six EU Member States (as in autumn 2017): Cyprus (61%), Sweden (59%), Denmark (49%), Spain (48%), Poland (46%) and Romania (40%). Respondents in Malta (29%) are the least likely to mention this value. Peace and human rights share first place in Latvia (51% for both values). Respect for human life tops the list of personal values in two countries (just one in autumn 2017): Ireland (53%) and Italy (39%). Respondents in Slovakia (26%) are the least likely to mention respect for human life. Peace and respect for human life share first place in the United Kingdom (41% for both values) and Belgium (40%). In Portugal, human rights and respect for human life share first place (42% for both values). Since autumn 2017, two values have undergone national evolutions of ten or more percentage points. The proportion of respondents mentioning peace has decreased in 10 EU Member States, led by Malta (45%, -10 percentage points), while it has increased in 13 countries and is unchanged in five others. Mentions of human rights have declined in 13 EU Member States, in particular in Malta (29%, -16 percentage points). However, this item is also up in 13 countries and stable in Italy and the United Kingdom. 54
57 In addition, there have been a number of changes of more than five percentage points for mentions of respect for human life. This has increased in 17 EU Member States, most notably in Luxembourg (46%, +7 percentage points) and Portugal (42%, +7). On the other hand, it has decreased in eight countries, in particular in Cyprus (44%, -6) and Croatia (31%, -6), and is unchanged in three EU Member States. Maximum three answers 55
58 Maximum three answers 56

59 The following tables show the results by socio-demographic criteria in the European Union as a whole (EU28 average), in the six largest EU countries and in the countries benefiting or having benefited from European Union support to deal with the financial and economic. Maximum three answers Maximum three answers 57
60 Maximum three answers Maximum three answers 58
61 Maximum three answers Maximum three answers 59

62 3 The values that best represent the European Union For Europeans, peace, human rights and democracy are the values that best represent the European Union Maximum three answers Using the same list of 12 values as for the previous question, respondents were then asked to choose those that they feel best represent the European Union 13. They could give up to three answers: Peace stands out as the value best representing the European Union (39%, -1 percentage point since autumn 2017), followed by human rights (33%, =) in second place, now ahead of democracy (32%, -1) in third position; In fourth place, mentioned by more than one in five respondents, is the rule of law (22%, =); Solidarity has gained ground slightly and is now ranked fifth (18%, +2), ahead of respect for human life (16%, +1) in sixth place, and individual freedom (15%, -1), which is now down to seventh place; Respect for other cultures (14%, +1) stands in eighth place, ahead of equality and tolerance (both 12%, =), which are equal in ninth place; Lastly, self-fulfilment (4%, =) and religion (3%, =) are rarely mentioned by respondents. 13 QD7. In the following list, which values best represent the EU? 60
63 Maximum three answers There are three values that occupy first place in each of the 28 EU Member States, and these are the same three values that are most closely associated with the European Union at European level. Peace leads the values that best represent the European Union in 19 countries (compared with 17 in autumn 2017). It obtained its highest score in Sweden and the Netherlands (53% in both countries), and its lowest in Portugal (24%). In six EU Member States (as in autumn 2017), human rights top the list: Belgium (46%), Cyprus (43%), Latvia (41%), Ireland (35%), Romania (33%) and the United Kingdom (30%). Human rights obtained the lowest score in Italy (23%). Democracy is ranked first in three countries (compared with four in autumn 2017): Croatia (40%), Spain (35%) and Portugal (30%). However, it obtained its highest score in Denmark and Sweden (46% in both countries), and its lowest in the United Kingdom (23%). Since autumn 2017 there have been evolutions of ten percentage points for two values. The proportion of respondents mentioning democracy has increased in 11 EU Member States and also decreased in 11 countries, notably Malta (29%, -10 percentage points), and is unchanged in six. The proportion of respondents for whom respect for human life is one of the values that best represent the European Union has decreased in ten Member States, most strikingly in Malta (12%, -10). However, it has increased in 13 EU Member States and is unchanged in five. In addition, both peace and human rights have seen more than one evolution of more than five percentage points. Mentions of peace have increased in eight EU Member States, but have decreased in 15 countries, most strongly in Sweden (53%, -8) and Romania (25%, -7). It is unchanged in five countries. Human rights has gained ground in 11 EU Member States, but has lost ground in 13 countries, most notably Malta (24%, -7) and the United Kingdom (30%, -6), and is stable in four countries. 61
64 Maximum three answers 62
65 Maximum three answers 63
, but is only sixth among the values most closely associated with the European Union (16%).")
66 The order of the values that matter most to Europeans personally is different from that of the values that best represent the European Union. For example, respect for human life is third among the personal values of Europeans (37%), but is only sixth among the values most closely associated with the European Union (16%). Similarly, seven other values are mentioned more frequently at personal than at European Union level: peace (45% vs. 39%), human rights (42% vs. 33%), individual freedom (24% vs. 15%), equality (21% vs. 12%), tolerance (16% vs. 12%), self-fulfilment (9% vs. 4%) and religion (5% vs. 3%). In contrast, democracy (32% at EU level vs. 27% personally), the rule of law (22% vs. 18%), solidarity (18% vs. 16%) and respect for other cultures (14% vs. 9%) are more likely to be seen as values associated with the European Union than as values that count the most personally. 64
67 The following tables show the results by socio-demographic criteria in the European Union as a whole (EU28 average), in the six largest EU countries and in the countries benefiting or having benefited from European Union support to deal with the financial and economic crisis. Maximum three answers Maximum three answers 65
68 Maximum three answers Maximum three answers 66
69 Maximum three answers Maximum three answers 67

70 Maximum three answers 68
 have a lot in common (77%, +1 percentage point since autumn 2017), while more than a fifth disagree (21%, unchanged) and 2% (-1) answered don t know ;")
; A similar proportion of respondents have confidence in the future (69%, +1), while 28% (-1) are pessimistic.")
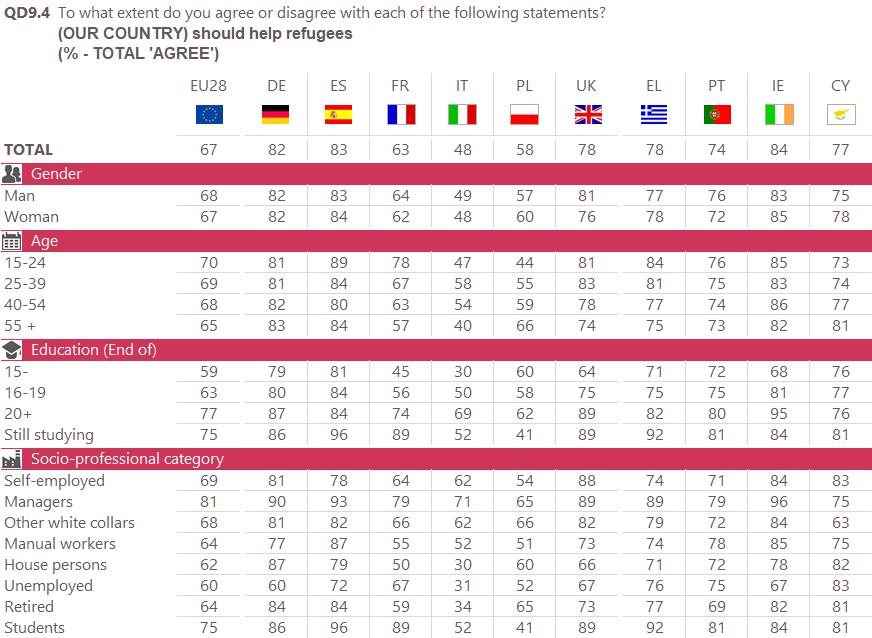
71 4 Social issues Europeans continue to be divided as to the contribution of immigrants to their country Respondents were asked a series of questions on social issues 14 : More than three-quarters of respondents agree that people in (OUR COUNTRY) have a lot in common (77%, +1 percentage point since autumn 2017), while more than a fifth disagree (21%, unchanged) and 2% (-1) answered don t know ; Seven in ten respondents agree with the statement that you understand well what is going on in today s world (70%, unchanged since autumn 2017), while less than three in ten Europeans feel they do not understand today s world (28%, =); A similar proportion of respondents have confidence in the future (69%, +1), while 28% (-1) are pessimistic. Only 3% (=) answered don t know ; Two-thirds of Europeans agree that (OUR COUNTRY) should help refugees (67%, unchanged since autumn 2017), while 27% (=) take the opposite view and 6% (=) expressed no opinion; More than half the respondents share the view that overall [their] quality of life [ ] was better before (51%, unchanged), while more than four in ten respondents disagree (42%, -1) and 7% (+1) expressed no opinion; Lastly, a narrow majority of Europeans agree that immigrants contribute a lot to (OUR COUNTRY) (48%, unchanged), while 45% (=) take the opposite view and 7% (=) answered don t know. 14 QD9. To what extent do you agree or disagree with each of the following statements? The State intervenes too much in our lives; Immigrants contribute a lot to (OUR COUNTRY); People in (OUR COUNTRY) have a lot of things in common; You understand well what is going on in today s world; (OUR COUNTRY) should help refugees; Overall, regarding your quality of life, it was better before; You have confidence in the future 69

 the only country where more than a third of the population (35%) disagree")
72 a. Things in common in the respondent s country More than six in ten respondents in all Member States say that people in their country have a lot of things in common. This view is the most widespread in Ireland (96%), Cyprus (94%), and Portugal and Sweden (92% in both countries). It is the least prevalent in France (61%) the only country where more than a third of the population (35%) disagree with this statement and in Slovenia and Luxembourg (67% in both countries). 70
73 Since autumn 2017 the proportion of respondents who agree that people in (OUR COUNTRY) have a lot of things in common has increased in 12 EU Member States, most notably in Luxembourg (67%, +9 percentage points). It has decreased in 11 countries, most strikingly in Malta (79%, -9). It is stable in five Member States. 71
 have a lot of things in common, and variations between groups are relatively minor.")
74 A socio-demographic analysis shows that at least seven in ten respondents in all sociodemographic categories agree that people in (OUR COUNTRY) have a lot of things in common, and variations between groups are relatively minor. 72

.")
75 b. Understanding today s world More than half the respondents in 27 EU Member States, as in autumn 2017, feel that they have a good grasp of what is going on in today s world. This is particularly true in Cyprus (92%), the Netherlands and Ireland (both 88%), Denmark (86%), Sweden (85%) and Finland (84%). The Czech Republic remains the only country where less than half of respondents share this view, although equal proportions now agree and disagree (49% for both answers). 73
76 Since autumn 2017 the proportion of respondents who agree that they understand well what is going on in today s world has increased in 15 EU Member States, most strikingly in Portugal (68%, +7 percentage points). It has decreased in seven countries, in particular in Bulgaria (63%, -8), while it is stable in six EU Member States. 74
77 A socio-demographic analysis shows that a majority of respondents in all socio-demographic categories consider that they have a good grasp of what is going on in today s world. There are, however, some significant variations, in particular between Europeans who studied up to the age of 20 and beyond (78%) and managers (84%), and those who left school at the age of 15 or earlier and house persons (both 56%). 75
: Sweden (82%), Ireland (80%), Luxembourg (79%), the United Kingdom and Portugal (both 72%), Spain (61%), Finland (58%), Denmark (54%), Austria and")
, Estonia (13% vs.")
78 c. Immigrants The view that immigrants contribute a lot to (OUR COUNTRY) is shared by a majority of respondents in 12 EU Member States (compared with 11 in autumn 2017): Sweden (82%), Ireland (80%), Luxembourg (79%), the United Kingdom and Portugal (both 72%), Spain (61%), Finland (58%), Denmark (54%), Austria and the Netherlands (both 53%), Germany (52%) and Malta (46% agree, vs. 45% disagree ). However, it is shared by only a minority of respondents in the 16 remaining EU countries, with its lowest scores in Latvia (10% vs. 85%), Estonia (13% vs. 79%), the Czech Republic (14% vs. 82%), Hungary (15% vs. 81%) and Bulgaria (15% vs. 72%). 76
79 In terms of evolutions since autumn 2017, the view that immigrants contribute a lot to (OUR COUNTRY) has gained ground in nine Member States, most strikingly in Malta (46%, +11 percentage points). It has lost ground in 15 countries, most notably in Slovenia (29%, -6) and is stable in four Member States. The change in Malta means that a majority now agree with the statement (46% agree, vs. 45% disagree ), whereas in autumn 2017 a minority agreed (35% vs. 59%). 77
 and Y, born after 1980 (52%) agree that immigrants contribute a lot to (OUR COUNTRY), as do respondents who studied up")
80 There are some clear differences between the various socio-demographic groups. More than half of respondents in generations X, born between 1965 and 1980 (51%) and Y, born after 1980 (52%) agree that immigrants contribute a lot to (OUR COUNTRY), as do respondents who studied up to the age of 20 and beyond (57%), managers (63%), self-employed people (53%) and students (58%). Agreement is much lower among Europeans born before 1946 (40%), those who left school at the age of 15 or earlier (39%), retired people (41%), house persons (41%) and unemployed respondents (42%). 78
, led by Sweden (91%), the Netherlands (89%) and Denmark (88%).")
, Bulgaria (29% vs. 54%), Slovakia (33% vs. 58%), Latvia (41% vs. 53%), Estonia (45% vs. 46%) and Romania (46% vs. 49%).")
81 d. Refugees A majority of respondents consider that (OUR COUNTRY) should help refugees in 21 EU Member States (compared with 22 in autumn 2017), led by Sweden (91%), the Netherlands (89%) and Denmark (88%). However, a majority of respondents disagree in seven countries: the Czech Republic (26% agree, vs. 67% disagree ), Hungary (28% vs. 68%), Bulgaria (29% vs. 54%), Slovakia (33% vs. 58%), Latvia (41% vs. 53%), Estonia (45% vs. 46%) and Romania (46% vs. 49%). In Romania, this is a change from autumn 2017 when a majority agreed (47% vs. 46%). 79
82 Since autumn 2017, the view that (OUR COUNTRY) should help refugees has gained ground in ten Member States, most strikingly in Greece (78%, +8 percentage points) and Portugal (74%, +7). It has lost ground in 14 countries, most notably in Slovenia (48%, -8). Lastly, it is unchanged in Denmark, Croatia, Italy and Estonia. 80
, people who are unemployed (60%) and those who have difficulties")
83 A socio-demographic analysis shows that a majority of respondents in all socio-demographic categories agree that (OUR COUNTRY) should help refugees. Though still the majority view, agreement is lower among those who left school at the age of 15 or earlier (59%), people who are unemployed (60%) and those who have difficulties paying bills most of the time (53%). 81
, Cyprus (77%) and Croatia (74%).")
, the Netherlands (22% vs. 72%), Sweden (24% vs. 72%) and Finland (26% vs. 68%). A majority now agree in Poland (48% vs.")
84 e. The quality of life was better before A majority of respondents in 18 EU Member States (as in autumn 2017) consider that the quality of life was better before, with the highest scores in Greece (92%), Cyprus (77%) and Croatia (74%). Only a minority of respondents share this view in the ten remaining countries, most notably Denmark (19% agree, vs. 70% disagree ), the Netherlands (22% vs. 72%), Sweden (24% vs. 72%) and Finland (26% vs. 68%). A majority now agree in Poland (48% vs. 44%), whereas there was an even split in autumn 2017 (47% vs. 47%). 82
85 Since autumn 2017 the feeling that, overall, the quality of life was better before has lost ground in 15 EU Member States, most notably in Lithuania (48%, -8 percentage points) and Cyprus (77%, -7). It has gained ground in 11 countries and is stable in Sweden and France. 83
, those who left school at the age of 15 or earlier (65%), retired people and housepersons (both 60%), those who have")
86 In the socio-demographic analysis, a majority of respondents in most sub-groups say that the quality of life was better before. The highest levels of agreement can be seen among those aged 55 or over (59%), those who left school at the age of 15 or earlier (65%), retired people and housepersons (both 60%), those who have difficulties paying bills most of the time (75%) and those who think of themselves as belonging to the working class (63%). By contrast, only a minority of respondents in the following groups agree with the statement: year olds (38%), those who finished education at the age of 20 or later (41%), managers (37%), students (34%), those who never or almost never have difficulties paying bills (43%), and those who say they belong either to the upper class (26%) or upper middle class (30%). 84


87 f. Confidence in the future A majority of respondents in 25 EU Member States (as in autumn 2017) have confidence in the future. Respondents in Denmark (91%), Ireland and the Netherlands (90% in both countries) and Finland (89%) are the most optimistic. In three countries a minority of respondents have confidence in the future: Greece (18% total agree vs. 81% total disagree ), Cyprus (40% vs. 59%) and Lithuania (40% vs. 57%). 85
88 In terms of evolutions, the proportion of respondents who have confidence in the future has increased in 17 EU Member States, most notably in the Czech Republic (60%, +7 percentage points) and Estonia (62%, +6), while it has decreased in nine countries and remains unchanged in Finland and Greece. 86
89 In the results by socio-demographic criteria, in nearly all groups a majority of respondents say they have confidence in the future. The only exception are respondents who have difficulties paying bills most of the time (42% agree vs. 56% disagree). 87
90 The following tables show the results by socio-demographic criteria in the European Union as a whole (EU28 average), in the six largest EU countries and in the countries benefiting or having benefited from European Union support to deal with the financial and economic crisis. 88
91 89
92 90
93 91
94 92
95 93

96 5 Europeans and the speed of European integration The current speed of European integration is slower than what respondents would like Respondents were shown the diagram below and asked which of the figures corresponded best with their opinion of the current speed of building Europe, and then which corresponded best to the speed they would like 15. The average score for the perceived current speed is 3.5 (unchanged from autumn 2017), just below the mid-point on the scale (4.0). The desired speed is greater: 5.0 on average (-0.1). The findings have generally remained stable over time, going back to However, since 2012 the gap between desired speed and current speed has been slightly greater than in preceding years. 15 QD10a. In your opinion, what is the current speed of building Europe? Please look at these figures. N 1 is standing still, N 7 is running as fast as possible. Choose the one which best corresponds with your opinion of the current speed of building Europe. QD10b And which corresponds best to the speed you would like? 94
EUROPEAN CITIZENSHIP
 Standard Eurobarometer 82 Autumn 2014 EUROPEAN CITIZENSHIP REPORT Fieldwork: November 2014 This survey has been requested and co-ordinated by the European Commission, Directorate-General for Communication.
EUROPEAN CITIZENSHIP
 Standard Eurobarometer 81 Spring 2014 EUROPEAN CITIZENSHIP REPORT Fieldwork: June 2014 This survey has been requested and co-ordinated by the European Commission, Directorate-General for Communication.
EUROPEAN CITIZENSHIP
 Standard Eurobarometer 80 Autumn 2013 EUROPEAN CITIZENSHIP REPORT Fieldwork: November 2013 This survey has been requested and co-ordinated by the European Commission, Directorate-General for Communication.
Standard Eurobarometer 88 Autumn Report. Media use in the European Union
 Media use in the European Union Fieldwork November 2017 Survey requested and co-ordinated by the European Commission, Directorate-General for Communication This document does not represent the point of
EUROPEAN CITIZENSHIP
 Standard Eurobarometer 78 Autumn 2012 EUROPEAN CITIZENSHIP REPORT Fieldwork: November 2012 This survey has been requested and co-ordinated by the European Commission, Directorate-General for Communication.
Special Eurobarometer 461. Report. Designing Europe s future:
 Designing Europe s future: Trust in institutions Globalisation Support for the euro, opinions about free trade and solidarity Fieldwork Survey requested by the European Commission, Directorate-General
EUROPEANS, THE EUROPEAN UNION AND THE CRISIS
 Standard Eurobarometer 80 Autumn 2013 EUROPEANS, THE EUROPEAN UNION AND THE CRISIS REPORT Fieldwork: November 2013 This survey has been requested and co-ordinated by the European Commission, Directorate-General
Standard Eurobarometer 89 Spring Report. Europeans and the future of Europe
 Fieldwork March 2018 Survey requested and co-ordinated by the European Commission, Directorate-General for Communication This document does not represent the point of view of the European Commission. The
MEDIA USE IN THE EUROPEAN UNION
 Standard Eurobarometer 76 Autumn 2011 MEDIA USE IN THE EUROPEAN UNION REPORT Fieldwork: November 2011 Publication: March 2012 This survey has been requested and co-ordinated by Directorate-General for
Special Eurobarometer 440. Report. Europeans, Agriculture and the CAP
 Survey requested by the European Commission, Directorate-General for Agriculture and Rural Development and co-ordinated by the Directorate-General for Communication This document does not represent the
PUBLIC OPINION IN THE EUROPEAN UNION
 Standard Eurobarometer 81 Spring 2014 PUBLIC OPINION IN THE EUROPEAN UNION FIRST RESULTS Fieldwork: June 2014 Publication: July 2014 This survey has been requested and co-ordinated by the European Commission,
Special Eurobarometer 464b. Report
 Europeans attitudes towards security Survey requested by the European Commission, Directorate-General for Migration and Home Affairs and co-ordinated by the Directorate-General for Communication This document
EUROPEANS ATTITUDES TOWARDS SECURITY
 Special Eurobarometer 432 EUROPEANS ATTITUDES TOWARDS SECURITY REPORT Fieldwork: March 2015 Publication: April 2015 This survey has been requested by the European Commission, Directorate-General for Migration
Special Eurobarometer 467. Report. Future of Europe. Social issues
 Future of Europe Social issues Fieldwork Publication November 2017 Survey requested by the European Commission, Directorate-General for Communication and co-ordinated by the Directorate- General for Communication
EUROPEAN CITIZENSHIP
 Standard Eurobarometer 77 Spring 2012 EUROPEAN CITIZENSHIP REPORT Fieldwork: May 2012 This survey has been requested and co-ordinated by the European Commission, Directorate-General for Communication.
Standard Eurobarometer 85. Public opinion in the European Union
 Public opinion in the European Union Fieldwork: May 2016 Survey conducted by TNS opinion & social at the request of the European Commission, Directorate-General for Communication Survey coordinated by
EUROBAROMETER The European Union today and tomorrow. Fieldwork: October - November 2008 Publication: June 2010
 EUROBAROMETER 66 Standard Eurobarometer Report European Commission EUROBAROMETER 70 3. The European Union today and tomorrow Fieldwork: October - November 2008 Publication: June 2010 Standard Eurobarometer
Standard Eurobarometer 89 Spring Public opinion in the European Union
 Public opinion in the European Union Fieldwork March 2018 Survey requested and co-ordinated by the European Commission, Directorate-General for Communication This document does not represent the point
Flash Eurobarometer 431. Report. Electoral Rights
 Electoral Rights Survey requested by the European Commission, Directorate-General for Justice and Consumers and co-ordinated by the Directorate-General for Communication This document does not represent
PUBLIC OPINION IN THE EUROPEAN UNION
 Standard Eurobarometer 77 Spring 2012 PUBLIC OPINION IN THE EUROPEAN UNION REPORT Fieldwork: May 2012 This survey has been requested and co-ordinated by the European Commission, Directorate-General for
EU DEVELOPMENT AID AND THE MILLENNIUM DEVELOPMENT GOALS
 Special Eurobarometer 405 EU DEVELOPMENT AID AND THE MILLENNIUM DEVELOPMENT GOALS REPORT Fieldwork: May - June 2013 Publication: November 2013 This survey has been requested by the European Commission,
Special Eurobarometer 469. Report
 Integration of immigrants in the European Union Survey requested by the European Commission, Directorate-General for Migration and Home Affairs and co-ordinated by the Directorate-General for Communication
Flash Eurobarometer 430. Summary. European Union Citizenship
 European Union Citizenship Survey requested by the European Commission, Directorate-General for Justice and Consumers and co-ordinated by the Directorate-General for Communication This document does not
Special Eurobarometer 455
 EU Citizens views on development, cooperation and November December 2016 Survey conducted by TNS opinion & social at the request of the European Commission, Directorate-General for International Cooperation
INTERNAL SECURITY. Publication: November 2011
 Special Eurobarometer 371 European Commission INTERNAL SECURITY REPORT Special Eurobarometer 371 / Wave TNS opinion & social Fieldwork: June 2011 Publication: November 2011 This survey has been requested
Special Eurobarometer 470. Summary. Corruption
 Corruption Survey requested by the European Commission, Directorate-General for Migration and Home Affairs and co-ordinated by the Directorate-General for Communication This document does not represent
Flash Eurobarometer 431. Summary. Electoral Rights
 Survey requested by the European Commission, Directorate-General for Justice and Consumers and co-ordinated by the Directorate-General for Communication This document does not represent the point of view
Special Eurobarometer 471. Summary
 Fairness, inequality and intergenerational mobility Survey requested by the European Commission, Joint Research Centre and co-ordinated by the Directorate-General for Communication This document does not
Special Eurobarometer 428 GENDER EQUALITY SUMMARY
 Special Eurobarometer 428 GENDER EQUALITY SUMMARY Fieldwork: November-December 2014 Publication: March 2015 This survey has been requested by the European Commission, Directorate-General for Justice and
Flash Eurobarometer 430. Report. European Union Citizenship
 European Union Citizenship Survey requested by the European Commission, Directorate-General for Justice and Consumers and co-ordinated by the Directorate-General for Communication This document does not
PUBLIC PERCEPTIONS OF SCIENCE, RESEARCH AND INNOVATION
 Special Eurobarometer 419 PUBLIC PERCEPTIONS OF SCIENCE, RESEARCH AND INNOVATION SUMMARY Fieldwork: June 2014 Publication: October 2014 This survey has been requested by the European Commission, Directorate-General
PUBLIC OPINION IN THE EUROPEAN UNION
 Standard Eurobarometer 79 Spring 2013 PUBLIC OPINION IN THE EUROPEAN UNION FIRST RESULTS Fieldwork: May 2013 Publication: July 2013 This survey has been requested and co-ordinated by the European Commission,
EUROPEAN UNION CITIZENSHIP
 Flash Eurobarometer EUROPEAN UNION CITIZENSHIP REPORT Fieldwork: November 2012 Publication: February 2013 This survey has been requested by the European Commission, Directorate-General Justice and co-ordinated
The European emergency number 112
 Flash Eurobarometer The European emergency number 112 REPORT Fieldwork: December 2011 Publication: February 2012 Flash Eurobarometer TNS political & social This survey has been requested by the Directorate-General
Europeans attitudes towards climate change
 Special Eurobarometer 313 EUROPEAN PARLIAMENT EUROPEAN COMMISSION Europeans attitudes towards climate change Special Eurobarometer 313 / Wave 71.1 TNS Opinion & Social Report Fieldwork: January - February
PATIENTS RIGHTS IN CROSS-BORDER HEALTHCARE IN THE EUROPEAN UNION
 Special Eurobarometer 425 PATIENTS RIGHTS IN CROSS-BORDER HEALTHCARE IN THE EUROPEAN UNION SUMMARY Fieldwork: October 2014 Publication: May 2015 This survey has been requested by the European Commission,
Directorate General for Communication Direction C - Relations avec les citoyens PUBLIC OPINION MONITORING UNIT 27 March 2009
 Directorate General for Communication Direction C - Relations avec les citoyens PUBLIC OPINION MONITORING UNIT 27 March 2009 EUROPEANS AND THE ECONOMIC CRISIS Standard Eurobarometer (EB 71) Population:
PUBLIC OPINION IN THE EUROPEAN UNION
 Standard Eurobarometer 77 Spring 2012 PUBLIC OPINION IN THE EUROPEAN UNION FIRST RESULTS Fieldwork: May 2012 Publication: July 2012 This survey has been requested and co-ordinated by the European Commission,
Standard Eurobarometer 88 Autumn Public opinion in the European Union
 Public opinion in the European Union Fieldwork November 2017 Survey requested and co-ordinated by the European Commission, Directorate-General for Communication This document does not represent the point
CITIZENS AWARENESS AND PERCEPTIONS OF EU REGIONAL POLICY
 Flash Eurobarometer CITIZENS AWARENESS AND PERCEPTIONS OF EU REGIONAL POLICY REPORT Fieldwork: June 2015 Publication: September 2015 This survey has been requested by the European Commission, Directorate-General
EUROBAROMETER 72 PUBLIC OPINION IN THE EUROPEAN UNION Volume 2
 Standard Eurobarometer European Commission EUROBAROMETER 72 PUBLIC OPINION IN THE EUROPEAN UNION Volume 2 REPORT Fieldwork: October - November 2009 Standard Eurobarometer 72 / Autumn 2009 - TNS opinion
Special Eurobarometer 474. Summary. Europeans perceptions of the Schengen Area
 Summary Europeans perceptions of the Schengen Area Survey requested by the European Commission, Directorate-General for Migration and Home Affairs and co-ordinated by the Directorate-General for Communication
Firearms in the European Union
 Flash Eurobarometer 383 Firearms in the European Union SUMMARY Fieldwork: September 2013 Publication: October 2013 This survey has been requested by the European Commission, Directorate-General for Home
EUROPEAN YOUTH: PARTICIPATION IN DEMOCRATIC LIFE
 Flash Eurobarometer 375 EUROPEAN YOUTH: PARTICIPATION IN DEMOCRATIC LIFE SUMMARY Fieldwork: April 2013 Publication: May 2013 This survey has been requested by the European Commission, Directorate-General
EUROBAROMETER 72 PUBLIC OPINION IN THE EUROPEAN UNION. Autumn The survey was requested and coordinated by Directorate-General Communication
 Standard Eurobarometer EUROBAROMETER 72 PUBLIC OPINION IN THE EUROPEAN UNION Autumn 2009 NATIONAL REPO Standard Eurobarometer 72 / Autumn 2009 TNS Opinion & Social UNITED KINGDOM The survey was requested
of the European Commission. and the Communication. This document of the authors. Standard Eurobarometer 75 / Spring 2011 TNS opinion & social
 Standard Eurobarometer European Commission EUROBAROMETER 75 SPRING 2011 Europeans, the European Union crisis and the REPORT Standard Eurobarometer 75 / Spring 2011 TNS opinion & social Fieldwork: May 2011
Standard Eurobarometer 77 Spring 2012 EUROPE 2020 REPORT
 Standard Eurobarometer 77 Spring 2012 EUROPE 2020 REPORT Fieldwork: May 2012 This survey has been requested and co-ordinated by the European Commission, Directorate-General for Communication. http://ec.europa.eu/public_opinion/index_en.htm
Standard Eurobarometer 90 Autumn Public opinion in the European Union
 Autumn 2018 Public opinion in the European Union Fieldwork November 2018 Survey requested and co-ordinated by the European Commission, Directorate-General for Communication This document does not represent
Flash Eurobarometer 429. Summary. The euro area
 LOGO CE_Vertical_EN_NEG_quadri rouge Summary Survey requested by the European Commission, Directorate-General for Economic and Financial Affairs and co-ordinated by the Directorate-General for Communication
Women in the EU. Fieldwork : February-March 2011 Publication: June Special Eurobarometer / Wave 75.1 TNS Opinion & Social EUROPEAN PARLIAMENT
 EUROPEAN PARLIAMENT Women in the EU Eurobaromètre Spécial / Vague 74.3 TNS Opinion & Social Fieldwork : February-March 2011 Publication: June 2011 Special Eurobarometer / Wave 75.1 TNS Opinion & Social
Flash Eurobarometer 364 ELECTORAL RIGHTS REPORT
 Flash Eurobarometer ELECTORAL RIGHTS REPORT Fieldwork: November 2012 Publication: March 2013 This survey has been requested by the European Commission, Directorate-General Justice and co-ordinated by Directorate-General
ATTITUDES OF EUROPEAN CITIZENS TOWARDS THE ENVIRONMENT
 Special Eurobarometer 416 ATTITUDES OF EUROPEAN CITIZENS TOWARDS THE ENVIRONMENT SUMMARY Fieldwork: April - May 2014 Publication: September 2014 This survey has been requested by the European Commission,
A. The image of the European Union B. The image of the European Parliament... 10
 Directorate General for Communication Direction C Relations with citizens PUBLIC OPINION MONITORING UNIT EUROPEAN ELECTIONS 2009 25/05/2009 Pre electoral survey First wave First results: European average
of the European Commission. Communication. This document of the authors. Standard Eurobarometer 75 / Spring 2011 TNS opinion & social
 Standard Eurobarometer European Commission EUROBAROMETER 75 SPRING 2011 Europe 2020 REPORT Standard Eurobarometer 75 / Spring 2011 TNS opinion & social Fieldwork: May 2011 Publication: August 2011 This
Flash Eurobarometer 408 EUROPEAN YOUTH SUMMARY
 Flash Eurobarometer 408 EUROPEAN YOUTH SUMMARY Fieldwork: December 2014 Publication: April 2015 This survey has been requested by the European Commission, Directorate-General for Education and Culture
The Rights of the Child. Analytical report
 Flash Eurobarometer 273 The Gallup Organisation Analytical Report Flash EB N o 251 Public attitudes and perceptions in the euro area Flash Eurobarometer European Commission The Rights of the Child Analytical
WOMEN IN DECISION-MAKING POSITIONS
 Special Eurobarometer 376 WOMEN IN DECISION-MAKING POSITIONS SUMMARY Fieldwork: September 2011 Publication: March 2012 This survey has been requested by Directorate-General Justice and co-ordinated by
Employment and Social Policy
 Special Eurobarometer 77 European Commission Employment and Social Policy SUMMARY Special Eurobarometer 77 / Wave EB76. TNS opinion & social Fieldwork: September- October 0 Publication: November 0 This
September 2012 Euro area unemployment rate at 11.6% EU27 at 10.6%
 STAT/12/155 31 October 2012 September 2012 Euro area unemployment rate at 11.6% at.6% The euro area 1 (EA17) seasonally-adjusted 2 unemployment rate 3 was 11.6% in September 2012, up from 11.5% in August
Special Eurobarometer 469
 Summary Integration of immigrants in the European Union Survey requested by the European Commission, Directorate-General for Migration and Home Affairs and co-ordinated by the Directorate-General for Communication
The Unitary Patent and the Unified Patent Court. Dr. Leonard Werner-Jones
 The Unitary Patent and the Unified Patent Court Dr. Leonard Werner-Jones Background The Past: No centralization at all Prosecution country-by-country Litigation country-by-country Patents actions 2 Background
Special Eurobarometer 468. Report. Attitudes of European citizens towards the environment
 Attitudes of European citizens towards the environment Fieldwork September- Publication November 2017 Survey requested by the European Commission, Directorate-General for Environment and co-ordinated by
EUROBAROMETER 73 FIRST RESULTS
 Standard Eurobarometer European Commission EUROBAROMETER 73 PUBLIC OPINION IN THE EUROPEAN UNION FIRST RESULTS Fieldwork: May 2010 Publication: August 2010 Standard Eurobarometer 73/ Spring 2010 - TNS
EUROBAROMETER 64 FIRST RESULTS
 Standard Eurobarometer European Commission PUBLIC OPINION IN THE EUROPEAN UNION FIRST RESULTS Fieldwork : October-November 2005 Publication : December 2005 Standard Eurobarometer 64 / Autumn 2005 - TNS
The European Emergency Number 112. Analytical report
 Flash Eurobarometer 314 The Gallup Organization Gallup 2 Flash Eurobarometer N o 189a EU communication and the citizens Flash Eurobarometer European Commission The European Emergency Number 112 Analytical
Euro area unemployment rate at 9.9% EU27 at 9.4%
 STAT/11/76 April 2011 Euro area unemployment rate at 9.9% EU27 at 9.4% The euro area 1 (EA17) seasonally-adjusted 2 unemployment rate 3 was 9.9% in April 2011, unchanged compared with March 4. It was.2%
ATTITUDES OF EUROPEANS TOWARDS TOURISM
 Flash Eurobarometer 370 ATTITUDES OF EUROPEANS TOWARDS TOURISM SUMMARY Fieldwork: January 2013 Publication: March 2013 This survey has been requested by the European Commission, Directorate-General for
CITIZENS AWARENESS AND PERCEPTIONS OF EU REGIONAL POLICY
 Flash Eurobarometer 384 CITIZENS AWARENESS AND PERCEPTIONS OF EU REGIONAL POLICY SUMMARY Fieldwork: September 2013 Publication: December 2013 This survey has been requested by the European Commission,
Data Protection in the European Union. Data controllers perceptions. Analytical Report
 Gallup Flash Eurobarometer N o 189a EU communication and the citizens Flash Eurobarometer European Commission Data Protection in the European Union Data controllers perceptions Analytical Report Fieldwork:
EUROBAROMETER 69 SPRING 2008 NATIONAL REPORT UNITED KINGDOM. Standard Eurobarometer PUBLIC OPINION IN THE EUROPEAN UNION
 Standard Eurobarometer 69 / Spring 2008 TNS Opinion & Social Standard Eurobarometer European Commission EUROBAROMETER 69 PUBLIC OPINION IN THE EUROPEAN UNION SPRING 2008 NATIONAL REPORT UNITED KINGDOM
Autumn 2018 Standard Eurobarometer: Positive image of the EU prevails ahead of the European elections
 European Commission - Press release Autumn 2018 Standard Eurobarometer: Positive image of the EU prevails ahead of the European elections Brussels, 21 December 2018 According to a new Eurobarometer survey
ERGP REPORT ON CORE INDICATORS FOR MONITORING THE EUROPEAN POSTAL MARKET
 ERGP (15) 27 Report on core indicators for monitoring the European postal market ERGP REPORT ON CORE INDICATORS FOR MONITORING THE EUROPEAN POSTAL MARKET 3 December 2015 CONTENTS 1. EXECUTIVE SUMMARY...
EUROBAROMETER 68 AUTUMN 2007 NATIONAL REPORT UNITED KINGDOM. Standard Eurobarometer PUBLIC OPINION IN THE EUROPEAN UNION
 Standard Eurobarometer European Commission EUROBAROMETER 68 PUBLIC OPINION IN THE EUROPEAN UNION AUTUMN 2007 Standard Eurobarometer 68 / Autumn 2007 TNS Opinion & Social NATIONAL REPORT UNITED KINGDOM
Europeans and the crisis
 EUROPEAN PARLIAMENT Europeans and the crisis Report Fieldwork: August September 2010 Publication: November 2010 Special Eurobarometer/Wave 74.1 TNS Opinion & Social Eurobaromètre spécial / Vague 74.1 TNS
Europeans attitudes towards climate change
 Special Eurobarometer European Commission Europeans attitudes towards climate change Fieldwork: August - September 2009 Publication: November 2009 Special Eurobarometer 322 / Wave 72.1 TNS Opinion & Social
Making a difference in the world: Europeans and the future of development aid
 Special Eurobarometer 375 European Commission Making a difference in the world: Europeans and the future of development aid REPORT Special Eurobarometer 375 / Wave 7.61 TNS opinion & social Fieldwork:
STANDARD EUROBAROMETER 74 INFORMATION ON EUROPEAN MATTERS - AUTUMN 2010 EUROBAROMETER 74 AUTUMN 2010 INFORMATION ON EUROPEAN POLITICAL MATTERS
 Standard Eurobarometer European Commission EUROBAROMETER 74 AUTUMN 2010 INFORMATION ON EUROPEAN POLITICAL MATTERS REPORT Fieldwork: November 2010 Publication: February 2011 Standard Eurobarometer 74 /
Flash Eurobarometer 405 THE EURO AREA SUMMARY
 Flash Eurobarometer 405 THE EURO AREA SUMMARY Fieldwork: October 2014 Publication: October 2014 This survey has been requested by the European Commission, Directorate-General for Economic and Financial
EUROBAROMETER 66 PUBLIC OPINION IN THE EUROPEAN UNION AUTUMN
 Standard Eurobarometer European Commission EUROBAROMETER 66 PUBLIC OPINION IN THE EUROPEAN UNION AUTUMN 2006 NATIONAL REPORT Standard Eurobarometer 66 / Autumn 2006 TNS Opinion & Social EXECUTIVE SUMMARY
The Rights of the Child. Analytical report
 The Gallup Organization Flash EB N o 187 2006 Innobarometer on Clusters Flash Eurobarometer European Commission The Rights of the Child Analytical report Fieldwork: February 2008 Report: April 2008 Flash
Civil protection Full report
 Special Eurobarometer European Commission Civil protection Full report Fieldwork: September-October 2009 Publication: November 2009 Special Eurobarometer 328 / Wave TNS Opinion & Social This survey was
Malta-Valletta: Provision of interim services for EASO 2017/S Contract award notice. Results of the procurement procedure.
 1 / 10 This notice in TED website: http://ted.europa.eu/udl?uri=ted:notice:241884-2017:text:en:html Malta-Valletta: Provision of interim services for EASO 2017/S 120-241884 Contract award notice Results
Young people and science. Analytical report
 Flash Eurobarometer 239 The Gallup Organization The Gallup Organization Flash EB N o 187 2006 Innobarometer on Clusters Flash Eurobarometer European Commission Young people and science Analytical report
ENTREPRENEURSHIP IN THE EU AND BEYOND
 Flash Eurobarometer 354 ENTREPRENEURSHIP IN THE EU AND BEYOND COUNTRY REPORT JAPAN Fieldwork: July 2012 This survey has been requested by the European Commission, Directorate-General Enterprise and Industry
European Parliament Eurobarometer (EB79.5) ONE YEAR TO GO UNTIL THE 2014 EUROPEAN ELECTIONS Institutional Part ANALYTICAL OVERVIEW
 ONE YEAR TO GO UNTIL THE 2014 EUROPEAN ELECTIONS Institutional Part ANALYTICAL OVERVIEW") Directorate-General for Communication Public Opinion Monitoring Unit Brussels, 21 August 2013. European Parliament Eurobarometer (EB79.5) ONE YEAR TO GO UNTIL THE 2014 EUROPEAN ELECTIONS Institutional
Directorate-General for Communication Public Opinion Monitoring Unit Brussels, 21 August 2013. European Parliament Eurobarometer (EB79.5) ONE YEAR TO GO UNTIL THE 2014 EUROPEAN ELECTIONS Institutional
Flash Eurobarometer 354. Entrepreneurship COUNTRY REPORT GREECE
 Flash Eurobarometer 354 Entrepreneurship COUNTRY REPORT GREECE Fieldwork: June 2012 This survey has been requested by the European Commission, Directorate-General Enterprise and Industry and co-ordinated
Malta-Valletta: Provision of interim services for EASO 2017/S Contract award notice. Results of the procurement procedure.
 1 / 8 This notice in TED website: http://ted.europa.eu/udl?uri=ted:notice:339167-2017:text:en:html Malta-Valletta: Provision of interim services for EASO 2017/S 165-339167 Contract award notice Results
Alternative views of the role of wages: contours of a European Minimum Wage
 Alternative views of the role of wages: contours of a European Minimum Wage Europe at a crossroads which way to quality jobs and prosperity? ETUI-ETUC Conference Brussels, 24-26 September 2014 Dr. Torsten
Convergence: a narrative for Europe. 12 June 2018
 Convergence: a narrative for Europe 12 June 218 1.Our economies 2 Luxembourg Ireland Denmark Sweden Netherlands Austria Finland Germany Belgium United Kingdom France Italy Spain Malta Cyprus Slovenia Portugal
The. Special Eurobarometer 368. Special Eurobarometer 368 / Wave EB 75.3 TNS opinion & social. This document. of the authors.
 Special Eurobarometer 368 European Commission The Common Agricultural Policy REPORT Special Eurobarometer 368 / Wave TNS opinion & social Fieldwork: May 2011 Publication: September 2011 This survey has
CULTURAL ACCESS AND PARTICIPATION
 Special Eurobarometer 399 CULTURAL ACCESS AND PARTICIPATION SUMMARY Fieldwork: April May 2013 Publication: November 2013 This survey has been requested by the European Commission, Directorate-General for
Views on European Union Enlargement
 Flash Eurobarometer 257 The Gallup Organization Flash EB N o 255 Dual circulation period, Slovakia Flash Eurobarometer European Commission Views on European Union Enlargement Analytical Report Fieldwork:
The European Emergency Number 112
 Gallup 2 Flash Eurobarometer N o 189a EU communication and the citizens Flash Eurobarometer European Commission The European Emergency Number 112 Summary Fieldwork: January 2008 Publication: February 2008
Special Eurobarometer 468. Attitudes of European citizens towards the environment
 Attitudes of European citizens towards the environment Fieldwork September- Publication November 2017 Survey requested by the European Commission, Directorate-General for Environment and co-ordinated by
HB010: Year of the survey
 F4: Quality of life HB010: Year of the survey Year (four digits) Flags 2018 Operation 158 F4: Quality of life HB020: Country Reference period Constant Mode of collection Frame BE Belgique/Belgïe BG Bulgaria
Electoral rights of EU citizens. Analytical Report
 Flash Eurobarometer 292 The Gallup Organization Flash EB No 292 Electoral Rights Analytical Report Flash Eurobarometer European Commission Electoral rights of EU citizens Analytical Report Fieldwork: March
Context Indicator 17: Population density
 3.2. Socio-economic situation of rural areas 3.2.1. Predominantly rural regions are more densely populated in the EU-N12 than in the EU-15 Context Indicator 17: Population density In 2011, predominantly
ENTREPRENEURSHIP IN THE EU AND BEYOND
 Flash Eurobarometer 354 ENTREPRENEURSHIP IN THE EU AND BEYOND COUNTRY REPORT GERMANY Fieldwork: June 2012 This survey has been requested by the European Commission, Directorate-General Enterprise and Industry
Report on women and men in leadership positions and Gender equality strategy mid-term review
 EUROPEAN COMMISSION MEMO Brussels, 14 October 2013 Report on women and men in leadership positions and Gender equality strategy mid-term review 1. New Report on Women in Decision-Making: What is the report
Post-electoral survey 2009
 Special Eurobarometer EUROPEAN PARLIAMENT European Commission Post-electoral survey 2009 Report Fieldwork: June-July 2009 Publication: November 2009 Special Eurobarometer 320/ Wave TNS opinion & social