Europeans attitudes towards climate change
|
|
|
- Timothy Douglas
- 6 years ago
- Views:
Transcription
1 Special Eurobarometer European Commission Europeans attitudes towards climate change Fieldwork: August - September 2009 Publication: November 2009 Special Eurobarometer 322 / Wave 72.1 TNS Opinion & Social This survey was requested and coordinated by the Directorate-General for Communication ( Research and Political Analysis Unit) This document does not represent the point of view of the European Commission. The interpretations and opinions contained in it are solely those of the authors.
2
3 Special Eurobarometer 322 EUROPEANS ATTITUDES TOWARDS CLIMATE CHANGE Conducted by TNS Opinion & Social at the request of Directorate General Communication Survey co-ordinated by Directorate General Communication TNS Opinion & Social Avenue Herrmann Debroux, Brussels Belgium
4
5 Table of contents INTRODUCTION PERCEPTIONS OF CLIMATE CHANGE Climate change is the second most serious problem faced by the world today All answers First answers Socio-demographic analysis Europeans perceptions of the seriousness of climate change TAKING ACTION ON CLIMATE CHANGE Which sector of European Society is viewed as most active in tackling climate change? The European Union National Governments Regional and local authorities Corporations and Industry The citizens themselves European attitudes to the process of climate change Climate change can be stopped Seriousness of climate change has not been exaggerated Impact of CO 2 emissions...48 The environment vs. the economy Alternative fuels Taking personal action Ways that European citizens are taking personal action PAYING MORE FOR ALTERNATIVE ENERGY?...79 CONCLUSION...86 ANNEX TECHNICAL SPECIFICATIONS QUESTIONNAIRE TABLES 1
6
7 INTRODUCTION This report presents the results of a survey on the attitudes of Europeans towards climate change which was carried out in late August and September is a watershed year for fighting climate change, with world leaders meeting at the United Nations Climate Change Conference (COP15) in Copenhagen in December to try and reach a follow-up agreement to the Kyoto Protocol. As this time grows closer there has been an increasing focus in the international media on the conference, on climate change, and on the various measures needed to curb its impact. Since the EU adopted ambitious climate and energy targets for 2020 in December 2008 many countries have also seen a more active dialogue about climate change taking place. The EU has launched its own climate change campaign website to provide general information to the public as well as to suggest ways for individual actions 1. But what do Europeans actually think about climate change? This survey mapped the opinion of Europeans on a range of climate change related topics, and in particular covers: Respondents perceptions of climate change in relation to other world problems. Respondents perceptions of the seriousness of climate change. Respondents perceptions about the actions of local, national governments as well as the EU in combating climate change Respondents' attitudes towards alternative fuels and CO² emissions. Whether respondents feel that climate change is stoppable or has been exaggerated, and what impact it has on the European economy. Whether respondents have taken personal action to fight climate change, and what those actions are. Perceived relative importance of the economy and the environment Europeans willingness to pay more for greener energy 1 2
8 This Eurobarometer survey was commissioned by European Commission's Directorate General for Communication. It was carried out by TNS Opinion & Social network between 28th August and 17th September The methodology used is that of Special Eurobarometer surveys as carried out by Directorate General for Communication ( Research and Political Analysis Unit) 2. A technical note on the methodology for interviews conducted by the institutes within the TNS Opinion & Social network is annexed to this report. This note indicates the interview methods and the confidence intervals 3. This survey first looks at results at the EU level and then at country level. Comparisons to previous surveys conducted in January-February 2009 (EB71.1) 4 and in March-April 2008 (EB69.2) 5 have also been made. Where appropriate, a variety of sociodemographic variables - such as respondents gender, age, education, and occupation - have been used to provide greater insight. In addition, the following key variable was used in the analysis to gain deeper insight into Europeans views on climate change: Their perception of the seriousness of climate change: taken from QB2: "How serious a problem do you think climate change is at this moment? Please use a scale from 1 to 10, 1 would mean that it is not a serious problem at all and 10 would mean that it is extremely serious." The results tables are included in the annex. It should be noted that the total of the percentages in the tables of this report may exceed 100% when the respondent can give several answers to the same question
9 In this report, the countries are represented by their official abbreviations. The abbreviations used in this report correspond to: ABBREVIATIONS EU27 DK/NA BE BG CZ DK D-E DE D-W EE EL ES FR IE IT CY LT LV LU HU MT NL AT PL PT RO SI SK FI SE UK European Union 27 Member States Don t know / No answer Belgium Bulgaria Czech Republic Denmark East Germany Germany West Germany Estonia Greece Spain France Ireland Italy Republic of Cyprus Lithuania Latvia Luxembourg Hungary Malta The Netherlands Austria Poland Portugal Romania Slovenia Slovakia Finland Sweden The United Kingdom 4
10 1. PERCEPTIONS OF CLIMATE CHANGE This first section reviews the perceptions of Europeans about the seriousness of climate change and global warming, and their relative importance when compared with other world issues. 1.1 Climate change is the second most serious problem faced by the world today All answers Respondents were asked what they considered to be the most serious problems our world faces 6. Looking first at the total aggregate of respondents answers 7, 69% think that poverty, the lack of food and drinking water is the most serious problem. This represents a slight increase from the 66% recorded in January-February Ranking second is climate change, with 47% considering it one of the most serious problems facing the world today. Ranking third is a major global economic downturn which decreased mentions from 52% in January-February 2009 to 39% in August-September This decrease in mentions for an economic downturn has seen climate change move into second position, although in absolute terms the proportion fell slightly from 50% in January-February 2009 to 47% in this survey. However, compared to March- April 2008, the fall is more significant, from 62% to 47%. While at this time, just 6 points separated poverty, the lack of food and drinking water (68%), and climate change (62%), the gap is now 22 percentage points. However, it is important to note that climate change ranks second by a reasonable margin. It is also worth considering that lack of food and drinking water might, in some cases, be connected to the effects of climate change (such as changing weather patterns and the impact on agriculture). 6 QB1 In your opinion, which of the following do you consider to be the most serious problem currently facing the world as a whole? Firstly? Any others? (MAX 3 answers) 7 This analysis is based on all answers given by the respondents (i.e. first and other answers) 5
11 After these three issues, respondents consider international terrorism as a serious problem (35%), although mentions have decreased since January-February 2009 (42%). Ranking fifth is the spread of an infectious disease, mentioned by 32% of respondents. This is almost double the mentions from January-February 2009 (18%, and ranked last). It is most likely that this increase is due to the survey being run during the summer H1N1 influenza pandemic. Fewer respondents mentioned Armed conflicts (29%, down from 39% in January- February 2009), and the proliferation of nuclear weapons (15%, down from 19%) as the most serious problems facing the world. There has been a slight increase in mentions for the increasing world population (24%, up from 19%), but overall mentions for this issue are still low compared to the other issues raised. The following chart gives an overview of these results. QB1T In your opinion, which of the following do you consider to be the most serious problem currently facing the world as a whole? Firstly? Any others? (MAX. 4 ANSWERS) - % EU EB69.2 Mar. -Apr EB71.1 Jan.-Feb EB72.1 Aug.-Sep % 69% 66% 62% 52% 53% 50% 47% 42% 39% 35% 24% 23% 18% 32% 38% 39% 29% 24% 23% 19% 19% 19% 15% Poverty, lack of food and drinking water Climate change A major global economic downturn International terrorism The spread of an infectious disease Armed conflicts The increasing world population The proliferation of nuclear weapons 6


12 Looking now at the individual EU countries, climate change is the top global concern only in Slovenia and in Denmark. It is viewed as a serious problem by respondents in these two countries and in Sweden, Greece, Luxembourg and Austria. By comparison, respondents of Portugal, Latvia, Estonia and Poland are less likely to mention climate change as one of the most serious problems facing the world today. Poverty and the lack of food and drinking water is considered the most important problem facing the world in 21 Member States, and particularly by the French and the Swedes, with 80% mentioning this issue. 7
13 Bulgaria, Lithuania, Latvia and the Czech Republic - mention a major global economic downturn as the most serious global issue. International terrorism is most mentioned as a concern by respondents in Denmark, with a cluster of other countries including Spain, the UK, Malta and Slovakia also rating this issue highly. Respondents in the Netherlands and Estonia are the most likely to mention armed conflicts. With the H1N1 influenza pandemic still underway it is not surprising that at least 1 in 5 respondents in each country mention the spread of an infectious disease. This is a particular concern for the Cypriots and for those in Greece, Slovenia, Hungary, Malta, and Ireland, where it is mentioned by at least half of the respondents. The increasing world population is mainly mentioned by respondents of Sweden and the Netherlands, and the proliferation of nuclear weapons by Cypriots and the French. 8
14 QB1T Which do you consider to be the most serious problems currently facing the world as a whole? (MAX. 4 ANSWERS)* Poverty, lack of food and drinking water Climate change A major global economic downturn International terrorism The spread of an infectious disease Armed conflicts The increasing world population The proliferation of nuclear weapons Other (SPONTA- NEOUS) None (SPONTA- NEOUS) DK EU27 69% 47% 39% 35% 32% 29% 24% 15% 1% 1% 2% BE 70% 52% 38% 32% 24% 30% 25% 16% 1% 0% 0% BG 67% 44% 71% 38% 33% 20% 8% 16% 0% 0% 3% CZ 47% 36% 63% 36% 44% 29% 15% 15% 0% 0% 1% DK 66% 69% 44% 47% 29% 38% 30% 20% 0% 0% 1% DE 72% 57% 46% 34% 25% 31% 36% 20% 0% 0% 2% EE 62% 29% 51% 31% 40% 42% 27% 13% 2% 1% 3% IE 62% 46% 50% 29% 50% 21% 27% 15% 1% 0% 5% EL 76% 71% 54% 25% 58% 13% 14% 19% 2% 0% 0% ES 76% 40% 32% 42% 24% 34% 13% 15% 2% 0% 1% FR 80% 57% 33% 33% 26% 28% 30% 21% 0% 0% 1% IT 63% 32% 33% 35% 44% 18% 12% 15% 2% 1% 4% CY 76% 64% 56% 24% 67% 31% 24% 21% 3% 0% 0% LV 58% 28% 65% 24% 38% 35% 13% 6% 2% 0% 4% LT 57% 32% 68% 24% 30% 28% 15% 13% 2% 1% 5% LU 77% 67% 28% 39% 27% 29% 34% 18% 0% 0% 1% HU 78% 52% 48% 16% 52% 20% 28% 11% 1% 0% 1% MT 55% 54% 38% 40% 52% 18% 19% 10% 2% 0% 2% NL 72% 49% 29% 37% 21% 43% 44% 14% 2% 0% 0% AT 65% 65% 33% 38% 40% 29% 33% 20% 2% 1% 2% PL 62% 30% 25% 33% 37% 38% 7% 13% 1% 0% 6% PT 75% 28% 31% 37% 39% 30% 6% 11% 4% 1% 5% RO 67% 42% 57% 27% 33% 25% 9% 9% 1% 0% 7% SI 69% 70% 52% 23% 53% 20% 18% 18% 1% 0% 1% SK 59% 41% 47% 40% 39% 28% 15% 7% 1% 0% 0% FI 75% 60% 40% 29% 36% 29% 38% 19% 1% 0% 0% SE 80% 75% 19% 19% 31% 34% 45% 18% 0% 0% 0% UK 58% 45% 39% 41% 23% 30% 38% 9% 2% 2% 3% *Highest results by country are in bold; Lowest results by country are in italic; Highest results by item are in a grey rectangle and Lowest results by item are in a black border rectangle. 9
15 Looking next at notable changes from January-February 2009 to August-September 2009 for the issues ranked as the three most serious problems facing the world today (all mentions) we see that Romania shows the highest increase in mentions for Poverty and the lack of food and drinking water since January-February 2009, up from 57% to 67%. Considering climate change, most of the countries that showed large changes since winter actually recorded a decrease in mentions: Cyprus (down from 76% to 64%), Ireland (down from 58% to 46%), Slovakia (down from 53% to 41%), Latvia (down from 43% to 28%), Lithuania (down from 47% to 32%). Only Luxembourg recorded a large increase in mentions, up from 54% in January-February 2009 to 67% in August-September As we would expect from the overall results, many countries saw significant decreases in mentions of a major global economic downturn compared to the last report. The most drastic decrease is in the Netherlands (down from 58% to 29%), but most countries show a decrease between 10% and 25% in mentions. The only countries that remain relatively stable, or show decreases of less than 10% are: Bulgaria, Czech Republic, Germany, Cyprus, Latvia, Lithuania, Austria and Romania. This suggests that the effects of the prolonged economic downturn are more prominent in the minds of respondents in these countries than for the rest of the EU Member States surveyed. Given the co-incidence of the survey and the H1N1 flu epidemic, it is not surprising to see increases in mentions of the spread of an infectious disease across many countries. The largest increase in mentions are seen in Cyprus (up from 19% to 67%), Greece (up from 12% to 58%), Slovenia (up from 16% to 53%), Malta (up from 26% to 52%), and Hungary (up from 27% to 52%)
16 1.1.2 First answers Considering only respondents first answer makes poverty, lack of food and drinking water the most serious problem facing the world today. This is close to the January-February 2009 results (from 30% to 34%). First mentions of a major global economic downturn have decreased from 22% to 14%, placing it behind "climate change", which was mentioned as the most important problem the world currently faces by 17% of the respondents (1 point less than in January-February 2009, and 13 points down since March-April 2008). International terrorism has dropped by 1 point since January-February 2009, but by 7 points since March-April Climate change is considered the most important problem facing the world today (first mention) in four countries: Sweden (36%), Slovenia (30%), Denmark (28%) and Austria (27%). For Sweden and Austria this is a repetition of the results from January-February 2009, but Denmark and Slovenia are new to rank climate change as the most important problem. Respondents from Lithuania, Latvia, the Czech Republic, Bulgaria and Estonia all rate a major global economic downturn as the most serious problem based upon first mentions. The remaining countries all rate poverty, lack of food and drinking water as the most serious problem with French the most likely to do so (47%)
17 QB1a In your opinion, which of the following do you consider to be the most serious problem currently facing the world as a whole? Firstly? % EU EB69.2 Mar. -Apr EB71.1 Jan.-Feb EB72.1 Aug.-Sep Poverty, lack of food and drinking water 30% 29% 34% 17% Climate change 18% 30% A major global economic downturn International terrorism 14% 12% 10% 11% 22% 17%
18 1.1.3 Socio-demographic analysis Turning to the socio-demographic analysis of all the answers given by respondents (first and all other mentions): Poverty, lack of food and drinking water is considered the most serious problem by both men and women, although women are slightly more likely to mention the issue than men. When considering mentions of climate change the position is reversed, with men citing the issue more often than women. Men are also more likely to mention the increasing world population as one of the most serious issues. Those under the age of 55 are more likely to mention poverty, lack of food and drinking water and climate change as serious problems than older respondents. Older respondents (aged 55+) are most likely to mention international terrorism as a serious problem, whilst it is the year olds who are most likely to mention the spread of infectious diseases. This may be a result of the media emphasis on the greater impact of H1N1 influenza on the young and healthy. Respondents who finished education aged 15 years or less are much less likely to consider climate change as a serious problem than those that continued in education until at least age 16 (age 15 or less: 38% vs. age 16-19: 46% vs. age 20 or later: 55%). Those who studied until at least the age of 20 are also the most likely to mention poverty, lack of food and drinking water. Conversely, those who completed their education before the age of 20 are more likely to mention international terrorism as a serious problem. Managers, white collar workers and students have the most mentions of climate change as a serious problem, whilst house persons and retired respondents have the least mentions. Those that say they never use the internet (at home or elsewhere) are much less likely to mention climate change as a serious problem (39%) compared to those that use the internet often/sometimes (47%) or every day (52%). This variable is highly correlated with the level of education. It is worth noting that the issue of climate change is ranked the second most important problem across all demographic groups, which clearly reflects a uniformity of opinion about the seriousness of this issue for all Europeans
19 QB1T Which do you consider to be the most serious problems currently facing the world as a whole? Poverty, lack of food and drinking water Climate change EU27 69% 47% Sex Male 67% 48% Female 70% 45% Age % 48% % 49% % 49% % 42% Education (End of) 15-66% 38% % 46% % 55% Still studying 71% 50% Respondent occupation scale Self-employed 67% 45% Managers 74% 55% Other white collars 69% 50% Manual workers 68% 48% House persons 71% 42% Unemployed 68% 46% Retired 65% 42% Students 71% 50% Use of the Internet Everyday 72% 52% Often/ Sometimes 68% 47% Never 65% 39%
20 1.2 Europeans perceptions of the seriousness of climate change - Almost two thirds of Europeans think that climate change is a very serious issue - Respondents were asked to rate their perception of the seriousness of climate change on a scale of 1 to Almost two-thirds of Europeans consider climate change a very serious problem (63%), 24% consider it a fairly serious problem, and 10% do not consider it a serious problem 9. Across all EU citizens the average score was 7.1, down from 7.4 in January-February The last section illustrated that climate change has increased in raking from the third to second most serious global problem since January-February However, in spite of this the proportion of respondents considering climate change as a very serious problem has decreased slightly (from 68% to 63%) between January-February 2009 and August-September However, since March-April 2008, the decrease is more significant, from 75% to 63%. This decrease, however, does not represent a major shift in public opinion. Overall the proportion of respondents that consider climate change to be a serious problem has remained stable (March-April 2008: 90%; January-February 2009: 88%, August-September 2009: 87%). 8 QB2.1 And how serious a problem do you think climate change is at this moment? Please use a scale from 1 to 10, '1' would mean that it is "not at all a serious problem" and '10' would mean that it is a problem extremely serious". 9 A score between 7 and 10 is categorised as very serious, between 5 and 6 fairly serious and between 1 and 4 not a serious problem
21 QB2 How serious a problem do you think climate change is at this moment? A very serious problem (7-10) A fairly serious problem (5-6) Not a serious problem (1-4) DK EB72.1 Aug.-Sep % 24% 10% 3% EB71.1 Jan.-Feb % 20% 9% 3% EB69.2 Mar. -Apr % 15% 7% 3% Continuing the trend from January-February 2009, Greeks and Cypriots are still the most likely to consider climate change a very serious problem (84% and 81% respectively). Slovenia, Malta, Spain, France, Austria, Luxemburg and Hungary are also well above the EU average in rating climate change as very serious. Almost one quarter of Estonians and Latvians think that climate change is not a serious problem the highest levels in the EU. With an overall average score of 6, they are well below the EU average of 7.1. Most countries do not show large (>10%) changes in opinion on the seriousness of climate change between January-February 2009 and August-September 2009, and maintain a similar balance of opinion. However, some countries do show decreases of between 10-15% in the proportion believing climate change is a very serious problem. These countries are the Czech Republic (70% to 58%), Cyprus (93% to 81%), Latvia (56% to 44%), Lithuania (65% to 51%), Hungary (83% to 70%), Portugal (67% to 53%), and Romania (71% to 58%)


22 Socio-demographic analysis Respondents that consider climate change to be a very serious problem are more likely to: be aged between 25 and 39 years have completed their education at age 20 or older to be managers, white-collar workers or students to access the internet at least occasionally
23 Men are more likely to consider that climate change is not a serious problem (12% vs 9% of women). Other groups most likely to consider that climate change is not a serious issue are: those aged 55 or older those who completed their education prior to the age of 16 years retired never use the internet QB2.2 And how serious a problem do you think climate change is at this moment? Please use a scale from 1 to 10, '1' would mean that it is "not at all a serious problem" and '10' would mean that it is a problem extremely serious". A very serious problem (7-10) A fairly serious problem (5-6) Not a serious problem (1-4) EU27 63% 24% 10% 3% Sex Male 62% 24% 12% 2% Female 63% 24% 9% 4% Age % 23% 12% 2% % 22% 9% 2% % 24% 11% 2% % 25% 11% 5% Education (End of) 15-59% 25% 10% 6% % 25% 11% 2% % 21% 10% 2% Still studying 66% 20% 12% 2% Respondent occupation scale Self- employed 59% 26% 12% 3% Managers 69% 20% 10% 1% Other white collars 67% 22% 10% 1% Manual workers 63% 24% 11% 2% House persons 62% 26% 8% 4% Unemployed 61% 25% 11% 3% Retired 59% 24% 11% 6% Students 66% 20% 12% 2% Use of the Internet Everyday 65% 23% 11% 1% Often/ Sometimes 63% 25% 10% 2% Never 58% 26% 11% 5% DK
24 2. TAKING ACTION ON CLIMATE CHANGE This section of the report reviews the opinion of Europeans about the amount of action being taken by governments, local authorities, corporations and industry, and by individuals. This section also considers respondents' attitudes to the process of climate change, attitudes to CO 2 emissions and alternative fuels, and the personal actions they are taking to combat climate change. 2.1 Which sector of European Society is viewed as most active in tackling climate change? - Just under one third of Europeans think that the European Union is doing about the right amount to fight climate change - Respondents are most likely to consider the European Union as doing about the right amount to combat climate change (30%), followed closely by regional and local authorities, citizens themselves and national governments 10. Respondents were less likely to consider that corporations and industry were doing the right amount to combat climate change in fact almost three quarter of the respondents say they are not doing enough. In fact, the overall message from these results is that the majority of Europeans feel that none of these sectors of society are taking enough action to fight climate change. In terms of evolution, the pattern is similar for all actors tested: the proportion of respondents who think that the different actors are doing enough to fight climate change has increased, from 3 to 5 points. Conversely, the proportion who think that the actors are not doing enough has decreased (from 3 to 4 points). Overall, despite these changes, the feeling that more should be done to fight climate change remains by far the majority view for all actors tested. 10 These results are a combination of QB3.1-QB3.5. The base question is In your opinion, is each of the following currently doing too much, doing about the right amount, or not doing enough to fight climate change? and this is asked in relation to 1. The (NATIONALITY) Government 2. The European Union 3. Regional and local authorities 4. Corporations and industry 5. Citizens themselves
25 QB3 In your opinion, is each of the following currently doing too much, doing about the right amount, or not doing enough to fight climate change? - % EU Not doing enough Doing about the right amount Doing too much DK The European Union EB72.1 Aug.-Sep % 30% 12% EB69.2 Mar. -Apr % 25% 14% Regional and local authorities EB72.1 Aug.-Sep % 29% 10% The (NATIONALITY) Government EB72.1 Aug.-Sep % 27% 8% EB69.2 Mar. -Apr % 24% 8% Citizens themselves EB72.1 Aug.-Sep % 28% 6% EB69.2 Mar. -Apr % 23% 8% Corporations and industry EB72.1 Aug.-Sep % 19% 8% EB69.2 Mar. -Apr % 14% 8%
26 2.1.1 The European Union While less than one third of respondents (30%) consider the European Union is doing the right amount to fight climate change, the majority (55%), feel that the EU is not doing enough. A small proportion (3%) considers the EU is doing too much, whilst the remaining respondents (12%) are unsure. Respondents in Cyprus, Estonia, Slovakia, the Czech Republic, Malta and Poland are most likely to consider that the EU is doing the right amount to fight climate change, with at least 43% in each country selecting this option. At the other end of the spectrum, only 1 in 5 French respondents feel the same way. Almost three quarters of Slovenians consider the European Union is not doing enough to fight climate change, and they were the most likely country to select this response. They are followed by the Swedes, Greeks, French and Austrians in this view. 12% of respondents are unable to form an opinion Bulgarian, Romanian, Portuguese and Irish respondents are most likely to say they do not know whether the EU is doing enough to fight climate change


, Ireland (up from 30% to 40%), Lithuania (up from 27% to 39%), Hungary (up from 28% to 39%), Austria")
27 These results are illustrated in the following chart. Looking at the evolution of opinion since January-February 2009, the biggest change has occurred in Latvia, where the proportion of those considering that the EU is not doing enough has decreased from 67% to 45%, and the proportion thinking the EU is doing the right amount has increased from 20% to 36%. The proportion that believe the EU is doing the right amount also increased by 10-15% in Denmark (up from 27% to 40%), Ireland (up from 30% to 40%), Lithuania (up from 27% to 39%), Hungary (up from 28% to 39%), Austria (up from 14% to 26%), Poland (up from 33% to 43%) and Finland (up from 29% to 39%)
28 Socio-demographic analysis Those that consider the European Union is doing the right amount are more likely to: be male be aged years still be studying Those that consider the European Union is not doing enough are more likely to: be aged years have studied until they were at least 20 years old have a management position consider climate change to be a very serious problem QB3.2 In your opinion, is each of the following currently doing too much, doing about the right amount, or not doing enough to fight climate change? The European Union Not doing enough Doing about the right amount Doing too much EU27 55% 30% 3% 12% Sex Male 55% 31% 4% 10% Female 54% 29% 2% 15% Age % 40% 2% 10% % 31% 3% 9% % 26% 4% 11% % 27% 3% 17% Education (End of) 15-53% 26% 2% 19% % 30% 3% 12% % 30% 3% 9% Still studying 50% 37% 3% 10% Respondent occupation scale Self- employed 58% 29% 4% 9% Managers 60% 28% 4% 8% Other white collars 56% 32% 3% 9% Manual workers 56% 31% 3% 10% House persons 53% 28% 3% 16% Unemployed 56% 29% 3% 12% Retired 53% 27% 2% 18% Students 50% 37% 3% 10% Perception of climate change Not a serious problem 32% 40% 12% 16% A fairly serious problem 43% 39% 3% 15% A very serious problem 65% 26% 1% 8% DK
29 2.1.2 National Governments Across the European Union, most respondents feel that their national government is not doing enough about climate change (62%), 27% feel their government is doing the right amount, 3% consider their government is doing too much, and 8% are unsure. The Greeks and Slovenians are most likely to feel that their national government is not doing enough to combat climate change, with at least 8 out of 10 holding this opinion. French, Bulgarian, Latvian and Hungarian respondents are also well above the overall EU average of 62%. Those living in Luxembourg and Denmark are most likely to think their national government is doing the right amount to fight climate change, with almost half holding this opinion. At the other end of this spectrum respondents in Bulgaria, Romania and Greece are the least likely to think their national governments are doing enough. Respondents from the UK and the Netherlands are most likely to think that their national governments are doing too much (6%), whilst Bulgarians, Portuguese, Romanians and the Irish were most likely to say they did not know


30 Turning to the socio-demographic analysis, those that consider their national government is not doing enough are more likely to: be aged years have studied until they were at least 20 years old have a management position use the internet at least occasionally once again, this result is due to the strong correlation between the use of internet and the level of education) consider climate change to be a very serious problem consider the EU is not doing enough to fight climate change
31 QB3.1 In your opinion, is each of the following currently doing too much, doing about the right amount, or not doing enough to fight climate change? The (NATIONALITY) Government Not doing enough Doing about the right amount Doing too much EU27 62% 27% 3% 8% Sex Male 61% 28% 4% 7% Female 62% 26% 2% 10% Age % 30% 3% 7% % 26% 3% 6% % 26% 3% 7% % 28% 3% 11% Education (End of) 15-58% 26% 3% 13% % 28% 3% 8% % 26% 3% 5% Still studying 62% 28% 3% 7% Respondent occupation scale Self- employed 64% 25% 4% 7% Managers 66% 26% 4% 4% Other white collars 64% 27% 3% 6% Manual workers 62% 28% 3% 7% House persons 58% 28% 2% 12% Unemployed 64% 25% 2% 9% Retired 57% 28% 3% 12% Students 62% 28% 3% 7% Use of the Internet Everyday 63% 28% 4% 5% Often/ Sometimes 62% 29% 2% 7% Never 57% 29% 3% 11% Perception of climate change Not a serious problem 38% 38% 14% 10% A fairly serious problem 50% 37% 4% 9% A very serious problem 72% 22% 1% 5% Evaluation of EU action in the fight against climate change Too much 15% 28% 55% 2% The right amount 29% 66% 3% 2% Not enough 89% 9% 1% 1% DK
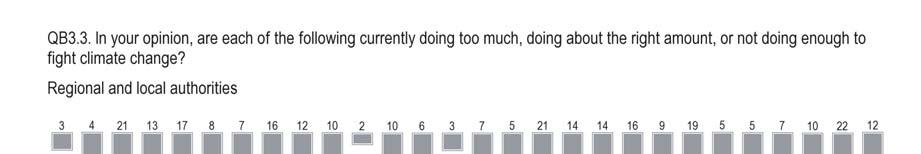
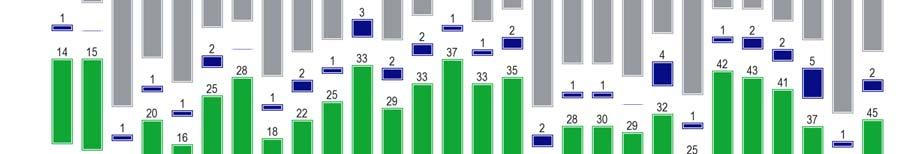
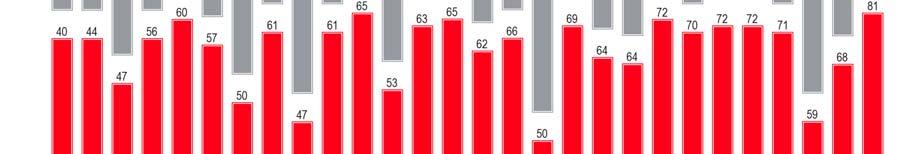
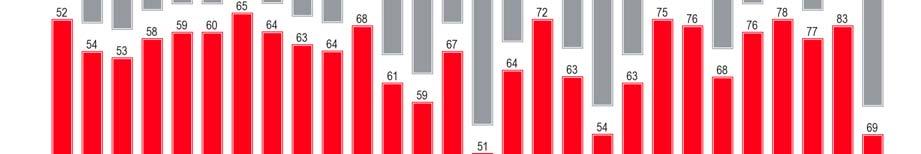
32 2.1.3 Regional and local authorities Echoing the views about national governments and EU level, most respondents believe their regional and local authorities are not doing enough to fight climate change (59%), whilst 29% think they are doing the right amount. Only 2% believe regional and local authorities are doing too much, whilst 10% say they do not know. As for the earlier national government results, it is the Greeks (82%) and Slovenians (81%) that are most likely to believe their regional and local authorities are not doing enough to fight climate change. The Irish, and those living in Luxembourg are the least likely to hold this view. Those living in Luxembourg and Denmark are most likely to think their regional and local authorities are doing the right amount to fight climate change, while respondents in Bulgaria, Greece, and Slovenia are the least likely to hold this opinion
33 - 28 -
34 Socio-demographic analysis Those that consider their regional and local authorities are not doing enough are more likely to: be aged years have studied until they were at least 20 years old have a management position consider climate change to be a very serious problem QB3.3 In your opinion, is each of the following currently doing too much, doing about the right amount, or not doing enough to fight climate change? Regional and local authorities Not doing enough Doing about the right amount Doing too much EU27 59% 29% 2% 10% Sex Male 59% 30% 2% 9% Female 59% 29% 1% 11% Age % 32% 1% 10% % 26% 2% 8% % 29% 2% 9% % 31% 2% 13% Education (End of) 15-55% 28% 2% 15% % 31% 2% 9% % 28% 2% 7% Still studying 60% 30% 1% 9% Respondent occupation scale Self- employed 62% 28% 2% 8% Managers 64% 27% 3% 6% Other white collars 62% 29% 2% 7% Manual workers 60% 30% 2% 8% House persons 56% 29% 1% 14% Unemployed 59% 29% 1% 11% Retired 53% 31% 2% 14% Students 60% 30% 1% 9% Perception of climate change Not a serious problem 37% 42% 9% 12% A fairly serious problem 45% 42% 2% 11% A very serious problem 69% 24% 1% 6% DK
35 Socio-demographic overview Reviewing the opinions of Europeans about local, national and EU level reveals similarities in the pattern of responses in the demographic analysis. Those that consider each level of public action (EU, national and regional/local) is not doing enough to fight climate change are more likely to consider climate change to be a serious problem, and are also more likely to have stayed in education longer, be internet users, have a management position, and be in the middle age range
36 2.1.4 Corporations and Industry Almost three quarters of respondents (72%) consider corporations and industry are not doing enough to fight climate change. Only 1% think they are doing too much, 19% believe they are doing the right amount, and 8% did not know. Nine out of ten Greeks and Slovenians consider that corporations and industry are not doing enough to fight climate change, and at least 8 out of 10 French and Hungarian respondents also agree. The Irish are least likely to hold this view, but in spite of this 50% of them are still of the opinion that corporations and industry are not doing enough. Danish respondents were the most likely to think that corporations and industry were doing enough to fight climate change, but even so only 34% are of this opinion. At the other end of the scale, only 4% of Greeks and 5% of Bulgarians and Slovenians think that corporations are doing enough. Reviewing the change in opinion between March-April 2008 and August-September 2009, Latvians have considerably improved their opinion of corporations and industry, with the proportion thinking they are not doing enough falling from 86% to 69%, and the proportion believing they are doing the right amount increasing from 8% to 19% Cypriots, on the other hand have become more unsure, with the proportion of don t know responses increasing from 5% to 16%. Most of this increase came from the proportion believing corporations are not doing enough, which dropped from 87% to 76% in the same period. More Danes and Irish consider that corporations and industry are doing the right amount (up from 24% to 34% and from 16% to 27% respectively), whilst the proportion of Polish (down from 77% to 65%), Portuguese (down from 74% to 64%) and Slovakian (down from 82% to 72%) respondents that believe they aren t doing enough has fallen


37 Socio-demographic analysis Those that consider corporations and industry are not doing enough are more likely to: be aged years have studied until they were at least 20 years old have a management position consider climate change to be a very serious problem use the internet at least occasionally
38 QB3.4 In your opinion, is each of the following currently doing too much, doing about the right amount, or not doing enough to fight climate change? Corporations and industry Not doing enough Doing about the right amount Doing too much EU27 72% 19% 1% 8% Sex Male 73% 20% 1% 6% Female 72% 17% 1% 10% Age % 20% 1% 8% % 17% 1% 6% % 18% 1% 6% % 19% 1% 11% Education (End of) 15-69% 17% 1% 13% % 20% 1% 7% % 16% 2% 5% Still studying 71% 20% 1% 8% Respondent occupation scale Self- employed 74% 18% 2% 6% Managers 79% 16% 1% 4% Other white collars 75% 18% 2% 5% Manual workers 72% 20% 2% 6% House persons 69% 18% 1% 12% Unemployed 72% 18% 1% 9% Retired 69% 18% 1% 12% Students 71% 20% 1% 8% Use of the Internet Everyday 75% 19% 1% 5% Often/ Sometimes 73% 20% 1% 6% Never 69% 18% 1% 12% Perception of climate change Not a serious problem 52% 33% 6% 9% A fairly serious problem 62% 28% 1% 9% A very serious problem 82% 13% 0% 5% DK
39 2.1.5 The citizens themselves Respondents were also asked whether they consider citizens themselves are doing enough to fight climate change. Just under three quarters of respondents (64%) think that citizens were not doing enough, 28% felt citizens were doing the right amount, 2% felt they were doing too much, and 6% did no know. More than three quarters of respondents in Slovenia, Bulgaria, Hungary and Sweden feel that citizens are not doing enough to combat climate change. In contrast, only 45% of Irish respondents and 53% of German respondents held this view. German respondents are the most likely to believe that citizens are doing about the right amount to fight climate change (42%). These results are illustrated in the following chart


40 Polish respondents have become more positive about citizen action in the period between January-February 2009 and August-September 2009, with a decrease from 75% to 60% in the proportion that think citizens are not doing enough, and an increase from 15% to 29% in the proportion thinking citizens are doing the right amount to combat climate change. There have also been increases of 10% or more in the portion of respondents believing citizens are doing the right amount in the Czech Republic (up from 23% to 33%), Spain (up from 20% to 30%), Latvia (up from 6% to 16%) and Slovakia (up from 21% to 31%)
41 Socio-demographic analysis Those that consider citizens to be doing the right amount are more likely to: be male be aged 55+ have completed their education when aged years never use the internet consider that climate change is not a serious problem Those that consider citizens are not doing enough are more likely to: be aged years have studied until they were at least 20 years old have a management position consider climate change to be a very serious problem use the internet at least occasionally
42 QB3.5 In your opinion, is each of the following currently doing too much, doing about the right amount, or not doing enough to fight climate change? Citizens themselves Not doing enough Doing about the right amount Doing too much EU27 64% 28% 2% 6% Sex Male 64% 29% 2% 5% Female 64% 27% 1% 8% Age % 28% 2% 5% % 25% 2% 5% % 27% 2% 5% % 30% 2% 9% Education (End of) 15-57% 30% 2% 11% % 29% 2% 6% % 24% 2% 3% Still studying 67% 25% 2% 6% Respondent occupation scale Self- employed 68% 26% 2% 4% Managers 72% 24% 2% 2% Other white collars 68% 28% 1% 3% Manual workers 64% 29% 2% 5% House persons 59% 29% 2% 10% Unemployed 63% 28% 2% 7% Retired 59% 30% 1% 10% Students 67% 25% 2% 6% Use of the Internet Everyday 69% 26% 2% 3% Often/ Sometimes 64% 29% 2% 5% Never 56% 33% 1% 10% Perception of climate change Not a serious problem 41% 44% 6% 9% A fairly serious problem 54% 38% 2% 6% A very serious problem 74% 22% 1% 3% DK
43 2.2 European attitudes to the process of climate change - A majority believe fighting climate change can have a positive economic impact - Respondents were asked to give their opinions on a range of statements about various aspects of climate change 11. In summary, most believe that climate change is serious, but that we can do something about it, and that fighting climate change can be good for the European Economy. Although 31% of Europeans believe that climate change is an unstoppable process, the majority (62%) disagree that we cannot do anything to stop it. These results are the same as those of January-February In spite of this optimism, almost two thirds believe that the seriousness of climate change has not been exaggerated. However, almost one third (29%) believe the seriousness of climate change has been exaggerated a slight increase since the beginning of Nearly two-thirds of respondents believe that fighting climate change can have a positive impact on the European economy. This is a similar result to the last report, which is positive considering difficult economic conditions that have persisted in Europe since the last survey. However, 16% remain unsure, and a further 21% disagree. Looking at the role of CO 2 in climate change, in this survey two slightly different versions of a statement about CO 2 were presented with half the sample in each country receiving each statement. One statement mentioned only CO 2, the other CO 2 and other greenhouse gases. The aim was to test the impact of including other greenhouse gases on the way respondents answered the question. 11 QB4 For each of the following statements, please tell me whether you totally agree, tend to agree, tend to disagree or totally disagree? 1. Climate change is an unstoppable process, we cannot do anything about it 2. The seriousness of climate change has been exaggerated 3. Emissions of CO 2 (Carbon dioxide) have only a marginal impact on climate change (1/2 sample) OR Emission of CO 2 (Carbon dioxide) and other greenhouse gasses have only a marginal impact on climate change (1/2 sample) 4. Fighting climate change can have a positive impact on the European economy 5.Alternative fuels, such as "bio fuels", should be used to reduce greenhouse gas emissions (1/2 sample) OR Alternative fuels should be used to reduce greenhouse gas emissions (1/2 sample) 6. You personally have taken actions aimed at helping to fight climate change
44 In spite of this difference the results were almost identical, with 57% disagreeing that carbon dioxide / carbon dioxide and other greenhouse gases have a marginal impact on climate change. Two different versions of the statement on alternative fuels were also used in this survey, with half the respondents receiving the version (A) also used in January- February 2009, which stated Alternative fuels, such as "bio fuels", should be used to reduce greenhouse gas emissions. The alternative version (B) omitted the mention of bio-fuels. The results show that 78% of respondents agree with the statement that included bio-fuels (A). However, when the statement excluded the mention of bio-fuels the proportion of respondents agreeing increases to 83%. This difference will be considered in more detail in section QB4 For each of the following statements, please tell me whether you totally agree, tend to agree, tend to disagree or totally disagree. - % EU + and - indicate evolution from EB71.1 Jan.-Feb Total agree Total disagree DK NA* NA* 9% 12% (SPLIT B) Alternative fuels should be used to reduce greenhouse gas emissions (SPLIT A) Alternative fuels, such as "bio fuels", should be used to reduce greenhouse gas emissions 83% NA* 78% NA* 8% 10% = 21% Fighting climate change can have a positive impact on the European economy 63% +1 16% -3 31% You personally have taken actions aimed at helping to fight climate change 63% +4 6% NA* 57% (SPLIT A) Emissions of CO2 and other greenhouse gas have only a marginal impact on climate change 31% NA* 12% = 62% Climate change is an unstoppable process, we cannot do anything about it 31% = 7% -1 57% (SPLIT B) Emissions of CO2 have only a marginal impact on climate change 30% = 13% -1 64% The seriousness of climate change has been exaggerated 29% +2 7% *These items were asked for the first time
45 2.2.1 Climate change can be stopped The majority of Europeans (62%) disagree with the statement that climate change is an unstoppable process. There are only four countries Estonia, Latvia, Romania and Lithuania where fewer than 50% of respondents think that climate change can be stopped. Just under one third of Europeans (31%) do agree there is nothing that can be done to stop climate change, and 7% are unable to give an opinion. Respondents in Greece are the most optimistic, with 81% disagreeing with the statement in fact 42% said they totally disagree the highest proportion of any country. Respondents in Sweden, Germany, Luxembourg, Austria and Slovenia are also optimistic, with at least seven out of ten respondents disagreeing with the idea that climate change is unstoppable. Respondents in Estonia and Latvia are far less optimistic. In both of these countries more than 50% of respondents agreed that climate change was unstoppable. In both countries more people agree than disagree that climate change is unstoppable. Since the last survey the Maltese have become more pessimistic. The portion agreeing that climate change is unstoppable has increased from 8% in January- February 2009 to 28% in August-September 2009, whilst those disagreeing have dropped by slightly less (from 79% to 64%). By contrast the Bulgarians have become more optimistic, with the proportion agreeing climate change is unstoppable decreasing from 35% to 23%. There were no other countries showing large variations. Although at a European level the proportion that Don t know whether climate change is unstoppable is only 7%, this is much higher in some countries. One in five (21%) Portuguese respondents chose Don t know, and the rate of this response was also high in Romania and Bulgaria

46 - 41 -
47 Socio-demographic analysis reveals that: Those aged 55+ years are the least likely to disagree that climate change is unstoppable. This difference is predominantly due to the fact that they are more likely to say Don t know than the other age groups (10% vs. 5% for all others), although they are also slightly more likely to agree. The longer a respondent stayed in education, the more likely they are to disagree that climate change is unstoppable. Management and white collar workers are the most likely to consider that climate change can be stopped, whilst manual workers, retired persons and the unemployed are most likely to think it is an unstoppable process. Those that use internet at least occasionally are more likely to disagree compared to those that never use it. Respondents that consider climate change to be a very serious problem are almost twice as likely to consider it can be stopped when compared to those that consider climate change is not a serious problem. The proportion saying they don t know is similar for both groups, so the difference lies in their relative levels of agreement. It is also interesting to note that Europeans who feel that EU is not doing enough to fight climate change are the most likely to think that climate change can be stopped
48 QB4.1 For each of the following statements, please tell me whether you totally agree, tend to agree, tend to disagree or totally disagree. Climate change is an unstoppable process, we cannot do anything about it Total Total Agree Disagree DK EU27 31% 62% 7% Age % 65% 5% % 66% 5% % 65% 5% % 57% 10% Education (End of) 15-32% 56% 12% % 62% 6% % 69% 3% Still studying 27% 68% 5% Respondent occupation scale Self- employed 29% 64% 7% Managers 26% 72% 2% Other white collars 27% 70% 3% Manual workers 33% 62% 5% House persons 30% 60% 10% Unemployed 33% 59% 8% Retired 34% 55% 11% Students 27% 68% 5% Use of the Internet Everyday 29% 68% 3% Often/ Sometimes 31% 64% 5% Never 35% 56% 9% Perception of climate change Not a serious problem 56% 39% 5% A fairly serious problem 41% 52% 7% A very serious problem 23% 73% 4% Evaluation of EU action in the fight against climate change Too much 63% 36% 1% The right amount 37% 59% 4% Not enough 26% 70% 4%
49 2.2.2 Seriousness of climate change has not been exaggerated Almost two thirds of Europeans consider that the seriousness of climate change has not been exaggerated, whilst 29% believe that it has been, and 7% do not know. Those living in the Netherlands are the most sceptical about the seriousness of climate change, with 46% agreeing that it has been exaggerated. Respondents in Estonia, the UK, Latvia, Luxembourg and Denmark were also more likely to hold this view than other EU nations. Since the last survey the proportion of Maltese holding this view has increased to just over one quarter (up from 13% to 26%). A very different picture emerges in Slovenia, where more than eight out of ten respondents do not believe that the seriousness of climate change has been exaggerated. In fact, half of all Slovenian respondents totally disagreed. More than three quarters of respondents in Greece, Austria, Slovakia, Germany, Sweden and Hungary also disagree to some degree that the seriousness of climate change has been exaggerated well above the EU average of 64%

50 - 45 -
51 Socio-demographic analysis highlights that: Men are slightly more likely than women to agree that the seriousness of climate change has been exaggerated (30% vs. 26%), whilst women are more likely to say they don t know (9% vs. 6%) Those aged 55+ years are the least likely to disagree that the threat of climate change has been exaggerated. This difference is due to the fact that they are more likely to say Don t know than the other age groups, and that they are more likely to agree. Those aged are the most likely to disagree that the seriousness of climate change has been overstated. The longer a respondent stayed in education, the more likely they are to disagree that the seriousness of climate change has been exaggerated, and the less likely they are to say they do not know. Almost three quarters of managers disagree that the climate threat has been exaggerated, whilst retired persons are the most likely to say they don t know. Respondents that consider climate change to be a very serious problem are more than three times as likely to disagree that the problem has been overstated when compared to those that consider climate change is not a serious problem (79% vs. 25%). The proportion saying they don t know is the same for both groups, so the difference lies in their relative levels of agreement with the statement
52 QB4.2 For each of the following statements, please tell me whether you totally agree, tend to agree, tend to disagree or totally disagree. The seriousness of climate change has been exaggerated Total Total Agree Disagree DK EU27 29% 64% 7% Sex Male 30% 64% 6% Female 26% 65% 9% Age % 64% 6% % 69% 6% % 67% 5% % 59% 11% Education (End of) 15-29% 58% 13% % 63% 7% % 71% 4% Still studying 26% 68% 6% Respondent occupation scale Self- employed 31% 64% 5% Managers 23% 74% 3% Other white collars 27% 69% 4% Manual workers 28% 66% 6% House persons 27% 63% 10% Unemployed 29% 63% 8% Retired 31% 57% 12% Students 26% 68% 6% Perception of climate change Not a serious problem 70% 25% 5% A fairly serious problem 43% 49% 8% A very serious problem 16% 79% 5%
53 2.2.3 Impact of CO 2 emissions As mentioned in the introduction to this section, two slightly different versions of the statement on CO 2 were used one that included other greenhouse gases, and one that just mentioned CO 2. In spite of this difference the results are the same, with 57% disagreeing that CO 2 and other greenhouse gases have only minimal impact on climate change. Looking at the divisions with agreement and disagreement there are very similar proportions for each subcategory (totally agree, tend to agree, tend to disagree, totally disagree). Respondents in Slovenia, Austria, Hungary and Denmark are the most likely to disagree with either version of the statement: they believe that CO 2 emissions have a real impact on climate change. A review of the evolution of opinion for the statement emissions of CO 2 have only a marginal impact on climate change between January-February 2009 and August- September 2009 reveals that Slovakians are now more likely to agree that CO 2 emissions have only a marginal impact than they were in January-February 2009 (31% vs. 21%) 12. The Irish show the opposite trend, with fewer people agreeing (down from 50% to 39%). Respondents in Malta are more likely to disagree that CO 2 emissions have only a marginal impact on climate change than they were in January- February 2009 (60% vs. 49%). Levels of Don t know responses have also dropped in Malta from 37% to 24%. 12 Please note that in January-February 2009 (EB71.1), the item was asked to the whole sample, whilst in this survey it was only asked to half of the sample (split B)
54 Socio-demographic analysis highlights that those who are most likely to disagree that the impact of CO 2 / CO 2 and other greenhouse gasses have a marginal impact on climate change are: Men, whilst women are more likely to say they don t know. Those aged Respondents aged 15-24, and those aged 55+ are most likely to agree when the statement includes CO 2 and other greenhouse gases, whilst those aged 40 and older are most likely to agree when the statement only mentions CO 2. Those who stayed in education the longer. Managers and white collar workers. Those who access the internet at least occasionally. Those who think climate change is a very serious problem
55 QB4 For each of the following statements, please tell me whether you totally agree, tend to agree, tend to disagree or totally disagree. (SPLIT A) Emissions of CO2 (Carbon dioxide) and other greenhouse gases have only a marginal impact on climate change Total Total DK (SPLIT B) Emissions of CO2 (Carbon dioxide) have only a marginal impact on climate change Total Total Agree Disagree Agree Disagree DK EU27 31% 57% 12% 30% 57% 13% Sex Male 33% 58% 9% 32% 59% 9% Female 29% 56% 15% 28% 56% 16% Age % 58% 10% 29% 61% 10% % 62% 8% 26% 64% 10% % 61% 10% 31% 59% 10% % 50% 18% 32% 49% 19% Education (End of) 15-31% 47% 22% 30% 46% 24% % 57% 11% 31% 57% 12% % 65% 6% 28% 67% 5% Still studying 28% 64% 8% 28% 63% 9% Respondent occupation scale Self- employed 34% 56% 10% 30% 62% 8% Managers 27% 67% 6% 29% 67% 4% Other white collars 27% 66% 7% 30% 62% 8% Manual workers 33% 58% 9% 30% 59% 11% House persons 32% 48% 20% 26% 52% 22% Unemployed 35% 51% 14% 30% 55% 15% Retired 32% 51% 17% 31% 49% 20% Students 28% 64% 8% 28% 63% 9% Use of the Internet Everyday 31% 63% 6% 29% 64% 7% Often/ Sometimes 33% 58% 9% 31% 60% 9% Never 32% 48% 20% 35% 47% 18% Perception of climate change Not a serious problem 55% 33% 12% 57% 32% 11% A fairly serious problem 40% 45% 15% 38% 49% 13% A very serious problem 25% 67% 8% 23% 67% 10%
56 2.2.4 The economy, climate change and the environment The majority of Europeans (63%) agree that tackling climate change can have a positive impact on the European economy. Compared to January-February 2009, the results are very stable (+1 point), but the evolution is more significant when compared with the survey conducted in March-April 2008, a few months before the beginning of the current financial and economic crisis. This increase might be related to the recent debates about the different ways of combating the crisis, and the role of the green economy in this respect. QB4.5 For each of the following statements, please tell me whether you totally agree, tend to agree, tend to disagree or totally disagree. Fighting climate change can have a positive impact on the European economy Total Agree Total Disagree DK EB72.1 Aug.-Sep % 21% 16% EB71.1 Jan.-Feb % 21% 17% EB69.2 Mar. -Apr % 24% 20% Cypriots are the most likely to agree that fighting climate change could be positive for the European economy, with 81% holding this view. In fact 46% are in total agreement with the statement the highest level in Europe. There are much higher than average levels of general agreement in Denmark, Austria, Belgium, Greece and Sweden. Conversely, respondents in Latvia, the Netherlands and Estonia are the most likely to disagree on the economic benefits of tackling climate change. Once again Portugal has a high level of don t know responses, but it is the Bulgarians that are most likely to say they didn t know whether fighting climate change would have economic benefits. In fact in both of these countries the level of don t know is higher than the disagree responses


57 Only Malta shows a notable change in opinion since January-February 2009, with an increase in those agreeing that fighting climate change could be good for the European economy (up from 43% to 60%), in the same period don t know responses dropped from 43% to 23%
58 The general picture that emerges from the socio-demographic analysis is an overall belief across the groups that fighting climate change can have a positive impact on the economy. This opinion is more likely to be held by men and managers, but the largest differences can be seen according to the level of education: the longer a respondent stayed in education, the more likely they are to believe that fighting climate change can benefit to the economy. QB4.5 For each of the following statements, please tell me whether you totally agree, tend to agree, tend to disagree or totally disagree. Fighting climate change can have a positive impact on the European economy Total Agree Total Disagree DK EU27 63% 21% 16% Sex Male 65% 22% 13% Female 61% 19% 20% Age % 22% 13% % 22% 13% % 22% 14% % 18% 22% Education (End of) 15-56% 18% 26% % 22% 15% % 20% 10% Still studying 66% 21% 13% Respondent occupation scale Self- employed 66% 22% 12% Managers 71% 20% 9% Other white collars 66% 22% 12% Manual workers 63% 22% 15% House persons 56% 20% 24% Unemployed 60% 23% 17% Retired 59% 18% 23% Students 66% 21% 13%
59 The environment vs. the economy There has been a lively debate in both media and political circles about the impact of taking steps to protect the environment can have on economic growth. With this backdrop it is important to assess public opinion on this issue, so an additional question on this topic was introduced to respondents. Two versions of a statement about the environment and the economy were presented with half the sample in each country receiving each statement one framed negatively and one positively 13. The overall picture that emerges is consistent with the last section: at least six out of ten Europeans believe that protecting the environment can boost economic growth in the EU. Respondents are slightly more likely to agree (66%) that The protection of the environment can boost economic growth in the European Union than they are to disagree (60%) that The protection of the environment is an obstacle to economic growth in the European Union. Levels of don t know responding are very similar. 13 QB6a To what extent do you agree or disagree with the following statement: The protection of the environment can boost economic growth in the European Union OR QB6b To what extent do you agree or disagree with the following statement: The protection of the environment is an obstacle to economic growth in the European Union
60 Respondents are more likely to totally disagree that protecting the environment is an economic obstacle, than they are to totally agree that it can boost economic growth. More people tend to agree with the economic benefits, than tend to disagree with the economic obstacle aspect. QB6 To what extent do you agree or disagree with the following statement: - % EU Total Agree Total Disagree DK (SPLIT A) The protection of the environment can boost economic growth in the European Union. 66% 18% 16% (SPLIT B) The protection of the environment is an obstacle to economic growth in the European Union. 26% 60% 14% 0% 10% 20% 30% 40% 50% 60% 70% 80% 90% 100%


61 The country-by-country analysis reveals that more than three quarters of Cypriots, Greeks, French, Belgians and Maltese agree that protecting the environment can boost the EU economy. At least 7 out of ten Germans, Slovakians, Finns, French and respondents from Luxembourg disagree that protecting the environment is an obstacle to economic growth


62 Conversely, at least one-third of Danish, Romanian, Latvian, Dutch and UK respondents agree that protecting the environment is an obstacle to the economic growth of the EU. At least one quarter of Slovakian, Czech, Dutch, Estonian and Latvian respondents disagree that protecting the environment could boost EU economic growth
63 Looking at the results of the socio-demographic analysis we see that: Women are less likely than men to give an opinion on either version of the statement. Those aged 55+ are most likely to say they Don t know, and least likely to disagree that protecting the environment is an obstacle to economic growth. The longer a respondent stayed in education the more likely they are to have an opinion, ant to agree that environmental protection is good for the economy. Managers and the self-employed are most likely to agree with the economic benefits of environmental protection. Unemployed persons are most likely to agree that protecting the environment is an economic obstacle. Those who never use the internet are more likely to say don t know, whilst internet users are most likely to agree with the economic benefits of environmental protection and disagree that environmental protection is an economic obstacle. The more serious a respondent considers climate change to be, the more likely they are to agree with the economic benefits of protecting the environment. Some of the largest variations are based on opinions: the less serious a respondent considers climate change to be, the more likely they are to agree that protecting the environment is an obstacle to economic growth
64 QB6 To what extent do you agree or disagree with the following statement: (SPLIT A) The protection of the environment can boost economic growth in the European Union. (SPLIT B) The protection of the environment is an obstacle to economic growth in the European Union. Total Total Total Total DK Agree Disagree Agree Disagree DK EU27 66% 18% 16% 26% 60% 14% Sex Male 69% 18% 13% 28% 61% 11% Female 64% 17% 19% 24% 58% 18% Age % 19% 15% 26% 60% 14% % 19% 13% 27% 63% 10% % 18% 13% 26% 63% 11% % 16% 20% 25% 55% 20% Education (End of) 15-57% 17% 26% 26% 51% 23% % 19% 15% 27% 59% 14% % 15% 9% 25% 69% 6% Still studying 70% 16% 14% 25% 61% 14% Respondent occupation scale Self- employed 75% 13% 12% 27% 66% 7% Managers 77% 15% 8% 24% 70% 6% Other white collars 66% 20% 14% 29% 63% 8% Manual workers 68% 18% 14% 29% 59% 12% House persons 60% 18% 22% 22% 56% 22% Unemployed 61% 22% 17% 31% 53% 16% Retired 63% 16% 21% 25% 54% 21% Students 70% 16% 14% 25% 61% 14% Use of the Internet Everyday 72% 17% 11% 26% 65% 9% Often/ Sometimes 67% 20% 13% 28% 62% 10% Never 61% 17% 22% 27% 53% 20% Perception of climate change Not a serious problem 49% 36% 15% 36% 48% 16% A fairly serious problem 60% 22% 18% 29% 58% 13% A very serious problem 74% 13% 13% 24% 65% 11%
65 2.2.5 Alternative fuels Two different versions of the statement on alternative fuels were used in this survey, with half the respondents in each country randomly receiving each version. Version A, (also used in January-February 2009, and in March-April 2008) states Alternative fuels, such as "bio fuels", should be used to reduce greenhouse gas emissions. Version B omits the mention of bio-fuels. More than three quarters (78%) of respondents agree with the statement that included bio-fuels an increase of 3 points since January-February 2009, and 8 points since March-April Disagreement with the statement has decreased by 3 points since January-February 2009 (from 15% to 12%), and by 6 points since March-April However, when the statement is simply Alternative fuels should be used to reduce greenhouse gas emissions (version B) the proportion of respondents agreeing increases to 83%. QB4.6 For each of the following statements, please tell me whether you totally agree, tend to agree, tend to disagree or totally disagree. (SPLIT A) Alternative fuels, such as "bio fuels", should be used to reduce greenhouse gas emissions - % EU Total Agree Total Disagree DK EB72.1 Aug.-Sep % 12% 10% EB71.1 Jan.-Feb % 15% 10% EB69.2 Mar. -Apr % 18% 12%
66 As the following chart illustrates, the main difference is in those that totally agree : more Europeans totally agree when the statement does not mention bio-fuels (38%), than when bio-fuels are mentioned (33%). The proportion that tended to agree is the same for both versions of the statement. Slightly more people say don t know when given the statement that mentions bio-fuels, and this version of the statement also attracts a slightly higher proportion of respondents disagreeing. QB4 For each of the following statements, please tell me whether you totally agree, tend to agree, tend to disagree or totally disagree: - % EU Totally agree Tend to agree Tend to disagree Totally disagree DK (SPLIT A) Alternative fuels, such as "bio fuels", should be used to reduce greenhouse gas emissions 33% 45% 9% 10% 3% (SPLIT B) Alternative fuels should be used to reduce greenhouse gas emissions 38% 45% 7% 8% 2% 0% 20% 40% 60% 80% 100% It is clear from the results of both versions of the statement that the majority of Europeans are in favour of using alternative fuels including bio-fuels. What the results do suggest is that there is less support for bio-fuels in particular. This may be a result of increased negative media coverage about the impact of bio-fuel growth on available arable land for food production. It may also be an indication of respondents perceptions of the cost, availability and usefulness of bio-fuels compared to other alternative fuels. Another possibility is that this indicates respondents are unsure what bio-fuels are, which makes them less likely to agree with the statement
67 Looking now at individual country results, Danes, Cypriots and the Dutch are the most likely to agree with the statement including bio-fuels, although it is worth noting that Cypriots are the most likely to agree with either version of the statement. When the bio-fuels phrase was omitted, then respondents in Sweden, Denmark, Belgium, the Netherlands and Cyprus are most likely to agree. Cypriots have the highest level of agree totally responses to both versions (seven out of ten in both cases). The following countries showed considerably higher agreement when bio-fuels are not mentioned: Luxembourg (65% with and 84% without bio-fuels), Germany (76% with and 88% without), and France (75% with and 86% without). When the statement Alternative fuels, such as "bio fuels", should be used to reduce greenhouse gas emissions was given to respondents: The Danes, Cypriots and the Dutch are the most likely to agree Those in Luxembourg and Romania are least likely to agree Spain has the highest level of Don t know responding, at 20%, followed by Portugal and Romania. Countries that have seen large increases in agreement since January-February 2009 are Malta (up from 64% to 79%) and Cyprus (up from 78% to 88%)


68 When the statement Alternative fuels should be used to reduce greenhouse gas emissions was given to respondents: At least 9 out of ten respondents in Sweden, Denmark, Belgium, The Netherlands and Cyprus agree Romanians are the least likely to agree Ireland, Romania, Latvia and Poland have the highest level of Don t know responses
69 A review of the social-demographic analysis reveals a few notable differences: Men are slightly more likely than women to agree with either version of the statement, but are most likely to agree when the phrase bio-fuels is omitted. Women are more likely to say they don t know when either version of the statement is presented. Those aged 55+ are the least likely to agree with either version of the statement, but once again agreement levels are higher when bio-fuels are omitted. This age group is also twice as likely to say they don t know when presented with either statement. The younger respondents, aged were almost equally likely to agree with either statement, but those aged were more likely to agree when bio-fuels were not mentioned. There is a greater variation in agreement across different education levels when bio-fuels are mentioned - ranging from 87% for those still studying, to 70% for those who complete education prior to 16 years. When bio-fuels are not mentioned agreement ranges from 87% (completed education at 20+) to 57% (completed education before 16 years). Those who consider climate change to be a very serious problem are more likely to agree with either version than those that consider that climate change is not serious
70 For each of the following statements, please tell me whether you totally agree, tend to agree, tend to disagree or totally disagree. QB4.6 (SPLIT A) Alternative fuels, such as "bio fuels", should be used to reduce greenhouse gas emissions QB4.7 (SPLIT B) Alternative fuels should be used to reduce greenhouse gas emissions Total Total Total Total DK Agree Disagree Agree Disagree DK EU27 78% 12% 10% 83% 9% 8% Sex Male 79% 14% 7% 84% 10% 6% Female 76% 12% 12% 81% 8% 11% Age % 9% 6% 86% 8% 6% % 13% 7% 86% 8% 6% % 14% 7% 86% 8% 6% % 15% 15% 78% 10% 12% Education (End of) 15-70% 12% 18% 75% 10% 15% % 12% 8% 85% 8% 7% % 16% 5% 87% 9% 4% Still studying 87% 8% 5% 86% 7% 7% Respondent occupation scale Self-employed 76% 15% 9% 84% 10% 6% Managers 77% 19% 4% 88% 9% 3% Other white collars 82% 14% 4% 89% 7% 4% Manual workers 81% 12% 7% 86% 8% 6% House persons 69% 12% 19% 76% 11% 13% Unemployed 82% 8% 10% 83% 9% 8% Retired 71% 14% 15% 77% 9% 14% Students 87% 8% 5% 86% 7% 7% Perception of climate change Not a serious problem 66% 24% 10% 76% 16% 8% A fairly serious problem 74% 15% 11% 79% 13% 8% A very serious problem 83% 11% 6% 88% 6% 6%
71 2.2.6 Taking personal action Most Europeans (63%) say they have taken personal actions the help fight climate change, 31% have not, and 6% said they didn t know. This proportion has increased by 4 points since January-February 2009, and by 2 points since August- September The small drop recorded between the two previous waves (from 61% in March-April 2008 to 59% in January-February 2009), was probably due to the economic crisis, which might have lead some Europeans to be slightly more concerned about the perceived cost of some of the initiatives to fight climate change. QB4.8 For each of the following statements, please tell me whether you totally agree, tend to agree, tend to disagree or totally disagree. You personally have taken actions aimed at helping to fight climate change - % EU Total Agree Total Disagree DK EB72.1 Aug.-Sep % 31% 6% EB71.1 Jan.-Feb % 34% 7% EB69.2 Mar. -Apr % 31% 8% A country-by-country analysis shows that 4 out of 5 respondents in Luxembourg, Malta, Sweden and Slovenia are taking personal actions to help fight climate change. Conversely, respondents in Bulgaria, Latvia, Lithuania and Romania are the least likely to be action at a personal level

.")
72 Cypriots have shown the largest increase in personal action when compared to January-February 2009 (77% vs. 50%), at the same time there has been a large decrease in those disagreeing (down from 46% to 22%). This was by far the largest increase, and the only change of greater than 10% recorded
73 Socio-demographic analysis highlights that: There were only slight gender differences, with men more likely to disagree (33% vs. 30%), and women more likely to say they didn t know (7% vs. 5%) if they have taken personal action to combat climate change. Those aged were the least likely to agree they had taken personal action to fight climate change (56% vs. 64% of the 25-39s, and 66% of the 40-54s). It is possible that the cost of some actions is more problematic for the youngest. Moreover, those who still live with their parents might well feel that they have insufficient opportunities to take actions themselves since they are not entirely responsible for the rules at home. Respondents that stayed in education to at least 20 years of age are much more likely to have taken personal actions than those that ended their education prior to 16 years, or those who were still studying (both 57%). Managers are much more likely than other occupations to say they have taken personal action to fight climate change. Respondents' financial security also plays a role: Two thirds of those that never have trouble paying their bills have taken personal action to fight climate change, compared to only 52% of those that say they have trouble paying bills most of the time. This may be an indication that many actions to fight climate change have a cost that some are unable to meet. The more serious a respondent considers climate change to be, the more likely they are to say they have taken personal action to try and combat climate change. Only 48% of those that believe climate change is not a serious problem have taken personal action, compared to 69% of those who believe climate change is very serious
74 QB4.8 For each of the following statements, please tell me whether you totally agree, tend to agree, tend to disagree or totally disagree. You personally have taken actions aimed at helping to fight climate change Total Agree Total Disagree DK EU27 63% 31% 6% Sex Male 62% 33% 5% Female 63% 30% 7% Age % 38% 6% % 31% 5% % 30% 4% % 30% 8% Education (End of) 15-57% 34% 9% % 32% 5% % 26% 3% Still studying 57% 36% 7% Respondent occupation scale Self- employed 68% 27% 5% Managers 76% 22% 2% Other white collars 66% 29% 5% Manual workers 62% 33% 5% House persons 60% 32% 8% Unemployed 54% 39% 7% Retired 60% 31% 9% Students 57% 36% 7% Difficulties paying bills Most of the time 52% 39% 9% From time to time 60% 32% 8% Almost never 66% 29% 5% Perception of climate change Not a serious problem 48% 47% 5% A fairly serious problem 57% 37% 6% A very serious problem 69% 27% 4%
75 2.3 Ways that European citizens are taking personal action The last section illustrated that more than six in ten Europeans have taken some personal action to try and fight climate change. This section of the report explores the kinds of actions these individuals have taken. Respondents that said they were taking personal action to fight climate change were given a list of possible activities and asked to nominate which ones they were doing 14. All the results in this section are based on the responses of those that said they were taking personal action to fight climate change. The European Union s climate change website 15 provides a range of simple actions that people can take to fight climate change, which are summarised under the headings turn down, switch off, recycle, and walk. How many Europeans are taking these steps? Europeans have embraced recycling, with more than three quarters of those taking personal action to fight climate change are actively separating their waste and recycling what they can. This is the most common action being taken. The message to save energy has also been heard by many, with more than half of the respondents actively trying to reduce consumption of energy (63%) and water (55%) at home. 41% of those taking action to fight climate change are reducing their consumption of disposable items such as plastic bags and packaging, whilst just under one third are trying to buy seasonal food and reduce their consumption of food that has been transported long distances. 14 QB5 Which of the following actions aimed at fighting climate change have you personally taken? You are separating most of your waste for recycling; You are reducing your consumption of energy at home (for example by turning down air conditioning or heating, not leaving appliances on stand-by, buying energy efficient products such as low-energy light bulbs or appliances); You are reducing your consumption of water at home (for example not leaving water running when washing the dishes, etc.); You are reducing the consumption of disposable items (for example plastic bags, certain kind of packaging, etc.); You buy seasonal and local products to avoid products that come from far away, and thus contribute to CO2 emissions (because of the transport); You have chosen an environmentally friendly way of transportation (by foot, bicycle, public transport); You are reducing the use of your car, for example by car-sharing or using your car more efficiently; You have purchased a car that consumes less fuel, or is more environmentally friendly; Where possible you avoid taking short-haul flights; You have switched to an energy supplier or tariff supplying a greater share of energy from renewable sources than your previous one; You have installed equipment in your own home that generates renewable energy (for example, a wind turbine, solar panels)
76 Actions that involve transportation are less common, with just over one quarter (28%) choosing an environmentally friendly way of transport such as public transport or bicycles, and 24% saying they have reduced the use of their car. One in five (20%) have purchased a more fuel efficient or environmentally friendly car. Only 11% said they avoid taking short haul flights were possible. This may be because many of the respondents don t ever take short haul flights, so there is nothing to reduce, or it may be that respondents are taking as many short haul flights as before. It may also be a combination of the two. Greener energy options are the least popular, with only 9% switching to a greener energy tariff or supplier, and only 6% having installed their own energy generation equipment such as solar panels or wind turbines. There were no large changes in these results when compared to the last time this question was asked in March-April
77 QB5 Which of the following actions aimed at fighting climate change have you personally taken? (MULTIPLE ANSWERS POSSIBLE) (IF 'YOU PERSONALLY HAVE TAKEN ACTIONS AIMED AT HELPING TO FIGHT CLIMATE CHANGE') - % EU + and - indicate evolution from EB69.2 Mar-Apr 2008 You are separating most of your waste for recycling 78% +2 You are reducing your consumption of energy at home (for example by turning down air conditioning or heating, not leaving appliances on stand-by, buying energy efficient products such as low-energy light bulbs or appliances) 63% -1 You are reducing your consumption of water at home (for example not leaving water running when washing the dishes, etc.) 55% = You are reducing the consumption of disposable items (for example plastic bags, certain kind of packaging, etc.) 41% +1 You buy seasonal and local products to avoid products that come from far away, and thus contribute to CO2 emissions (because of the transport) 29% +2 You have chosen an environmentally friendly way of transportation (by foot, bicycle, public transport) 28% = You are reducing the use of your car, for example by carsharing or using your car more efficiently 24% -1 You have purchased a car that consumes less fuel, or is more environmentally friendly 20% +2 Where possible you avoid taking short-haul flights 11% -1 You have switched to an energy supplier or tariff supplying a greater share of energy from renewable sources than your previous one 9% +1 You have installed equipment in your own home that generates renewable energy (for example, a wind turbine, solar panels) 6%
78 Turning to the country-by country analysis, recycling has been embraced by the majority in every country except Romania. Almost everyone taking action against climate change in France is recycling, closely followed by Germany, Belgium, Luxembourg, the United Kingdom and Ireland. Since March-April 2008 recycling behaviour has increased in Cyprus (up from 31% to 55%), Malta (up from 53% to 77%), Estonia (up from 68% to 78%), Portugal (up from 60% to 71%) and Finland (71% to 82%). Only Slovakia has seen a decrease in recycling behaviour, down from 82% in March-April 2008 to 72% in August-September The message to reduce home energy consumption has been adopted by most Danes, with 85% saying they are taking steps to reduce their energy use at home. At least three quarters of Germans, Dutch and respondents from Luxembourg say they are doing the same. The only country showing a large change in trying to reduce home energy use is Cyprus, where the proportion taking this action actually fell from 84% to 71% between March-April 2008 and August-September Many Cypriots have, however, taken steps to reduce their water consumption, with 78% saying they do this the highest proportion in Europe. Other countries where at least seven out of ten say they are saving water were Malta, Denmark, Luxembourg and France. Finland showed the greatest increase in the proportion of respondents saying they try to reduce water use, up from 44% in March-April 2008 to 60% in August-September More Maltese also say they are saving water up from 61% to 73% in the same period. Cyprus (down from 92% to 78%) and Slovakia (down from 73% to 60%) show the largest decrease in water saving behaviour between March-April 2008 and August-September Reducing consumption of disposable items is less common across Europe than recycling and saving energy and water. However, six out of ten respondents in Luxembourg say they are trying to use fewer disposable items, and rates are also much higher than the overall EU average in Belgium, Austria, Denmark, France and Sweden
79 Since March-April 2008 more Estonians (up from 35% to 52%), Slovenians (up from 33% to 48%) and Maltese (up from 39% to 50%) have started to reduce their consumption of disposable items. However, the proportion of respondents selecting this option has actually fallen in Ireland (from 61% to 45%) over the same period. French and Austrian respondents are the most likely to be buying seasonal and local products, but Luxembourg, Sweden and Estonia also have considerably higher levels of response than the EU average. Buying local and seasonal food has enjoyed the biggest increase in popularity as a means to combat climate change in France (March-April 2008: 39%, August- September 2009: 54%) and Italy (March-April 2008: 18%, August-September: %) The Swedes are the most likely to be choosing environmentally friendly transport options such as public transport, cycling or walking, followed by those in Luxembourg, Latvia, and Finland. Environmentally friendly transport options have seen the largest increases since March-April 2008 in Estonia (up from 24% to 43%), Sweden (up from 41% to 58%), Luxembourg (up from 38% to 48%) and Finland (up from 36% to 47%). Only the Greeks have decreased their use of environmentally friendly transport (down from 38% to 26%). More than one third of respondents in Luxembourg, and 36% of Germans say they have bought a more fuel efficient or environmentally friendly car. In fact, the popularity of buying a more fuel efficient car in Luxembourg has increased from 29% since March-April In addition, at least one third of respondents Luxembourg are taking action to fight climate change by reducing their car use. Reducing car use is also a popular action in Sweden, Belgium, The Netherlands, and France. Just over one third (35%) of respondents living in Luxembourg and Sweden say they avoid taking short haul flights, whilst Finns and Germans also try to avoid short distance air travel
80 Respondents in the Netherlands, Sweden, Belgium and the United Kingdom are most likely to have switched supplier or tariff to a greener option. However, installing equipment at home to generate energy, such as solar panels or wind turbines is a large step and one not available to many who live in high density city housing. In spite of this, at least 10% of respondents in Malta, Austria, Germany and Belgium have installed renewable energy generation equipment at home. Only Sweden has seen a large change in installing energy generation equipment at home since March-April 2008, with the proportion taking this action decreasing from 19% to 9% in August-September

81 *Highest results by country are in bold; Lowest results by country are in italic; Highest results by item are in a grey rectangle and Lowest results by item are in a black border rectangle
82 The socio-demographic analysis illustrates that women are more likely to be taking most of these actions to fight climate change, but men are more likely to have purchased a greener car. Other trends are: In general, the youngest age group (15 24 years) are the least likely to be taking any of these actions to fight climate change. The exception is greener transport, but this is not surprising as many in this age group are too young to drive and/or are at school or university. In general, the longer a respondent stayed in education, the more likely they are to be taking each of these actions to fight climate change. Those that live in large towns are more likely to be choosing greener transport options than those living in small towns or rural villages. This is likely to be a direct result of greater availability, particularly of public transport, in large towns. Respondent s financial position has a mixed impact on their actions to fight climate change. Those who almost never have trouble paying their bills are the most likely to be taking almost all of these actions to fight climate change, and in particular to be recycling, reducing consumption of disposables and buying local and seasonal food. Conversely, saving water and choosing greener transport options (public transport, walking or cycling) are actions more likely to be taken by those who always struggle to pay their bills. Those who consider climate change to be a serious problem are more likely to be taking most of the simpler actions (recycling, saving energy and water etc). However, they are not more likely to have to have purchased a greener car, to be reducing their car use, or to avoid short-haul flights. Nor are they more likely to have switched to a greener energy supplier, or to have installed renewable energy generation equipment at home. These results may suggest that it is the simple actions that require a minimal lifestyle change and no cost (e.g. recycling, turning off lights, saving water) that people are most willing and able to make even those that believe climate change is a serious problem
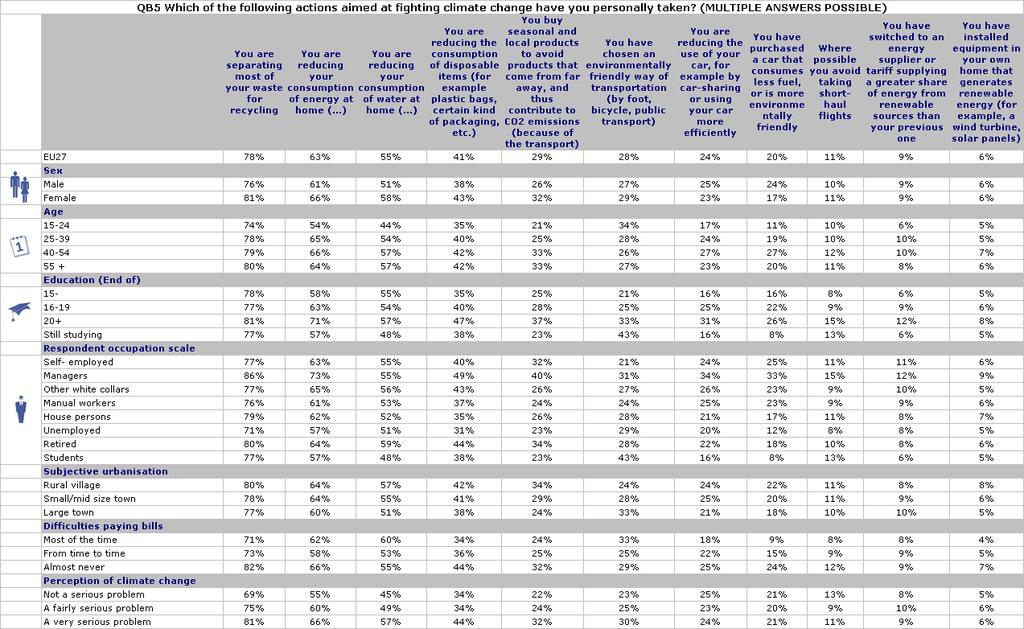
83 - 78 -
84 3. PAYING MORE FOR ALTERNATIVE ENERGY? Earlier sections have revealed that most Europeans think climate change is a serious problem, and that more should be done to combat it. The results also show that most respondents think that alternative fuels should be used to help reduce greenhouse gases. But are Europeans willing to pay more for these greener forms of energy? If they are, how much more would they pay? Overall, almost half of all Europeans (49%) are be willing to pay more for alternative forms of energy. Most of these (25%) are willing to pay 1-5% more for greener energy, whilst a further 20% would be willing to pay between 6% and 20% more. Only 4% would be willing to pay more than this, whilst 27% are unwilling to pay any extra for greener energy. However, almost one quarter (24%) of respondent are unable to say if they would pay more. These categories have been constructed from respondents open answers to the question of how much more they would be ready to pay 16. An average percentage increase has also been calculated among all respondents expressing an opinion, be it favourable to any price increase or not 17 : on average, Europeans are ready to pay 6.6% more for energy produced from sources that emit less greenhouse gases in order to fight the climate change 18. Comparing these results to the last time this question was asked, in March-April 2008, there has been a slight increase in the proportion wiling to pay anything for greener energy, with No responses down from 30% to 27%. The proportion of Europeans willing to pay 1-5% more has also increased from 18% to 25%. The proportion of those saying they don t know has decreased slightly from 26% to 24%.. 16 QB7 Personally, how much would you be prepared to pay more for energy produced from sources that emit less greenhouse gases in order to fight the climate change? In average, how much, in percent, would you be ready to pay more? 17 Respondents were invited, through an open-ended question, to indicate the percentage increase that they would be ready to pay (or not) for cleaner energy. The average of all respondents answers has been calculated excluding the "don't knows" and including those who answered 0% and No, not ready to pay more. This average figure is weighted according to the different countries populations in the European Union. 18 However, it should be noted that the basis for calculation is different. In March-April 2008, 74% of respondents expressed an opinion (whether favourable to any price increase or not), while they are 76% in August-September
85 Interestingly, the average percentage increase that respondents would be ready to pay for cleaner energy has decreased slightly, from 7.2% to 6.6%. Generally speaking, compared to March-April 2008, more Europeans are ready to pay more, but the amount that they are ready to pay has slightly decreased. Taking only into account the answers provided by respondents ready to pay more for greener energy, the average percentage increase is 10,2% in August-September 2009, to be compared with the figure of 12,1% recorded in March April However, there is no clear majority of Europeans willing to pay more for greener energy. Indeed, the fact that only 9% of Europeans have already switched to greener energy supplier or greener energy tariff 20 indicates the scale of the challenge both in creating greener energy options for consumers, and then encouraging them to choose and pay for them. 19 However, it should be noted that the basis for calculation is different. In March-April 2008, 44% of respondents were ready to pay more for greener energy while they are 49% in August-September See section 2.3 of this report
86 QB7 Personally, how much would you be prepared to pay more for energy produced from sources that emit less greenhouse gases in order to fight the climate change? In average, how much, in percent, would you be ready to pay more? - % EU EB72.1 Aug.- Sep EB69.2 Mar. -Apr No 27% 30% 1-5 % 18% 25% 6-10 % 14% 14% % 8% 10% More than 30% 2% 2% DK 24% 26%
87 Turning to an analysis of individual countries, respondents from Sweden, Denmark, Finland and Luxembourg are the most willing to pay more for greener forms of energy, whilst those in Latvia, Estonia, the Czech Republic and Germany are the least likely to be say they would pay more for green energy. In terms of the actual percentage extra respondents would be willing to spend, those in Sweden, Malta, France and Luxembourg are willing to pay the most for greener energy, whilst those in Austria and the Czech Republic the least
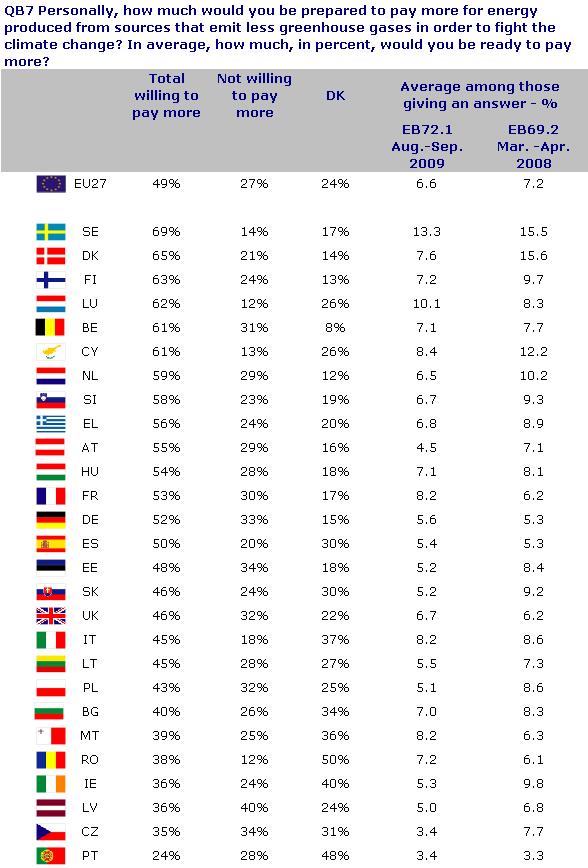
88 - 83 -
89 Looking at the change in opinion since March-April 2008, there has been a large increase in the proportion of Romanians that don t know if they would pay more (from 22% to 50%), and this has mostly come from a decrease in those saying they would not pay more (down from 49% to 12%). However there has also been an increase from 11% to 21% in those willing to pay 1-5% extra over the same time period. Unwillingness to pay more for alternative energy has increased the Czech Republic (up from 24% to 34%) and Poland (up from 22% to 32%) since March-May There have not been any significant increases in those willing to pay more in any country, but this is not entirely surprising considering the global financial crisis and the worsening of economic conditions that has occurred since March-April The social-demographic analysis shows that: Men are more willing to pay extra for greener energy than women, whilst women are more likely to say they don t know if they would pay extra. Those aged 55+ are the least willing to pay extra for greener energy. This is both due to having the highest proportion of No responses, and having a high level of don t know responses. Those who stayed in education until at least 20 years are the most likely to be willing to pay more for greener energy, and are also the most likely to have an opinion. As education levels decrease, the proportion of don t know responses increases. Managers are the occupational group most willing to pay more, and house persons, retired and the unemployed the least willing to pay more. Financial security is closely related to a willingness to pay more,: 38% of those who have problems paying their bills most of the time are unwilling to pay more for green-energy, compared to less than 1 out of 4 of those who almost never have trouble paying their bills. The more serious a respondent believes climate change to be, the more willing they are to pay extra for greener energy
90 QB7 Personally, how much would you be prepared to pay more for energy produced from sources that emit less greenhouse gases in order to fight the climate change? In average, how much, in percent, would you be ready to pay more? Total willing to pay more Not willing to pay more DK Average among those giving an answer - % EU27 49% 27% 24% 6.6 Sex Male 53% 25% 22% 6.9 Female 45% 28% 27% 6.3 Age % 20% 28% % 24% 22% % 28% 20% % 32% 27% 5.5 Education (End of) 15-34% 35% 31% % 29% 23% % 21% 16% 8.2 Still studying 55% 14% 31% 9.9 Respondent occupation scale Self-employed 54% 24% 22% 7.6 Managers 68% 19% 13% 8.1 Other white collars 56% 22% 22% 6.5 Manual workers 49% 29% 22% 6.3 House persons 39% 28% 33% 6.4 Unemployed 43% 34% 23% 6.1 Retired 40% 33% 27% 5.0 Students 55% 14% 31% 9.9 Difficulties paying bills Most of the time 34% 38% 28% 4.6 From time to time 43% 30% 27% 5.9 Almost never 54% 24% 22% 7.2 Perception of climate change Not a serious problem 40% 43% 17% 4.3 A fairly serious problem 43% 32% 25% 5.9 A very serious problem 54% 22% 24%
91 CONCLUSION Europeans consider that climate change is the second most serious problem facing the world today. Only one in ten believe climate change is not a serious problem in fact the majority feel it is a very serious issue, and they also believe that it is possible to take actions to fight climate change. These opinions are important foundation stones for any actions on climate change belief in the seriousness of climate change, and that it can be stopped are important precursors to taking action. However, in some countries, particularly Latvia and Estonia, a considerable proportion of respondents do feel that climate change is unstoppable. These beliefs will need to be addressed in order to generate more support for actions to fight climate change. It is likely that there will be public support for greater action at EU and national levels as a majority of Europeans feel that governments and the European Union are not doing enough to fight climate change. Actions that include the development and use of alternative fuels will be welcomed by more than three quarters of Europeans, however the results suggest there may be less support for bio-fuels than other forms of alternative fuels. Support for alternative forms of energy is crucial, as current mainstream forms of energy generation are one of the biggest contributors to climate change. At least six out of ten Europeans believe that fighting climate change and taking steps to protect the environment can have a positive impact on the European economy, providing support for the drive to boost the economy by creating green jobs and greener industries. The majority of Europeans have also turned their belief into action, with at least six out of ten taking personal actions to fight climate change. Those doing so are, not surprisingly, most likely to have a strong belief in the seriousness of climate change and the fact that we can do something about it
92 Citizens in Luxembourg, Malta, Sweden and Slovakia are the most likely to be turning their beliefs into actions, whilst more is needed to encourage Bulgarians, Latvians, Lithuanians and Romanians to take the fight against climate change to a personal level. Most Europeans taking personal action are taking steps to recycle and to reduce their energy and water use. Many are also trying to buy seasonal and local products and choose greener transport options. However, that the majority have not embraced greener energy suppliers or tariffs although half say they are willing to pay more for these indicates that more work is yet to be done to make these options available and appealing to the majority of Europeans. Several broader socio-demographic themes emerge from these results. Staying longer in education until at least 20 years of age has a similar impact on people s opinions about climate change. The financial position of respondents also impact on their actions to fight climate change: many of which come at a cost something that those already struggling to pay their bills can not afford, even if they believe in climate change and want to take greater action. Use of the internet in general increases knowledge allowing people to express an opinion and is related to an increased belief in the seriousness of climate change, the belief that society at all levels is not doing enough, and an increase in the proportion taking personal actions to fight climate change. The results suggest strategies to target older Europeans may be warranted as this group are the most likely to consider climate change is not a serious issue. They are often the most likely group to be unable to form an opinion, although when it comes to taking personal action it is the youngest age group, those aged 15 24, that are least likely to be taking personal action. This is in spite of the fact that they are not significantly less likely to consider that climate change is a serious issue, nor are they more likely to consider climate change is unstoppable. Whilst considerable country variations on individual measures have been discussed throughout this report, the broader picture that emerges is one of a Europe where the majority believe climate change is a serious issue, and support greater action from all levels of society in the fight against climate change
93 ANNEXES
94
95 TECHNICAL SPECIFICATIONS
96
97 SPECIAL EUROBAROMETER N 322 Climate change TECHNICAL SPECIFICATIONS Between the 28 th of August and the 17 th of September 2009, TNS Opinion & Social, a consortium created between TNS plc and TNS opinion, carried out wave 72.1 of the EUROBAROMETER, on request of the EUROPEAN COMMISSION, Directorate-General for Communication, Research and Political Analysis. The SPECIAL EUROBAROMETER N 322 is part of wave 72.1 and covers the population of the respective nationalities of the European Union Member States, resident in each of the Member States and aged 15 years and over. The basic sample design applied in all states is a multi-stage, random (probability) one. In each country, a number of sampling points was drawn with probability proportional to population size (for a total coverage of the country) and to population density. In order to do so, the sampling points were drawn systematically from each of the "administrative regional units", after stratification by individual unit and type of area. They thus represent the whole territory of the countries surveyed according to the EUROSTAT NUTS II (or equivalent) and according to the distribution of the resident population of the respective nationalities in terms of metropolitan, urban and rural areas. In each of the selected sampling points, a starting address was drawn, at random. Further addresses (every Nth address) were selected by standard "random route" procedures, from the initial address. In each household, the respondent was drawn, at random (following the "closest birthday rule"). All interviews were conducted face-to-face in people's homes and in the appropriate national language. As far as the data capture is concerned, CAPI (Computer Assisted Personal Interview) was used in those countries where this technique was available.
98 ABBREVIATIONS COUNTRIES INSTITUTES N FIELDWORK POPULATION INTERVIEWS DATES 15+ BE Belgium TNS Dimarso /08/ /09/ BG Bulgaria TNS BBSS /08/ /09/ CZ Czech Rep. TNS Aisa /08/ /09/ DK Denmark TNS Gallup DK /08/ /09/ DE Germany TNS Infratest /08/ /09/ EE Estonia Emor /08/ /09/ IE Ireland TNS MRBI /08/ /09/ EL Greece TNS ICAP /08/ /09/ ES Spain TNS Demoscopia /09/ /09/ FR France TNS Sofres /08/ /09/ IT Italy TNS Infratest /08/ /09/ CY Rep. of Cyprus Synovate /08/ /09/ LV Latvia TNS Latvia /08/ /09/ LT Lithuania TNS Gallup Lithuania /08/ /09/ LU Luxembourg TNS ILReS /08/ /09/ HU Hungary TNS Hungary /08/ /09/ MT Malta MISCO /08/ /09/ NL Netherlands TNS NIPO /08/ /09/ AT Austria Österreichisches Gallup-Institut /08/ /09/ PL Poland TNS OBOP /08/ /09/ PT Portugal TNS EUROTESTE /09/ /09/ RO Romania TNS CSOP /08/ /09/ SI Slovenia RM PLUS /08/ /09/ SK Slovakia TNS AISA SK /08/ /09/ FI Finland TNS Gallup Oy /08/ /09/ SE Sweden TNS GALLUP /08/ /09/ UK United Kingdom TNS UK /08/ /09/ TOTAL /08/ /09/


99 For each country a comparison between the sample and the universe was carried out. The Universe description was derived from Eurostat population data or from national statistics offices. For all countries surveyed, a national weighting procedure, using marginal and intercellular weighting, was carried out based on this Universe description. In all countries, gender, age, region and size of locality were introduced in the iteration procedure. For international weighting (i.e. EU averages), TNS Opinion & Social applies the official population figures as provided by EUROSTAT or national statistic offices. The total population figures for input in this post-weighting procedure are listed above. Readers are reminded that survey results are estimations, the accuracy of which, everything being equal, rests upon the sample size and upon the observed percentage. With samples of about 1,000 interviews, the real percentages vary within the following confidence limits: Observed percentages 10% or 90% 20% or 80% 30% or 70% 40% or 60% 50% Confidence limits ± 1.9 points ± 2.5 points ± 2.7 points ± 3.0 points ± 3.1 points
100
101 QUESTIONNAIRE
102
103 Now let's talk about another topic. Passons maintenant à un autre sujet. QB1a In your opinion, which of the following do you consider to be the most serious problem currently facing the world as a whole? Firstly? QB1a Selon vous, parmi les problèmes suivants lequel considérez-vous actuellement comme le plus sérieux pour le monde dans son ensemble? En premier? (SHOW CARD - READ OUT - ONE ANSWER ONLY) Climate change International terrorism Poverty, lack of food and drinking water The spread of an infectious disease A major global economic downturn The proliferation of nuclear weapons Armed conflicts The increasing world population Other (SPONTANEOUS) (M) None (SPONTANEOUS) DK EB71.1 QE1a (NO MORE SPLIT) (MONTRER CARTE - LIRE - UNE SEULE REPONSE) ( ) ( ) 1 Le changement climatique 1 2 Le terrorisme international 2 3 La pauvreté, le manque de nourriture et d eau potable 3 4 La propagation d une maladie infectieuse 4 5 Un important recul de l économie mondiale 5 6 La prolifération d armes nucléaires 6 7 Des conflits armés 7 8 L augmentation de la population mondiale 8 9 Autre (SPONTANE) (M) 9 10 Aucun (SPONTANE) NSP 11 EB71.1 QE1a (NO MORE SPLIT) QB1b Any others? QB1b Et ensuite? (SHOW CARD - READ OUT - MAX. 3 ANSWERS) Climate change International terrorism Poverty, lack of food and drinking water The spread of an infectious disease A major global economic downturn The proliferation of nuclear weapons Armed conflicts The increasing world population Other (SPONTANEOUS) (M) DK EB71.1 QE1b (NO MORE SPLIT) (MONTRER CARTE - LIRE - MAX. 3 REPONSES) ( ) ( ) 1, Le changement climatique 1, 2, Le terrorisme international 2, 3, La pauvreté, le manque de nourriture et d eau potable 3, 4, La propagation d une maladie infectieuse 4, 5, Un important recul de l économie mondiale 5, 6, La prolifération d armes nucléaires 6, 7, Des conflits armés 7, 8, L augmentation de la population mondiale 8, 9, Autre (SPONTANE) (M) 9, 10, NSP 10, EB71.1 QE1b (NO MORE SPLIT) MasterIN721_v /64 23/11/2009
104 QB2 And how serious a problem do you think climate change is at this moment? Please use a scale from 1 to 10, '1' would mean that it is "not at all a serious problem" and '10' would mean that it is a problem extremely serious". QB2 Et dans quelle mesure pensez-vous que le changement climatique est un problème sérieux actuellement? Utilisez s'il vous plaît cette échelle de 1 à 10 où '1' signifie que ce n est "pas du tout un problème sérieux" et '10' que c est "un problème extrêmement sérieux". (SHOW CARD - ONE ANSWER ONLY) 1 Not at all a serio us probl em A probl em extre mely serio us (MONTRER CARTE - UNE SEULE REPONSE) ( ) ( ) Pas Un un probl probl ème ème extrê série mem ux ent du série tout ux DK EB71.1 QE2b (FILTER MODIFIED) 11 NSP 11 EB71.1 QE2b (FILTER MODIFIED) QB3 In your opinion, is each of the following currently doing too much, doing about the right amount, or not doing enough to fight climate change? QB3 Selon vous, pour chacune des propositions suivantes, pouvez-vous me dire s ils en font trop, assez ou pas assez pour lutter contre le changement climatique? (SHOW CARD WITH SCALE ONE ANSWER PER LINE) (MONTRER CARTE AVEC ECHELLE UNE REPONSE PAR LIGNE) (READ-OUT - ROTATE) Doing too much Doing about the right amount Not doing enough DK (LIRE - ROTATION) En font trop En font assez N en font pas assez NSP (498) 1 The (NATIONALITY) Government (498) 1 Le Gouvernement (NATIONALITE) (499) 2 The European Union (499) 2 L Union européenne Regional and local authorities (N) Les autorités locales et régionales (N) (500) (500) (501) 4 Corporations and industry (501) 4 Les grandes entreprises et l industrie (502) 5 Citizens themselves (502) 5 Les citoyens eux-mêmes EB69.2 QE4a TREND MODIFIED EB69.2 QE4a TREND MODIFIED MasterIN721_v /64 23/11/2009
105 ASK ITEMS 3 and 6 ONLY TO SPLIT A, ASK ITEMS 4 and 7 ONLY TO SPLIT B POSER ITEMS 3 et 6 SEULEMENT AU SPLIT A, POSER ITEMS 4 et 7 SEULEMENT AU SPLIT B QB4 For each of the following statements, please tell me whether you totally agree, tend to agree, tend to disagree or totally disagree. QB4 Pour chacune des affirmations suivantes, veuillez me dire si vous êtes tout à fait d accord, plutôt d accord, plutôt pas d accord ou pas du tout d accord. (SHOW CARD WITH SCALE - ONE ANSWER PER LINE) INTERVIEWER: if necessary, explain that CO2 (carbon dioxide) is a gas generated notably in the combustion of fossil fuels, for example by all types of transport that use hydrocarbons and by industrial plants and power generators using fossil fuels) (MONTRER CARTE AVEC ECHELLE - UNE REPONSE PAR LIGNE) INTERVIEWER: Si nécessaire, expliquer que le CO2 (dioxyde de carbone ou gaz carbonique) est un gaz qui est notamment produit lors de la combustion de carburants fossiles. Par exemple, par tous les modes de transport ainsi que par les usines industrielles et groupes électrogènes qui utilisent des hydrocarbures) (READ OUT ROTATE ITEMS 1 TO 7) Totally agree Tend to agree Tend to disagree Totally disagree DK (LIRE ROTATION ITEMS 1 A 7) Tout à fait d accord Plutôt d accord Plutôt pas d accord Pas du tout d accord NSP (503) (504) (505) (506) (507) Climate change is an unstoppable process, we cannot do anything about it The seriousness of climate change has been exaggerated (SPLIT A) Emissions of CO2 (Carbon dioxide) and other greenhouse gases have only a marginal impact on climate change (N) (SPLIT B) Emissions of CO2 (Carbon dioxide) have only a marginal impact on climate change (M) Fighting climate change can have a positive impact on the European economy (503) (504) (505) (506) (507) Le changement climatique est un processus impossible à arrêter, nous n y pouvons rien La gravité du changement climatique a été exagérée (SPLIT A) Les émissions de CO2 (dioxyde carbone\ gaz carbonique) et autres gaz à effet de serre n ont qu un effet marginal sur le changement climatique (N) (SPLIT B) Les émissions de CO2 (dioxyde carbone\ gaz carbonique) n ont qu un effet marginal sur le changement climatique (M) La lutte contre le changement climatique peut avoir un effet positif sur l économie européenne MasterIN721_v /64 23/11/2009
106 (508) (509) (510) (SPLIT A) Alternative fuels, such as "bio fuels", should be used to reduce greenhouse gas emissions (M) (SPLIT B) Alternative fuels should be used to reduce greenhouse gas emissions (N) You personally have taken actions aimed at helping to fight climate change (508) (509) (510) (SPLIT A) Des carburants alternatifs tels que les "biocarburants" devraient être utilisés pour réduire les émissions de gaz à effet de serre (M) (SPLIT B) Des carburants alternatifs devraient être utilisés pour réduire les émissions de gaz à effet de serre (N) Vous avez personnellement pris des actions pour contribuer à la lutte contre le changement climatique EB71.1 QE4 TREND MODIFIED EB71.1 QE4 TREND MODIFIED MasterIN721_v /64 23/11/2009
107 ASK QB5 IF "YOU PERSONALLY HAVE TAKEN ACTIONS AIMED AT HELPING TO FIGHT CLIMATE CHANGE", CODE 1 OR 2 IN QB4.8 - OTHERS GO TO QB6a POSER QB5 SI "VOUS AVEZ PERSONNELLEMENT ENTREPRIS DES DEMARCHES POUR CONTRIBUER A LA LUTTE CONTRE LE CHANGEMENT CLIMATIQUE", CODE 1 OU 2 EN QB4.8 - LES AUTRES ALLER EN QB6a QB5 Which of the following actions aimed at fighting climate change have you personally taken? QB5 Parmi les démarches suivantes pour lutter contre le changement climatique, lesquelles avezvous personnellement entreprises? (SHOW CARD READ OUT MULTIPLE ANSWERS POSSIBLE) (M) You have purchased a car that consumes less fuel, or is more environmentally friendly You are reducing the use of your car, for example by car-sharing or using your car more efficiently You have chosen an environmentally friendly way of transportation (by foot, bicycle, public transport) You are reducing your consumption of energy at home (for example by turning down air conditioning or heating, not leaving appliances on stand-by, buying energy efficient products such as low-energy light bulbs or appliances) You are reducing your consumption of water at home (for example not leaving water running when washing the dishes, etc) Where possible you avoid taking short-haul flights You have switched to an energy supplier or tariff supplying a greater share of energy from renewable sources than your previous one You are separating most of your waste for recycling You are reducing the consumption of disposable items (for example plastic bags, certain kind of packaging, etc.) You buy seasonal and local products to avoid products that come from far away, and thus contribute to CO2 emissions (because of the transport) You have installed equipment in your own home that generates renewable energy (for example, a wind turbine, solar panels) Other (SPONTANEOUS) (M) DK (MONTRER CARTE LIRE - PLUSIEURS REPONSES POSSIBLES) (M) ( ) ( ) Vous avez acheté une voiture qui consomme moins de carburant ou qui est 1, plus respectueuse de l environnement 1, Vous utilisez votre voiture moins souvent, en pratiquant, par exemple, le 2, covoiturage ou en utilisant votre voiture plus efficacement 2, Vous avez choisi un mode de déplacement ménageant l environnement (à 3, pied, à bicyclette, en transports publics) 3, Vous réduisez la consommation énergétique dans votre foyer (en baissant par exemple le chauffage ou la climatisation, en ne laissant pas d'appareils en mode veille, en achetant des produits à faible consommation énergétique, tels que des ampoules et des appareils basse consommation) 4, 4, Vous réduisez la consommation d eau de votre foyer (par exemple en ne 5, laissant pas couler l eau pendant la vaisselle, etc.) 5, Dans la mesure du possible, vous évitez de prendre l'avion pour des vols 6, court-courriers 6, Vous avez changé de fournisseur ou de tarif d énergie pour recevoir une part d énergie provenant de sources renouvelables plus importante que 7, précédemment 7, 8, Vous triez la plupart de vos déchets pour le recyclage 8, Vous réduisez votre consommation de produits jetables (par exemple sacs 9, plastiques, certains types d emballage, etc.) 9, Vous achetez des produits de saison et locaux pour éviter des produits qui viennent de loin, et qui contribuent aux émissions de CO2 (à cause du 10, transport) 10, Vous avez installé des appareils à votre domicile qui génèrent de l énergie renouvelable (par exemple une éolienne, des panneaux solaires) 11, 11, 12, Autre (SPONTANE) (M) 12, 13, NSP 13, EB69.2 QE6 EB69.2 QE6 MasterIN721_v /64 23/11/2009
108 ASK QB6a TO SPLIT A OTHERS GO TO QB6b POSER QB6a AU SPLIT A LES AUTRES ALLER EN QB6b QB6a To what extend do you agree or disagree with the following statement: The protection of the environment can boost economic growth in the European Union. QB6a Dans quelle mesure êtes-vous d accord ou pas d accord avec l affirmation suivante : La protection de l environnement peut être un moteur pour la croissance économique dans l Union européenne. (READ OUT ONE ANSWER ONLY) Totally agree Tend to agree Tend to disagree Totally disagree DK NEW ASK QB6b TO SPLIT B OTHERS GO TO QB7 (524) (524) 1 Tout à fait d accord 1 2 Plutôt d accord 2 3 Plutôt pas d accord 3 4 Pas du tout d accord 4 5 NSP 5 NEW POSER QB6b AU SPLIT B LES AUTRES ALLER EN QB7 QB6b To what extend do you agree or disagree with the following statement: The protection of the environment is an obstacle to economic growth in the European Union. QB6b Dans quelle mesure êtes-vous d accord ou pas d accord avec l affirmation suivante : La protection de l environnement est un obstacle à la croissance économique dans l Union européenne. (READ OUT ONE ANSWER ONLY) Totally agree Tend to agree Tend to disagree Totally disagree DK NEW (LIRE UNE SEULE REPONSE) (525) (525) 1 Tout à fait d accord 1 2 Plutôt d accord 2 3 Plutôt pas d accord 3 4 Pas du tout d accord 4 5 NSP NEW 5 MasterIN721_v /64 23/11/2009
109 ASK ALL A TOUS QB7 Personally, how much would you be prepared to pay more for energy produced from sources that emit less greenhouse gases in order to fight the climate change? In average, how much, in percent, would you be ready to pay more? QB7 Personnellement, combien seriez-vous prêt à payer en plus pour de l énergie produite à partir de sources qui émettent moins de gaz à effet de serre afin de lutter contre le changement climatique? En moyenne combien, en pourcentage, seriez vous prêt à dépenser en plus? (CODE THE EXACT VALUE - PLEASE WRITE DOWN NNN - IF "NO", CODE "998" - IF "DK", (CODER LA VALEUR EXACTE - NOTER NNN - SI "NON", CODER "998" - SI "NSP", CODER PLEASE CODE "999") "999") ( ) ( ) % % EB69.2 QE9 EB69.2 QE9 MasterIN721_v /64 23/11/2009
110
111 TABLES
112
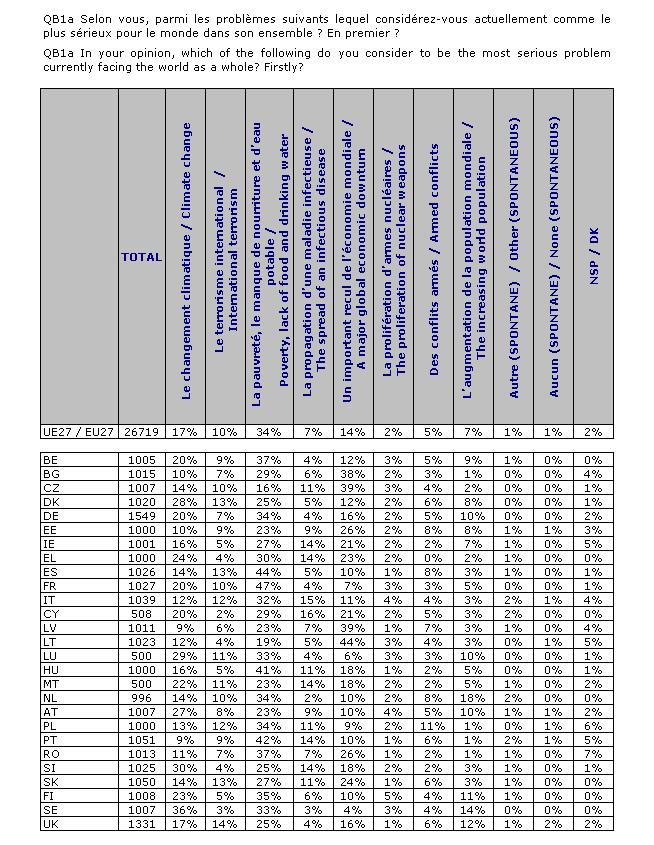
113
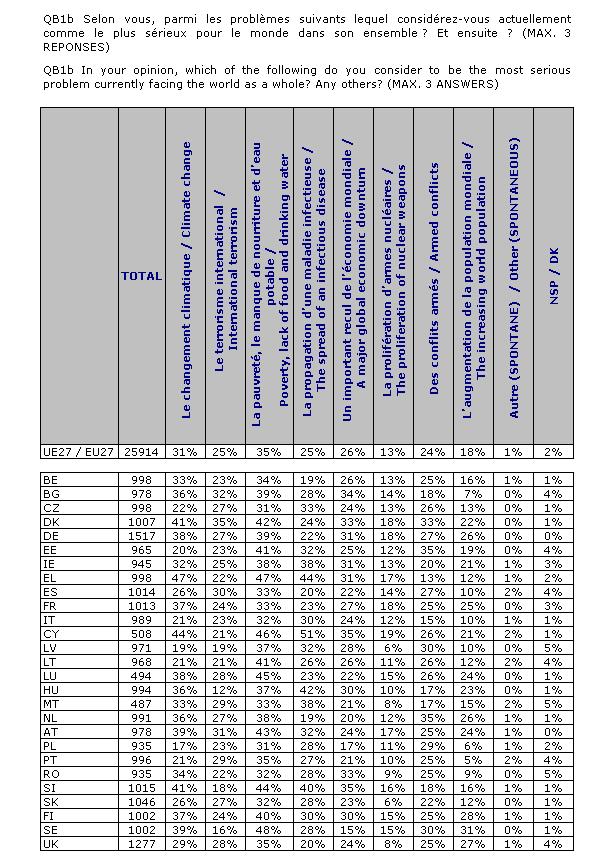
114
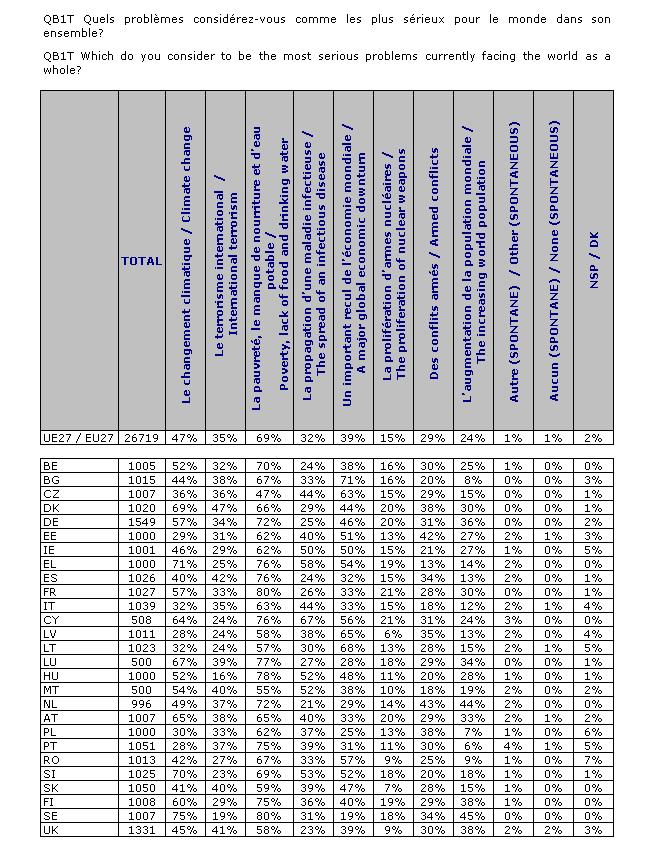
115
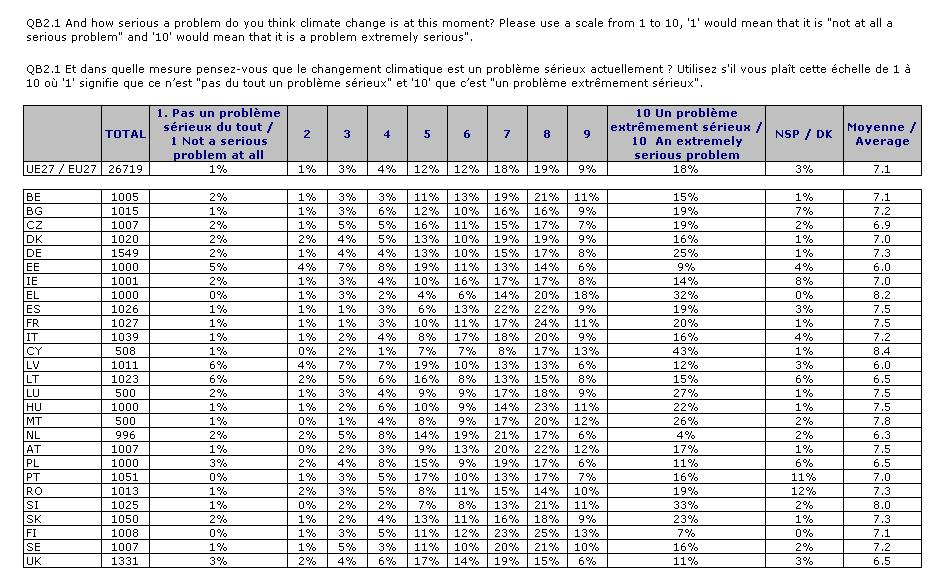
116
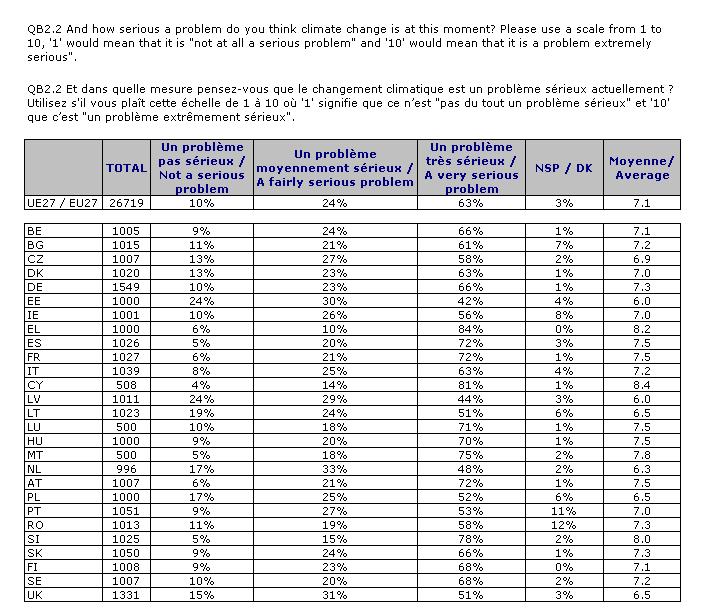
117
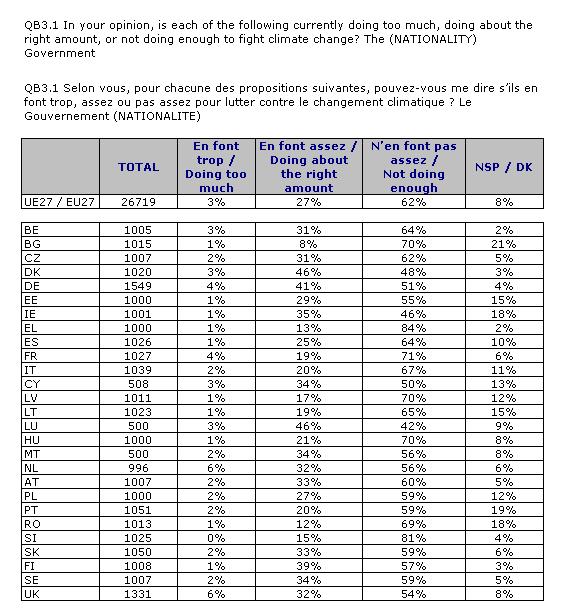
118
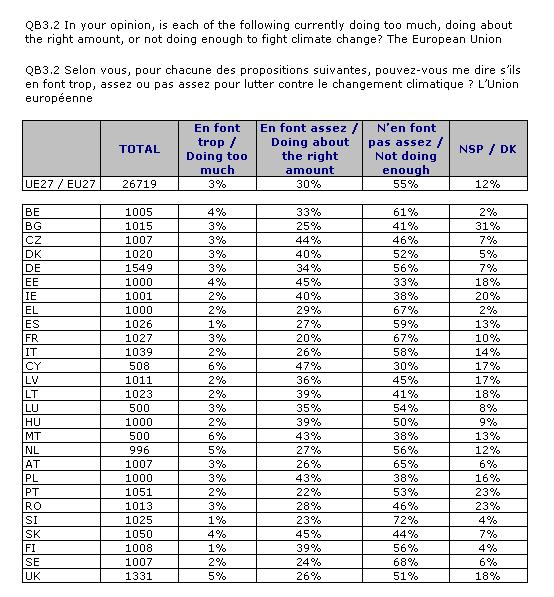
119
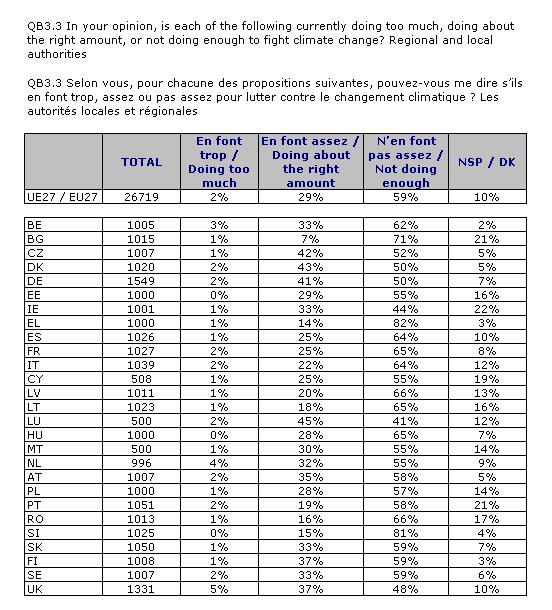
120
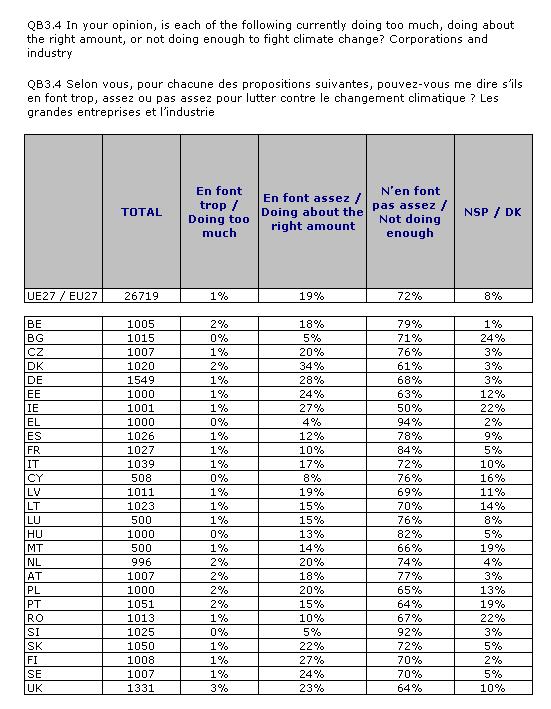
121
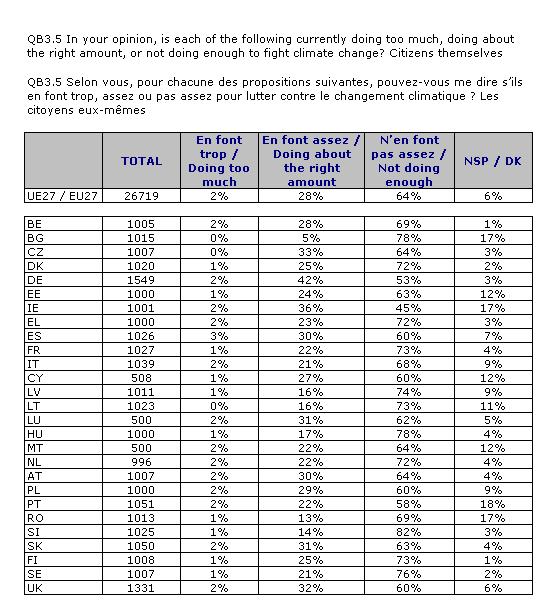
122
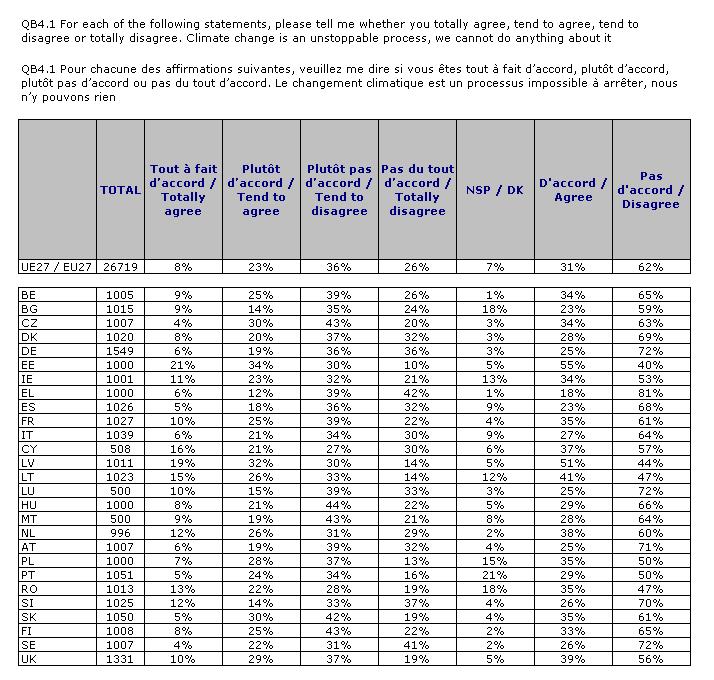
123
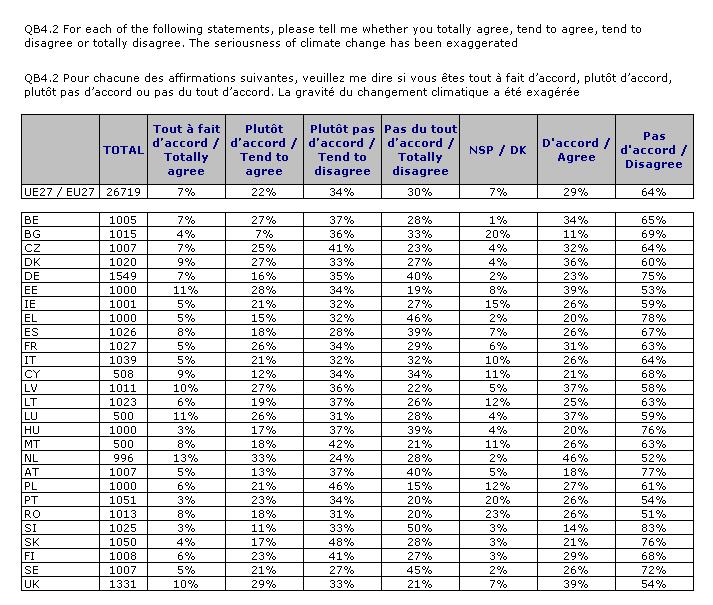
124
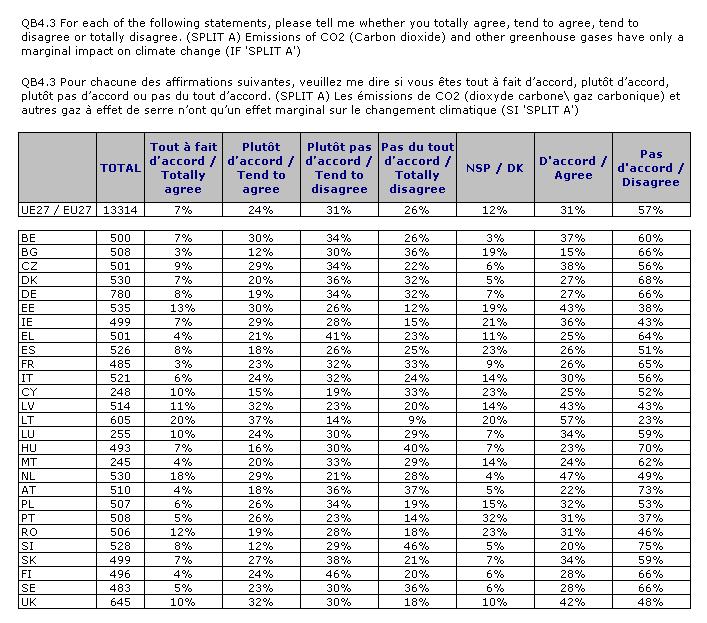
125
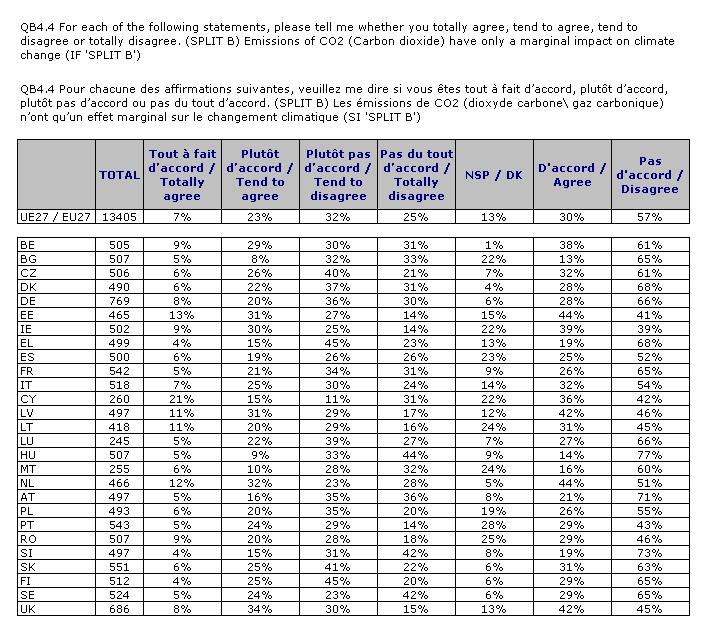
126
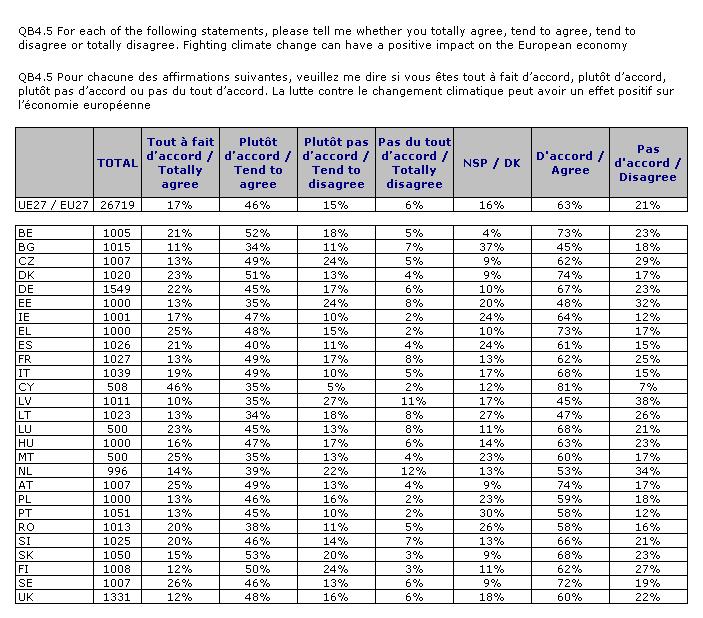
127
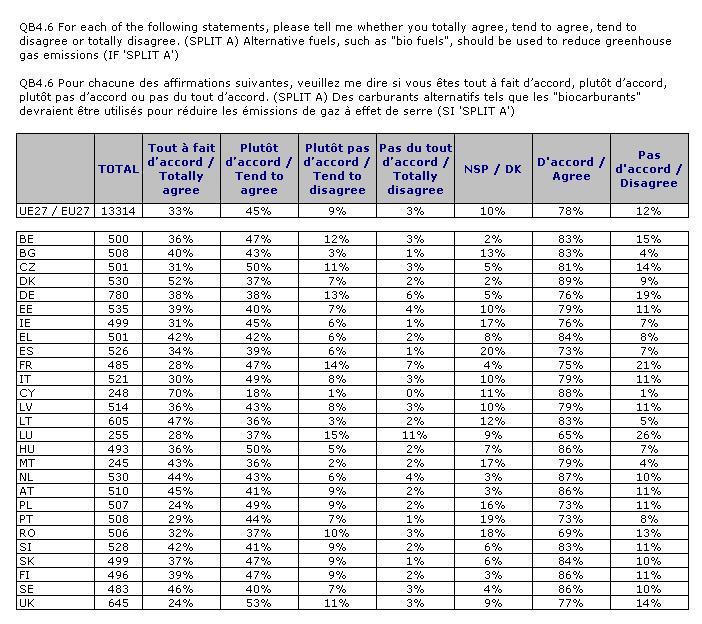
128
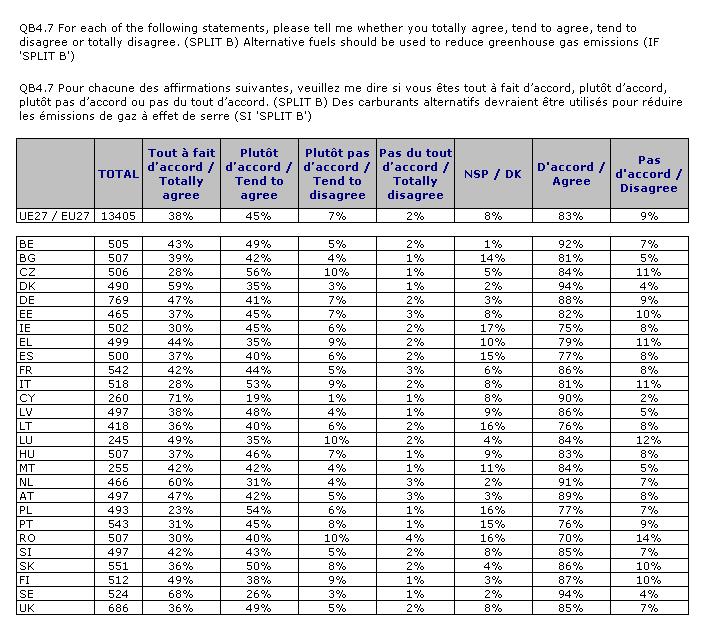
129
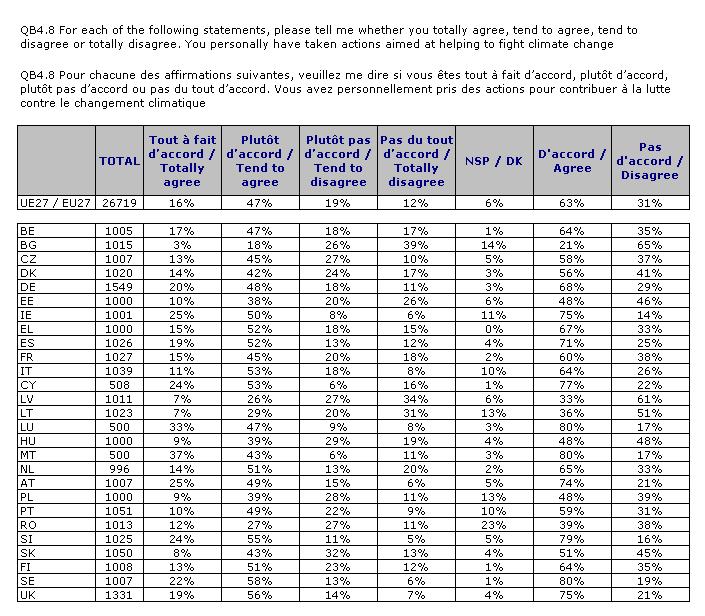
130
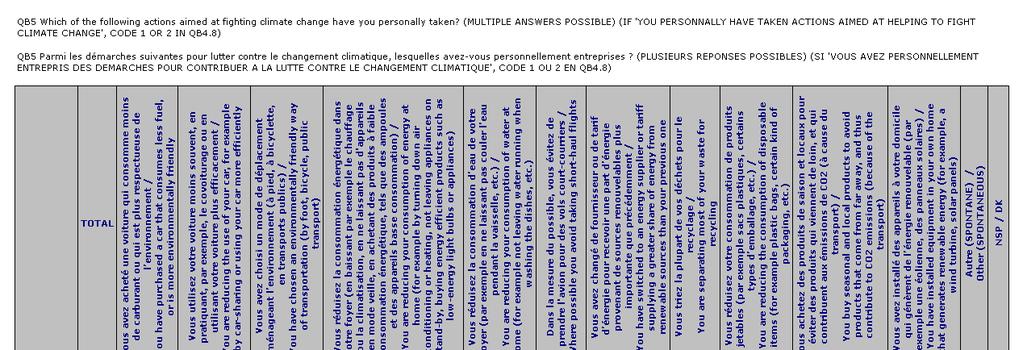
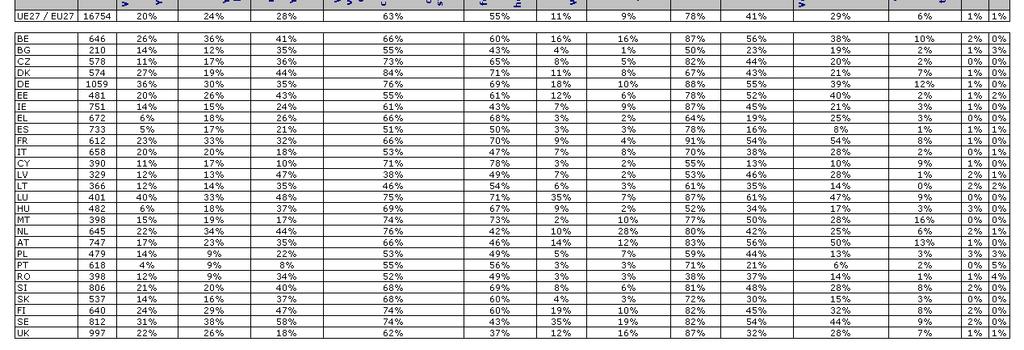
131
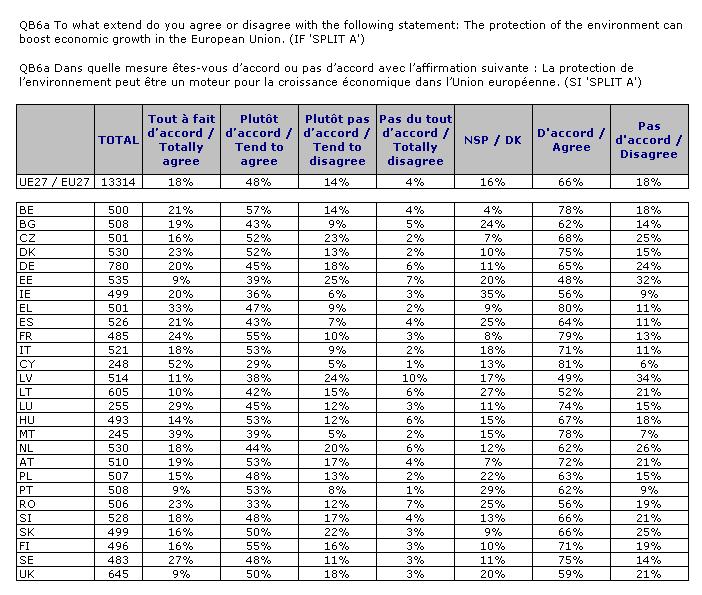
132
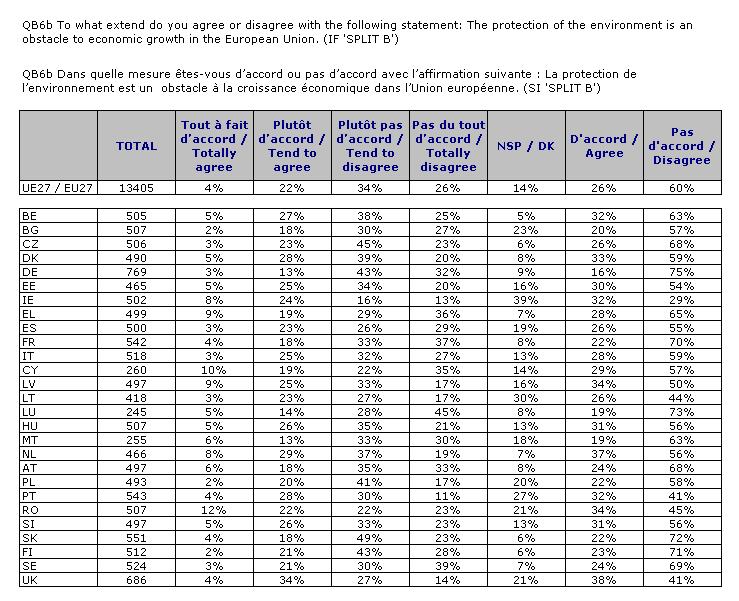
133
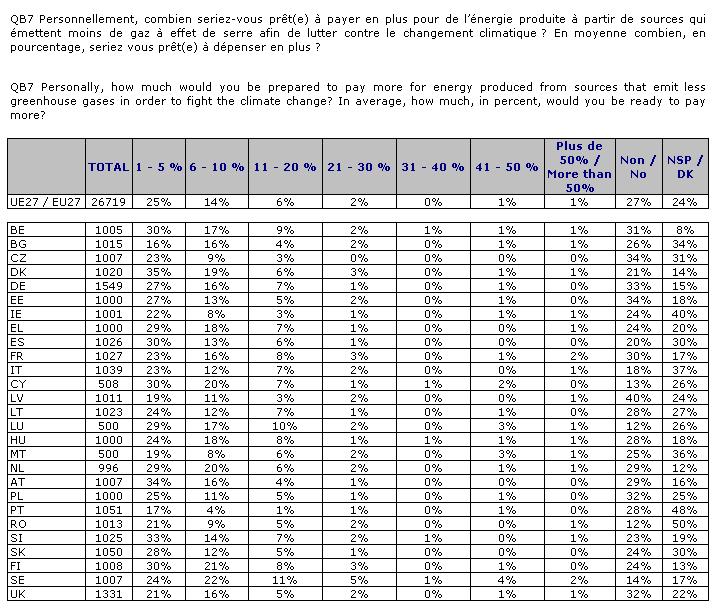
134
Europeans attitudes towards climate change
 Special Eurobarometer 313 EUROPEAN PARLIAMENT EUROPEAN COMMISSION Europeans attitudes towards climate change Special Eurobarometer 313 / Wave 71.1 TNS Opinion & Social Report Fieldwork: January - February
INTERNAL SECURITY. Publication: November 2011
 Special Eurobarometer 371 European Commission INTERNAL SECURITY REPORT Special Eurobarometer 371 / Wave TNS opinion & social Fieldwork: June 2011 Publication: November 2011 This survey has been requested
EUROPEAN UNION CITIZENSHIP
 Flash Eurobarometer EUROPEAN UNION CITIZENSHIP REPORT Fieldwork: November 2012 Publication: February 2013 This survey has been requested by the European Commission, Directorate-General Justice and co-ordinated
EU DEVELOPMENT AID AND THE MILLENNIUM DEVELOPMENT GOALS
 Special Eurobarometer 405 EU DEVELOPMENT AID AND THE MILLENNIUM DEVELOPMENT GOALS REPORT Fieldwork: May - June 2013 Publication: November 2013 This survey has been requested by the European Commission,
Special Eurobarometer 464b. Report
 Europeans attitudes towards security Survey requested by the European Commission, Directorate-General for Migration and Home Affairs and co-ordinated by the Directorate-General for Communication This document
Special Eurobarometer 461. Report. Designing Europe s future:
 Designing Europe s future: Trust in institutions Globalisation Support for the euro, opinions about free trade and solidarity Fieldwork Survey requested by the European Commission, Directorate-General
EUROPEANS ATTITUDES TOWARDS SECURITY
 Special Eurobarometer 432 EUROPEANS ATTITUDES TOWARDS SECURITY REPORT Fieldwork: March 2015 Publication: April 2015 This survey has been requested by the European Commission, Directorate-General for Migration
Flash Eurobarometer 364 ELECTORAL RIGHTS REPORT
 Flash Eurobarometer ELECTORAL RIGHTS REPORT Fieldwork: November 2012 Publication: March 2013 This survey has been requested by the European Commission, Directorate-General Justice and co-ordinated by Directorate-General
Special Eurobarometer 440. Report. Europeans, Agriculture and the CAP
 Survey requested by the European Commission, Directorate-General for Agriculture and Rural Development and co-ordinated by the Directorate-General for Communication This document does not represent the
The Rights of the Child. Analytical report
 Flash Eurobarometer 273 The Gallup Organisation Analytical Report Flash EB N o 251 Public attitudes and perceptions in the euro area Flash Eurobarometer European Commission The Rights of the Child Analytical
Special Eurobarometer 455
 EU Citizens views on development, cooperation and November December 2016 Survey conducted by TNS opinion & social at the request of the European Commission, Directorate-General for International Cooperation
Standard Eurobarometer 89 Spring Report. European citizenship
 European citizenship Fieldwork March 2018 Survey requested and co-ordinated by the European Commission, Directorate-General for Communication This document does not represent the point of view of the European
Special Eurobarometer 467. Report. Future of Europe. Social issues
 Future of Europe Social issues Fieldwork Publication November 2017 Survey requested by the European Commission, Directorate-General for Communication and co-ordinated by the Directorate- General for Communication
The European Emergency Number 112. Analytical report
 Flash Eurobarometer 314 The Gallup Organization Gallup 2 Flash Eurobarometer N o 189a EU communication and the citizens Flash Eurobarometer European Commission The European Emergency Number 112 Analytical
The European emergency number 112
 Flash Eurobarometer The European emergency number 112 REPORT Fieldwork: December 2011 Publication: February 2012 Flash Eurobarometer TNS political & social This survey has been requested by the Directorate-General
Special Eurobarometer 469. Report
 Integration of immigrants in the European Union Survey requested by the European Commission, Directorate-General for Migration and Home Affairs and co-ordinated by the Directorate-General for Communication
The Rights of the Child. Analytical report
 The Gallup Organization Flash EB N o 187 2006 Innobarometer on Clusters Flash Eurobarometer European Commission The Rights of the Child Analytical report Fieldwork: February 2008 Report: April 2008 Flash
Young people and science. Analytical report
 Flash Eurobarometer 239 The Gallup Organization The Gallup Organization Flash EB N o 187 2006 Innobarometer on Clusters Flash Eurobarometer European Commission Young people and science Analytical report
Flash Eurobarometer 431. Report. Electoral Rights
 Electoral Rights Survey requested by the European Commission, Directorate-General for Justice and Consumers and co-ordinated by the Directorate-General for Communication This document does not represent
Data Protection in the European Union. Citizens perceptions. Analytical Report
 Gallup Flash Eurobarometer N o 189a EU communication and the citizens Flash Eurobarometer European Commission Data Protection in the European Union Citizens perceptions Analytical Report Fieldwork: January
EUROPEAN CITIZENSHIP
 Standard Eurobarometer 78 Autumn 2012 EUROPEAN CITIZENSHIP REPORT Fieldwork: November 2012 This survey has been requested and co-ordinated by the European Commission, Directorate-General for Communication.
Data Protection in the European Union. Data controllers perceptions. Analytical Report
 Gallup Flash Eurobarometer N o 189a EU communication and the citizens Flash Eurobarometer European Commission Data Protection in the European Union Data controllers perceptions Analytical Report Fieldwork:
Women in the EU. Fieldwork : February-March 2011 Publication: June Special Eurobarometer / Wave 75.1 TNS Opinion & Social EUROPEAN PARLIAMENT
 EUROPEAN PARLIAMENT Women in the EU Eurobaromètre Spécial / Vague 74.3 TNS Opinion & Social Fieldwork : February-March 2011 Publication: June 2011 Special Eurobarometer / Wave 75.1 TNS Opinion & Social
PUBLIC PERCEPTIONS OF SCIENCE, RESEARCH AND INNOVATION
 Special Eurobarometer 419 PUBLIC PERCEPTIONS OF SCIENCE, RESEARCH AND INNOVATION SUMMARY Fieldwork: June 2014 Publication: October 2014 This survey has been requested by the European Commission, Directorate-General
September 2012 Euro area unemployment rate at 11.6% EU27 at 10.6%
 STAT/12/155 31 October 2012 September 2012 Euro area unemployment rate at 11.6% at.6% The euro area 1 (EA17) seasonally-adjusted 2 unemployment rate 3 was 11.6% in September 2012, up from 11.5% in August
Special Eurobarometer 471. Summary
 Fairness, inequality and intergenerational mobility Survey requested by the European Commission, Joint Research Centre and co-ordinated by the Directorate-General for Communication This document does not
Special Eurobarometer 470. Summary. Corruption
 Corruption Survey requested by the European Commission, Directorate-General for Migration and Home Affairs and co-ordinated by the Directorate-General for Communication This document does not represent
Civil protection Full report
 Special Eurobarometer European Commission Civil protection Full report Fieldwork: September-October 2009 Publication: November 2009 Special Eurobarometer 328 / Wave TNS Opinion & Social This survey was
MEDIA USE IN THE EUROPEAN UNION
 Standard Eurobarometer 76 Autumn 2011 MEDIA USE IN THE EUROPEAN UNION REPORT Fieldwork: November 2011 Publication: March 2012 This survey has been requested and co-ordinated by Directorate-General for
Standard Eurobarometer 89 Spring Report. Europeans and the future of Europe
 Fieldwork March 2018 Survey requested and co-ordinated by the European Commission, Directorate-General for Communication This document does not represent the point of view of the European Commission. The
Flash Eurobarometer 430. Summary. European Union Citizenship
 European Union Citizenship Survey requested by the European Commission, Directorate-General for Justice and Consumers and co-ordinated by the Directorate-General for Communication This document does not
Euro area unemployment rate at 9.9% EU27 at 9.4%
 STAT/11/76 April 2011 Euro area unemployment rate at 9.9% EU27 at 9.4% The euro area 1 (EA17) seasonally-adjusted 2 unemployment rate 3 was 9.9% in April 2011, unchanged compared with March 4. It was.2%
Special Eurobarometer 428 GENDER EQUALITY SUMMARY
 Special Eurobarometer 428 GENDER EQUALITY SUMMARY Fieldwork: November-December 2014 Publication: March 2015 This survey has been requested by the European Commission, Directorate-General for Justice and
Flash Eurobarometer 430. Report. European Union Citizenship
 European Union Citizenship Survey requested by the European Commission, Directorate-General for Justice and Consumers and co-ordinated by the Directorate-General for Communication This document does not
EUROBAROMETER The European Union today and tomorrow. Fieldwork: October - November 2008 Publication: June 2010
 EUROBAROMETER 66 Standard Eurobarometer Report European Commission EUROBAROMETER 70 3. The European Union today and tomorrow Fieldwork: October - November 2008 Publication: June 2010 Standard Eurobarometer
EUROBAROMETER 72 PUBLIC OPINION IN THE EUROPEAN UNION. Autumn The survey was requested and coordinated by Directorate-General Communication
 Standard Eurobarometer EUROBAROMETER 72 PUBLIC OPINION IN THE EUROPEAN UNION Autumn 2009 NATIONAL REPO Standard Eurobarometer 72 / Autumn 2009 TNS Opinion & Social UNITED KINGDOM The survey was requested
A. The image of the European Union B. The image of the European Parliament... 10
 Directorate General for Communication Direction C Relations with citizens PUBLIC OPINION MONITORING UNIT EUROPEAN ELECTIONS 2009 25/05/2009 Pre electoral survey First wave First results: European average
EUROBAROMETER 72 PUBLIC OPINION IN THE EUROPEAN UNION Volume 2
 Standard Eurobarometer European Commission EUROBAROMETER 72 PUBLIC OPINION IN THE EUROPEAN UNION Volume 2 REPORT Fieldwork: October - November 2009 Standard Eurobarometer 72 / Autumn 2009 - TNS opinion
EUROPEANS, THE EUROPEAN UNION AND THE CRISIS
 Standard Eurobarometer 80 Autumn 2013 EUROPEANS, THE EUROPEAN UNION AND THE CRISIS REPORT Fieldwork: November 2013 This survey has been requested and co-ordinated by the European Commission, Directorate-General
CITIZENS AWARENESS AND PERCEPTIONS OF EU REGIONAL POLICY
 Flash Eurobarometer CITIZENS AWARENESS AND PERCEPTIONS OF EU REGIONAL POLICY REPORT Fieldwork: June 2015 Publication: September 2015 This survey has been requested by the European Commission, Directorate-General
Electoral rights of EU citizens. Analytical Report
 Flash Eurobarometer 292 The Gallup Organization Flash EB No 292 Electoral Rights Analytical Report Flash Eurobarometer European Commission Electoral rights of EU citizens Analytical Report Fieldwork: March
Flash Eurobarometer 431. Summary. Electoral Rights
 Survey requested by the European Commission, Directorate-General for Justice and Consumers and co-ordinated by the Directorate-General for Communication This document does not represent the point of view
Special Eurobarometer 468. Report. Attitudes of European citizens towards the environment
 Attitudes of European citizens towards the environment Fieldwork September- Publication November 2017 Survey requested by the European Commission, Directorate-General for Environment and co-ordinated by
Europeans and the crisis
 EUROPEAN PARLIAMENT Europeans and the crisis Report Fieldwork: August September 2010 Publication: November 2010 Special Eurobarometer/Wave 74.1 TNS Opinion & Social Eurobaromètre spécial / Vague 74.1 TNS
EUROPEAN YOUTH: PARTICIPATION IN DEMOCRATIC LIFE
 Flash Eurobarometer 375 EUROPEAN YOUTH: PARTICIPATION IN DEMOCRATIC LIFE SUMMARY Fieldwork: April 2013 Publication: May 2013 This survey has been requested by the European Commission, Directorate-General
EUROBAROMETER 69 SPRING 2008 NATIONAL REPORT UNITED KINGDOM. Standard Eurobarometer PUBLIC OPINION IN THE EUROPEAN UNION
 Standard Eurobarometer 69 / Spring 2008 TNS Opinion & Social Standard Eurobarometer European Commission EUROBAROMETER 69 PUBLIC OPINION IN THE EUROPEAN UNION SPRING 2008 NATIONAL REPORT UNITED KINGDOM
Standard Eurobarometer 88 Autumn Report. Media use in the European Union
 Media use in the European Union Fieldwork November 2017 Survey requested and co-ordinated by the European Commission, Directorate-General for Communication This document does not represent the point of
EUROPEAN CITIZENSHIP
 Standard Eurobarometer 81 Spring 2014 EUROPEAN CITIZENSHIP REPORT Fieldwork: June 2014 This survey has been requested and co-ordinated by the European Commission, Directorate-General for Communication.
Cross-border health services in the EU. Analytical report
 Flash Eurobarometer European Commission Cross-border health services in the EU Analytical report Fieldwork: May 2007 Report: June 2007 Flash Eurobarometer 210 This survey was requested by Health and Consumer
Views on European Union Enlargement
 Flash Eurobarometer 257 The Gallup Organization Flash EB N o 255 Dual circulation period, Slovakia Flash Eurobarometer European Commission Views on European Union Enlargement Analytical Report Fieldwork:
PUBLIC OPINION IN THE EUROPEAN UNION
 Standard Eurobarometer 81 Spring 2014 PUBLIC OPINION IN THE EUROPEAN UNION FIRST RESULTS Fieldwork: June 2014 Publication: July 2014 This survey has been requested and co-ordinated by the European Commission,
PUBLIC OPINION IN THE EUROPEAN UNION
 Standard Eurobarometer 77 Spring 2012 PUBLIC OPINION IN THE EUROPEAN UNION REPORT Fieldwork: May 2012 This survey has been requested and co-ordinated by the European Commission, Directorate-General for
Fieldwork November - December 2009 Publication June 2010
 Special Eurobarometer 337 European Commission Geographical and labour market mobility Summary Fieldwork November - December 2009 Publication June 2010 Special Eurobarometer 337 / Wave 72.5 TNS Opinion
EUROBAROMETER 68 AUTUMN 2007 NATIONAL REPORT UNITED KINGDOM. Standard Eurobarometer PUBLIC OPINION IN THE EUROPEAN UNION
 Standard Eurobarometer European Commission EUROBAROMETER 68 PUBLIC OPINION IN THE EUROPEAN UNION AUTUMN 2007 Standard Eurobarometer 68 / Autumn 2007 TNS Opinion & Social NATIONAL REPORT UNITED KINGDOM
Directorate General for Communication Direction C - Relations avec les citoyens PUBLIC OPINION MONITORING UNIT 27 March 2009
 Directorate General for Communication Direction C - Relations avec les citoyens PUBLIC OPINION MONITORING UNIT 27 March 2009 EUROPEANS AND THE ECONOMIC CRISIS Standard Eurobarometer (EB 71) Population:
EUROPEAN CITIZENSHIP
 Standard Eurobarometer 80 Autumn 2013 EUROPEAN CITIZENSHIP REPORT Fieldwork: November 2013 This survey has been requested and co-ordinated by the European Commission, Directorate-General for Communication.
ATTITUDES OF EUROPEAN CITIZENS TOWARDS THE ENVIRONMENT
 Special Eurobarometer 416 ATTITUDES OF EUROPEAN CITIZENS TOWARDS THE ENVIRONMENT SUMMARY Fieldwork: April - May 2014 Publication: September 2014 This survey has been requested by the European Commission,
PATIENTS RIGHTS IN CROSS-BORDER HEALTHCARE IN THE EUROPEAN UNION
 Special Eurobarometer 425 PATIENTS RIGHTS IN CROSS-BORDER HEALTHCARE IN THE EUROPEAN UNION SUMMARY Fieldwork: October 2014 Publication: May 2015 This survey has been requested by the European Commission,
Standard Eurobarometer 85. Public opinion in the European Union
 Public opinion in the European Union Fieldwork: May 2016 Survey conducted by TNS opinion & social at the request of the European Commission, Directorate-General for Communication Survey coordinated by
Convergence: a narrative for Europe. 12 June 2018
 Convergence: a narrative for Europe 12 June 218 1.Our economies 2 Luxembourg Ireland Denmark Sweden Netherlands Austria Finland Germany Belgium United Kingdom France Italy Spain Malta Cyprus Slovenia Portugal
WOMEN IN DECISION-MAKING POSITIONS
 Special Eurobarometer 376 WOMEN IN DECISION-MAKING POSITIONS SUMMARY Fieldwork: September 2011 Publication: March 2012 This survey has been requested by Directorate-General Justice and co-ordinated by
Employment and Social Policy
 Special Eurobarometer 77 European Commission Employment and Social Policy SUMMARY Special Eurobarometer 77 / Wave EB76. TNS opinion & social Fieldwork: September- October 0 Publication: November 0 This
Special Eurobarometer 459. Climate change
 Climate change Survey requested by the European Commission, Directorate-General for Climate Action and co-ordinated by the Directorate- General for Communication This document does not represent the point
Firearms in the European Union
 Flash Eurobarometer 383 Firearms in the European Union SUMMARY Fieldwork: September 2013 Publication: October 2013 This survey has been requested by the European Commission, Directorate-General for Home
The European Emergency Number 112
 Gallup 2 Flash Eurobarometer N o 189a EU communication and the citizens Flash Eurobarometer European Commission The European Emergency Number 112 Summary Fieldwork: January 2008 Publication: February 2008
Special Eurobarometer 474. Summary. Europeans perceptions of the Schengen Area
 Summary Europeans perceptions of the Schengen Area Survey requested by the European Commission, Directorate-General for Migration and Home Affairs and co-ordinated by the Directorate-General for Communication
Making a difference in the world: Europeans and the future of development aid
 Special Eurobarometer 375 European Commission Making a difference in the world: Europeans and the future of development aid REPORT Special Eurobarometer 375 / Wave 7.61 TNS opinion & social Fieldwork:
Flash Eurobarometer 429. Summary. The euro area
 LOGO CE_Vertical_EN_NEG_quadri rouge Summary Survey requested by the European Commission, Directorate-General for Economic and Financial Affairs and co-ordinated by the Directorate-General for Communication
EUROPEAN CITIZENSHIP
 Standard Eurobarometer 82 Autumn 2014 EUROPEAN CITIZENSHIP REPORT Fieldwork: November 2014 This survey has been requested and co-ordinated by the European Commission, Directorate-General for Communication.
EUROBAROMETER 73 FIRST RESULTS
 Standard Eurobarometer European Commission EUROBAROMETER 73 PUBLIC OPINION IN THE EUROPEAN UNION FIRST RESULTS Fieldwork: May 2010 Publication: August 2010 Standard Eurobarometer 73/ Spring 2010 - TNS
EUROPEAN CITIZENSHIP
 Standard Eurobarometer 77 Spring 2012 EUROPEAN CITIZENSHIP REPORT Fieldwork: May 2012 This survey has been requested and co-ordinated by the European Commission, Directorate-General for Communication.
Special Eurobarometer 469
 Summary Integration of immigrants in the European Union Survey requested by the European Commission, Directorate-General for Migration and Home Affairs and co-ordinated by the Directorate-General for Communication
International Trade. Summary. Fieldwork: August - September 2010 Publication: November Special Eurobarometer 357
 Special Eurobarometer 357 European Commission International Trade Fieldwork: August - September 2010 Publication: November 2010 Special Eurobarometer 357 / Wave 74.1 TNS Opinion & Social Summary This survey
SPECIAL EUROBAROMETER 365
 Special Eurobarometer European Commission SPECIAL EUROBAROMETER 365 Attitudes of European citizens towards the environment SUMMARY Fieldwork: April May 2011 Special Eurobarometer 365 / Wave 75.2 TNS Opinion
Views on European Union enlargement
 Flash Eurobarometer 257 The Gallup Organization Flash EB N o 257 Views on European Union enlargement Flash Eurobarometer European Commission Views on European Union enlargement Fieldwork: February 2009
Flash Eurobarometer 408 EUROPEAN YOUTH SUMMARY
 Flash Eurobarometer 408 EUROPEAN YOUTH SUMMARY Fieldwork: December 2014 Publication: April 2015 This survey has been requested by the European Commission, Directorate-General for Education and Culture
Fieldwork: November December 2010 Publication: June
 Special Eurobarometer European Commission SPECIAL EUROBAROMETER 359 Attitudes on Data Protection and Electronic Identity in the European Union REPORT Fieldwork: November December 2010 Publication: June
Standard Eurobarometer 86. Public opinion in the European Union
 Public opinion in the European Union This survey has been requested and co-ordinated by the European Commission, Directorate-General for Communication. This report was produced for the European Commission
The. Special Eurobarometer 368. Special Eurobarometer 368 / Wave EB 75.3 TNS opinion & social. This document. of the authors.
 Special Eurobarometer 368 European Commission The Common Agricultural Policy REPORT Special Eurobarometer 368 / Wave TNS opinion & social Fieldwork: May 2011 Publication: September 2011 This survey has
CITIZENS AWARENESS AND PERCEPTIONS OF EU REGIONAL POLICY
 Flash Eurobarometer 384 CITIZENS AWARENESS AND PERCEPTIONS OF EU REGIONAL POLICY SUMMARY Fieldwork: September 2013 Publication: December 2013 This survey has been requested by the European Commission,
Standard Eurobarometer 89 Spring Public opinion in the European Union
 Public opinion in the European Union Fieldwork March 2018 Survey requested and co-ordinated by the European Commission, Directorate-General for Communication This document does not represent the point
Standard Eurobarometer 77 Spring 2012 EUROPE 2020 REPORT
 Standard Eurobarometer 77 Spring 2012 EUROPE 2020 REPORT Fieldwork: May 2012 This survey has been requested and co-ordinated by the European Commission, Directorate-General for Communication. http://ec.europa.eu/public_opinion/index_en.htm
PUBLIC OPINION IN THE EUROPEAN UNION
 Standard Eurobarometer 79 Spring 2013 PUBLIC OPINION IN THE EUROPEAN UNION FIRST RESULTS Fieldwork: May 2013 Publication: July 2013 This survey has been requested and co-ordinated by the European Commission,
of the European Commission. Communication. This document of the authors. Standard Eurobarometer 75 / Spring 2011 TNS opinion & social
 Standard Eurobarometer European Commission EUROBAROMETER 75 SPRING 2011 Europe 2020 REPORT Standard Eurobarometer 75 / Spring 2011 TNS opinion & social Fieldwork: May 2011 Publication: August 2011 This
Context Indicator 17: Population density
 3.2. Socio-economic situation of rural areas 3.2.1. Predominantly rural regions are more densely populated in the EU-N12 than in the EU-15 Context Indicator 17: Population density In 2011, predominantly
Post-electoral survey 2009
 Special Eurobarometer EUROPEAN PARLIAMENT European Commission Post-electoral survey 2009 Report Fieldwork: June-July 2009 Publication: November 2009 Special Eurobarometer 320/ Wave TNS opinion & social
ERGP REPORT ON CORE INDICATORS FOR MONITORING THE EUROPEAN POSTAL MARKET
 ERGP (15) 27 Report on core indicators for monitoring the European postal market ERGP REPORT ON CORE INDICATORS FOR MONITORING THE EUROPEAN POSTAL MARKET 3 December 2015 CONTENTS 1. EXECUTIVE SUMMARY...
CONSUMER PROTECTION IN THE EU
 Special Eurobarometer European Commission CONSUMER PROTECTION IN THE EU Special Eurobarometer / Wave 59.2-193 - European Opinion Research Group EEIG Fieldwork: May-June 2003 Publication: November 2003
Alternative views of the role of wages: contours of a European Minimum Wage
 Alternative views of the role of wages: contours of a European Minimum Wage Europe at a crossroads which way to quality jobs and prosperity? ETUI-ETUC Conference Brussels, 24-26 September 2014 Dr. Torsten
SPECIAL EUROBAROMETER 360
 Special Eurobarometer European Commission SPECIAL EUROBAROMETER 360 Consumer understanding of labels and the safe use of chemicals REPORT Special Eurobarometer 360 / Wave TNS Opinion & Social Fieldwork:
Fieldwork: January 2007 Report: April 2007
 Flash Eurobarometer European Commission Entrepreneurship Survey of the EU ( Member States), United States, Iceland and Norway Summary Fieldwork: January 00 Report: April 00 Flash Eurobarometer The Gallup
PUBLIC OPINION IN THE EUROPEAN UNION
 Standard Eurobarometer 77 Spring 2012 PUBLIC OPINION IN THE EUROPEAN UNION FIRST RESULTS Fieldwork: May 2012 Publication: July 2012 This survey has been requested and co-ordinated by the European Commission,
14328/16 MP/SC/mvk 1 DG D 2B
 Council of the European Union Brussels, 17 November 2016 (OR. en) 14328/16 COPEN 333 EUROJUST 144 EJN 70 NOTE From: To: General Secretariat of the Council Delegations No. prev. doc.: 6069/2/15 REV 2 Subject:
Special Eurobarometer 468. Attitudes of European citizens towards the environment
 Attitudes of European citizens towards the environment Fieldwork September- Publication November 2017 Survey requested by the European Commission, Directorate-General for Environment and co-ordinated by
EUROBAROMETER 64 FIRST RESULTS
 Standard Eurobarometer European Commission PUBLIC OPINION IN THE EUROPEAN UNION FIRST RESULTS Fieldwork : October-November 2005 Publication : December 2005 Standard Eurobarometer 64 / Autumn 2005 - TNS
Introduction of the euro in the new Member States. Analytical Report
 Flash Eurobarometer 270 The Gallup Organization Flash Eurobarometer European Commission Introduction of the euro in the new Member States Fieldwork: May 2009 This survey was requested by Directorate General
INTRODUCTION OF THE EURO IN THE MORE RECENTLY ACCEDED MEMBER STATES
 Eurobarometer INTRODUCTION OF THE EURO IN THE MORE RECENTLY ACCEDED MEMBER STATES REPORT Fieldwork: April 2013 Publication: June 2013 This survey has been requested by the European Commission, Directorate-General
Flash Eurobarometer 405 THE EURO AREA SUMMARY
 Flash Eurobarometer 405 THE EURO AREA SUMMARY Fieldwork: October 2014 Publication: October 2014 This survey has been requested by the European Commission, Directorate-General for Economic and Financial
of the European Commission. and the Communication. This document of the authors. Standard Eurobarometer 75 / Spring 2011 TNS opinion & social
 Standard Eurobarometer European Commission EUROBAROMETER 75 SPRING 2011 Europeans, the European Union crisis and the REPORT Standard Eurobarometer 75 / Spring 2011 TNS opinion & social Fieldwork: May 2011
Looking Through the Crystal Ball: For Growth and Productivity, Can Central Europe be of Service?
 Looking Through the Crystal Ball: For Growth and Productivity, Can Central Europe be of Service? ARUP BANERJI REGIONAL DIRECTOR FOR EUROPEAN UNION MEMBER STATES THE WORLD BANK 6 th Annual NBP Conference