SPECIAL EUROBAROMETER 360
|
|
|
- Jordan Doyle
- 5 years ago
- Views:
Transcription
 on behalf of European Chemicals")
1 Special Eurobarometer European Commission SPECIAL EUROBAROMETER 360 Consumer understanding of labels and the safe use of chemicals REPORT Special Eurobarometer 360 / Wave TNS Opinion & Social Fieldwork: November December 2010 Publication: May 2011 This survey was requested by the Directorate General JRC (Joint Research Centre of the European Commission) on behalf of European Chemicals Agency (ECHA). JRC s Institute for Health and Consumer Protection (IHCP) coordinated the preparation of the questionnaire in co-operation with ECHA. The survey was coordinated by the Directorate General Communication. This document does not represent the point of view of the European Commission. The interpretations and opinions contained in it are solely those of the authors.
2 2
3 Special Eurobarometer 360 Consumer understanding of labels and the safe use of chemicals This survey was requested by the Directorate General JRC (Joint Research Centre of the European Commission) on behalf of European Chemicals Agency (ECHA). JRC s Institute for Health and Consumer Protection (IHCP) coordinated the preparation of the questionnaire in co-operation with ECHA. The survey was coordinated by the Directorate General Communication and conducted by TNS Opinion & Social. 3
4 4
5 Table of contents INTRODUCTION... 7 EXECUTIVE SUMMARY USE AND PERCEPTIONS The image of chemicals The use of chemicals at work Awareness of chemical products SAFETY BEHAVIOUR Information on safety Actions to ensure safety Perceptions of which products need instructions How often instructions are read How often instructions are followed LABEL COMPREHENSION Warning vs. danger Awareness of the newly introduced and pre-existing symbols Comprehension of the new symbols INFORMATION Quality of information received Sources of information Trusted sources of information CONCLUSION ANNEXES Technical specifications Questionnaire Tables 5
6 6
7 INTRODUCTION As part of the European Union s mission to improve the well-being of the citizens in its 27 member states, in particular the quality of life by ensuring the safe use of chemicals, it was decided in December to perform a wide-ranging overhaul of the legislation governing the use of chemicals in the EU. One of the most significant regulatory measures governing the use of chemicals in the EU, is the Regulation, Evaluation and Authorisation of Chemicals (REACH) Regulation (EC/1907/2006) which came into force four years ago on 1 June This legislation, which was developed over a legislative process lasting 10 years, paved the way for the establishment of the European Chemicals Agency (ECHA) 1 on 1 June REACH was introduced to address a clear need that emerged for both Member State Competent Authorities and industry: to improve the protection of human health and the environment, to enhance the competitiveness of European chemicals industry and to promote alternative methods for the assessment and the testing of chemicals, with the aim of gradually replacing the most dangerous chemicals with safer substances. REACH ensures that all chemicals used within the EU (barring those which pose virtually no risk to health) must be registered and approved. As well as managing REACH, ECHA administers the Regulation on classification, labelling and packaging of substances and mixtures (CLP Regulation 2 ). The CLP Regulation entered into force on 20 th January It introduces the criteria of the United Nations Globally Harmonised System (UN GHS) for classification and labelling in the EU. The aim of CLP regulation is to introduce the globally harmonised criteria in the EU without reducing the level of environmental and health hazard protection provided by the previous existing legislation. The CLP Regulation requires industry to inform about the potential hazards of chemicals. The labels consist of a set of harmonised elements that are determined by CLP, e.g. hazard pictograms or hazard statements. These are mandatory for all labels of hazardous chemicals that are put onto the market in the European Union. 1 Further information on the ECHA can be found at Details on the agency s establishment under EU law, as well as information on REACH, are available at en.htm. 2 An overview of the CLP regulations and of their implementation can be viewed at en.htm. 7
8 In relation to hazard communication, the CLP Regulation requires ECHA to carry out a study on the communication of information to the general public on the safe use of substances and mixtures and the potential need for additional information on labels by the end of The current Eurobarometer survey is an important step in this process. This survey assesses consumer understanding of labels and how consumer understanding affects the safe use of chemicals. It also assesses how well-informed people are of hazards. In the course of this Eurobarometer survey, 26,574 European citizens in all 27 European Union Member States 3 were interviewed between 25 th November and 17 th December 2010 about chemical products by the TNS Opinion & Social Network. The methodology used for the survey is in line with the surveys carried out by the Directorate General for Communication ( Research and Speechwriting Unit) 4. A technical note on the methodology for interviews conducted by the institutes within the TNS Opinion & Social network is annexed to this report. The study provides detailed information of the way in which the various categories of chemical products are viewed in the EU as a whole and in individual member states. It assesses people s perceptions of chemical products, and judges how those perceptions differ when people are in regular contact with them. It also looks at people s attitudes in dealing with safety instructions, and illustrates their understanding of the hazard symbols and safety language standardised by the CLP Regulation. Finally, the survey discloses impressions voiced or felt in the public related to information on the hazards and safe use of chemicals currently available. The survey has been conducted for the first time in the EU. A comparison with earlier results is therefore not possible. The survey also provides detailed demographic analysis to shape the understanding on how European citizens may perceive chemical products differently from one another. The statistical breakdowns include: male/female; age range; the impact of education levels and household income; and a range of other socio-economic factors. 3 Further information on the methodology used can be found in the technical note which specifies the interview methods as well as the intervals of confidence
9 The Eurobarometer web site can be consulted at the following address: We would like to take this opportunity to thank all the respondents throughout the European Union member states who gave their time to take part in this survey. Without their active participation, this survey would quite simply not have been possible. 9
10 In this report, the countries are referred to by their official abbreviation. The abbreviations used in this report correspond to: ABREVIATIONS EU27 European Union 27 Member States BE BG CZ DE EE EL ES FR IE IT CY LT LV LU HU MT NL AT PL PT RO SI SK FI SE UK Belgium Bulgaria Czech Republic Denmark Germany Estonia Greece Spain France Ireland Italy Republic of Cyprus Lithuania Latvia Luxembourg Hungary Malta The Netherlands Austria Poland Portugal Romania Slovenia Slovakia Finland Sweden United Kingdom Full details of the methodology, sample design and confidence intervals can be found appended to this report. 10
11 EXECUTIVE SUMMARY - The respondents are generally more inclined to characterise chemical products as dangerous or harmful to the environment, rather than useful or innovative. - Over half (52%) of EU respondents say they have used chemical products at work. - A large number of respondents are unable to identify everyday household chemicals as chemical products. - Levels of understanding about chemical products differ considerably from one member state to another. - Two-thirds (66%) of respondents read the safety instructions before using a chemical product, but attention to the instructions is much higher for certain types of products, such as pesticides, compared with others, such as detergents. - 7% of respondents who read the instructions follow them fully. - Beyond reading the instructions, there is generally little understanding about the safety measures that need to be taken when using chemical products. - Awareness of the safety issues associated with chemical products tends to be much higher among respondents who actually use those products. - The term danger is widely seen as carrying a more forceful message than the term warning, although it is the opposite in certain member states due to reasons that require further investigation. - While some CLP hazard symbols are widely recognised, there is a low level of understanding of the meaning of Symbol C with only 11% recognising that it warns of possible skin irritation. - Most respondents feel only moderately informed or not well informed, about the risks associated with chemical products. 11
12 1. USE AND PERCEPTIONS 1.1 The image of chemicals -- EU citizens are more likely to perceive chemicals as dangerous, rather than useful -- Chemical products have worrying connotations for a majority of EU citizens, with 68% of respondents saying that they regard them as dangerous 5. Harmful to the environment is the second most common response (63%), while 51% say they consider chemical products to be unhealthy. Large numbers of respondents also view chemical products as industrial (43%) and artificial (35%). Only a minority of EU citizens automatically associate chemical products with their benefits. Just over a fifth (22%) of respondents consider them to be useful, while 17% view them as being effective. Fewer still regard chemical products as being modern (12%) or innovative (9%). 4% of respondents think of them as natural products. Looking at the results from the individual EU members, it can be seen that the perception of chemical products varies widely from one member state to another. At least half of respondents perceive chemical products to be dangerous in all EU member states. Dangerous is also the most common answer in 12 of the 27 EU member states. A particularly high proportion of people view them this way in Cyprus (85%), Greece (81%) and France (81%), compared with around half in Poland (50%), Finland (53%) and 54% in Malta. 5 QC1: When you think of "chemical products", which of the following words come to mind? Possible answers: useful; effective; modern; natural; unhealthy; industrial; artificial; harmful to the environment; dangerous; other; none; don t know. (MULTIPLE ANSWERS POSSIBLE) 12

13 The most notable difference between individual member states is in the perception of chemical products as being harmful to the environment. An overwhelming 90% of people in Denmark hold the view that they are environmentally harmful, as do 88% in Cyprus and 84% in Sweden. At least half of respondents in every member state think that chemical products are harmful to the environment, with three exceptions: Portugal (34%), Romania (47%) and Spain (49%). Harmful to the environment is the most common answer in 14 of the 27 EU member states. Perceptions of chemical products as being unhealthy also vary. Large numbers of respondents in Luxembourg (75%) and Sweden (75%) agree that they are unhealthy, and at least half of citizens also see them this way in 19 of the member states. 13
14 However, only 33% of people in the UK and 38% in Spain share this view. Unhealthy is the most common answer in two member states, Luxembourg and Malta 6. Chemical products are widely viewed as being industrial, especially by respondents in Austria (62%), the Netherlands (62%), Sweden (57%), Germany (56%) and Finland (52%) the only five member states in which a majority of respondents select industrial as a response. This differs sharply from the results in Portugal (18%) and Malta (20%). The picture is very similar for the number of respondents who regard chemical products as being artificial. A majority of people in Austria (57%), Bulgaria (53%) and Germany (52%) perceive chemical products as artificial, with over half of people choosing this response in five member states. Only 12% of those in Portugal and 20% of those in France describe chemicals as artificial. Over a third of respondents in Sweden (40%), Finland (37%) and Germany (36%) think that chemical products are useful at least 30% of people choose this answer in nine member states but very few people in Latvia (8%), Italy (9%) and Greece (10%) think they are. Clearly, people in some EU member states are far more aware of the impact that chemical products have on their everyday lives than those in other member states. The variation in respondents who view chemical products as being effective is similarly broad. 36% of people in Sweden think of them as effective, followed by 35% in Denmark and 32% in Austria the only three member states in which at least 30% of respondents choose this response. However, only 8% of respondents in Latvia and 9% in Portugal see chemical products this way. The pattern is much the same when considering whether chemical products are modern or innovative. Across the EU, with the exception of Estonia (16%), very few people see chemical products as being natural. 6 Equal numbers in Malta (63%) select harmful to the environment and unhealthy. 14

15 An analysis of the socio-demographic data reveals a slight variation in the way that men and women perceive chemical products. Men are more likely than women to have positive associations with chemical products: 24% of male respondents view them as useful, compared with 20% of women; 10% consider them to be innovative (7% for women); 19% consider them effective (15% for women); and 46% see them as industrial (40% for women). Age also plays a part, with those aged less likely to see chemical products negatively compared with older citizens. The respondent s level of education is also a factor, with better educated citizens being more positive about chemical products. While 27% of people who finished their education aged 20+ see chemical products as being useful, this falls to 22% for the category and to 18% among those who finished their education at 15 or under. People in the 20+ group are also much more likely to see the industrial aspect of chemical products, with 52% describing them as industrial compared with 43% in the category and 32% in the 15-or-under group. 15
16 Level of affluence and occupation show a similar pattern. A quarter (25%) of respondents who almost never have difficulties paying their bills regard chemical products as being useful, but this falls to 17% among people who have difficulties paying their bills most of the time. Similarly, by occupation, 29% of managers consider chemical products to be useful but only 15% of house persons and 18% of unemployed respondents say the same. There was little difference between those who did and did not have children in overall perceptions although those with children were more likely to think of chemicals as being industrial (46% cf. 42%) and harmful to the environment (65% cf. 62%). 16

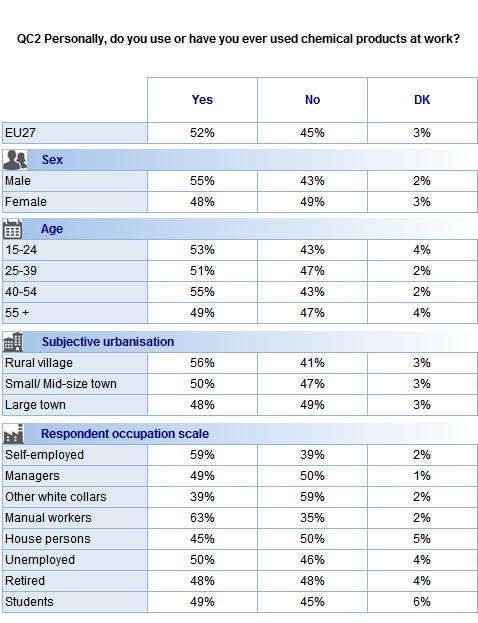
17 1.2 The use of chemicals at work -- Over half of EU citizens have used chemical products at work, -- A majority of respondents (52%) across the EU say that they use, or have used, chemical products in the workplace 7. While 45% of EU citizens report not using, or having never used, chemical products at work, 3% of respondents are unsure whether they have used them or not. With these results it is important to note that some respondents may have been unclear as to what constitutes a chemical product. As such, some respondents may have been mistaken in judging whether or not they have used these products themselves. Comparing individual member states, an exceptionally high proportion of respondents report using or having used chemical products at work in Slovenia (72%), Sweden (72%), Lithuania (72%), Latvia, Austria, Estonia, Germany and Czech Republic (70%). In eight member states, a majority of respondents say that they have never used chemical products at work. This is especially true in Italy (71%), followed by Malta (58%), Greece (56%) and Cyprus (55%). The number of EU citizens who say they do not know whether or not they have used them, is relatively high in Romania (22%), Ireland (9%) and Bulgaria (6%). 7 QC2: Personally, do you use or have you ever used chemical products at work? Possible answers: yes; no; don t know. 17


18 By examining the socio-demographic data it emerges that male respondents are more likely to say that they have used chemical products at work than female respondents - 55% of men report having used them, as opposed to 48% of women. Urbanisation also influences people s chances of using chemical products at work. Only 48% of people who say they live in a large town report having used them in a work-related capacity, but this rises to 50% among those living in a small or mid-sized town and again to 56% among those living in a rural village. Occupation is also a factor. Only 39% of other white collar workers and 45% of house persons say they have used chemical products at work, compared with 63% of manual workers and 59% of selfemployed respondents. 18
19 19
20 1.3 Awareness of chemical products -- Many EU citizens do not think of everyday chemical-based items as being chemical products. However, the more people use chemical products the more they understand what they actually are -- Results from across the EU demonstrate that many people do not regard items defined as chemical products by the EU as being chemicals. 8 Pesticides and insecticides are most likely to be considered chemical products, with 75% of respondents seeing them this way. Seven in ten (71%) regard other cleaning products as chemical products, followed by 70% who describe everyday detergents as being chemical products. Six in ten EU citizens (59%) put DIY products, such as paints, in the chemical products bracket, with the same number describing gardening products, such as fertilizers, in this way. Car/vehicle products, including oils, are considered to be chemical products by 51% of respondents. Variations are seen at individual country level. Very high numbers of people think that pesticides and insecticides are chemical products in Denmark (93%), Cyprus (92%) and Greece (91%). 8 QC3: And still thinking of "chemical products", which of the following products come to mind? Possible answers: DIY (Do It Yourself) products and building materials (e.g. paints, varnish); everyday detergents (e.g. washing powder, dish washing detergents); other cleaning products (e.g. drain cleaners, oven cleaners); car/vehicle care products (e.g. car wax, lubricating oils, wheel cleaners); gardening products (e.g. fertilizers, plant conditioners); pesticides and insecticides (e.g. weed killers, vermin and pest control); other; none; don t know. (MULTIPLE ANSWERS POSSIBLE) 20
21 A majority of respondents shares this view in every member state, and pesticides and insecticides is the most common response in 14 member states 9. However, opinions are mixed, especially in the Czech Republic, where only 59% of respondents view pesticides and insecticides as being chemical products, as well as in Romania (63%), Latvia (65%) and Poland (65%). Only in seven member states do less than 70% of respondents view pesticides and insecticides as chemical products. Other cleaning products are chemical products according to 87% of people in Denmark, and 83% of those in Estonia and Finland. By contrast, only 49% of those in Portugal and 50% of those in Romania regard everyday detergents as chemicals. This is the most common response in eight member states. When discussing everyday detergents, respondents in Estonia (94%) are the most likely to equate these with chemical products, with Latvia (86%) and Sweden (84%) also high. Only 44% of respondents in Estonia and 49% of those in Ireland say the same thing. Everyday detergents is the most popular response in eight member states. Gardening products are considered chemicals by large numbers of respondents Estonia (73%), Bulgaria (71%) and Denmark (70%) but under half of citizens in four Member States - Portugal (43%), Malta (46%), Italy (49%) and Romania (49%). DIY products are most likely to be regarded as chemicals in Estonia (78%), Germany (74%) and Denmark (71%), compared to only 37% of respondents in Portugal, 46% in Italy and Malta, and 48% in the Czech Republic. Variation between different member states is particularly wide on the subject of car/vehicle products. A clear majority of people in Estonia (74%), Finland (71%) and Sweden (66%) see these as being chemical products, and yet only 28% of those in Portugal, 33% of those in Ireland and 35% of those in Romania view these products in the same light. A minority of respondents see car/vehicle products as chemical products in 10 member states. In this part of the study, Estonia and Portugal represent the two extremes of EU opinion. Respondents in Portugal are particularly unlikely to see the products under discussion as being chemical products. 9 In three member states, two different responses receive equal numbers of answers. 21
22 Analysis of the socio-demographic data reveals that men and women often have different perceptions of whether products are chemical in nature. While 62% of men say that DIY products and building materials are chemical products, only 55% of women agree. Male respondents (58%) are also more likely to regard car/vehicle care products as chemicals than female respondents (45%). Conversely, more women (72%) view everyday detergents as chemical products than do men (67%), with the same outcome seen for other cleaning products (73% for women, 68% for men). There was little difference between those who have children in the household and those who do not although those with children were more likely to recognise other cleaning products as chemicals (73% cf. 70%). 22

23 Age also has an impact on whether respondents view the various products under discussion as chemicals. The age group is the least likely to see all the products being considered here as chemicals. The respondent s level of education also has an influence. While 65% of people who finished their education at 20 or over see DIY products as chemicals, this falls to 60% for the group and 54% among those whose education ended at 15 or under. This pattern is repeated for all other product categories, with car/vehicle products showing the most marked difference: 60% of those who finished their education at 20 or over regard these as chemical products, but only 52% of those on the groups and 44% in the 15 and under group say the same thing. 23
24 A respondent s occupation naturally has an impact on whether he or she recognises these products as being chemicals. Students, who most likely come into contact with chemical products less often than those in other occupations, have a relatively low level of understanding: only 49% regard DIY products as chemical products, as opposed to 68% of managers and 62% of manual workers. Similarly, just 63% of students regard everyday detergents as chemical products, whereas 78% of managers recognise them as such. This pattern is largely repeated for the other product categories. The respondent s level of affluence is also a factor. 61% of respondents who almost never have difficulties paying their bills consider DIY products to be chemicals, but this falls to 54% among people who have difficulties paying their bills most of the time. The pattern again recurs throughout the product groups, and is seen most strongly for car/vehicle care products, which 54% of those who almost never have trouble with their bills recognise as chemical products, compared with 45% who have trouble most of the time. It is unsurprising to find that the level of recognition is far higher for all categories of products among those respondents who use chemical products at work. Seven in ten (68%) of those who use chemical products at work regard DIY products as chemicals, as opposed to 52% who do not use them in the workplace. Eight in ten (79%) of those who use chemical products at work consider everyday detergents to be chemicals, while only 63% of respondents who do not use chemical products in the workplace say the same. The pattern is repeated in all responses related to products, except pesticides and insecticides where perception levels are similar across both groups. 24

25 2. SAFETY BEHAVIOUR 2.1 Information on safety -- Most EU citizens rely on safety instructions and warning symbols to inform them about the possible hazards of chemical products -- In the EU as a whole, the most common means of finding out whether a chemical product is hazardous is to read the safety instructions 10. Two thirds (66%) of respondents say they do this, followed closely by 65% who say they consult the warning symbols. The packaging is a good way to assess a product s hazards according to 43% of respondents, while 32% of people say that they rely on their previous experience with the product. A quarter (25%) of respondents use information they get in the shop to help them determine the potential risks, while 21% use the product s smell as a guide. A smaller proportion (13%) say they use information passed on by friends and family to help them judge whether a product is hazardous, while 11% consider the type of shop that the product comes from and 6% rely on the colour of the product. A product s safety instructions are used by an overwhelming majority of people in some member states, notably Denmark (85%), Sweden (82%) and Estonia (81%). In 12 member states, at least 70% of respondents say they refer to the safety instructions. Yet the safety instructions are not referred to so widely in Italy (55%), Portugal (55%) and Spain (56%). The safety instructions was the most common means of assessing a product in 18 member states. 10 QC4: Which of the following do you use to find out whether a chemical product is hazardous or not? Possible answers: your previous experience of the product; the smell; the colour; the packaging; the safety instructions; the warning symbols; information you get in the shop; the type of shop where you can buy the product; information from friends and family members or friends; other; none; don t know. (MULTIPLE ANSWERS POSSIBLE) 25
26 In Denmark, 91% of respondents say that they use a product s warning symbols in order to find information about potential hazards, followed closely by 90% of respondents in Sweden and 83% of those in the Netherlands. However, warning symbols are considered much less useful in Romania (35%), Greece (45%) and Portugal (46%) the only three member states in which less than half of respondents choose this response. The outcome suggests that the overall understanding of labels differs widely within the EU and further research would be needed to determine possible reasons to this. This was the most common response in 10 member states 11. Relatively high numbers of people use the packaging to tell them about a product s potential hazards in some member states. Six in ten (61%) respondents in Denmark say they use this method, followed by 58% in the Netherlands, 57% in Estonia and 55% in Belgium. At least half of respondents say they refer to the packing in nine EU countries. 12 However, in Cyprus only 18% of people say they consult the packaging, as do just 22% in Malta and 27% in the Czech Republic. Relying on one s previous experience of a product is a common way of establishing whether a chemical product is potentially hazardous in some EU member states. Around half (52%) of people in Bulgaria, 49% of those in Austria and 46% of those in Estonia say they use past experience. However, just 20% of respondents in the UK, 21% of those in Italy, 29% in Cyprus and 29% in France the only four member states in which less than 30% of people choose this option find that past experience is relevant. 11 BE,, FR, IT (equal with safety instructions), LU, HU, NL, FI, SE, UK. 12 BE,, EE, LU, NL, AT, FI, SE, UK. 26

27 Information you get in the shop is regarded as useful in judging potential hazards by 48% of respondents in Austria, 40% of those in Slovakia and 38% in the Czech Republic. Yet this source of information is thought of as helpful by only 12% of people in the UK, 15% in Malta and 17% in Italy. In ten member states, less than 25% of respondents say they rely on information obtained in the shop. Smell guides a remarkably high proportion of people in Cyprus (58%) as to a product s potential hazards as well as a relatively high 33% in Luxembourg and Romania. But elsewhere a product s smell is not deemed helpful, notably in the Czech Republic (11%) and Finland (11%). In nine member states, less than 20% of respondents say they use smell to judge a product s potential hazards. Information about a chemical product passed on by friends or family is found useful by 27% of respondents in Estonia, and by 25% of people in Bulgaria and Austria. Elsewhere it is considered less valuable, however. The type of shop a product is purchased from and the colour of the product are also generally not seen as useful. 27

28 There is very little gender variation when it comes to the approaches to evaluating whether a chemical product is hazardous, but age does have more of an impact on the methods that people use. Only 27% of those in the age group say that they rely on previous experience with the product, but this rises to 34% among the category and 33% in the 55+ group. This is unsurprising, given that young people are less likely to have experience with some of the chemical products than their older counterparts. Young people are also less likely to rely on the safety instructions, with 62% of year-olds saying they use these, as opposed to 71% in the brackets. However, older respondents are less likely to depend on the warning symbols, with 59% of over-55s consulting these compared with 67-68% for the other three age groups. This may suggest that older people in the EU either have a poorer understanding of what the symbols mean, or that some may have trouble reading the symbols. Those in the over-55 group are also least likely to look at the packaging: only 40% do this, compared with 46% in the group. The respondent s level of education has a clear impact on his or her ability to interpret the various kinds of safety information provided. Three quarters (74%) of those who left education at the age of 20 or over say that they consider the warning symbols when evaluating a chemical product s potential hazards, but this falls to 65% for the group and again to 55% for the 15 and under group. Similarly, 73% of those who finished their education at an age of 20 or over say that they use the safety instruction. This is 67% for the group and 59% for the 15 and under group. 28
29 Looking at occupation also reveals wide variations in people s comprehension of warning symbols and other safety information. Only 57% of retired people and 58% of house persons say they rely on the warning symbols, as opposed to 78% of managers. The results are very similar for safety instructions: 61% of house persons and 62% of retired people use these, far lower than the 75% of managers who do the same. There are some differences between those who live in a household with children and those who do not. Those with children are more likely to use the warning symbols (68% cf. 63%) and the packaging (45% cf. 42%). Once again the data demonstrates that those who come into contact with chemical products are more likely to understand them, including the ways of detecting potential hazards. People who use chemical products at work are more likely to use all nine of the ways of determining potential hazardousness under consideration here than those who do not use chemical products at work. 29
30 2.2 Actions to ensure safety -- A clear majority of EU citizens think that following the instructions will help them to use a chemical product safely -- Across the EU there is widespread acceptance that reading and following the instructions can help you use a chemical product safely 13 : 78% of people say that they do this. However, there is not this level of consensus when it comes to other potential ways of using chemical products in safety. Wearing protective clothing is necessary according to only 45% of people, while 33% think that storing the product correctly is an important measure. A third (32%) of respondents say that it is important to use only the recommended amount of the product, while 28% say that people should adhere to the recommended frequency of use. 28% also say that it is necessary to dispose of the product correctly. Only 2% think that there is no way of using a chemical product with complete safety. 13 QC5: Which things do you need to do to use a chemical product safely? Possible answers: read/ follow the instructions of the chemical product; wear protective clothing (e.g. gloves, mask); adhere to recommended frequency of use of the chemical product; use only the recommended amount of the chemical product; store the product correctly; dispose of the product correctly; other; there is no safe use of a chemical product; don t know. (MULTIPLE ANSWERS POSSIBLE) 30
31 At individual country level, it emerges that there is little consensus on the question of whether it is necessary to read or follow the instructions in order to use a chemical product safely. Nine in ten (92%) respondents in Denmark say that this is important, as do 90% in the Netherlands and 89% in Germany. More than 80% of people say they do this in eight EU member states. However, only 51% of respondents in Latvia say that following the instructions is necessary, as do 62% of people in Estonia and Poland. Despite this, reading/following the safety instructions is the most popular response in all 27 EU member states. Wearing protective clothing is considered a necessary safety measure by 63% of respondents in Ireland, with 62% of those in Cyprus and Slovenia agreeing. In 11 countries 14, more than half of respondents say that wearing protective clothing is important. Protective clothing is seen as important by only 31% of people in Finland and 32% of those in Poland. Storing the product correctly is widely understood to be an important safety measure in Belgium (57%), Germany (56%) and Slovenia (51%) the only three member states where a majority of respondents think that storage is important. However, only 12% of people in Latvia and 14% of respondents in Poland regard storage as a significant factor. A relatively high 57% of respondents in Austria, as well as 53% in Belgium and 50% in Germany, say that using only the recommended amount of a chemical product is a necessary step. This compares with only 9% of people in Latvia and 10% of people in the UK. In only seven member states do over 40% of people think that this is an important safety measure. 14 BE, EE, IE, EL, FR, CY, LU, MT, NL, SI, SK 31
, Germany (47%) and Belgium (44%) think that it is necessary.")
32 This divergence of opinion is seen again on the issue of whether adhering to the recommended frequency of use is a necessity if the chemical product is to be used safely. Relatively high numbers of people in Austria (51%), Germany (47%) and Belgium (44%) think that it is necessary. But elsewhere this is not considered at all important, particularly in Latvia (6%) and the UK (8%). In only nine member states do at least 30% of respondents think that frequency of use is important for safety. Disposal of the product is regarded as necessary for safety by relatively high numbers of people in Germany (54%), Austria (46%) and Belgium (45%), but this is not the case elsewhere. Only 4% of respondents in Latvia think that proper disposal is necessary, as do just 8% of people in Cyprus. 32

33 Turning to the socio-demographic data, it once again emerges that there is very little gender distinction in terms of the safety measures that people consider important. Safety concerns can generally be seen to peak in the middle age groups: safety appears to be of least concern to the youngest and oldest respondents. There was little difference in safety behaviours between those with and without children in the household although those with children were more likely to believe that one should wear protective clothing (47% cf. 45%). Level of education has an impact on whether an individual regards certain measures as necessary for a chemical product to be used safely. Over eight in ten (84%) of people who left education at 20 or over say that reading the instructions is a necessity, but this falls to 78% for the group and again to 73% for the 15 and under group. The pattern is generally similar for the other safety measures under consideration. 33
34 Occupation of respondents shows a similar pattern. Over eight in ten (85%) of managers, say that following the instructions is important for safety, but this drops to 73% among house persons and 75% among the unemployed and retired people. The same outcome can be seen for other safety methods. People who say they have used chemical at work are more likely to consider all of the practices under discussion here as important for the safe usage of chemical products. The distinction is most notable when it comes to protective clothing: 51% of people who have worked with chemical products say that protective gear is important, but only 41% of people who have never used chemical products in the workplace say the same thing. 34
35 2.3 Perceptions of which products need instructions -- The vast majority of respondents think that instructions are needed for chemical products with obvious hazardous potential, such as pesticides, but there is less of a consensus for other kinds of products -- People in the EU are overwhelmingly supportive of the idea that pesticides and insecticides require instructions as to how to use them safely: 84% of all respondents hold this view. 15 Seven in ten citizens (70%) also think that other cleaning products require safety instructions, followed by 66% who see instructions as a requirement for gardening products. DIY products and building materials need instructions in the view of 60% of people, while 50% say the same of everyday detergents and 49% of people think car/vehicle care products should have them. At individual Member State level, it emerges that pesticides and insecticides are overwhelmingly regarded as products that demand safety instructions in many countries, most notably Denmark (97%), Cyprus (96%) and Sweden (95%). Pesticides and insecticides is the most popular response in every EU member state, with only four countries 16 registering a response level below 80%, including Italy (73%) and Romania (73%) 15 QC6: For which of the following chemical products do you think instructions are necessary in order to use them safely? Possible answers: DIY (Do It Yourself) products and building materials (e.g. paints, varnish); everyday detergents (e.g. washing powder, dish washing detergents); other cleaning products (e.g. drain cleaners, oven cleaners); car/vehicle care products (e.g. car wax, lubricating oils, wheel cleaners); gardening products (e.g. fertilizers, plant conditioners); pesticides and insecticides (e.g. weed killers, vermin and pest control); other; none; don t know. (MULTIPLE ANSWERS POSSIBLE) 16 IT, PL, PT, RO 35
36 Other cleaning products also need instructions, according to a clear majority of respondents in Denmark (84%), Sweden (84%) and Estonia (82%); but far fewer people think that these products need instructions in order to be used safely in Portugal (48%) and Romania (51%). At least 70% of respondents think other cleaning products need instructions in 17 member states. Gardening products need instructions for safe use in the view of 82% of respondents in Estonia, 79% of those in Denmark and 78% of those in Cyprus and Slovakia. But only 51% of people in the Netherlands consider instructions to be necessary, as do just 55% of respondents in Portugal and Romania. At least 70% of respondents think gardening products must be used with instructions in 11 member states. A wide difference of opinion between different member states emerges as to whether DIY and building products require safety instructions in order to be used safely. People in Estonia (80%), Denmark (79%) and Sweden (78%) are most likely to see instructions as important for DIY products, compared to only 48% of respondents Portugal and Romania. Less than 60% of people think instructions are important for these products in 11 member states. 36
37 Everyday detergent products require instructions for safe use, according to 75% of respondents in Estonia, 73% in Latvia and 71% in France. But elsewhere this is not regarded as important, most notably in Slovakia (26%), the Czech Republic (33%) and Ireland (34%). At least half of respondents think these products require instructions for safe use in 13 member states. The gap in opinion is similarly wide when it comes to car/vehicle care products. 75% of people in Estonia, followed by 69% of those in Latvia and Sweden regard instructions as necessary for these products, but far fewer people in Ireland (35%), Romania (36%) and Hungary (37%) see it this way. At least half of respondents think car/vehicle products require instructions for safe use in 13 member states. 37

38 There are differences between the various age groups, with respondents in the middle two age categories generally more likely to regard instructions as a necessity than the youngest and the oldest respondents. A higher level of education is also likely to result in the respondent seeing the need for chemical products to be accompanied by safety instructions. Those with children are more likely to believe that safety instructions are needed for car care products (51% cf. 48%) but otherwise there were few differences. The subjective urbanisation of respondents also reveals differences in the way people regard instructions and chemical products. People who say they live in a large town are generally more likely to see instructions as necessary than those who live elsewhere. For example, 65% of large town residents consider instructions to be a requirement for DIY products, but this falls to 59% of small/medium town residents and again to 57% for rural village residents. This outcome is mirrored in the other product categories, the exceptions being gardening products, and pesticides and insecticides. 38
39 For this latter category, 86% of rural village residents see instructions as important, more than the 83% of respondents in the other categories; while for gardening products 65-66% think instructions are necessary in all three groups. This reflects the fact that rural people are especially likely to use and be familiar with these products. 39

40 2.4 How often instructions are read -- More than half of EU citizens always read the instructions before using pesticides and insecticides, but reliance on the instructions is less common for other categories of chemical products -- Across the EU, respondents are more likely to read the instructions when they use pesticides and insecticides for the first time than they are to read the instructions accompanying other types of chemical products. Half (50%) of people always read the instructions to pesticides and insecticides, compared with 43% who always read the instructions to other cleaning products. This falls to 37% for gardening products, while 36% of respondents always read the instructions before they use DIY and building products for the first time. Only 27% of people always read car/vehicle care product instructions, while just 26% read the instructions that come with everyday detergents. 40
 of all respondents say that they always read the instructions before using these products, while a further 16% say they read them most of the time.")
41 Pesticides and insecticides 17 Of all the product categories under consideration, citizens are most likely to read the instructions before using pesticides and insecticides. Half (50%) of all respondents say that they always read the instructions before using these products, while a further 16% say they read them most of the time. 10% read them only sometimes, and just 7% never read them. Finally, 16% of people say that the question does not apply to them. 17 QC7.6: Before using any of the following products for the first time, how often do you read the safety instructions? Pesticides and insecticides (e.g. weed killers, vermin and pest control). Possible answers: always; most of the time; sometimes; never; not applicable; don t know. 41
42 At individual country level, it emerges that people in Sweden (71%), the Netherlands (69%) and Denmark (68%) are most likely to read the instructions before using pesticides and insecticides. At least 50% of people always read the instructions in 16 of the 27 member states. But in Portugal (28%) and Malta (29%) far fewer people always read them first. Around a quarter (23%) of respondents in Hungary and Portugal say they read the instructions most of the time, compared with just 11% in the Netherlands and Denmark who say this. Never reading the instructions at all is most common in Spain (18%) and Malta (18%), but rarest in Latvia (2%) and Finland (2%). There are only four countries in which more than 10% of people say they never read the instructions 18. A relatively high proportion of respondents do not use pesticides and insecticides in Bulgaria (26%) and Malta (26%). Always reading the instructions is the most common response in all 27 member states. Young respondents are much less likely to use these products, with 25% of those in the age range saying the question does not apply to them, compared to 13-15% for the other three categories. In those other three categories, however, a majority of respondents say that they always read the instructions, with 55% in the group, 53% in the 55+ group and 51% in the group saying this. Only 35% of yearolds always read the instructions first. Those with children in the household were more likely to say they always read the instructions 53% cf. 50% of those without children. Education is once again an important factor in determining whether people read the instructions. Despite similar levels of people saying the question is not applicable, 60% of people who finished their studies aged 20 or over say they always read the instructions; but this slips to 52% among the group and to 44% for the 15-and-under group. The occupation scale shows a similar distribution; 62% of managers say that they always read the instructions, compared with just 35% of students, 45% of unemployed people and 46% of house persons. 18 BG, ES, MT, PT 42
43 Other cleaning products 19 Over four in ten (43%) of respondents say they always read the instructions, followed by 23% who say they read them most of them time; 18% say they read them just sometimes, with only 9% claiming never to read them. A further 6% regard the question as not applicable to them. In several EU member states, a majority of respondents say that they always read the instructions before using other cleaning products. 19 QC7.3: Before using any of the following products for the first time, how often do you read the safety instructions? Other cleaning products (e.g. drain cleaners, oven cleaners). Possible answers: always; most of the time; sometimes; never; not applicable; don t know. 43
44 Six in ten (59%) of those in the UK read the instructions first, as do 58% of those in the Netherlands and 57% in Luxembourg, but this contrasts with Portugal, where only 20% of people do so, and with Romania (27%) and Malta (28%). At least 50% of people always read the instructions in nine member states. Three in ten (30%) of respondents in the Czech Republic and Hungary say they read the instructions most of the time, as opposed to just 16% of those in Spain who say this. In Malta, a relatively high number of people (23%) say that they never read the instructions, though just 3% of those in Finland say this. In 10 member states, at least 10% of people say they never read the instructions Socio-demographically, women are more likely to read the instructions than men. Seven in ten (69%) women say that they read the instructions either always or most of the time, compared with 63% of men. One in ten men (11%) never read the instructions, compared with 8% of female respondents. Younger respondents appear to be the least inclined to read the instructions. Only 53% of those in the category say that they read the instructions either always or most of the time; this compares with 70% of year-olds, 71% of year-olds, and 66% of over-55s. Those with children in the household were slightly more likely to read the instructions 45% always read them compared to 43% of those without children. The level of education again emerges as a significant variable. Three quarters (76%) of people who finished their studies aged 20 or over say they read the instructions always or most of the time before using other cleaning products; but this goes down to 68% among the group and to 58% for the 15-and-under band. The occupation of the respondent reinforces these findings. Only 30% of students say that they always read the instructions, far fewer than the 52% of managers who always do so. But a relatively high number of students (16%) say that this question is not applicable to them far more than in all other groups. 44
45 Gardening products 20 Over a third (37%) of respondents say that they always read the instructions for gardening products, and a further 20% say that they read them most of the time. Just 14% only read them sometimes, with 11% never reading them at all. A further 17% of people say the question does not apply to them. At individual country level, a high proportion of respondents in the UK (52%), Estonia (50%) and the Czech Republic (48%) say that they always read the instructions before using gardening products. But far fewer people in Portugal (19%) and Malta (23%) say the same thing. 20 QC7.5: Before using any of the following products for the first time, how often do you read the safety instructions? Gardening products (e.g. fertilizers, plant conditioners). Possible answers: always; most of the time; sometimes; never; not applicable; don t know. 45
46 At least 40% of people say they always read the instructions in 15 member states. Never reading the instructions at all is quite common in some member states, chiefly Spain (24%), but only 3% of people in Estonia never read them at all. At least 10% of people say they never read the instructions in 12 EU countries 21. A high proportion of respondents do not use gardening products in Bulgaria (26%) and Malta (26%), though only 8% of people in Finland say the question does not apply to them Age variations emerge much as they have done throughout. Only 40% of those in the category say that they read the instructions either always or most of the time; this rises to 60% among the over-55s. But younger respondents are far more likely not to use these products: 27% say the question does not apply to them, compared with 12-16% for the other three age categories. There were no notable differences between those with children in the household and those without. Higher education is also a factor; 66% of those who finished their studies aged 20 or over say they read the instructions always or most of the time; but this slips to 60% among the group and to 50% for the 15-and-under band. Perhaps unsurprisingly, respondents who say they live in a large town are more likely to say that the question is not applicable to them: 21% say this, compared with 18% who live in a small/mid-sized town and 12% who live in a rural village. 21 BG, DE, IE, EL, ES, IT, MT, NL, PT, RO, SI, SE 46
47 Do it Yourself, (DIY) and building products 22 Across the EU, 36% of respondents say that they always read the instructions before attempting to use DIY or building products. A further 22% say they read them most of the time, while 18% sometimes read them and 12% never read them. Finally, 11% of respondents, who presumably have never used DIY or building products, say the question is not applicable to them. 22 QC7.1: Before using any of the following products for the first time, how often do you read the safety instructions? DIY (Do It Yourself) products and building materials (e.g. paints, varnish). Possible answers: always; most of the time; sometimes; never; not applicable; don t know. 47
48 At individual country level, 56% of respondents in Estonia say they always read the instructions, followed by 53% in Denmark and 50% in Finland who say the same thing. Only 19% or respondents in Portugal, 23% in Greece and 25% in Romania always consult the instructions. At least 40% of people say they always read the instructions in 12 member states. A fifth (21%) of people in Spain say they never read the instructions, contrasting sharply with the 2% of respondents in Finland who never read them. At least 10% of respondents in 15 EU countries 23 say they never read the instructions. The question is not applicable to 21% of people in Greece and Portugal, although only 4% of those in Denmark say that DIY and building products are not relevant to them. Always is the most popular answer in all member states, with the exception of Austria, Portugal and Romania. The socio-demographic data reveals some differences in the way men and women view the need for instructions to accompany DIY or building products. Six in ten men (62%) read the instructions either always or most of the time, compared with 54% of women. Women are far more likely to say that DIY and building products do not apply to them: 17%, as opposed to just 5% for men. Age variations follow a familiar pattern, with young respondents most likely to say that they never read the instructions. 17% of year-olds say this, as opposed to 10% in the and age groups, and 12% in the 55+ category. Those with children in the household were more likely to always read the instructions 38% compared to 35% of those without children. Better-educated respondents also emerge as the ones most likely to read the instructions, while those who spent less time at school are the most likely never to read the instructions. 69% of those who finished their studies aged 20 or over say they read the instructions always or most of the time; but this falls to 59% among the group and to 49% among the 15-and-under group. 16% of those who left school at 15 or less never read the instructions, as opposed to just 7% who left at 20 or over. 23 BG, DE, IE, EL, ES, FR, IT, LU, MT, NL, AT, PT, RO, SI, SK 48
 say they always read the instructions than only read them most of the time (17%), sometimes (16%), or never (17%).")
49 Car/vehicle care products 24 A relatively large number of respondents (21%) say that this question is not applicable to them. However, of those who do use car/vehicle care products, more people (27%) say they always read the instructions than only read them most of the time (17%), sometimes (16%), or never (17%). At individual country level, relatively large numbers of respondents in certain member states say that they always read the instructions before using car/vehicle products, foremost among them Estonia (42%) and the UK (40%). But only 14% of people in Portugal and 18% of those in Bulgaria say that they always read the instructions first. 24 QC7.4: Before using any of the following products for the first time, how often do you read the safety instructions? Car/vehicle care products (e.g. car wax, lubricating oils, wheel cleaners). Possible answers: always; most of the time; sometimes; never; not applicable; don t know. 49
50 At least 30% of people say they always read the instructions in 11 member states. Citizens in Spain are least likely to read the instructions (29%), whereas only 4% in Estonia say that they would never read the instructions before use. In only four member states do less than 10% of people say they never read them. The not applicable response shows wide variations between different member states, again reflecting levels of vehicle ownership or of public transport usage. 33% of respondents in Bulgaria say this question is not relevant to them, compared with 13% of those in Belgium. Always reading the instructions is only the most popular answer in 16 members states. Socio-demographically, it emerges that male respondents are more likely to regard the instructions as something that needs to be read before using car/vehicle products. 51% of men do this always or most of the time, more than the 38% of women who do the same. However, far more women say that the use of car/vehicle products does not apply to them: 31% of women say this, compared with just 11% of men. Those with children in the household are more likely to always read the instructions 29% compared to 26% of those without children. Non-applicability is also more of an issue for younger and older respondents than it is for the two middle age categories. 28% of over-55s and 24% of those in the age group say that they do not use car/vehicle products, whereas only 15% of yearolds and 17% of year-olds say they do not use them. Those in the youngest age bracket are again the least likely to always read the instructions: 22% always read them, compare with 25% of the over-55s and 29% in the and age groups. The level of education produces the same pattern as seen for other products. 53% of people who finished their studies at 20 or above say they read the instructions always or most of the time; but this dips to 46% among the group and again to 34% for the 15-and-under group. Respondents in this last group are far more likely to say that this question is not applicable to them, with 29% answering in this way, more than the 19% in the groups and the 15% in the 20 and over category who say the same. 50

51 Everyday detergents 25 The need to read instructions before using everyday detergents is not widely accepted throughout the EU, with as many people (26%) saying that they never read the instructions as there are saying they always read them. 25% of people sometimes read the instructions, with 19% saying they read them most of the time. At individual country level, a high proportion of respondents in France (44%) and Estonia (40%) say that they always read the instructions before using everyday detergents. But far fewer people in Slovakia (13%), Ireland (15%) and Austria (15%) do the same. 25 QC7.2: Before using any of the following products for the first time, how often do you read the safety instructions? Everyday detergents (e.g. washing powder, dish washing detergents). Possible answers: always; most of the time; sometimes; never; not applicable; don t know. 51
52 At least 30% of respondents say they always read the instructions in eight member states. Never reading the instructions at all is relatively common in Ireland (40%) and the Netherlands (40%), whereas only 12% of people in France, Latvia and Finland never read the instructions at all. At least 20% of people say they never read the instructions in all but seven countries % of people in Cyprus do not see this question as applying to them, but only 1% of people in Belgium, the Czech Republic, Denmark, Germany, Luxembourg, Finland and Sweden say the same. Always is only the most common answer in 10 member states never is the most common answer in 12. The socio-demographic data demonstrate that female respondents are more inclined to read the instructions before using everyday detergents than male respondents. 50% of women say that they consult the instructions either always or most of the time, whereas only 41% of men say the same. 29% of men never read the instructions, compared with 24% of women. 48% of those with children in the household always or sometimes read the instructions compared to 45% of those without. Young people are once again the most likely to disregard the instructions. Only 41% of those in the category say that they look at the instructions either always or most of the time; this compares with 47% of year-olds, 46% of yearolds, and 47% of over-55s. The trend of higher education meaning a greater propensity to consult the instructions is continued here. 49% of those who finished their studies aged 20 or over say they read the instructions always or most of the time; but this falls to 47% among the group and to 41% for the 15-and-under band. 31% of this last group say they never read the instructions, whereas only 23% who studied until they were at least 20 say this. 26 EE, FR, LV, LT, HU, PL, FI 52

53 2.5 How often instructions are followed -- Large numbers of people who read the instructions to their chemical products go on to follow the instructions fully, but many people also read the instructions only to disregard them -- At EU level, pesticides and insecticides again emerge as the chemical products viewed in the most serious light by the general public, with 74% of respondents saying that they follow the instructions to these products fully once they have read them. This falls to 63% for other cleaning products and gardening products, while 57% of respondents fully follow the instructions to DIY and building products before using those. The instructions to car/vehicle care products are followed in full by 54% of people who read them, with just 48% of people fully following the instructions to everyday detergents. 53


54 Pesticides and insecticides 27 There is a broad consensus across the EU that pesticides and insecticides are potentially hazardous and that it is therefore important to follow the instructions to these products fully after reading them. 74% of respondents say they follow the instructions fully after reading them. Only 23% of people say that they follow them only partially, with 2% not following them at all. At country level, 85% of respondents in the Netherlands say that they follow the instructions fully before using pesticides and insecticides, followed by 81% in the Czech Republic and Denmark who say the same. More than 70% of respondents say they follow the instructions fully in all but seven member states. 27 QC8.6: For each of the following products, when you read the safety instructions, to what extent do you follow these instructions? Pesticides and insecticides (e.g. weed killers, vermin and pest control). Possible answers: fully; partially; not at all; don t know. 54
55 However, a much lower than average 51% of respondents in Portugal and 54% in Lithuania say the same thing. 43% of people in Portugal and 42% in Lithuania say they partially follow the instructions, far more than the 13% of those in the Netherlands who say this. 6% of respondents in both Portugal and Italy say that they do not follow the instructions at all after reading them, whereas only 1% say this in the Netherlands, Denmark, the UK, Sweden, Ireland, Slovenia, Slovakia, Cyprus, Bulgaria, Hungary, France, Finland, Estonia and Latvia. Turning to the socio-demographic data 76% of women follow pesticide and insecticide product instructions in full, compared with 72% of male respondents. There were no notable differences between those with children in the household and those without. Older respondents emerge as the group most likely to follow instructions to these products in full. 64% of year-olds say they follow the instructions completely, compared with 73% in the group, 75% in the group, and 77% in the over- 55 bracket. The respondent s level of education does have an impact, with 77% of those who studied until age 20 or above saying they follow the instructions entirely. But this drops to 74% for the group and to 72% in the 15-and-under group. Occupational distinctions are wider: only 64% of students and 68% of unemployed respondents follow the instructions to these products in full, but 79% of managers and 77% of retired people say the same. The respondent s financial situation also has a bearing on how closely they follow the instructions. 76% of people who almost never have trouble paying their bills say they follow the instructions when using insecticides or pesticides, but only 70% of those who have trouble from time to time and 67% who have trouble most of the time say the same thing. 55
56 Other cleaning products 28 A clear majority of people across the EU say that they follow the instructions fully when it comes to using other cleaning products, such as drain and oven cleaners. 63% of respondents say they do this. 33% of people say that they follow them only partially, while just 3% do not follow them at all. At individual country level, 71% of respondents in the UK say that they follow the instructions completely before using other cleaning products, as do 70% in the Netherlands and 69% in Belgium, Bulgaria and the Czech Republic. At least 60% of respondents say they follow the instructions fully in all but 10 member states. 28 QC8.3: For each of the following products, when you read the safety instructions, to what extent do you follow these instructions? Other cleaning products (e.g. drain cleaners, oven cleaners). Possible answers: fully; partially; not at all; don t know. 56
57 However, a relatively low 38% of respondents in Portugal follow the instructions fully once they have read them, as do just 41% of those in Lithuania. 54% of people in Portugal and Lithuania say they follow the instructions partially, compared with just 25% of those in the UK who say the same. A relatively large number of respondents in Portugal (7%) and Italy (6%) also say that they do not obey the instructions at all after reading them, with just 1% of people in Bulgaria, Denmark, Finland, Slovenia, Estonia and Latvia answering this way. The socio-demographic data shows the same pattern of women who read the instructions being more likely to follow them fully. 67% of female respondents say they do this, whereas only 59% of male respondents follow the instructions in full. 37% of men follow the instructions only partially, compared with 30% of women who do this. Older respondents are again the most likely to follow the instructions in full. Only 53% of year-olds say they fully obey by the instructions accompanying other cleaning products, as opposed to 62% in the group, 64% in the group, and 67% in the over-55 bracket. There were no notable differences between those with and without children in the household. The respondent s level of education does emerge as a relevant variable for this product category. 67% of those who studied until age 20 or more say they follow the instructions in full, but this falls to 63% for the group and again to 61% for the 15-and-under category. This outcome is reflected in the fact that people in certain occupations are more likely to follow the instructions fully than those in others. 66% of managers who read the instructions to other cleaning products follow them in full, but only 54% of students, 58% of unemployed people and 60% of manual workers say the same. However, age appears to be more significant than education when it comes to fully complying with the instructions, given that 68% of retired people way they follow them in full. People who almost never have trouble paying their bills are also more likely to follow the instructions to other cleaning products completely: 66% say they do this, compared with 59% who have trouble from time to time and who have trouble most of the time. 57

. 29 QC8.")
58 Gardening products 29 There is a broad acceptance across the EU that it is important to follow the instructions fully when using gardening products. 63% of respondents say they follow the instructions fully after reading them. 33% of people say that they follow them only partially, while just 3% do not follow them at all. At country level, 72% of people in the Czech Republic say that they follow the instructions fully before using gardening products, as do 71% in Hungary and 70% in Bulgaria, Ireland and Cyprus. A majority of respondents in all member states follows the instructions fully, with just two exceptions: Portugal, where only 43% follow them completely, and Lithuania (46%). 29 QC8.5: For each of the following products, when you read the safety instructions, to what extent do you follow these instructions? Gardening products (e.g. fertilizers, plant conditioners). Possible answers: fully; partially; not at all; don t know. 58
59 48% of respondents follow the instructions partially in Portugal and Lithuania, far more than the 25% of people in the Czech Republic who do this. 8% of respondents in Portugal and 6% of those in Italy say that they do not follow the instructions at all after reading them, although only 1% of people in Bulgaria, Ireland, Slovenia, Slovakia, Luxembourg, Estonia and Latvia say they never follow the instructions once they have read them. According to the socio-demographic data, women are again more likely to follow instructions fully than men. 65% of female respondents say they follow gardening product instructions fully, compared with 60% of male respondents. 36% of men follow the instructions only partially, compared with 30% of women who do this. There were no notable differences between those with and without children in the household. Older respondents again emerge as the most likely to follow instructions in full. Only 54% of year-olds say they fully obey the instructions when they use gardening products, as opposed to 61% in the group, 63% in the group, and 66% in the over-55 bracket. The respondent s level of education does not emerge as a particularly relevant variable for this product category, beyond the fact that students who are of course generally quite young are less likely (53%) to follow the instructions fully. People in certain occupations appear more likely than others to follow gardening product instructions fully. 67% of retired (and hence older) people, 65% of managers and 64% of other white collar workers follow the instructions after reading them, but only 59% of unemployed people and manual workers say the same. 59

60 DIY and building products 30 Amongst EU respondents who said that they do read the instructions, 57% of people say that they follow them fully before using DIY or building products. 39% say they follow them only partially, while just 3% do not follow them at all. At individual country level, 67% of respondents in Malta say they follow the instructions fully before using DIY or building products, as do 64% in Italy and Slovenia. At least half of respondents say they fully follow the instructions in all EU member states, with five exceptions: Portugal (43%), Lithuania (44%), Latvia (48%), Poland (49%) and Romania (49%). Over 90% of respondents say that they either fully or partially read the instructions in all 27 member states. 30 QC8.1: For each of the following products, when you read the safety instructions, to what extent do you follow these instructions? DIY (Do It Yourself) products and building materials (e.g. paints, varnish). Possible answers: fully; partially; not at all; don t know. 60
61 53% of people in Lithuania and 50% in Latvia only partially follow the instructions, compared with just 27% of those in Italy who say this. However, some countries have significant minorities who say they do read the instructions but then do not follow them at all. These are Portugal, where 8% read but then ignore the instructions, and Greece, Italy, Austria, Poland and the UK, where 5% say the same. But only 1% of people never follow the instructions in Slovenia, Bulgaria, Estonia, Denmark, Ireland and Latvia. The socio-demographic data reveals that women who read the instructions that accompany DIY or building products are more likely to follow them in full. 60% of female respondents say they do this, compared with 53% of men. Men are more likely to follow the instructions only partially: 42%, as opposed to 34% for women. There were no notable differences between those with and without children in the household. Older respondents are more likely to follow the instructions in full than younger respondents. Only 49% of year-olds say they fully comply with the instructions, as opposed to 57% in the group, 56% in the group, and 59% in the 55+ category. While the respondent s level of education was shown to have an impact on whether he or she reads the instructions, level of education appears to have little effect on how comprehensively people follow instructions once they decide to read them. There are differences by occupation. 60% of house persons and retired people who read the instructions follow them fully, but this falls to 55% among unemployed people and 53% among manual workers. People who almost never have trouble paying their bills are also more likely to follow the instructions completely: 59% say they do this, compared with 54% who have trouble from time to time, and 53% who have trouble most of the time. 61


62 Car/vehicle care products 31 Most people in the EU say that they follow the instructions fully before using car/vehicle care products. 54% of respondents say they do this, while 40% of people say that they follow them only partially. Only 4% do not follow the instructions at all after reading them. Turning to the individual member states, it emerges that 64% of respondents in Malta say that they follow the instructions completely before using these products, followed by 62% in Slovenia and 61% in France and the UK. 50% or more of respondents say they follow the instructions fully in all but eight member states. 31 QC8.4: For each of the following products, when you read the safety instructions, to what extent do you follow these instructions? Car/vehicle care products (e.g. car wax, lubricating oils, wheel cleaners). Possible answers: fully; partially; not at all; don t know. 62
63 Only 39% of respondents in Portugal stick to the instructions fully once they have read them, however, as do only 43% of people in Lithuania and 44% of those in the Netherlands. 53% of people in Lithuania and 51% in Portugal partially follow the instructions, whereas only 32% of those in Italy say they partially follow them. A relatively large number of people in Portugal (10%), Belgium (7%), Greece (7%) and Italy (7%) claim that they do not obey the instructions at all after reading them. The socio-demographic data shows that 56% of women say they do this in the case of car/vehicle products, whereas 52% of male respondents follow the instructions completely. 43% of men follow the instructions only partially, compared with 36% of women. Those with children in the household were more likely to follow the instructions fully 56% compared to 53% of those without children. There are differences by level of education. 57% of those who studied until age 20 or more say they follow the instructions entirely, but this drops to 52% for both the group and the 15-and-under band. However, house persons (57%) are more likely than people in other occupations to fully comply with the instructions. 63

64 Everyday detergents 32 Across the EU, 48% of respondents who read the instructions to everyday detergent products say that they follow the instructions fully. 44% of people say that they follow them only partially, while 7% do not follow them at all. This last statistic probably reflects the fact that everyday products are not seen as being as potentially hazardous as less familiar products, and that some people therefore feel confident about ignoring the instructions even if they have read them. At individual country level, 58% of respondents in Malta say they follow the instructions completely before using everyday detergents, as do 57% in France and the UK. However, only 30% of respondents in Portugal who read the instructions follow them fully, as do 35% of those in Austria and 37% of people in Lithuania and the Netherlands. More than 50% of respondents say they follow the instructions fully in just 10 member states. In several countries the number of people who say they read the instructions but then do not follow them at all is relatively high. 32 QC8.2: For each of the following products, when you read the safety instructions, to what extent do you follow these instructions? Everyday detergents (e.g. washing powder, dish washing detergents). Possible answers: fully; partially; not at all; don t know. 64
65 This is especially true in the Netherlands (12%), Portugal (12%), Germany (11%) and Austria (10%). Only 2% of people in Bulgaria never follow the instructions after reading them. The socio-demographic data shows that 51% of female respondents who read the instructions that accompany the products are more likely to follow them fully and 45% of male respondents. 50% of those with children in the household say they follow the instructions fully compared to 48% of those without children. Older respondents are also more likely to follow the instructions in full than younger respondents. Only 42% of year-olds say they fully abide by the instructions, as opposed to 49% in the group, 48% in the group, and 51% in the 55+ category. As with DIY and building products, level of education is not a significant variable. The respondent s occupation is relevant, however. House persons, who might be expected to use everyday detergents more than people in other occupations, are the most likely to follow the instructions fully once they have read them: 53% do this, as do 52% of retired people. However, only 43% of students, 44% of self-employed people and 46% of manual workers say the same. 65

66 3. LABEL COMPREHENSION 3.1 Warning vs. danger -- The word danger is considered stronger than the word warning by most people in the EU, but anomalous results in a few member states point to the challenge of achieving standardisation across 27 countries with so many different languages -- The word danger clearly has much more resonance for most people in the EU than the alternative warning % of respondents say that a product marked with danger strikes them as being more hazardous than one marked warning. Only 9% of people think the opposite and say that a product marked warning carries the greater hazard, although 20% of people say that they see no difference between the two expressions. The country level results suggest that it is important to understand the linguistic subtleties of individual member states in order to know which words to use in order to best convey the message that a product is hazardous. In most member states, very few people think that their word for warning has the most force. But this is not the case in Estonia, where 53% say that warning is more powerful, or in Slovakia (24%) and the Czech Republic (22%) results that contrast sharply with that seen in Bulgaria, where only 3% of people think that warning is stronger. Danger is overwhelmingly seen as denoting that the product is hazardous, especially in the Netherlands and the UK, where 83% of people say that danger is the stronger word to use. 33 QC9: Imagine that you have two chemical products, with a different word on each label. One has the word "warning", the other has the word "danger". In your opinion, which of these two chemical products is the most hazardous? Possible answers: the product with the word warning ; the product with the word danger ; no difference, each product is equally hazardous; don t know. 66

67 At least 70% of respondents see danger as the more forceful term in 11 member states. Yet only 30% of people in Estonia, 43% in Austria and 45% in Bulgaria say that danger is the more forceful term. In only 10 member states do more than 10% of respondents think that warning is the stronger term. Large numbers of respondents in Austria (48%) think that there is no real difference between the meaning of the two words, far more than the 7% of people in the Netherlands and the UK who say the same. Danger is seen as the stronger term in all but two member states: Estonia, where warning is considered stronger; and Austria, where no difference is the most popular response. 67
68 The challenge of judging which term is better at conveying a sense of hazard can be revealed by comparing the results of different member states that share the same language. In Ireland, only 59% of people think that danger is the stronger term, while 23% say there is no difference between the two; but in the UK, 83% find danger to be the stronger term, and just 7% consider the two to have equal force. In Austria, 43% of people say that danger is more forceful and 48% can see no difference between the two words; but in Germany, 67% think that danger is stronger and only 25% understand the two words to be meaningfully distinct. Socio-demographically, men and women show identical responses in their interpretation of the terms warning and danger. The variations across the different age groups are also marginal, although younger respondents are slightly more likely to consider danger the stronger term. 73% of year-olds say this, compared with 68-69% for the other three age categories. There were no notable differences between those with and without children in the household. People who have spent more time in education are similarly more likely to consider danger as the more forceful term. 74% of those who completed their education aged 20 or above say that danger is stronger, compared with just 66-67% for the other two groups. The respondent occupation scale shows a similar outcome. 74% of managers feel that danger conveys a stronger sense of hazard, but only 66% of house persons and 68% of manual workers say the same. 68

69 3.2 Awareness of the newly introduced and pre-existing symbols -- EU citizens generally have a very similar level of awareness of the older European chemical hazard symbols and of the newly introduced CLP hazard symbols -- Symbol A Symbol B Symbol C Symbol D Symbol E Symbol F Symbol G Symbol H The results at EU level show that there is far greater recognition of some hazard symbols than there is for others. 88% of people say they have seen Symbol D (the CLP flammability symbol) before, while 86% say they have seen Pictogram H (the European flammability symbol) before. 76% have seen Pictogram F (the old EU harmful symbol) before and 59% have seen Symbol C (the CLP skin irritation hazard) before. However, recognition is much lower for the other symbols. 44% say they have seen Pictogram G (the old EU corrosive symbol) before, whereas 33% have seen Symbol B (the CLP environmental hazard symbol); and 32% have seen Pictogram E (the European environmental hazard symbol) before, with 20% having seen Symbol A (the CLP respiratory health hazard symbol) QC10 Now we are going to show you different symbols. Please indicate for each symbol whether you have seen it before or not. (SHOW THE FIRST 4 CLP SYMBOLS THEN SHOW THE 4 PICTOGRAMS). Possible answers: yes; no; don t know. 69

70 Symbol A Symbol A, the CLP symbol, had two potential correct answers in the survey, firstly, a chemical product that causes asthma or other respiratory hypersensitivity reactions and, secondly, a chemical product that is carcinogenic % say they have not seen it before, compared with only 20% who have. Recognition is relatively high in Ireland, where 37% of people say they have seen Symbol A, and also in Hungary (36%) and Portugal (31%). At least 20% of people say they have seen this symbol before in 14 member states. However, in the Netherlands and Sweden only 11% of people claim to have seen the symbol before. A high number of respondents say they have not seen this symbol in the Netherlands (88%) and Sweden (88%), with just 58% of people in Ireland saying that they haven t seen it. A high number of respondents also answered don t know in some member states chiefly Romania (14%), Italy (8%) and Bulgaria (7%). Socio-demographic analysis shows that male respondents are slightly more likely to recognise it than female respondents: 22% say they have seen it, compared with 18% of women. This distinction may come down to the fact that men are more likely to encounter this symbol in the workplace than women. 35 Detailed information on the GHS symbols used by the UN is available here: 70
71 There were no notable differences between those with and without children in the household. Age variations are minimal: those in the two middle age groups are slightly more likely (21-22%) to have seen the symbol than those in the group (19%) or the 55+ group (18%). Education also improves recognition: 21% of people who completed their schooling at age or at 20+ have seen the label before, but this drops to 17% in the 15-and-under category. The occupation scale shows that house persons are less likely to recognise Symbol A: only 16% are familiar with it, compared with 24% of self-employed people and 22% of managers, other white collar workers and manual workers. Those who use chemical products at work are unsurprisingly more likely (23%) to have seen this symbol than those who do not (17%). Symbol B There is generally higher recognition of this CLP symbol, which warns of properties that constitute a hazard to the environment. 33% of EU respondents say they have seen it before, compared with 64% who have not. A majority of respondents (51%) have seen Symbol B before in Ireland and Slovenia, followed by 47% in Luxembourg. At least 30% of people say they have seen this symbol before in 15 member states but recognition is much lower in Estonia (22%), Latvia (24%) and Lithuania (24%). 77% of people in Estonia say they have not seen the symbol before, whereas just 44% in Ireland say this. Once again, a high proportion of respondents in Romania (15%) say they do not know if they have seen the symbol before. Socio-demographic analysis reveals a substantial gender distinction for this symbol. 39% of men say that they have seen it before compared with 27% of women. Those with children in the household are more likely to claim to have seen it 36% compared to 32% of those without children. 71
72 Age variations are also substantial. Young respondents are most likely to recognise this symbol, with 46% saying they have seen it before. But this falls to 38% for the group, 33% for the group, and finally to 23% for the 55+ group. Education also has an effect on recognition: 35% of people who completed their schooling at age 20 or over are familiar with this symbol, but this drops to 33% for the group and again to 23% for the 15-and-under bracket. The occupation scale reflects these discrepancies. Retired people (22%) and house persons (24%) are least likely to know Symbol B, whereas students (48%), manual workers (39%) and managers (38%) are more likely to have seen it before. People who use chemical products at work are again more likely (37%) to have seen this symbol before than those who do not (28%). Symbol C Symbol C, the CLP symbol denoting that a product is among other properties a skin irritant, is familiar to a majority of EU citizens. 59% of EU respondents say they have seen it before, compared with 38% who have not. A large majority of respondents have seen Symbol C before in Latvia (86%), Estonia (78%) and Denmark (76%). A majority of people recognise this symbol in every member state, with three exceptions: only 48% of people in Greece, Italy and Romania say they are familiar with it. 49% of respondents in Greece say they have not seen Symbol C before, compared with 14% in Latvia. As before, an unusually high number of respondents in Romania (14%) say they do not know if they have seen the symbol before. Socio-demographic analysis shows that 62% of male respondents and 56% of women have seen the symbol. 62% of those with children claim to have seen the symbol compared with 57% of those without children. 72
73 Older respondents (52%) are less likely to recognise this symbol than the other three age categories (61-63%). However, for Symbol C, there are major differences in awareness based on respondent s level of education. 66% of people who completed their education at age 20 or over are familiar with this symbol, but this falls to 60% for the group and again to 48% for the 15-and-under bracket. The occupation scale reflects these outcomes. House persons (49%) and retired people (52%) are the least likely to recognise this hazard symbol, while recognition is higher among managers (67%) and students (64%). People who use chemical products at work are again more liable (65%) to have seen this symbol before than those who do not (55%). Symbol D The CLP symbol representing a product that has flammable properties is the most widely recognised by EU citizens. 88% of people say they are familiar with it, while just 10% claim never to have seen it. Recognition of Symbol D is almost universal in Denmark, Latvia, Luxembourg and the Netherlands, where 97% of respondents say they have seen it before. More than 90% of people say they have seen Symbol D in 13 member states. But recognition is relatively low in Romania, where only 66% of people report having seen the symbol, and also Bulgaria (76%), and Italy and Portugal (79%). 23% of those in Romania report never having seen Symbol D, compared with just 2% of people in Denmark. Again, don t know is a common answer in Romania (11%). Socio-demographic analysis reveals a narrow gender distinction, with male respondents (90%) slightly more likely to say that they know Symbol D than women (87%). Those with children in the household were more likely to claim awareness of this symbol 91% compared to 87% of those without children. 73
74 Older respondents (84%) once more appear less likely to recognise this symbol than the other three age categories (90-91%). Education also has an impact on recognition. 92% of people who completed their education at age 20 or over say they have seen this symbol, compared with 89% of those in the group and 82% of those in the 15- and-under bracket. The occupation scale follows the same pattern established by the data for the other symbols. Retired people (83%) and house persons (86%) are the least likely to recognise this Symbol D, while recognition is highest among managers (92%) and manual workers (91%). People who use chemical products at work are, as before, more likely (93%) to have seen this symbol before than those who do not use them in the workplace (86%). 74
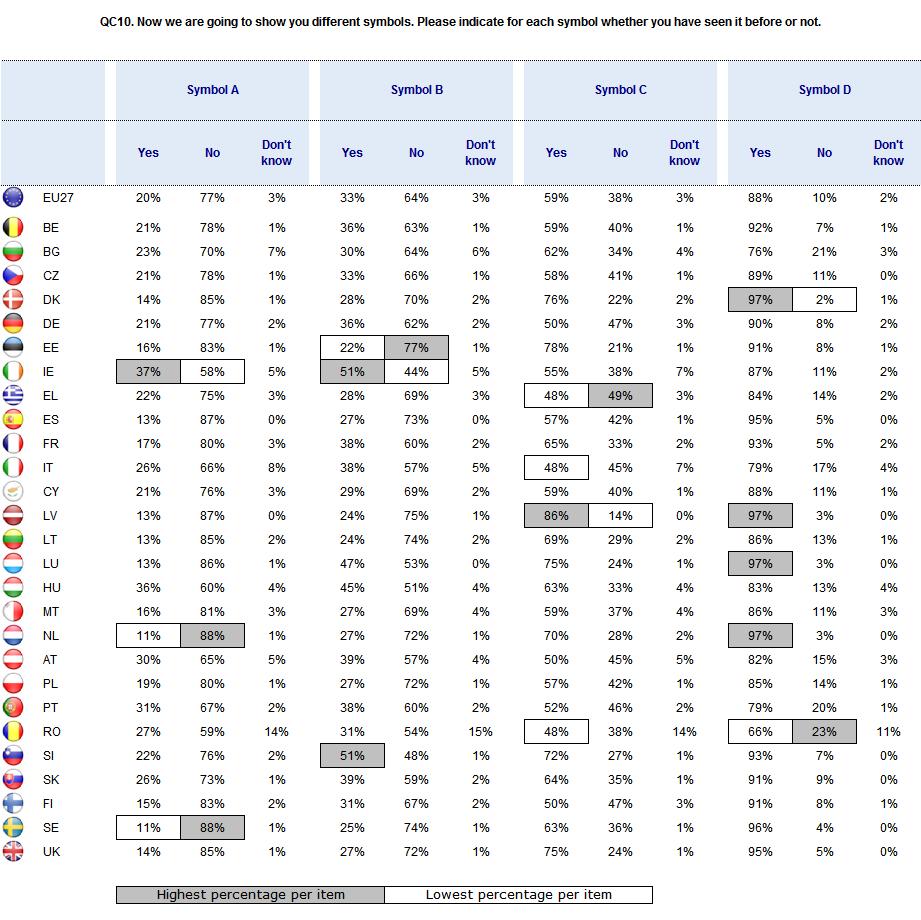
75 75
76 Pictogram E This pictogram is the older European chemical hazard symbol denoting that a product is hazardous to the environment. Only 32% of EU citizens say they are familiar with this symbol, while 65% claim never to have seen it. These results are almost identical to those for Symbol B, the updated CLP version of Pictogram E. Recognition of this symbol is relatively high in Ireland (48%), Luxembourg (45%) and Slovenia (43%), which were also the three countries with the highest level of recognition for the CLP equivalent Symbol B. This suggests that most people who recognise the older European environmental hazard symbol are not confused by the switch to the new universal symbol. At least 30% of people say they have seen this symbol in 13 member states. Fewer people than average say they are familiar with Pictogram E in Latvia (22%), however, as well as in Lithuania (24%), Estonia (24%) and the Netherlands (25%). 77% of people in Latvia say they have never seen this symbol, with just 44% of those in Ireland saying that they have not seen it. The socio-demographic data show that male respondents (38%) are more likely to say that they are familiar with the symbol in question than women (26%). Those with children are more likely to recognise the symbol 35% compared with 30% of those without children in the household. Older respondents (22%) are the least likely to recognise the symbol, with young respondents in the group by far the most likely (45%). The respondent s level of education also shows some differences. 33% of people who completed their education at age 20 or over say they have seen it before, compared with 32% of those in the group and 23% of those in the 15-and-under category. Retired people (21%) and house persons (24%) are the least likely to recognise the symbol. Recognition amongst students (47%) is particularly high. People who use chemical products at work are once again more likely (35%) to have seen the symbol before than those who do not (27%). 76
77 Pictogram F This pictogram is the old European chemical hazard symbol denoting that a product is harmful. The cross symbol has no direct equivalent in the newer CLP system. 76% of EU citizens say they are familiar with it, while just 21% claim never to have seen it. Recognition of this symbol is exceptionally high in Denmark (92%), the Netherlands (90%), Luxembourg (89%) and in Latvia and the UK (88%). A majority of respondents has seen this symbol in every member state except Romania, where only 42% say they have seen it before. Awareness is also relatively low in Bulgaria - 43% of people say they have not seen it before, compared with just 7% of those in Denmark saying this. The socio-demographic data reveal that men (78%) are slightly more likely to say that they have seen the symbol than women (74%). A notably higher proportion of those with children in the household were aware of this symbol 82% compared to 74% of those without children in the household. Older respondents in the 55+ category (67%) are the least likely to recognise the symbol; 80-82% of respondents in the other three age ranges say they have seen it before. The respondent s level of education also show different levels of awareness. 82% of people who completed their education at age 20 or more say they have seen it before, compared with 77% of those in the group and 67% of people in the 15- and-under category. As with other symbols. retired people (65%) and house persons (74%) are the least likely to know this symbol. Recognition among managers (83%), students (81%), other white collars (81%) and manual workers (81%) is highest. People who use chemical products at work are more likely (81%) to have seen Pictogram F before than those who do not (73%). 77
78 Pictogram G This pictogram is the old European chemical hazard symbol denoting that a product is corrosive. 44% of EU citizens say they are familiar with it, but a larger number 53% say that they have never seen it. This symbol is most familiar to respondents in Denmark (71%) and in Luxembourg (70%). By contrast, recognition is very low in Bulgaria (26%) and Romania (26%) two of 18 member states where less than half of citizens recall having seen this symbol. 67% of people in Spain say they have not seen this symbol. Socio-demographic analysis shows that male respondents (52%) are much more likely to know this symbol than female respondents (36%). Those with children in the household were more likely to have seen it 50% compared to 42% of those without children. Younger respondents also have greater familiarity with Pictogram G. 52% of those in the group say that they have seen it before, but this falls slightly to 50% for the group, to 49% for the group, and again to 32% for the over-55s. The respondent s level of education also has an impact on his or her ability to recognise the symbol in question. 52% of people who completed their education at age 20 or more say they have seen it before, compared with 44% of those in the group and 32% of people in the 15-and-under category. The occupation scale once again mirrors awareness for other symbols, with retired people (30%) and house persons (32%) the least likely to say they have seen the symbol before. Recognition among managers (54%) and students (52%) is again the highest. People who use chemical products at work are more likely (51%) to have seen this symbol than those who do not (39%). 78
79 Pictogram H This pictogram is the older European chemical hazard symbol denoting that a product has flammable properties. It closely correlates with the new CLP Symbol D. A considerable 86% of EU citizens say they have seen it before, with just 12% saying that they have never seen it. This symbol is very widely recognised in Denmark (97%) and Luxembourg (97%). By contrast, recognition is relatively poor in Romania (59%) and Bulgaria (72%) two of only five member states in which less than 80% of people recognise Pictogram H. 27% of respondents in Romania say they have never seen Pictogram H, far more than the 2% of people in Denmark who say the same. Socio-demographic analysis shows that male respondents (88%) are slightly more likely to have seen this symbol before than female respondents (84%). Whereas 90% of those with children in the household say they have seen this pictogram, this falls to only 84% of those without children. Younger respondents again show higher levels of recognitions. 90% of people in the group say that they have seen Pictogram H before, but this falls to 88% for the group, to 89% for the group, and then more sharply to 80% for the over- 55s. The respondent s level of education is also correlated with awareness. 91% of people who finished their education at 20 or over say they have seen it before, compared with 87% of those in the group and 78% of people in the 15-and-under category. The occupation scale again show significant differences, with retired people (78%) and house persons (82%) the least likely to know the symbol. Recognition is highest among managers (92%) and manual workers (90%). People who use chemical products at work are more likely (91%) to have seen the symbol than those who do not (83%). 79
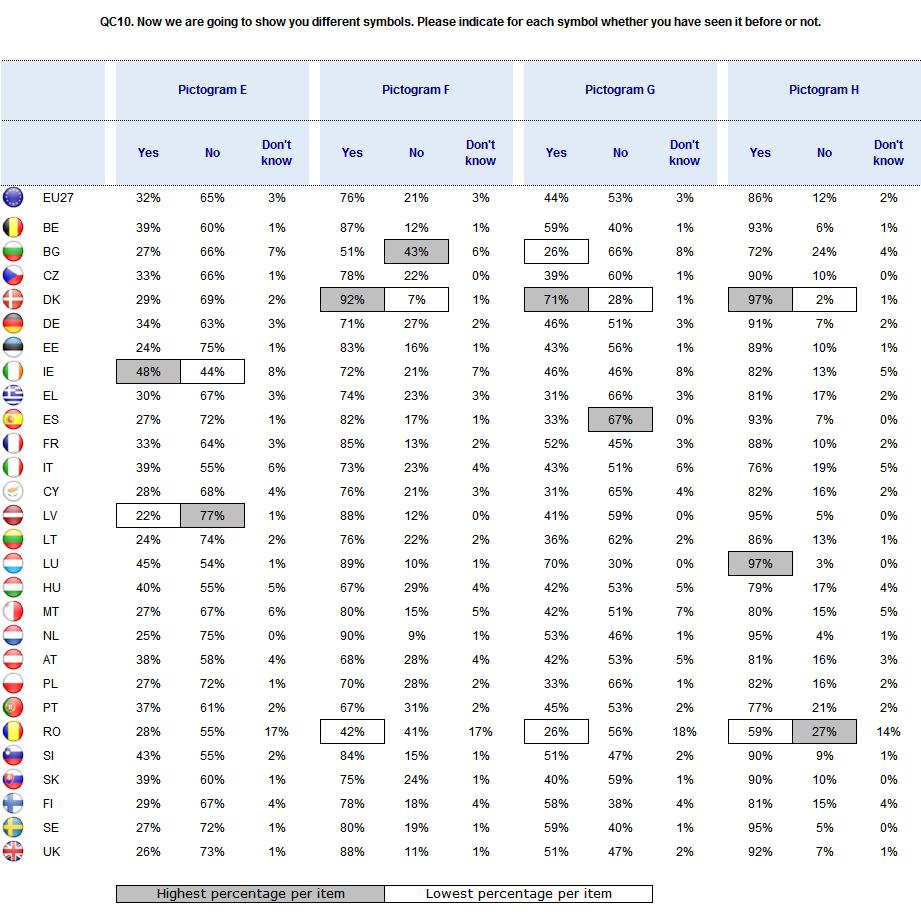
80 80
81 3.3 Comprehension of the new symbols -- The CLP symbols warning of potential fire and environmental hazards are widely understood, but people are more confused about the meaning of other hazard symbols -- Responses from the across the EU demonstrate that some hazard symbols are understood much better than others. 91% of people correctly interpret Symbol D as referring to the risk of flammability, with 76% recognising Symbol B as denoting a potential environmental hazard. However, while 63% of people appreciate that Symbol A refers either to a danger of respiratory irritation or that a product has carcinogenic products, only 11% of EU respondents understand that Symbol C warns of possible skin irritation. 36 It is worth noting the possibility of research effect at this question, which may mean that correct comprehension is over-stated. As respondents were shown a range of possible meanings of each symbol, the level of comprehension may be higher than it would be in real life. Symbol A Symbol A has two meanings the first that the product can cause asthma or other respiratory hypersensitivity reactions and the second that the product is carcinogenic. In total, just under two thirds (63%) correctly identified the symbol as meaning either of these. Many EU respondents (44%) recognise that Symbol A denotes that the product can cause asthma or other respiratory hypersensitivity reactions, while 19% understand it to mean the product may be carcinogenic. 36 QC11: Now, please tell me what do you think each of these four symbols stand for? This symbol stands for a chemical product... (SHOW EACH SYMBOL ONE BY ONE). Possible answers: that is flammable; that is corrosive to metal; that is an environmental hazard; that is carcinogenic; that is a skin irritant; that causes asthma or other respiratory hypersensitivity reactions; don t know. 81

82 23% say that they do not know what the symbol means, with 8% believing that it points to skin irritation as the potential hazard. 2% think that it means the product is flammable, that it is corrosive and that it is an environmental hazard. Symbol A is widely understood to refer to a potential respiratory hazard in the Netherlands and Sweden (68%), but a relatively small minority of people interpret the symbol in this way in Bulgaria (22%). 82
83 Respondents were less likely to recognise it as a warning of the potential carcinogenic properties of a product although in France around three in ten respondents mention this (31% compared with 32% who mention respiratory problems). The carcinogenic interpretation is lowest in Ireland (5%), Estonia (6%) and Latvia (7%). 13% of respondents in Denmark thinks the symbol refers to potential skin irritation. A high number of respondents in Romania (50%) say they simply do not know what the symbol means, an outcome which could point to low usage of the standard hazard symbols by product manufacturers in those particular countries. Only 7% of respondents in Denmark say they don t know what the symbol means. Men were more likely to correctly recognise the symbol as either carcinogenic or respiratory warning 65% compared with 61% of women. Those with children in the household were more likely to recognise the symbol as having either meaning (67% cf. 62%). Older respondents aged 55 and over were less likely to correctly interpret the symbol 56% compared with 67% of those aged under 55. Age of completing education shows a clear pattern of difference of those who finished education at 15 or under 52% correctly recognised the symbol compared with 71% of those who finished their education at age 20 or older. The occupation scale also shows variations in how people interpret this symbol. 74% of managers and 69% of other white collar workers say that it is intended to warn of respiratory hazards, but only 53% of retired people and 63% of unemployed people say the same. Of those who use chemicals at work, 69% correctly described the symbol as either a carcinogenic or respiratory warning compared with 58% of those who do not work with chemicals. 83


84 Symbol B A large majority (76%) of EU respondents correctly interpret Symbol B as denoting that the product can pose an environmental hazard. 19% say that they do not know what the symbol means, but very few respondents incorrectly describe this symbol. Symbol B is overwhelmingly understood to refer to a possible environmental hazard in Denmark (92%), although just 48% of people in Romania thought this. Almost half (46%) of people in Romania admit that they do not know what the symbol means, although just 6% in Denmark and Luxembourg say that they don t know. 84

85 The socio-demographic data show that there is a small gender variation for this symbol. 78% of male respondents say that it refers to a potential environmental hazard, but only 73% of women say the same thing. 21% of women say they do not know what it means compared with 16% of men. Those with children in the household were more likely to understand the symbol 80% compared to 74% of those without children. Age also shows differences in interpretation. Only 68% of people in the over-55 group correctly interpret Symbol B, compared with 79-81% of respondents in the other three age brackets. The respondent s level of education shows even more pronounced differences. 84% of respondents who completed their education at age 20 or over correctly understand that this symbol refers to environmental hazards, but this falls to 76% among those educated up to the age of 16-19, and again to 64% among those who left school at 15 or less. There are differences also by occupation. 84% of managers and 83% of other white collar workers understand that it is designed to warn of environmental hazards, but only 65% of retired people and 72% of house persons say the same. 80% of people who use chemical products at work interpret Symbol B as referring to environmental hazards, as opposed to the 72% of people who do not use them at work. 85

86 Symbol C There is poor understanding across the EU of what Symbol C is supposed to mean. 46% of respondents say they do not know what it means, while just 11% gave the correct interpretation that it denotes a hazard that, among other properties, irritate the skin. More people (22%) think it refers to an environmental hazard, 8% saying that it is corrosive to metal. 7% think it warns of a possible carcinogen, while 3% say that a product carrying this symbol is flammable and that it is a respiratory hazard. 86
87 While overall understanding of Symbol C is low, a relatively high number of respondents in some member states recognise that it refers to a possible environmental hazard, especially those in Lithuania (43%). Only 3% of people in Malta think it means this, however. 27% of people in Slovakia think it refers to potential skin irritation. 16% of people in Hungary think that it refers to the risk of corrosion. In Latvia, 17% of people think the symbol relates to carcinogenic risk. Far more people say that they do not know what kind of warning the symbol is trying to convey, especially in Malta, where 69% of respondents say they don t know. The socio-demographic data point to little gender variation for Symbol C, although age distinctions are more marked. 50% of people in the over-55 group say they don t know what the symbol means, but this falls to 46% for the group, to 44% for the group and 42% for the group. Only 9% of over-55s say that it refers to a danger of skin irritation, compared with 12-13% for the other three bands. There were no notable differences between those with and those without children in the household. Level of education also shows differences. Only 43% of respondents who finished their education at age 20 or over say they don t know what the symbol means; this climbs marginally to 44% among those educated up to the age of 16-19, before rising significantly to 55% of those who left school at 15 or under. But while better-educated respondents are more likely to think they know what this symbol means, they are not significantly better at identifying it correctly as referring to a product that might irritate the skin. Only 12% of those in the 20+ and groups say it means this, compared with 8% in the 15-and-under group. In terms of occupation, 51% of retired people and house persons say they don t know what the symbol means, compared with 42% of managers and 43% of other white collar workers. However levels of correct interpretation are similarly low for all groups. Only 42% of people who use chemical products at work say they don t know what this symbol means, compared with 51% of people who do not use them at work. However only 13% of people who use them at work correctly identify Symbol C as relating to possible skin irritation compared with 9% of those who do not work with chemicals 87
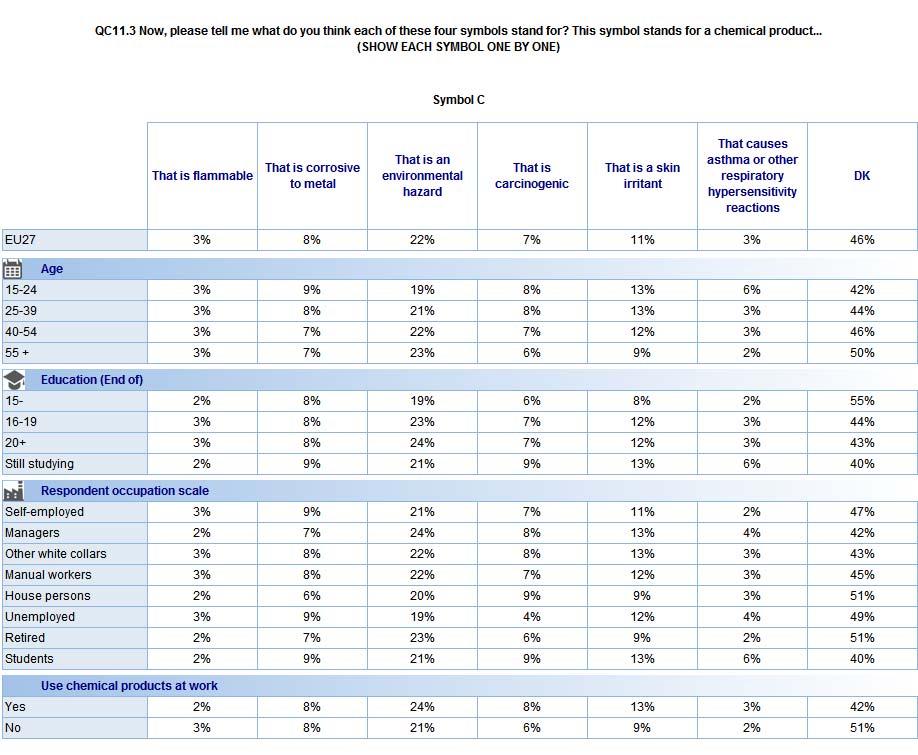
88 88

89 Symbol D This symbol is understood much more widely across the EU. 91% of EU respondents correctly interpret Symbol D as warning that the product is flammable. Just 5% say that they do not know what the symbol means. 89
 correctly interpret the symbol a fairly high proportion of respondents in Romania (24%) say that they do not know what the symbol means.")
90 There is an almost universal understanding that Symbol D refers to a risk of flammability in the Netherlands (99%). Awareness is lowest in Romania - just over seven in ten (72%) correctly interpret the symbol a fairly high proportion of respondents in Romania (24%) say that they do not know what the symbol means. The socio-demographic data show that there is no significant gender variation for this symbol, but there are some differences by age. Only 88% of those in the over-55 group interpret Symbol D as relating to a potential fire hazard, compared to 91-93% of respondents in the other three age brackets. By level of education, 93% of respondents who completed their education at age 20 or above say that this symbol is related to the product being flammable, but this falls to 91% among those educated up to the age of 16-19, and further to 86% among those who left school at 15 or earlier. In terms of occupation, while 94% of managers say that Symbol D relates to flammability, this compares with only 87% of retired people and 89% of house persons. Those with children in the household were more likely to understand it correctly 93% cf. 90%. 94% of people who use chemical products at work interpret Symbol D as referring to the product being flammable, compared with 89% of people who do not use them at work. 90

91 4. INFORMATION 4.1 Quality of information received -- For all six categories of chemical products, most people in the EU feel that they are only moderately informed as to the potential risks associated with them -- Across the EU, at least 50% of respondents say that they are only moderately informed about the potential risks of all six product groups. 34% of people feel totally informed about the risks associated with everyday detergents, but this falls to 28% for other cleaning products and to 24% for pesticides and insecticides. 23% feel that they are totally informed about DIY and building products, with 22% saying they are totally informed about gardening products, and just 19% reckoning that they are totally informed about the risks associated with car/vehicle care products. 91


92 Everyday detergents A majority of EU respondents again feel that they are only moderately informed about the potential risks posed by everyday detergents. 53% say this, compared with 34% who say that they are well informed and a relatively low 11% who say that they are poorly informed. At individual country level, around half regard themselves as being well informed in the Czech Republic (50%), Denmark (49%) and Slovakia (49%); however, only 14% of people in Portugal and 22% in Spain feel well informed. 40% or more respondents say they feel well informed in 10 member states. In Portugal, 67% of people consider themselves to be moderately informed. Fairly high numbers of people consider themselves to be poorly informed in Spain (21%), Romania (19%), Cyprus (18%), Greece (17%), but only 6% of those in Poland. 92
93 The socio-demographic data reveals substantial gender variation for the everyday detergents category, with women more likely than men to feel informed about these kinds of products. 39% of women say that are well informed about them, but only 29% of men say the same. More men say they are moderately informed (56%, compared with 50% for women), and also that they are poorly informed (13%, compared with 9% of women). Those with children in the household also tend to feel better informed 38% feel well informed compared to 34% of those without children. Younger respondents are less well informed in general than older respondents. 27% of year-olds feel they are well informed, compared with 36% in the and groups, and 34% in the over-55 group. 14% of year-olds feel they are poorly informed, compared with 10% in the band, 8% in the band, and 12% in the over-55 band. The respondent s level of education is also related to how well informed people feel. 39% of people who finished their education at age 20 or over claim to be well informed, but this falls to 37% among the category and again to 30% among those who left school at 15 or less. By contrast, 14% of the latter group feel they are poorly informed, compared with just 9% for the other two groups. In terms of occupation, students (25%) and unemployed people (31%) are the least likely to feel well informed about everyday detergents, while white collar workers (39%) and house persons (36%) are the most likely to see themselves as being well informed. 16% of students and 15% of unemployed respondents say they are poorly informed. The respondent s financial situation also shows differences in how well informed people feel. 18% of people who have trouble paying their bills most of the time say they are poorly informed, compared with 12% who have problems from time to time and 10% who almost never have any difficulty. People who use chemical products at work are more likely to consider themselves to be well informed about possible risks. 40% of people who use chemical products at work say they are well informed, compared to just 31% of people who do not use them at work. 12% of the latter group say they are poorly informed, as opposed to just 8% of people who use chemical products at work. 93


94 Other cleaning products Across the EU, most people regard themselves as being moderately informed about the potential risks posed by other cleaning products. 57% think they are moderately informed, while 28% that they are well informed and just 12% say they are poorly informed. At country level, a large share of respondents say they are well informed in Denmark (46%), the Netherlands (40%) and Luxembourg (39%); however, only 8% of people in Portugal and 14% of those in Spain feel well informed. At least 40% of people regard themselves as being well informed in only two member states. 71% of people in Portugal view themselves as being moderately informed. Relatively high numbers of people consider themselves to be poorly informed in Romania (25%), Spain (21%), Greece (20%) and Estonia (20%), but not in Denmark (6%) or Luxembourg (6%). 94
95 The socio-demographic data reveals very minor gender variations for this product group, with women (30%) more likely than men (26%) to feel well informed. 32% of those with children in the household feel well informed compared to 28% of those without. The age data show that younger respondents again feel less well informed than older respondents. Only 20% of year-olds say that they are well informed about other cleaning products, compared with 29% in the group, 31% in the group, and 29% in the over-55 group. 20% of year-olds say they are poorly informed, compared with 11% in the band, just 8% in the band, and 13% in the over- 55 band. The respondent s level of education is also related to how well informed people feel. 33% of people who finished their education at age 20 or over claim to be well informed, but this falls to 30% for the bracket and again to 24% among those who left school at 15 or less. By contrast, 16% of the latter group feel they are poorly informed, compared with just 8-10% for the other two groups. By occupation, students (18%) and unemployed people (24%) are the least likely to feel well informed about this product group, while managers and white collar workers (31% in both categories) are the most likely to consider themselves well informed. 23% of students and 15% of unemployed respondents say they are poorly informed. The respondent s financial situation, as before, shows differences in how well informed people feel. 19% of people who have trouble paying their bills most of the time say they are poorly informed, compared with 13% who have problems from time to time and 10% who almost never have any difficulty. People who use chemical products at work are more likely to consider themselves to be properly informed. 34% of people who use chemical products at work say they are well informed, compared to just 26% of people who do not use them at work. 12% of the latter group say they are poorly informed, as opposed to 9% of people who use chemical products at work. 95


96 Pesticides and insecticides At EU level, a majority of respondents once again describe themselves as being moderately informed about the potential risks of using this product group. 52% of people think they are moderately informed. 24% of people say they are well informed, compared with 20% who say they are poorly informed. At individual country level, a relatively high number of people say they are well informed about pesticides and insecticides in the Netherlands (38%), Ireland (36%), and Denmark (36%); however, just 8% of people in Portugal and 10% of those in Spain say that they are well informed. At least 30% of people think they are well informed in 10 member states 37 ; in just four countries 38 do the same number of people say they are poorly informed. 66% of respondents in Portugal and 62% in Finland see themselves as being moderately informed, but only 35% of people in Malta feel this way. A high proportion of people consider themselves to be poorly informed in Spain (33%) and Bulgaria (33%), with just 11% of people in Luxembourg saying the same thing. 37 NL, IE,, SE, UK, FR, SI, CZ, LU, SK 38 BG, RO, LV, ES 96
97 The socio-demographic data shows that 27% of men feel well informed, compared with 23% of women. 21% of women feel they are poorly informed, as opposed to 17% of men. There were no notable differences between those with and those without children in the household (26% cf. 25% respectively felt informed). By age, older respondents are more likely to consider themselves well informed about the risks associated with these products. 27% of people in the and over-55 groups think they are well informed, but this falls to 22% for the group and again to 18% for the group. 29% of year-olds say they are poorly informed, compared with 20% in the group, 16% in the group, and 18% of over-55s. A higher level of education again is linked to how well informed people feel. 29% of people who finished their education at age 20 or above say they are well informed, but only 25% of people in the group and 22% of those who left school at 15 or less say the same. 22% of people in this last group feel they are poorly informed, compared with 18% of those in the group and 15% in the 20-and-over band. The occupation data reveals that students (15%) and unemployed people (18%) are the least likely to feel well informed about this product group, while retired people (27%), managers (27%) and self-employed workers (27%) are the most likely to think themselves well informed. 30% of students and 27% of unemployed respondents say that they are poorly informed. There are differences by financial status. 27% of people who have trouble paying their bills most of the time say they are poorly informed, whereas only 21% of people who have problems from time to time and 17% of those who have problems almost never say this. People who use chemical products at work are also more likely to consider themselves to be well informed. 30% of people who use chemical products at work say they are well informed, compared to 22% of people who do not use them at work. 97


98 DIY products and building materials Most EU respondents feel that they are moderately informed 39 about the potential risks posed by this class of products. 55% say this, compared with 23% who say that they are well informed and 18% who say that they are poorly informed. At individual country level, it emerges that a high proportion of respondents consider themselves to be well informed in Denmark (42%), the Netherlands (37%) and Ireland (34%), while only 7% of those in Portugal and 9% of those in Spain describe themselves in these terms. In only eight member states do at least 30% of people consider themselves to be well informed. In Portugal, far more people (68%) consider themselves to be moderately informed, whereas only 46% in Ireland and Malta say this. And the member states with relatively large numbers of people who see themselves as poorly informed include Spain (33%), Greece (28%) and Romania (26%), while only 8% of respondents in Denmark think they are poorly informed. 39 Well informed combines respondents who answered 6 or 7 ; moderately informed combines respondents who answered 3, 4 or 5 ; poorly informed combines respondents who answered 1 or 2. 98
99 The socio-demographic data reveals significant gender variation in terms of how people perceive their own understanding of the risks associated with DIY and building products. 29% of men say that are well informed, compared with only 18% of women. 23% of women say they are poorly informed, compared with 12% of men. 26% of those with children in the household feel informed compared to 24% of those without. Differences by age are less notable, but younger respondents generally feel less well informed about these particular products than their older counterparts. Only 19% of year-olds say they feel well informed, compared with 25% in the and groups, and 23% in the over-55 group. 22% of year-olds feel poorly informed, compared with 16% in the band, 14% in the band, and 20% in the over-55 band. The respondent s level of education has a clear bearing on his or her sense of how much information they have about these products. 27% of people who finished their education at age 20 or over claim to be well informed, but this drops to 25% among the category and again to 20% for those who left school at 15 or less. Conversely, 23% of the latter group feel they are poorly informed, more than the 15% of those in the category and the 13% in the 20-and-over category who say the same. The occupation data reveals that house persons (16%) and students (18%) are the least likely to feel well informed, while managers (28%), self-employed people (26%), other white collar workers (26%) and manual workers (26%) are the most likely to consider themselves well informed. 27% of house persons say they are poorly informed, as do 24% of students; but just 10% of managers and 13% of manual workers say the same. The respondent s financial situation is also related to how well informed he or she claims to be. 25% of people who almost never have difficulty paying their bills say they are well informed, but this falls to 21% of those who have difficulty some of the time and to 20% among those who have trouble most of the time. 26% of the latter groups say they are poorly informed, compared with 19% who have problems paying bills some of the time and 15% who almost never have any difficulty. 99
100 People who use chemical products at work are more likely to consider themselves to be properly informed about these products potential risks. 30% of people who use chemical products at work say they are well informed about the risks associated with DIY and building products, as opposed to just 20% of people who do not use them at work. 19% of the second group say they are poorly informed, as opposed to just 12% of people who use chemical products at work. 100


101 Gardening products At EU level, a majority of respondents consider themselves to be moderately informed about the potential risks associated with gardening products. 53% of people think they are moderately informed. 22% of people say they are well informed, compared with 20% who think they are poorly informed. At individual country level, a high number of people say they are well informed about this group of products in Slovakia (35%), the Netherlands (33%) and Denmark (33%); however, just 7% of people in Portugal and Spain say the same thing. At least 20% of people say they are well informed in 18 EU member states 40, while 20% or more say that they are poorly informed in 13 countries % of respondents in Finland regard themselves as being moderately informed, although only 40% of those in Malta describe themselves in these terms. Relatively high numbers of people consider themselves to be poorly informed in Spain (39%), Bulgaria (31%) and Romania (30%), but this is not the case elsewhere, especially in France (11%). 40 SK, NL,, FR, IE, CZ, UK, LU, DE, SI, AT, MT, BE, EL, SE, CY, LT, LV 41 AT, MT, SE, CY, LT, LV, HU, EE, BG, RO, IT, PT, ES 101
102 The socio-demographic data suggests a slight gender variation for this category of products, with 24% of men saying they are well informed, compared with only 21% of women. 22% of women feel they are poorly informed, as opposed to 18% of men. There were no notable differences between those with and those without children in the household. The age data shows that older respondents are more likely to see themselves as being well informed. 25% of people in the and over-55 groups think they are well informed, but this falls to 21% for the group and 14% for the group. 30% of year-olds say they are poorly informed, compared with 20% in the group, 17% in the group, and 19% of over-55s. Looking at the education data shows that while 27% of people who finished their education at age 20 or over feel well informed about gardening products, only 23% of people in the bracket and 21% of those who left school at 15 or less say the same. 23% of the latter group feel they are poorly informed, compared with 18% of those in the group and 16% for the 20-and-over group. By occupation, students (14%), house persons (18%) and unemployed people (18%) are the least likely to feel well informed about this product group, while retired people (26%), managers (25%) and manual workers (24%) are the most inclined to consider themselves well informed. 27% of unemployed respondents and 25% of house persons say they are poorly informed. The financial data show that while 29% of people who have trouble paying their bills most of the time say they are poorly informed, only 21% of those who have problems from time to time and 17% who almost never have any trouble with bills feel this way. People who use chemical products at work are also more likely to consider themselves to be properly informed about the risks of using gardening products. 28% of people who use chemical products at work say they are well informed, compared to just 19% of people who do not use them at work. 102


103 Car/vehicle care products Across the EU, most people again view themselves as being moderately informed about the potential risks attached to this particular product group: 50% think they are moderately informed. However, more people - 24% - say they are poorly informed than people who say they are well informed (19%). At country level, a relatively high proportion of respondents say they are well informed in the Czech Republic (30%), Slovakia (30%), the Netherlands (26%) and Ireland (26%); however, just 7% of people in Portugal and Spain feel well informed. More than 20% of people say they are poorly informed in 23 EU member states. Relatively high numbers of people consider themselves to be poorly informed in Greece (37%), Bulgaria (36%), Cyprus (35%) and Romania (35%), whereas only 17% of respondents in the UK feel this way. 103
104 The socio-demographic data shows that male respondents are more likely to feel well informed about car/vehicle care products. 25% of men say they are well informed, compared with only 13% of women. Men are also more likely to feel moderately informed 55% say this compared with 45% of women. 32% of women say they are poorly informed, twice as many as the 16% of men who fell this way. 22% of those with children in the household felt informed compared with 19% of those without children. By age, the youngest and the oldest respondents feel less well informed than those in the middle two age brackets % of year-olds and over-55s say that they are well informed, compared with 20% in the other two age bands. 28% of year-olds and over-55s say they are poorly informed, while only 21% in the two middle bands say the same. The respondent s level of education is related to how well informed they feel themselves to be. 22% of people who finished their education at age 20 or over claim to be well informed, but this falls to 20% for the bracket and again to 14% among those who left school at 15 or less. By contrast, 32% of the latter group feel they are poorly informed, compared with just 22% for the group and 19% for the 20-andover group. By occupation, house persons (12%) and unemployed people (14%) are the least likely to feel well informed about this product group, while managers, white collar workers and manual workers (all 22%) are the most likely to consider themselves well informed. 36% of house persons and 33% of unemployed respondents say they are poorly informed. In terms of financial situation, 34% of people who have trouble paying their bills most of the time say they are poorly informed, compared with 25% who have problems from time to time and 22% who almost never have any difficulty. People who use chemical products at work are also more likely to consider themselves to be properly informed. 23% of people who use chemical products at work say they are well informed, compared to just 16% of people who do not use them at work. 104
105 4.2 Sources of information -- A clear majority of people read the product packaging to find out about any potential risks, but other sources of information are popular in certain member states and in certain sections of society -- Across the EU, by far the most popular source of information about the potential dangers associated with chemical products is the product packaging % of respondents say they consult the packaging to find this information. 36% also say that they read information leaflets or brochures, while 24% rely on safety information passed on by family and friends. 22% get information about potential product risks from the TV, with 19% use the internet as a source. 18% rely on word of mouth, with 12% referring to newspapers and 11% to magazines. Finally, 6% use the radio as a source of information. 42 QC13: Where do you generally find information about the potential dangers of chemical products? Possible answers: product packaging; newspapers; magazines; TV; radio; information leaflets/brochures; internet; word of mouth; family and friends; other; none; don t know. (MULTIPLE ANSWERS POSSIBLE) 105
106 At individual country level, the proportion who consult the product packaging is highest in Denmark (96%), Sweden (96%) and Slovenia (91%). At least 80% of people say they consult the packaging in all but six EU countries 43. However, relatively low numbers of people do this in Italy (61%), Poland (69%) and Portugal (70%). 43 LV, EL, LT, PT, PL, IT 106
, and Spain, Malta, Latvia and Romania (all 23%). At least 30% of people get their information from this source in all but seven EU countries 44.")
107 Information leaflets and brochures are most commonly used by people in Sweden (65%), Slovakia (54%) and Ireland (53%) they are much less likely to be mentioned in Slovenia (21%), and Spain, Malta, Latvia and Romania (all 23%). At least 30% of people get their information from this source in all but seven EU countries BG, IT, ES, LV, RO, MT, SI 107
 Greece and Cyprus (37%).")
 the only countries where less than 20% of people get their")
108 Friends and family are most commonly used for information in Austria (40%), Slovenia (38%) Greece and Cyprus (37%). They are less likely to be consulted in the UK (15%), the Netherlands (16%) and Poland (18%) the only countries where less than 20% of people get their safety information from this source. 108
109 TV is used as a source of product information by many respondents in Lithuania (35%), Greece (32%), Luxembourg (30%), Romania (29%) and Slovenia (29%). It is less commonly used in Spain (12%), Ireland (13%) and the UK (17%). Under 20% of people rely on TV for information in eight member states. 109
, Finland (39%) and the Netherlands (38%).")

, Sweden (33%) and Slovenia (31%)")

110 The internet is favoured as a source of information in Sweden (44%), Denmark (41%), Finland (39%) and the Netherlands (38%). At least 20% of people rely on the internet in 14 member states. However, only 7% of respondents in Portugal and 8% of those in Spain turn to the internet for useful safety information. Large numbers of respondents in Bulgaria (40%), Sweden (33%) and Slovenia (31%) say they get information about chemical products via word of mouth. At least 20% of people rely on word of mouth in 17 member states. Only 9% of people in Lithuania, 12% of those in Poland and 13% of those in Latvia rely on word of mouth, however. 110
, and also to get information from friends and family (26%, compared with 22% for men).")
111 The socio-demographic data suggest that there is little difference between men and women when it comes to finding information about chemical products. Women are slightly more likely to get information from TV (24%, compared with 20% for men), and also to get information from friends and family (26%, compared with 22% for men). But men are more inclined to rely on leaflets/brochures (38%, compared with 34% for women), and on the internet (21%, compared with 17% for women). Those with children in the household were more likely to use the internet to find information than those without (24% cf. 17%). Respondents aged over 55 are slightly more likely to use newspapers as a source of information than younger age groups. Younger respondents are the most likely to depend on the internet for information: 28% get information online, compared with 26% for the group, 21% for the group, and just 9% for the over-55 groups. Young people are also most likely to rely on friends and family for information: 31% of those in the group do this, as opposed to just 21-23% of respondents in the other three age bands. 111
112 4.3 Trusted sources of information -- Poison centres are the most trusted sources of information -- Among the many available sources of information about the potential dangers of chemical products, poison centres are the ones trusted by the most people in the EU % of respondents say they trust these institutions to inform them about the potential dangers. 34% of people say they trust doctors on this issue, while 33% also say that they trust the product manufacturers. 31% say that they trust their country s national health authorities, and 29% of respondents trust information that comes from scientists or researchers. Pharmacists are seen as trustworthy sources of information by 25% of respondents, with sales people in shops trusted by 22% of those in the EU. 21% consider NGOs to be dependable sources of information, 17% have faith in the information passed onto them by friends and family, with 13% of respondents regarding the EU and its agencies, such as the ECHA, as trustworthy. Only 8% consider their government to be a trusted source of information and even less (4%) regard journalists as trustworthy sources of information on the dangers of chemical products. 45 QC14: Which of the following sources would you trust the most for information about the potential dangers of chemical products? (MAX. 4 ANSWERS). Possible answers: sales person in a shop; Non-Governmental Organisations (NGO)/consumer protection organisations; product manufacturers; poison centres; family and friends; doctors; pharmacists; journalists; scientists/researchers; national health authorities; the EU and its institutions (for instance, the European Chemicals Agency ECHA); government; other; none; don t know. (MAX.4 ANSWERS) 112
113 At individual country level, high numbers of people say they trust poison centres in Sweden (79%), Finland (67%) and Belgium (65%), but much lower numbers of people cite poison centres as trusted sources in Malta (10%), Lithuania (18%) and Romania (20%). This variation suggests while poison centres are widely available and well known in some member states, they have a lower profile in others. Poison centres are the most trusted information source in nine EU countries 46, although in only six countries did more than 50% of people choose this response. Doctors are very widely trusted as sources of information in some member states, chiefly France (49%), Luxembourg (48%) and Belgium (44%) but less so in Portugal (16%), Bulgaria (21%) and Slovakia (22%), with under 30% of people choosing this answer in eight countries 47. Doctors are the most trusted information source in Latvia and Poland. The product manufacturer is generally quite well trusted, and this is especially true in Ireland, where 51% of people say they get their information from this source, as well as people in the UK (49%) and Slovakia (48%). In six member states, more than 40% of people say they trust this source of information. However, far fewer people rely on the manufacturer in Germany (23%), Lithuania (23%) and Romania (24%). The product manufacturer is the most trusted information source in four member states 48. Levels of public trust in national health authorities varies considerably. Respondents in Denmark (57%), Finland (51%) and Sweden (50%) are highly likely to trust their national health authority, and in six member states more than 40% of people say they trust this source of information; but this is not the case in Poland (7%), Slovenia (17%) and Lithuania (19%). National health authorities are the most trusted information source in five EU countries 49. Scientists and researchers enjoy high levels of trust in Greece, where 53% of respondents say they would trust them as sources of information, as well as in Denmark (45%) and Cyprus (45%). In seven member states, more than 40% of people say they trust this source of information. But scientists and researchers do not have this kind of status in Portugal (10%), Bulgaria (16%) or Spain (16%). Scientists and researchers are the most trusted information source in six member states. 46 BE, DE, ES, FR, IT, LU, AT, FI, SE 47 BG, IE, IT, HU, PT, RO, SK, UK 48 CZ, IE, SK, UK 49, EE (equal with scientists/researchers), HU, MT, NL. 113
114 Pharmacists are highly favoured as sources of information in Belgium (45%) and the Netherlands (39%), but relatively few people seek information from their pharmacist in Slovakia (10%), Spain (12%) and Portugal (12%). Sales people in shops emerge as being especially well trusted as sources of information in Portugal (45%), Ireland (43%) and Slovakia (42%); but in the UK (9%) and Lithuania (12%) they are not highly rated as reliable sources of information. Sales people are the most trusted information source in three EU countries 50. NGOs are seen as particularly trustworthy sources of information in Luxembourg (35%) and in Denmark (34%) and Sweden (34%); yet respondents in Spain (8%), Lithuania (11%) and Portugal (12%) are far less likely to turn to NGOs for their chemical product information. In only 13 countries 51 do more than 20% of people say they trust this source of safety information. Many respondents go to family and friends for their safety information in Bulgaria (36%), Estonia (28%) and Romania (26%), with at least 20% of people saying they trust this source of safety information in 15 countries 52. The EU and its agencies are regarded as trusted sources of information in Denmark (29%), Finland (26%), the Netherlands (23%) and Luxembourg (20%) the only four countries where at least 20% of people say they trust this information source. Trust in the EU is much lower in Portugal (6%), Romania (6%) and Sweden (7%). Relatively high numbers of people see the government as a reliable source of information about chemical products in Sweden (21%), the UK (18%) and Denmark (14%). But elsewhere trust in government on this issue is extremely low, especially in Lithuania (1%) and Romania (1%). In only seven countries do at least 10% of people say they trust their government to deliver this kind of information 53. While there is generally a very low level of trust in journalists as a source of information about chemical products, an unusually high proportion of respondents in Lithuania 14% - say they would trust journalists to convey this kind of information. But this is the only country where more than 10% of respondents say they trust journalists as a source. 50 BG, PT, RO 51 CZ,, DE, FR, IT, CY, LU, HU, MT, NL, AT, SI, SE 52 BG, CZ, EE, IE, EL, LV, LT, HU, MT, AT, PL, PT, RO, SI, SK 53 BE,, LU, NL, AT, SE, UK 114
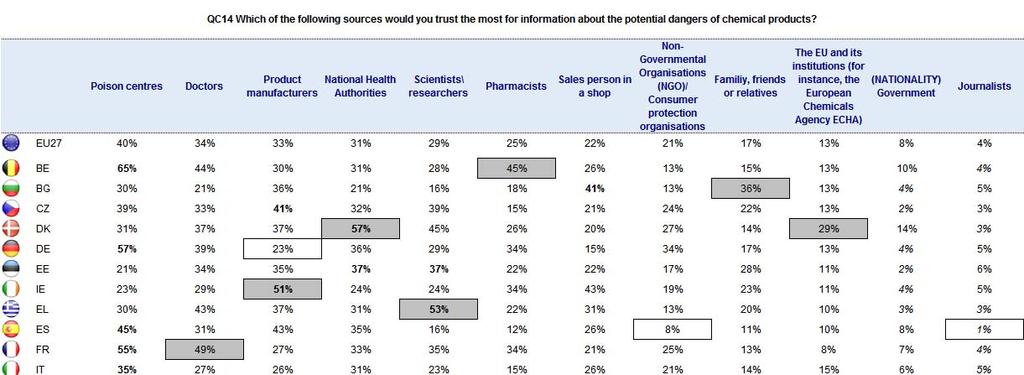
115 115
116 Turning to the socio-demographic data, there appears to be very little gender or age distinctions in terms of the sources of information about chemical products that people say they trust. Those with children in the household are more likely to trust product manufacturers than those without children (36% cf. 32%), scientists (30% cf. 28%), poison centres (43% cf. 39%) and the EU (14% cf. 12%). Those without children in the household are more likely to trust family and friends (17% cf. 15%) and pharmacists (26% cf. 22%) The respondent s level of education has a bearing on how much trust he or she is likely to place in the various sources of information. Only 17% of people who finished their education at age 20 or above say they trust sales people in shops, for example, but this rises to 24% for people in the group and again to 26% of those who left school at 15 or less. However, people who spent longer in formal education are more likely to trust other sources of information. 27% of people who completed their education at age 20 plus say they trust NGOs, but this falls to 21% of those in the group and 16% of those who left school at 15 or under. Similarly, 46% of those educated to the age 20 or more say they trust poison centres as information sources, but this drops to 41% for the group and again to 34% for the 15-and-under group. Trust of the EU is also much higher among respondents who spent more time in formal education. 18% of people who completed their education at age 20 or over say they trust the EU and its agencies as an information source, but only 12% of those in the group and 6% of those who left school at 15 or under say the same.. 116
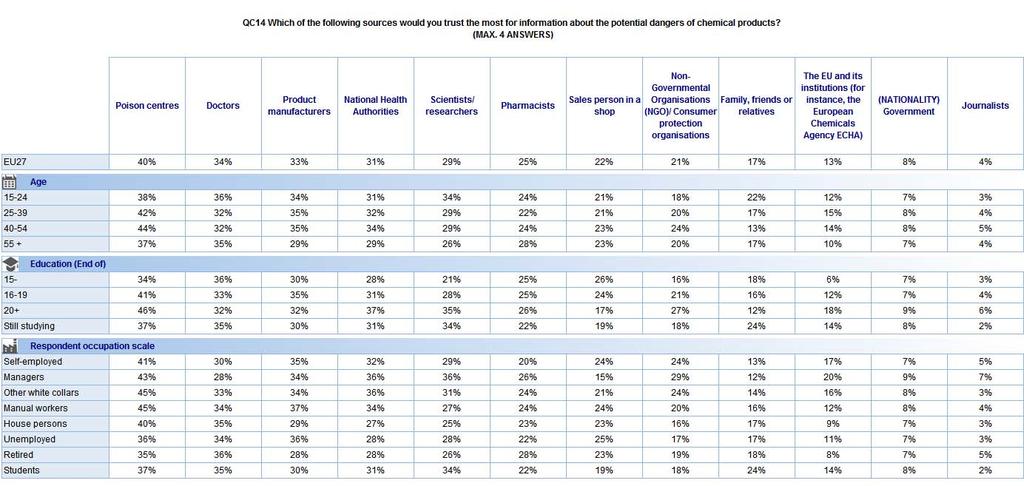
117 117
118 CONCLUSION There are many positive conclusions to be drawn from this first Eurobarometer survey. Many hazardous substances, such as pesticides and insecticides, are widely recognised both to be chemical products and to be dangerous. There is also widespread understanding that it is advisable to read the safety instructions before using chemical products in order to avoid the potential hazards. However, the report shows very clearly that understanding of chemical products and people s awareness of the safety issues surrounding them vary considerably from one member state to another. Although the awareness or even the knowledge related to these issues appears to be reasonably high in some member states, in others the level of understanding isn t pronounced. General education about chemical products and the related safety matters is therefore needed in the EU, so that more people in society know where to look for this information and how to interpret it. That such education is needed is shown by the fact that half of the people in the EU, for example, do not even consider car/vehicle products to be chemical products. People also need to be given more certainty about where they can find reliable information about chemical-related safety issues: right now, many EU citizens do not know where to turn for trustworthy information. While making the shift from the old European chemical hazard symbols to the CLP symbols, many of the new symbols have not yet appeared widely to the general public. However, the results of this study show also that the new symbols are far from being self-explanatory, and therefore, there is a need for education as to what many of the hazard symbols mean. Even in member states where understanding of the issues surrounding chemical products is generally quite high, relatively few people know what some of the hazard symbols refer to. Therefore, this survey does serve to highlight the areas where work needs to be done and the member states in which the most effort needs to be invested. It should hence be a useful tool in the years ahead. 118
119 ANNEXES
120 TECHNICAL SPECIFICATIONS
121 SPECIAL EUROBAROMETER 360 Chemical products TECHNICAL SPECIFICATIONS Between the 25 th of November and the 17 th of December 2010, TNS Opinion & Social, a consortium created between TNS plc and TNS opinion, carried out the wave of the EUROBAROMETER, on request of the EUROPEAN COMMISSION, Directorate-General for Communication, Research and Speechwriting. The SPECIAL EUROBAROMETER 360 is part of wave and covers the population of the respective nationalities of the European Union Member States, resident in each of the Member States and aged 15 years and over. The basic sample design applied in all states is a multi-stage, random (probability) one. In each country, a number of sampling points was drawn with probability proportional to population size (for a total coverage of the country) and to population density. In order to do so, the sampling points were drawn systematically from each of the "administrative regional units", after stratification by individual unit and type of area. They thus represent the whole territory of the countries surveyed according to the EUROSTAT NUTS II (or equivalent) and according to the distribution of the resident population of the respective nationalities in terms of metropolitan, urban and rural areas. In each of the selected sampling points, a starting address was drawn, at random. Further addresses (every Nth address) were selected by standard "random route" procedures, from the initial address. In each household, the respondent was drawn, at random (following the "closest birthday rule"). All interviews were conducted face-to-face in people's homes and in the appropriate national language. As far as the data capture is concerned, CAPI (Computer Assisted Personal Interview) was used in those countries where this technique was available.
122 ABBREVIATIONS COUNTRIES INSTITUTES N INTERVIEWS FIELDWORK DATES POPULATION 15+ BE Belgium TNS Dimarso /11/ /12/ BG Bulgaria TNS BBSS /11/ /12/ CZ Czech Rep. TNS Aisa /11/ /12/ Denmark TNS Gallup /11/ /12/ DE Germany TNS Infratest /11/ /12/ EE Estonia Emor /11/ /12/ IE Ireland MRBI /11/ /12/ EL Greece TNS ICAP /11/ /12/ ES Spain TNS Demoscopia /11/ /12/ FR France TNS Sofres /11/ /12/ IT Italy TNS Infratest /11/ /12/ CY Rep. of Cyprus Synovate /11/ /12/ LV Latvia TNS Latvia /11/ /12/ LT Lithuania TNS Gallup Lithuania /11/ /12/ LU Luxembourg TNS ILReS /11/ /12/ HU Hungary TNS Hungary /11/ /12/ MT Malta MISCO /11/ /12/ NL Netherlands TNS NIPO /11/ /12/ AT Austria Österreichisches Gallup-Institut /11/ /12/ PL Poland TNS OBOP /11/ /12/ PT Portugal TNS EUROTESTE /11/ /12/ RO Romania TNS CSOP /11/ /12/ SI Slovenia RM PLUS /11/ /12/ SK Slovakia TNS AISA SK /11/ /12/ FI Finland TNS Gallup Oy /11/ /12/ SE Sweden TNS GALLUP /11/ /12/ UK United Kingdom TNS UK /11/ /12/ TOTAL EU /11/ /12/


123 For each country a comparison between the sample and the universe was carried out. The Universe description was derived from Eurostat population data or from national statistics offices. For all countries surveyed, a national weighting procedure, using marginal and intercellular weighting, was carried out based on this Universe description. In all countries, gender, age, region and size of locality were introduced in the iteration procedure. For international weighting (i.e. EU averages), TNS Opinion & Social applies the official population figures as provided by EUROSTAT or national statistic offices. The total population figures for input in this post-weighting procedure are listed above. Readers are reminded that survey results are estimations, the accuracy of which, everything being equal, rests upon the sample size and upon the observed percentage. With samples of about 1,000 interviews, the real percentages vary within the following confidence limits: Observed percentages 10% or 90% 20% or 80% 30% or 70% 40% or 60% 50% Confidence limits ± 1.9 points ± 2.5 points ± 2.7 points ± 3.0 points ± 3.1 points
124 QUESTIONNAIRE
125 C. CONSUMER UNDERSTANDING OF LABELS AND ITS EFFECT ON THE SAFE USE OF CHEMICALS C. LA COMPREHENSION DES CONSOMMATEURS DES ETIQUETAGES ET SON IMPACT SUR UNE UTILISATION SÛRE DES PRODUITS CHIMIQUES QC1 If you think of "chemical products", which of the following words come to mind? QC1 Lorsque vous pensez au terme "produits chimiques", quels mots vous viennent à l esprit? (SHOW CARD READ OUT ROTATE MULTIPLE ANSWERS POSSIBLE) (MONTRER CARTE LIRE ROTATION PLUSIEURS REPONSES POSSIBLES) ( ) ( ) Useful 1, Utile 1, Innovative 2, Innovant 2, Effective 3, Efficace 3, Modern 4, Moderne 4, Natural 5, Naturel 5, Unhealthy 6, Dangereux pour la santé 6, Industrial 7, Industriel 7, Artificial 8, Artificiel 8, Harmful to the environment 9, Nuisible pour l environnement 9, Dangerous 10, Dangereux 10, Other (SPONTANEOUS) 11, Autre (SPONTANE) 11, None (SPONTANEOUS) 12, Aucun (SPONTANE) 12, 13, NSP 13, NEW NEW ASK QC2 IF "CURRENTLY WORK", CODE 5 TO 18 IN D15a OR "WORKED IN THE PAST", CODE 5 TO 18 IN D15b - OTHERS GO TO QC3 POSER QC2 SI " TRAVAILLE ACTUELLEMENT", CODE 5 A 18 EN D15a OU "A TRAVAILLE", CODE 5 A 18 EN D15b - LES AUTRES ALLER EN QC3 QC2 Personally, do you use or have you ever used chemical products at work? QC2 Personnellement, utilisez-vous ou avez-vous déjà utilisé des produits chimiques sur votre lieu de travail? Yes No NEW (509) (509) 1 Oui 1 2 Non 2 3 NSP NEW 3 Questionnaire743 42/66 25/11/2010
126 ASK ALL A TOUS QC3 And still thinking of "chemical products", which of the following products come to mind? QC3 Et toujours en pensant au terme "produits chimiques", quels sont les produits qui vous viennent à l esprit? (SHOW CARD READ OUT ROTATE MULTIPLE ANSWERS POSSIBLE) ( ) DIY (Do It Yourself) products and building materials (e.g. paints, varnish) Every day detergents (e.g. washing powder, dish washing detergents) Other cleaning products (e.g. drain cleaners, oven cleaners) Car\ Vehicle care products (e.g. car wax, lubricating oils, wheel cleaners) Gardening products (e.g. fertilizers, plant conditioners) Pesticides and insecticides (e.g. weed killers, vermin and pest control) Other (SPONTANEOUS) None (SPONTANEOUS) (MONTRER CARTE LIRE ROTATION PLUSIEURS REPONSES POSSIBLES) ( ) Les produits de bricolage et de construction (p.ex. peintures, laques) 1, 1, 2, Les détergents domestiques (p.ex. lessives, produits de nettoyage) 2, D autres produits de nettoyage (p.ex. déboucheurs pour canalisation, 3, décapants pour four) 3, Les produits d entretien automobile (p.ex. lustrants, huiles de vidange, 4, nettoyants pour jantes) 4, 5, Les produits de jardinage (p.ex. engrais, fertilisants pour plantes) 5, Les pesticides et les insecticides (p.ex. désherbants, antiparasites) 6, 6, 7, Autre (SPONTANE) 7, 8, Aucun (SPONTANE) 8, 9, NSP 9, NEW NEW Questionnaire743 43/66 25/11/2010
127 QC4 Which of the following do you use to find out whether a chemical product is hazardous or not? QC4 Parmi les éléments suivants, lesquels utilisez-vous pour savoir si un produit chimique est dangereux ou non? (SHOW CARD READ OUT ROTATE MULTIPLE ANSWERS POSSIBLE) (MONTRER CARTE LIRE ROTATION PLUSIEURS REPONSES POSSIBLES) ( ) ( ) Your previous experience with the product 1, Votre expérience passée du produit en question 1, The smell 2, L odeur 2, The colour 3, La couleur 3, The packaging 4, L emballage 4, The safety instructions 5, Les instructions de sécurité 5, The warning symbols 6, Les symboles d avertissement 6, Information you get in the shop 7, Les informations fournies dans le magasin 7, The type of shop where you can buy the product 8, Le type de magasin où vous pouvez acheter le produit en question 8, Information from family members or friends 9, Les informations fournies par la famille ou les amis 9, Other (SPONTANEOUS) 10, Autre (SPONTANE) 10, None (SPONTANEOUS) 11, Aucun (SPONTANE) 11, 12, NSP 12, NEW NEW QC5 Which things do you need to do to use a chemical product safely? QC5 Quelles choses devez-vous faire pour utiliser un produit chimique de façon sûre? (DO NOT READ OUT DO NOT SHOW CARD PRE-CODED OPEN ENDED QUESTION (NE PAS LIRE NE PAS MONTRER CARTE QUESTION OUVERTE PRE-CODEE MULTIPLE ANSWERS POSSIBLE) PLUSIEURS REPONSES POSSIBLES) ( ) ( ) Read\ follow the instructions of the chemical product 1, Lire\ suivre les instructions du produit chimique en question 1, Wear protective clothing (e.g. gloves, mask) 2, Porter des vêtements de protection (p. ex. des gants, masque) 2, Adhere to recommended frequency of use of the chemical product) Respecter la fréquence conseillée d utilisation du produit chimique en 3, question 3, Use only the recommended amount of the chemical product Utiliser seulement les quantités conseillées du produit chimique en question 4, 4, Store the product correctly 5, Ranger le produit correctement 5, Dispose of the product correctly Respecter les conseils de traitement des déchets du produit chimique en 6, question 6, Other 7, Autre 7, There is no safe use of a chemical product 8, Il n est pas possible d utiliser des produits chimiques de manière sûre 8, 9, NSP 9, NEW NEW Questionnaire743 44/66 25/11/2010
128 QC6 For which of the following chemical products do you think instructions are necessary in order to use them safely? QC6 Pour lesquels des produits chimiques suivants pensez-vous que des instructions sont nécessaires pour qu'ils soient utilisés en toute sécurité? (SHOW CARD READ OUT ROTATE MULTIPLE ANSWERS POSSIBLE) ( ) DIY (Do It Yourself) products and building materials (e.g paints, varnish) Every day detergents (e.g. washing powder, dish washing detergents) Other cleaning products (e.g. drain cleaners, oven cleaners) Car\ Vehicle care products (e.g. car wax, lubricating oils, wheel cleaners) Gardening products (e.g. fertilizers, plant conditioners) Pesticides and insecticides (e.g. weed killers, vermin and pest control) Other (SPONTANEOUS) None (SPONTANEOUS) (MONTRER CARTE LIRE ROTATION PLUSIEURS REPONSES POSSIBLES) ( ) Les produits de bricolage et de construction (p.ex. peintures, laques) 1, 1, 2, Les détergents domestiques (p.ex. lessives, produits de nettoyage) 2, D autres produits de nettoyage (p.ex. déboucheurs pour canalisation, 3, décapants pour four) 3, Les produits d entretien automobile (p.ex. lustrant, huiles de vidange, 4, nettoyants pour jantes) 4, 5, Les produits de jardinage (p.ex. engrais, fertilisants pour plantes) 5, Les pesticides et les insecticides (p.ex. désherbants, antiparasites) 6, 6, 7, Autre (SPONTANE) 7, 8, Aucun (SPONTANE) 8, 9, NSP 9, NEW NEW Questionnaire743 45/66 25/11/2010
129 QC7 Before using any of the following products for the first time, how often do you read the safety instructions? QC7 Avant d utiliser les produits suivants pour la première fois, à quelle fréquence lisez-vous les consignes de sécurité? (SHOW CARD WITH SCALE ONE ANSWER PER LINE) (MONTRER CARTE AVEC ECHELLE UNE REPONSE PAR LIGNE) (READ OUT ROTATE) Alwa ys Most of the time Som Neve etim r es Not appli cabl e (SP ONT ANE OUS ) (LIRE ROTATION) Touj ours La plup art du temp s Parf ois Jam ais Pas NSP appli cabl e (SP ONT ANE ) (549) (550) (551) (552) (553) (554) 1 DIY (Do It Yourself) products and building materials (e.g. paints, varnish) 2 Every day detergents (e.g. washing powder, dish washing detergents) 3 Other cleaning products (e.g. drain cleaners, oven cleaners) 4 Car\ Vehicle care products (e.g. car wax, lubricating oils, wheel cleaners) 5 Gardening products (e.g. fertilizers, plant conditioners) 6 Pesticides and insecticides (e.g. weed killers, vermin and pest control) (549) (550) (551) (552) (553) (554) 1 Les produits de bricolage et de construction (p.ex peintures, laques) 2 Les détergents domestiques (p.ex. lessives, produits de nettoyage) 3 D autres produits de nettoyage (p.ex. déboucheurs pour canalisation, décapants pour four) 4 Les produits d entretien automobile (p.ex. lustrant, huiles de vidange, nettoyants pour jantes) 5 Les produits de jardinage (p.ex. engrais, fertilisants pour plantes) 6 Les pesticides et les insecticides (p.ex désherbants, antiparasites) NEW NEW Questionnaire743 46/66 25/11/2010
130 ASK QC8 IF "READ THE INSTRUCTIONS", CODE 1 TO 3 IN THE EQUIVALENT ITEM IN QC7 - OTHERS GO TO QC9 POSER QC8 SI "LIT LES INSTRUCTIONS", CODE 1 A 3 POUR L'ITEM EQUIVALENT EN QC7 - LES AUTRES ALLER EN QC9 QC8 For each of the following products, when you read the safety instructions, to what extent do you follow these instructions? QC8 Et pour chacun des produits suivants, lorsque vous lisez les consignes de sécurité, dans quelle mesure suivez-vous ces consignes? (SHOW CARD WITH SCALE ONE ANSWER PER LINE) (MONTRER CARTE AVEC ECHELLE UNE REPONSE PAR LIGNE) (READ OUT ROTATE) Fully Partially Not at all (LIRE ROTATION) Complète ment Partiellem ent Pas du tout NSP (555) (556) (557) (558) (559) (560) DIY (Do It Yourself) products and building materials (e.g. paints, varnish) Every day detergents (e.g. washing powder, dish washing detergents) Other cleaning products (e.g. drain cleaners, oven cleaners) Car\ Vehicle care products (e.g. car wax, lubricating oils, wheel cleaners) Gardening products (e.g. fertilizers, plant conditioners) Pesticides and insecticides (e.g. weed killers, vermin and pest control) (555) (556) (557) (558) (559) (560) Les produits de bricolage et de construction (p.ex. peintures, laques) Les détergents domestiques (p.ex. lessives, produits de nettoyage) D autres produits de nettoyage (p.ex. déboucheurs pour canalisation, décapants pour four) Les produits d entretien automobile (p.ex. lustrant, huiles de vidange, nettoyants pour jantes) Les produits de jardinage (p.ex. engrais, fertilisants pour plantes) Les pesticides et les insecticides (p.ex. désherbants, antiparasites) NEW NEW Questionnaire743 47/66 25/11/2010
131 ASK ALL A TOUS QC9 Imagine that you have two chemical products, with a different word on each label. One has the word "warning". The other one the word "danger". In your opinion, which of these two chemical products is the most hazardous? QC9 Imaginez que vous avez deux produits chimiques, avec un mot différent sur leurs étiquetages. L un présente le mot "attention", l autre présente le mot "danger". Selon vous, lequel de ces deux produits est le plus dangereux? (READ OUT ONE ANSWER ONLY) (LIRE UNE SEULE REPONSE) The product with the word "Warning" The product with the word "Danger" No difference, each product is equally hazardous (SPONTANEOUS) NEW (561) (561) 1 Le produit présentant le mot «attention» 1 2 Le produit présentant le mot «danger» 2 3 Pas de différence, les deux produits sont dangereux (SPONTANE) 3 4 NSP 4 NEW QC10 Now we are going to show you different symbols. Please indicate for each symbol whether you have seen it before or not. QC10 Nous allons maintenant vous montrer différents symboles. Veuillez indiquer, pour chacun de ces symboles, si vous les avez déjà vus ou non auparavant. (SHOW THE FIRST 4 GHS SYMBOLS ALL TOGETHER (A-D), AND ASK THE FIRST 4 ITEMS. THEN, SHOW THE 4 PICTOGRAMS ALL TOGETHER (E-H) AND ASK THE LAST 4 ITEMS ONE ANSWER PER LINE) (MONTRER LES 4 PREMIERS SYMBOLES GHS EN MEME TEMPS (A-D), ET DEMANDER DE REPONDRE AUX 4 PREMIERS ITEMS. PUIS MONTRER LES 4 PICTOGRAMMES EN MEME TEMPS (E-H) ET DEMANDER DE REPONDRE AUX 4 DERNIERS ITEMS UNE REPONSE PAR LIGNE) Yes No Oui Non NSP (562) 1 Symbol A (562) 1 (563) 2 Symbol B (563) 2 (564) 3 Symbol C (564) 3 (565) 4 Symbol D (565) 4 (566) 5 Pictogram E (566) 5 (567) 6 Pictogram F (567) 6 (568) 7 Pictogram G (568) 7 (569) 8 Pictogram H (569) 8 Symbole A Symbole B Symbole C Symbole D Pictogramme E Pictogramme F Pictogramme G Pictogramme H NEW NEW Questionnaire743 48/66 25/11/2010
132 QC11 Now, please tell me what do you think each of these four symbols stand for? This symbol stands for a chemical product... QC11 Maintenant, veuillez me dire ce que signifie pour vous chacun de ces quatre symboles. Ce symbole indique que le produit chimique... (SHOW EACH SYMBOL ONE BY ONE AND ASK THE QUESTION ONE BY ONE SHOW CARD WITH SCALE ONE ANSWER PER LINE) (MONTRER CHAQUE SYMBOLE UN PAR UN ET POSER LES QUESTIONS UNE PAR UNE MONTRER CARTE AVEC ECHELLE UNE REPONSE PAR LIGNE) (ROTATE SYMBOLS) That is flam mabl e That is corro sive to meta l That is an envir onm ental haza rd That is carci noge nic That is a skin irrita nt That caus es asth ma or other respi rator y hype rsen sitivit y react ions (ROTATION SYMBOLES) Est infla mma ble Est corro sif pour le méta l Est dang ereu x pour l envi ronn eme nt Est canc érigè ne Est irrita nt pour la peau Prov NSP oque de l ast hme ou d aut res réact ions d hy pers ensi bilité respi ratoir e (570) 1 Symbol A (570) 1 Symbole A (571) 2 Symbol B (571) 2 Symbole B (572) 3 Symbol C (572) 3 Symbole C (573) 4 Symbol D (573) 4 Symbole D NEW NEW Questionnaire743 49/66 25/11/2010
133 QC12 On the whole, how well-informed do you feel about the potential risks posed by the following chemical products? Please use a scale from 1 to 7, where '1' means that you are "not at all informed", and '7' means you are "very well informed". QC12 De façon générale, dans quelle mesure estimez-vous être informé(e) des risques potentiels liés aux produits chimiques suivants? Veuillez utiliser l échelle de 1 à 7, '1' signifiant que vous n êtes "pas du tout informé(e)", et '7' que vous êtes "très bien informé(e)". (SHOW CARD WITH SCALE ONE ANSWER ONLY) (MONTRER CARTE UNE REPONSE PAR LIGNE) (ROTATE) 1 Not at all infor med Very well infor med (ROTATION) 1 Pas du tout infor mé(e ) Très bien infor mé(e ) NSP (574) (575) (576) (577) (578) (579) 1 DIY (Do It Yourself) products and building materials (e.g. paints, varnish) 2 Every day detergents (e.g. washing powder, dish washing detergents) 3 Other cleaning products (e.g. drain cleaners, oven cleaners) 4 Car\ Vehicle care products (e.g. car wax, lubricating oils, wheel cleaners) 5 Gardening products (e.g. fertilizers, plant conditioners) 6 Pesticides and insecticides (e.g. weed killers, vermin and pest control) (574) (575) (576) (577) (578) (579) 1 Les produits de bricolage et de construction (p.ex. peintures, laques) 2 Les détergents domestiques (p.ex lessives, produits de nettoyage) 3 D autres produits de nettoyage (p.ex déboucheurs pour canalisation, décapants pour four) 4 Les produits d entretien automobile (p.ex. lustrant, huiles de vidange, nettoyants pour jantes) 5 Les produits de jardinage (p.ex. engrais, fertilisants pour plantes) 6 Les pesticides et les insecticides (p.ex désherbants, antiparasites) NEW NEW Questionnaire743 50/66 25/11/2010
134 QC13 Where do you generally find information about the potential dangers of chemical products? QC13 Où trouvez-vous en général des informations sur les dangers potentiels des produits chimiques? (SHOW CARD READ OUT ROTATE MULTIPLE ANSWERS POSSIBLE) (MONTRER CARTE LIRE ROTATION PLUSIEURS REPONSES POSSIBLES) ( ) ( ) Product packaging 1, Les emballages des produits 1, Newspapers 2, Les journaux 2, Magazines 3, Les magazines 3, TV 4, La télévision 4, Radio 5, La radio 5, Information leaflets\ brochures 6, Les brochures d information\ dépliants 6, Internet 7, Internet 7, Word of mouth 8, Le bouche-à-oreille 8, Family, friends or relatives 9, La famille, les amis ou les connaissances 9, Other (SPONTANEOUS) 10, Autre (SPONTANE) 10, None (SPONTANEOUS) 11, Aucun (SPONTANE) 11, 12, NSP 12, NEW NEW Questionnaire743 51/66 25/11/2010
135 QC14 Which of the following sources would you trust the most for information about the potential dangers of chemical products? QC14 Parmi les sources suivantes, quelles sont celles auxquelles vous feriez le plus confiance pour des informations au sujet des dangers potentiels des produits chimiques? (SHOW CARD READ OUT ROTATE MAX. 4 ANSWERS) Sales person in a shop Non-Governmental Organisations (NGO)\ Consumer protection organisations Product manufacturers Poison centres Familiy, friends or relatives Doctors Pharmacists Journalists Scientists\ researchers National Health Authorities The EU and its institutions (for instance, the European Chemicals Agency ECHA) (NATIONALITY) Government Other (SPONTANEOUS) None (SPONTANEOUS) NEW (MONTRER CARTE LIRE ROTATION MAX. 4 REPONSES) ( ) ( ) 1, Les vendeurs dans un magasin 1, Les organisations non gouvernementales (ONG)\ Les organisations de 2, protection des consommateurs 2, 3, Les fabricants des produits 3, 4, Les centres antipoison 4, 5, La famille, les amis ou les connaissances 5, 6, Les médecins 6, 7, Les pharmaciens 7, 8, Les journalistes 8, 9, Les scientifiques\ les chercheurs 9, 10, Les autorités sanitaires nationales 10, L UE et ses institutions (en l'occurence l agence européenne des produits 11, chimiques ECHA) 11, 12, Le Gouvernement (NATIONALITE) 12, 13, Autre (SPONTANE) 13, 14, Aucun (SPONTANE) 14, 15, NSP 15, NEW Questionnaire743 52/66 25/11/2010
136 TABLES
137 Special Eurobarometer 360 QC1 Lorsque vous pensez au terme "produits chimiques", quels mots vous viennent à l esprit? (ROTATION PLUSIEURS REPONSES POSSIBLES) QC1 If you think of "chemical products", which of the following words come to mind? (ROTATE MULTIPLE ANSWERS POSSIBLE) QC1 Welche der folgenden Worte fallen Ihnen ein, wenn Sie an "chemische Produkte" denken? (ROTIEREN - MEHRFACHNENNUNGEN MÖGLICH) Utile Innovant Efficace Moderne Naturel Dangereux pour la santé Industriel Useful Innovative Effective Modern Natural Unhealthy Industrial Nützlich Innovativ Effektiv Modern Natürlich Ungesund Industriell % EU 27 BE BG CZ DE EE IE EL ES FR IT CY LV LT LU HU MT NL AT PL PT RO SI SK FI SE UK
138 Special Eurobarometer 360 QC1 Lorsque vous pensez au terme "produits chimiques", quels mots vous viennent à l esprit? (ROTATION PLUSIEURS REPONSES POSSIBLES) QC1 If you think of "chemical products", which of the following words come to mind? (ROTATE MULTIPLE ANSWERS POSSIBLE) QC1 Welche der folgenden Worte fallen Ihnen ein, wenn Sie an "chemische Produkte" denken? (ROTIEREN - MEHRFACHNENNUNGEN MÖGLICH) Artificiel Nuisible pour l environnement Dangereux Autre (SPONTANE) Aucun (SPONTANE) NSP Artificial Harmful to the environment Dangerous Other (SPONTANEOUS) None (SPONTANEOUS) Künstlich Umweltschädlich Gefährlich Andere (SPONTAN) Nichts davon (SPONTAN) WN % EU BE BG CZ DE EE IE EL ES FR IT CY LV LT LU HU MT NL AT PL PT RO SI SK FI SE UK
139 Special Eurobarometer 360 QC2 Personnellement, utilisez-vous ou avez-vous déjà utilisé des produits chimiques sur votre lieu de travail? QC2 Personally, do you use or have you ever used chemical products at work? QC2 Verwenden Sie oder haben Sie in Ihrer Arbeit jemals persönlich chemische Produkte verwendet? Oui Non NSP Yes No Ja Nein WN % EU 27 BE BG CZ DE EE IE EL ES FR IT CY LV LT LU HU MT NL AT PL PT RO SI SK FI SE UK
140 Special Eurobarometer 360 QC3 Et toujours en pensant au terme "produits chimiques", quels sont les produits qui vous viennent à l esprit? (ROTATION PLUSIEURS REPONSES POSSIBLES) QC3 And still thinking of "chemical products", which of the following products come to mind? (ROTATE MULTIPLE ANSWERS POSSIBLE) QC3 Und welche der folgenden Produkte fallen Ihnen ein, wenn Sie an "chemische Produkte" denken? (ROTIEREN - MEHRFACHNENNUNGEN MÖGLICH) Les produits de bricolage et de construction (p.ex. peintures, laques) Les détergents domestiques (p.ex. lessives, produits de nettoyage) D autres produits de nettoyage (p.ex. déboucheurs pour canalisation, décapants pour four) Les produits d entretien automobile (p.ex. lustrants, huiles de vidange, nettoyants pour jantes) DIY (Do It Yourself) products and building materials (e.g. paints, varnish) Every day detergents (e.g. washing powder, dish washing detergents) Other cleaning products (e.g. drain cleaners, oven cleaners) Car/ Vehicle care products (e.g. car wax, lubricating oils, wheel cleaners) Heimwerkerprodukte und Baustoffe (z.b. Farben, Lacke) Alltägliche Reinigungsmittel (z.b. Waschpulver, Spülmittel) Andere Reinigungsmittel (z.b. Abflussreiniger, Ofenreiniger) Pflegeprodukte für Autos/ Fahrzeuge (z.b. Autopolitur, Motorenöl, Felgenreiniger) % EU 27 BE BG CZ DE EE IE EL ES FR IT CY LV LT LU HU MT NL AT PL PT RO SI SK FI SE UK
141 Special Eurobarometer 360 QC3 Et toujours en pensant au terme "produits chimiques", quels sont les produits qui vous viennent à l esprit? (ROTATION PLUSIEURS REPONSES POSSIBLES) QC3 And still thinking of "chemical products", which of the following products come to mind? (ROTATE MULTIPLE ANSWERS POSSIBLE) QC3 Und welche der folgenden Produkte fallen Ihnen ein, wenn Sie an "chemische Produkte" denken? (ROTIEREN - MEHRFACHNENNUNGEN MÖGLICH) Les produits de jardinage (p.ex. engrais, fertilisants pour plantes) Les pesticides et les insecticides (p.ex. désherbants, antiparasites) Autre (SPONTANE) Aucun (SPONTANE) NSP Gardening products (e.g. fertilizers, plant conditioners) Pesticides and insecticides (e.g. weed killers, vermin and pest control) Other (SPONTANEOUS) None (SPONTANEOUS) % EU 27 BE BG CZ DE EE IE EL ES FR IT CY LV LT LU HU MT Produkte für die Gartenarbeit (z.b. Düngemittel) Pestizide und Insektizide (z.b. Unkrautvernichtung smittel, Schädlingsbekämpf ungsmittel) Andere (SPONTAN) Nichts davon (SPONTAN) NL AT PL PT RO SI SK FI SE UK WN
142 Special Eurobarometer 360 QC4 Parmi les éléments suivants, lesquels utilisez-vous pour savoir si un produit chimique est dangereux ou non? (ROTATION PLUSIEURS REPONSES POSSIBLES) QC4 Which of the following do you use to find out whether a chemical product is hazardous or not? (ROTATE MULTIPLE ANSWERS POSSIBLE) QC4 Woran orientieren Sie sich, um herauszufinden, ob ein chemisches Produkt gefährlich ist oder nicht? (ROTIEREN - MEHRFACHNENNUNGEN MÖGLICH) Votre expérience passée du produit en question L odeur La couleur L emballage Les instructions de sécurité Les symboles d avertissement Your previous experience with the product The smell The colour The packaging The safety instructions The warning symbols Ihre bisherige Erfahrung mit dem Produkt Der Geruch Die Farbe Die Verpackung Die Sicherheitshinweise Die Warnzeichen % EU 27 BE BG CZ DE EE IE EL ES FR IT CY LV LT LU HU MT NL AT PL PT RO SI SK FI SE UK
143 Special Eurobarometer 360 QC4 Parmi les éléments suivants, lesquels utilisez-vous pour savoir si un produit chimique est dangereux ou non? (ROTATION PLUSIEURS REPONSES POSSIBLES) QC4 Which of the following do you use to find out whether a chemical product is hazardous or not? (ROTATE MULTIPLE ANSWERS POSSIBLE) QC4 Woran orientieren Sie sich, um herauszufinden, ob ein chemisches Produkt gefährlich ist oder nicht? (ROTIEREN - MEHRFACHNENNUNGEN MÖGLICH) Les informations fournies dans le magasin Le type de magasin où vous pouvez acheter le produit en question Les informations fournies par la famille ou les amis Autre (SPONTANE) Aucun (SPONTANE) NSP Information you get in the shop The type of shop where you can buy the product Information from family members or friends Other (SPONTANEOUS) None (SPONTANEOUS) % EU 27 BE BG CZ DE EE IE EL ES FR IT CY LV LT LU HU MT Die Informationen, die Sie im Geschäft bekommen Die Art des Geschäfts, in dem Sie das Produkt kaufen können Informationen von Familienangehörigen oder Freunden Andere (SPONTAN) Nichts davon (SPONTAN) NL AT PL PT RO SI SK FI SE UK WN
144 Special Eurobarometer 360 QC5 Quelles choses devez-vous faire pour utiliser un produit chimique de façon sûre? (PLUSIEURS REPONSES POSSIBLES) QC5 Which things do you need to do to use a chemical product safely? (MULTIPLE ANSWERS POSSIBLE) QC5 Welche Dinge muss man tun, um ein chemisches Produkt sicher zu verwenden? (MEHRFACHNENNUNGEN MÖGLICH) Lire/ suivre les instructions du produit chimique en question Porter des vêtements de protection (p. ex. des gants, masque) Respecter la fréquence conseillée d utilisation du produit chimique en question Utiliser seulement les quantités conseillées du produit chimique en question Read/ follow the instructions of the chemical product Wear protective clothing (e.g. gloves, mask) Adhere to recommended frequency of use of the chemical product Use only the recommended amount of the chemical product Die Gebrauchsanweisung für das chemische Produkt lesen/befolgen Schutzkleidung tragen (z.b. Handschuhe, Maske) Sich an die empfohlene Verwendungshäufigkeit für das chemische Produkt halten Nur die empfohlene Menge des chemischen Produktes verwenden % EU 27 BE BG CZ DE EE IE EL ES FR IT CY LV LT LU HU MT NL AT PL PT RO SI SK FI SE UK
145 Special Eurobarometer 360 QC5 Quelles choses devez-vous faire pour utiliser un produit chimique de façon sûre? (PLUSIEURS REPONSES POSSIBLES) QC5 Which things do you need to do to use a chemical product safely? (MULTIPLE ANSWERS POSSIBLE) QC5 Welche Dinge muss man tun, um ein chemisches Produkt sicher zu verwenden? (MEHRFACHNENNUNGEN MÖGLICH) Ranger le produit correctement Respecter les conseils de traitement des déchets du produit chimique en question Autre Il n est pas possible d utiliser des produits chimiques de manière sûre NSP Store the product correctly Dispose of the product correctly Other There is no safe use of a chemical product % EU 27 BE BG CZ DE EE IE EL ES FR IT CY LV LT LU HU MT Das Produkt ordnungsgemäß lagern Das Produkt ordnungsgemäß entsorgen Sonstiges (SPONTAN) Es gibt keinen sicheren Umgang mit einem chemischen Produkt NL AT PL PT RO SI SK FI SE UK WN
146 Special Eurobarometer 360 QC6 Pour lesquels des produits chimiques suivants pensez-vous que des instructions sont nécessaires pour qu'ils soient utilisés en toute sécurité? (ROTATION PLUSIEURS REPONSES POSSIBLES) QC6 For which of the following chemical products do you think instructions are necessary in order to use them safely? (ROTATE MULTIPLE ANSWERS POSSIBLE) QC6 Für welche der folgenden chemischen Produkte sind Ihrer Meinung nach Gebrauchsanweisungen erforderlich, um diese sicher zu verwenden? (ROTIEREN - MEHRFACHNENNUNGEN MÖGLICH) Les produits de bricolage et de construction (p.ex. peintures, laques) Les détergents domestiques (p.ex. lessives, produits de nettoyage) D autres produits de nettoyage (p.ex. déboucheurs pour canalisation, décapants pour four) Les produits d entretien automobile (p.ex. lustrants, huiles de vidange, nettoyants pour jantes) DIY (Do It Yourself) products and building materials (e.g. paints, varnish) Every day detergents (e.g. washing powder, dish washing detergents) Other cleaning products (e.g. drain cleaners, oven cleaners) Car/ Vehicle care products (e.g. car wax, lubricating oils, wheel cleaners) Heimwerkerprodukte und Baustoffe (z.b. Farben, Lacke) Alltägliche Reinigungsmittel (z.b. Waschpulver, Spülmittel) Andere Reinigungsmittel (z.b. Abflussreiniger, Ofenreiniger) Pflegeprodukte für Autos/ Fahrzeuge (z.b. Autopolitur, Motorenöl, Felgenreiniger) % EU 27 BE BG CZ DE EE IE EL ES FR IT CY LV LT LU HU MT NL AT PL PT RO SI SK FI SE UK
147 Special Eurobarometer 360 QC6 Pour lesquels des produits chimiques suivants pensez-vous que des instructions sont nécessaires pour qu'ils soient utilisés en toute sécurité? (ROTATION PLUSIEURS REPONSES POSSIBLES) QC6 For which of the following chemical products do you think instructions are necessary in order to use them safely? (ROTATE MULTIPLE ANSWERS POSSIBLE) QC6 Für welche der folgenden chemischen Produkte sind Ihrer Meinung nach Gebrauchsanweisungen erforderlich, um diese sicher zu verwenden? (ROTIEREN - MEHRFACHNENNUNGEN MÖGLICH) Les produits de jardinage (p.ex. engrais, fertilisants pour plantes) Les pesticides et les insecticides (p.ex. désherbants, antiparasites) Autre (SPONTANE) Aucun (SPONTANE) NSP Gardening products (e.g. fertilizers, plant conditioners) Pesticides and insecticides (e.g. weed killers, vermin and pest control) Other (SPONTANEOUS) None (SPONTANEOUS) % EU 27 BE BG CZ DE EE IE EL ES FR IT CY LV LT LU HU MT NL AT PL PT RO SI SK FI SE UK Produkte für die Gartenarbeit (z.b. Düngemittel) Pestizide und Insektizide (z.b. Unkrautvernichtungsmittel, Schädlingsbekämpfungsmittel) Andere (SPONTAN) Nichts davon (SPONTAN) WN
148 Special Eurobarometer 360 QC7.1 Avant d utiliser les produits suivants pour la première fois, à quelle fréquence lisez-vous les consignes de sécurité? Les produits de bricolage et de construction (p.ex. peintures, laques) QC7.1 Before using any of the following products for the first time, how often do you read the safety instructions? DIY (Do It Yourself) products and building materials (e.g. paints, varnish) QC7.1 Wie häufig lesen Sie die Sicherheitshinweise, bevor Sie eines der folgenden Produkte zum ersten Mal benutzen? Heimwerkerprodukte und Baustoffe (z.b. Farben, Lacke) Toujours La plupart du temps Parfois Jamais Pas applicable (SPONTANE) NSP Always Most of the time Sometimes Never Not applicable (SPONTANEOUS) % EU 27 BE BG CZ DE EE IE EL ES FR IT CY LV LT LU HU MT NL AT PL PT RO SI SK FI SE UK Immer Meistens Manchmal Niemals Trifft nicht zu (SPONTAN) WN
149 Special Eurobarometer 360 QC7.2 Avant d utiliser les produits suivants pour la première fois, à quelle fréquence lisez-vous les consignes de sécurité? Les détergents domestiques (p.ex. lessives, produits de nettoyage) QC7.2 Before using any of the following products for the first time, how often do you read the safety instructions? Every day detergents (e.g. washing powder, dish washing detergents) QC7.2 Wie häufig lesen Sie die Sicherheitshinweise, bevor Sie eines der folgenden Produkte zum ersten Mal benutzen? Alltägliche Reinigungsmittel (z.b. Waschpulver, Spülmittel) Toujours La plupart du temps Parfois Jamais Pas applicable (SPONTANE) NSP Always Most of the time Sometimes Never Not applicable (SPONTANEOUS) % EU 27 BE BG CZ DE EE IE EL ES FR IT CY LV LT LU HU MT NL AT PL PT RO SI SK FI SE UK Immer Meistens Manchmal Niemals Trifft nicht zu (SPONTAN) WN
150 Special Eurobarometer 360 QC7.3 Avant d utiliser les produits suivants pour la première fois, à quelle fréquence lisez-vous les consignes de sécurité? D autres produits de nettoyage (p.ex. déboucheurs pour canalisation, décapants pour four) QC7.3 Before using any of the following products for the first time, how often do you read the safety instructions? Other cleaning products (e.g. drain cleaners, oven cleaners) QC7.3 Wie häufig lesen Sie die Sicherheitshinweise, bevor Sie eines der folgenden Produkte zum ersten Mal benutzen? Andere Reinigungsmittel (z.b. Abflussreiniger, Ofenreiniger) Toujours La plupart du temps Parfois Jamais Pas applicable (SPONTANE) NSP Always Most of the time Sometimes Never Not applicable (SPONTANEOUS) % EU 27 BE BG CZ DE EE IE EL ES FR IT CY LV LT LU HU MT NL AT PL PT RO SI SK FI SE UK Immer Meistens Manchmal Niemals Trifft nicht zu (SPONTAN) WN
151 Special Eurobarometer 360 QC7.4 Avant d utiliser les produits suivants pour la première fois, à quelle fréquence lisez-vous les consignes de sécurité? Les produits d entretien automobile (p.ex. lustrants, huiles de vidange, nettoyants pour jantes) QC7.4 Before using any of the following products for the first time, how often do you read the safety instructions? Car/ Vehicle care products (e.g. car wax, lubricating oils, wheel cleaners) QC7.4 Wie häufig lesen Sie die Sicherheitshinweise, bevor Sie eines der folgenden Produkte zum ersten Mal benutzen? Pflegeprodukte für Autos / Fahrzeuge (z.b. Autopolitur, Motorenöl, Felgenreiniger) Toujours La plupart du temps Parfois Jamais Pas applicable (SPONTANE) NSP Always Most of the time Sometimes Never Not applicable (SPONTANEOUS) % EU 27 BE BG CZ DE EE IE EL ES FR IT CY LV LT LU HU MT NL AT PL PT RO SI SK FI SE UK Immer Meistens Manchmal Niemals Trifft nicht zu (SPONTAN) WN
152 Special Eurobarometer 360 QC7.5 Avant d utiliser les produits suivants pour la première fois, à quelle fréquence lisez-vous les consignes de sécurité? Les produits de jardinage (p.ex. engrais, fertilisants pour plantes) QC7.5 Before using any of the following products for the first time, how often do you read the safety instructions? Gardening products (e.g. fertilizers, plant conditioners) QC7.5 Wie häufig lesen Sie die Sicherheitshinweise, bevor Sie eines der folgenden Produkte zum ersten Mal benutzen? Produkte für die Gartenarbeit (z.b. Düngemittel) Toujours La plupart du temps Parfois Jamais Pas applicable (SPONTANE) NSP Always Most of the time Sometimes Never Not applicable (SPONTANEOUS) % EU 27 BE BG CZ DE EE IE EL ES FR IT CY LV LT LU HU MT NL AT PL PT RO SI SK FI SE UK Immer Meistens Manchmal Niemals Trifft nicht zu (SPONTAN) WN
153 Special Eurobarometer 360 QC7.6 Avant d utiliser les produits suivants pour la première fois, à quelle fréquence lisez-vous les consignes de sécurité? Les pesticides et les insecticides (p.ex. désherbants, antiparasites) QC7.6 Before using any of the following products for the first time, how often do you read the safety instructions? Pesticides and insecticides (e.g. weed killers, vermin and pest control) QC7.6 Wie häufig lesen Sie die Sicherheitshinweise, bevor Sie eines der folgenden Produkte zum ersten Mal benutzen? Pestizide und Insektizide (z.b. Unkrautvernichtungsmittel, Schädlingsbekämpfungsmittel) Toujours La plupart du temps Parfois Jamais Pas applicable (SPONTANE) NSP Always Most of the time Sometimes Never Not applicable (SPONTANEOUS) % EU 27 BE BG CZ DE EE IE EL ES FR IT CY LV LT LU HU MT NL AT PL PT RO SI SK FI SE UK Immer Meistens Manchmal Niemals Trifft nicht zu (SPONTAN) WN
154 Special Eurobarometer 360 QC8.1 Et pour chacun des produits suivants, lorsque vous lisez les consignes de sécurité, dans quelle mesure suivezvous ces consignes? Les produits de bricolage et de construction (p.ex. peintures, laques) QC8.1 For each of the following products, when you read the safety instructions, to what extent do you follow these instructions? DIY (Do It Yourself) products and building materials (e.g. paints, varnish) QC8.1 Bitte sagen Sie mir für jedes der folgenden Produkte, inwieweit Sie die Sicherheitshinweise befolgen, wenn Sie diese lesen. Heimwerkerprodukte und Baustoffe (z.b. Farben, Lacke) Complètement Partiellement Pas du tout NSP Fully Partially Not at all Vollständig Teilweise Überhaupt nicht WN % EU 27 BE BG CZ DE EE IE EL ES FR IT CY LV LT LU HU MT NL AT PL PT RO SI SK FI SE UK
155 Special Eurobarometer 360 QC8.2 Et pour chacun des produits suivants, lorsque vous lisez les consignes de sécurité, dans quelle mesure suivezvous ces consignes? Les détergents domestiques (p.ex. lessives, produits de nettoyage) QC8.2 For each of the following products, when you read the safety instructions, to what extent do you follow these instructions? Every day detergents (e.g. washing powder, dish washing detergents) QC8.2 Bitte sagen Sie mir für jedes der folgenden Produkte, inwieweit Sie die Sicherheitshinweise befolgen, wenn Sie diese lesen. Alltägliche Reinigungsmittel (z.b. Waschpulver, Spülmittel) Complètement Partiellement Pas du tout NSP Fully Partially Not at all Vollständig Teilweise Überhaupt nicht WN % EU 27 BE BG CZ DE EE IE EL ES FR IT CY LV LT LU HU MT NL AT PL PT RO SI SK FI SE UK
156 Special Eurobarometer 360 QC8.3 Et pour chacun des produits suivants, lorsque vous lisez les consignes de sécurité, dans quelle mesure suivezvous ces consignes? D autres produits de nettoyage (p.ex. déboucheurs pour canalisation, décapants pour four) QC8.3 For each of the following products, when you read the safety instructions, to what extent do you follow these instructions? Other cleaning products (e.g. drain cleaners, oven cleaners) QC8.3 Bitte sagen Sie mir für jedes der folgenden Produkte, inwieweit Sie die Sicherheitshinweise befolgen, wenn Sie diese lesen. Andere Reinigungsmittel (z.b. Abflussreiniger, Ofenreiniger) Complètement Partiellement Pas du tout NSP Fully Partially Not at all Vollständig Teilweise Überhaupt nicht WN % EU 27 BE BG CZ DE EE IE EL ES FR IT CY LV LT LU HU MT NL AT PL PT RO SI SK FI SE UK
157 Special Eurobarometer 360 QC8.4 Et pour chacun des produits suivants, lorsque vous lisez les consignes de sécurité, dans quelle mesure suivezvous ces consignes? Les produits d entretien automobile (p.ex. lustrants, huiles de vidange, nettoyants pour jantes) QC8.4 For each of the following products, when you read the safety instructions, to what extent do you follow these instructions? Car/ Vehicle care products (e.g. car wax, lubricating oils, wheel cleaners) QC8.4 Bitte sagen Sie mir für jedes der folgenden Produkte, inwieweit Sie die Sicherheitshinweise befolgen, wenn Sie diese lesen. Pflegeprodukte für Autos / Fahrzeuge (z.b. Autopolitur, Motorenöl, Felgenreiniger) Complètement Partiellement Pas du tout NSP Fully Partially Not at all Vollständig Teilweise Überhaupt nicht WN % EU 27 BE BG CZ DE EE IE EL ES FR IT CY LV LT LU HU MT NL AT PL PT RO SI SK FI SE UK
158 Special Eurobarometer 360 QC8.5 Et pour chacun des produits suivants, lorsque vous lisez les consignes de sécurité, dans quelle mesure suivezvous ces consignes? Les produits de jardinage (p.ex. engrais, fertilisants pour plantes) QC8.5 For each of the following products, when you read the safety instructions, to what extent do you follow these instructions? Gardening products (e.g. fertilizers, plant conditioners) QC8.5 Bitte sagen Sie mir für jedes der folgenden Produkte, inwieweit Sie die Sicherheitshinweise befolgen, wenn Sie diese lesen. Produkte für die Gartenarbeit (z.b. Düngemittel) Complètement Partiellement Pas du tout NSP Fully Partially Not at all Vollständig Teilweise Überhaupt nicht WN % EU 27 BE BG CZ DE EE IE EL ES FR IT CY LV LT LU HU MT NL AT PL PT RO SI SK FI SE UK
159 Special Eurobarometer 360 QC8.6 Et pour chacun des produits suivants, lorsque vous lisez les consignes de sécurité, dans quelle mesure suivezvous ces consignes? Les pesticides et les insecticides (p.ex. désherbants, antiparasites) QC8.6 For each of the following products, when you read the safety instructions, to what extent do you follow these instructions? Pesticides and insecticides (e.g. weed killers, vermin and pest control) QC8.6 Bitte sagen Sie mir für jedes der folgenden Produkte, inwieweit Sie die Sicherheitshinweise befolgen, wenn Sie diese lesen. Pestizide und Insektizide (z.b. Unkrautvernichtungsmittel, Schädlingsbekämpfungsmittel) Complètement Partiellement Pas du tout NSP Fully Partially Not at all Vollständig Teilweise Überhaupt nicht WN % EU 27 BE BG CZ DE EE IE EL ES FR IT CY LV LT LU HU MT NL AT PL PT RO SI SK FI SE UK
160 Special Eurobarometer 360 QC9 Imaginez que vous avez deux produits chimiques, avec un mot différent sur leurs étiquetages. L un présente le mot "attention", l autre présente le mot "danger". Selon vous, lequel de ces deux produits est le plus dangereux? QC9 Imagine that you have two chemical products, with a different word on each label. One has the word "warning". The other one the word "danger". In your opinion, which of these two chemical products is the most hazardous? QC9 Stellen Sie sich vor, dass Sie zwei chemische Produkte haben, auf denen sich jeweils ein Etikett mit einem anderen Wort befindet. Auf dem einen steht das Wort "Achtung". Auf dem anderen das Wort "Gefahr". Welches dieser beiden chemischen Produkte ist Ihrer Meinung nach das gefährlichste? % EU 27 BE BG CZ DE EE IE EL ES FR IT CY LV LT LU HU MT NL AT PL PT RO SI SK FI SE UK Le produit présentant le mot "attention" The product with the word "Warning" Das Produkt mit dem Wort "Achtung" Le produit présentant le mot "danger" The product with the word "Danger" Das Produkt mit dem Wort "Gefahr" Pas de différence, les deux produits sont dangereux (SPONTANE) No difference, each product is equally hazardous (SPONTANEOUS) Kein Unterschied, beide Produkte sind gleichermaßen gefährlich (SPONTAN) NSP WN
161 Special Eurobarometer 360 QC10.1 Nous allons maintenant vous montrer différents symboles. Veuillez indiquer, pour chacun de ces symboles, si vous les avez déjà vus ou non auparavant. Symbole A QC10.1 Now we are going to show you different symbols. Please indicate for each symbol whether you have seen it before or not. Symbol A QC10.1 Ich werde Ihnen jetzt verschiedene Symbole zeigen. Bitte sagen Sie mir für jedes Symbol, ob Sie dieses vorher schon einmal gesehen haben oder nicht. Symbol A Oui Non NSP Yes No Ja Nein WN % EU 27 BE BG CZ DE EE IE EL ES FR IT CY LV LT LU HU MT NL AT PL PT RO SI SK FI SE UK
162 Special Eurobarometer 360 QC10.2 Nous allons maintenant vous montrer différents symboles. Veuillez indiquer, pour chacun de ces symboles, si vous les avez déjà vus ou non auparavant. Symbole B QC10.2 Now we are going to show you different symbols. Please indicate for each symbol whether you have seen it before or not. Symbol B QC10.2 Ich werde Ihnen jetzt verschiedene Symbole zeigen. Bitte sagen Sie mir für jedes Symbol, ob Sie dieses vorher schon einmal gesehen haben oder nicht. Symbol B Oui Non NSP Yes No Ja Nein WN % EU 27 BE BG CZ DE EE IE EL ES FR IT CY LV LT LU HU MT NL AT PL PT RO SI SK FI SE UK
163 Special Eurobarometer 360 QC10.3 Nous allons maintenant vous montrer différents symboles. Veuillez indiquer, pour chacun de ces symboles, si vous les avez déjà vus ou non auparavant. Symbole C QC10.3 Now we are going to show you different symbols. Please indicate for each symbol whether you have seen it before or not. Symbol C QC10.3 Ich werde Ihnen jetzt verschiedene Symbole zeigen. Bitte sagen Sie mir für jedes Symbol, ob Sie dieses vorher schon einmal gesehen haben oder nicht. Symbol C Oui Non NSP Yes No Ja Nein WN % EU 27 BE BG CZ DE EE IE EL ES FR IT CY LV LT LU HU MT NL AT PL PT RO SI SK FI SE UK
164 Special Eurobarometer 360 QC10.4 Nous allons maintenant vous montrer différents symboles. Veuillez indiquer, pour chacun de ces symboles, si vous les avez déjà vus ou non auparavant. Symbole D QC10.4 Now we are going to show you different symbols. Please indicate for each symbol whether you have seen it before or not. Symbol D QC10.4 Ich werde Ihnen jetzt verschiedene Symbole zeigen. Bitte sagen Sie mir für jedes Symbol, ob Sie dieses vorher schon einmal gesehen haben oder nicht. Symbol D Oui Non NSP Yes No Ja Nein WN % EU 27 BE BG CZ DE EE IE EL ES FR IT CY LV LT LU HU MT NL AT PL PT RO SI SK FI SE UK
165 Special Eurobarometer 360 QC10.5 Nous allons maintenant vous montrer différents symboles. Veuillez indiquer, pour chacun de ces symboles, si vous les avez déjà vus ou non auparavant. Pictogramme E QC10.5 Now we are going to show you different symbols. Please indicate for each symbol whether you have seen it before or not. Pictogram E QC10.5 Ich werde Ihnen jetzt verschiedene Symbole zeigen. Bitte sagen Sie mir für jedes Symbol, ob Sie dieses vorher schon einmal gesehen haben oder nicht. Piktogramm E Oui Non NSP Yes No Ja Nein WN % EU 27 BE BG CZ DE EE IE EL ES FR IT CY LV LT LU HU MT NL AT PL PT RO SI SK FI SE UK
166 Special Eurobarometer 360 QC10.6 Nous allons maintenant vous montrer différents symboles. Veuillez indiquer, pour chacun de ces symboles, si vous les avez déjà vus ou non auparavant. Pictogramme F QC10.6 Now we are going to show you different symbols. Please indicate for each symbol whether you have seen it before or not. Pictogram F QC10.6 Ich werde Ihnen jetzt verschiedene Symbole zeigen. Bitte sagen Sie mir für jedes Symbol, ob Sie dieses vorher schon einmal gesehen haben oder nicht. Piktogramm F Oui Non NSP Yes No Ja Nein WN % EU 27 BE BG CZ DE EE IE EL ES FR IT CY LV LT LU HU MT NL AT PL PT RO SI SK FI SE UK
167 Special Eurobarometer 360 QC10.7 Nous allons maintenant vous montrer différents symboles. Veuillez indiquer, pour chacun de ces symboles, si vous les avez déjà vus ou non auparavant. Pictogramme G QC10.7 Now we are going to show you different symbols. Please indicate for each symbol whether you have seen it before or not. Pictogram G QC10.7 Ich werde Ihnen jetzt verschiedene Symbole zeigen. Bitte sagen Sie mir für jedes Symbol, ob Sie dieses vorher schon einmal gesehen haben oder nicht. Piktogramm G Oui Non NSP Yes No Ja Nein WN % EU 27 BE BG CZ DE EE IE EL ES FR IT CY LV LT LU HU MT NL AT PL PT RO SI SK FI SE UK
168 Special Eurobarometer 360 QC10.8 Nous allons maintenant vous montrer différents symboles. Veuillez indiquer, pour chacun de ces symboles, si vous les avez déjà vus ou non auparavant. Pictogramme H QC10.8 Now we are going to show you different symbols. Please indicate for each symbol whether you have seen it before or not. Pictogram H QC10.8 Ich werde Ihnen jetzt verschiedene Symbole zeigen. Bitte sagen Sie mir für jedes Symbol, ob Sie dieses vorher schon einmal gesehen haben oder nicht. Piktogramm H Oui Non NSP Yes No Ja Nein WN % EU 27 BE BG CZ DE EE IE EL ES FR IT CY LV LT LU HU MT NL AT PL PT RO SI SK FI SE UK
169 Special Eurobarometer 360 QC11.1 Maintenant, veuillez me dire ce que signifie pour vous chacun de ces quatre symboles. Ce symbole indique que le produit chimique... Symbole A QC11.1 Now, please tell me what do you think each of these four symbols stand for? This symbol stands for a chemical product... Symbol A QC11.1 Sagen Sie mir jetzt bitte, wofür jedes einzelne dieser vier Symbole Ihrer Meinung nach steht. Dieses Symbol steht für ein chemisches Produkt, Symbol A Est inflammable Est corrosif pour le métal Est dangereux pour l environnement That is flammable That is corrosive to metal That is an environmental hazard Das entflammbar ist Das zersetzend auf Metalle wirkt Das eine Gefahr für die Umwelt ist % EU 27 BE BG CZ DE EE IE EL ES FR IT CY LV LT LU HU MT NL AT PL PT RO SI SK FI SE UK
170 Special Eurobarometer 360 QC11.1 Maintenant, veuillez me dire ce que signifie pour vous chacun de ces quatre symboles. Ce symbole indique que le produit chimique... Symbole A QC11.1 Now, please tell me what do you think each of these four symbols stand for? This symbol stands for a chemical product... Symbol A QC11.1 Sagen Sie mir jetzt bitte, wofür jedes einzelne dieser vier Symbole Ihrer Meinung nach steht. Dieses Symbol steht für ein chemisches Produkt, Symbol A Est cancérigène Est irritant pour la peau Provoque de l asthme ou d autres réactions d hypersensibilité respiratoire NSP That is carcinogenic That is a skin irritant That causes asthma or other respiratory hypersensitivity reactions % EU 27 BE BG CZ DE EE IE EL ES FR IT CY LV LT LU HU MT NL AT PL PT RO SI SK FI SE UK Das krebserregend ist Das zu Hautreizungen führt Das Asthma oder eine andere Überempfindlichkeit der Atemwege hervorruft WN
171 Special Eurobarometer 360 QC11.2 Maintenant, veuillez me dire ce que signifie pour vous chacun de ces quatre symboles. Ce symbole indique que le produit chimique... Symbole B QC11.2 Now, please tell me what do you think each of these four symbols stand for? This symbol stands for a chemical product... Symbol B QC11.2 Sagen Sie mir jetzt bitte, wofür jedes einzelne dieser vier Symbole Ihrer Meinung nach steht. Dieses Symbol steht für ein chemisches Produkt, Symbol B Est inflammable Est corrosif pour le métal Est dangereux pour l environnement That is flammable That is corrosive to metal That is an environmental hazard Das entflammbar ist Das zersetzend auf Metalle wirkt Das eine Gefahr für die Umwelt ist % EU 27 BE BG CZ DE EE IE EL ES FR IT CY LV LT LU HU MT NL AT PL PT RO SI SK FI SE UK
172 Special Eurobarometer 360 QC11.2 Maintenant, veuillez me dire ce que signifie pour vous chacun de ces quatre symboles. Ce symbole indique que le produit chimique... Symbole B QC11.2 Now, please tell me what do you think each of these four symbols stand for? This symbol stands for a chemical product... Symbol B QC11.2 Sagen Sie mir jetzt bitte, wofür jedes einzelne dieser vier Symbole Ihrer Meinung nach steht. Dieses Symbol steht für ein chemisches Produkt, Symbol B Est cancérigène Est irritant pour la peau Provoque de l asthme ou d autres réactions d hypersensibilité respiratoire NSP That is carcinogenic That is a skin irritant That causes asthma or other respiratory hypersensitivity reactions % EU 27 BE BG CZ DE EE IE EL ES FR IT CY LV LT LU HU MT NL AT PL PT RO SI SK FI SE UK Das krebserregend ist Das zu Hautreizungen führt Das Asthma oder eine andere Überempfindlichkeit der Atemwege hervorruft WN
173 Special Eurobarometer 360 QC11.3 Maintenant, veuillez me dire ce que signifie pour vous chacun de ces quatre symboles. Ce symbole indique que le produit chimique... Symbole C QC11.3 Now, please tell me what do you think each of these four symbols stand for? This symbol stands for a chemical product... Symbol C QC11.3 Sagen Sie mir jetzt bitte, wofür jedes einzelne dieser vier Symbole Ihrer Meinung nach steht. Dieses Symbol steht für ein chemisches Produkt, Symbol C Est inflammable Est corrosif pour le métal Est dangereux pour l environnement That is flammable That is corrosive to metal That is an environmental hazard Das entflammbar ist Das zersetzend auf Metalle wirkt Das eine Gefahr für die Umwelt ist % EU 27 BE BG CZ DE EE IE EL ES FR IT CY LV LT LU HU MT NL AT PL PT RO SI SK FI SE UK
174 Special Eurobarometer 360 QC11.3 Maintenant, veuillez me dire ce que signifie pour vous chacun de ces quatre symboles. Ce symbole indique que le produit chimique... Symbole C QC11.3 Now, please tell me what do you think each of these four symbols stand for? This symbol stands for a chemical product... Symbol C QC11.3 Sagen Sie mir jetzt bitte, wofür jedes einzelne dieser vier Symbole Ihrer Meinung nach steht. Dieses Symbol steht für ein chemisches Produkt, Symbol C Est cancérigène Est irritant pour la peau Provoque de l asthme ou d autres réactions d hypersensibilité respiratoire NSP That is carcinogenic That is a skin irritant That causes asthma or other respiratory hypersensitivity reactions % EU 27 BE BG CZ DE EE IE EL ES FR IT CY LV LT LU HU MT NL AT PL PT RO SI SK FI SE UK Das krebserregend ist Das zu Hautreizungen führt Das Asthma oder eine andere Überempfindlichkeit der Atemwege hervorruft WN
175 Special Eurobarometer 360 QC11.4 Maintenant, veuillez me dire ce que signifie pour vous chacun de ces quatre symboles. Ce symbole indique que le produit chimique... Symbole D QC11.4 Now, please tell me what do you think each of these four symbols stand for? This symbol stands for a chemical product... Symbol D QC11.4 Sagen Sie mir jetzt bitte, wofür jedes einzelne dieser vier Symbole Ihrer Meinung nach steht. Dieses Symbol steht für ein chemisches Produkt, Symbol D Est inflammable Est corrosif pour le métal Est dangereux pour l environnement That is flammable That is corrosive to metal That is an environmental hazard Das entflammbar ist Das zersetzend auf Metalle wirkt Das eine Gefahr für die Umwelt ist % EU 27 BE BG CZ DE EE IE EL ES FR IT CY LV LT LU HU MT NL AT PL PT RO SI SK FI SE UK
176 Special Eurobarometer 360 QC11.4 Maintenant, veuillez me dire ce que signifie pour vous chacun de ces quatre symboles. Ce symbole indique que le produit chimique... Symbole D QC11.4 Now, please tell me what do you think each of these four symbols stand for? This symbol stands for a chemical product... Symbol D QC11.4 Sagen Sie mir jetzt bitte, wofür jedes einzelne dieser vier Symbole Ihrer Meinung nach steht. Dieses Symbol steht für ein chemisches Produkt, Symbol D Est cancérigène Est irritant pour la peau Provoque de l asthme ou d autres réactions d hypersensibilité respiratoire NSP That is carcinogenic That is a skin irritant That causes asthma or other respiratory hypersensitivity reactions % EU 27 BE BG CZ DE EE IE EL ES FR IT CY LV LT LU HU MT NL AT PL PT RO SI SK FI SE UK Das krebserregend ist Das zu Hautreizungen führt Das Asthma oder eine andere Überempfindlichkeit der Atemwege hervorruft WN
177 Special Eurobarometer 360 QC12.1 De façon générale, dans quelle mesure estimez-vous être informé(e) des risques potentiels liés aux produits chimiques suivants? Veuillez utiliser l échelle de 1 à 7, '1' signifiant que vous n êtes "pas du tout informé(e)", et '7' que vous êtes "très bien informé(e)". Les produits de bricolage et de construction (p.ex. peintures, laques) QC12.1 On the whole, how well-informed do you feel about the potential risks posed by the following chemical products? Please use a scale from 1 to 7, where '1' means that you are "not at all informed", and '7' means you are "very well informed". DIY (Do It Yourself) products and building materials (e.g. paints, varnish) QC12.1 Wie gut fühlen Sie sich insgesamt gesehen über die möglichen Gefahren informiert, die von den folgenden chemischen Produkten ausgehen. Bitte verwenden Sie eine Skala von 1 bis 7, auf der '1' bedeutet, dass Sie "überhaupt nicht informiert" sind und '7', dass Sie "sehr gut informiert" sind. Heimwerkerprodukte und Baustoffe (z.b. Farben, Lacke) 1 Pas du tout informé(e) Très bien informé(e) % EU 27 BE BG CZ DE EE IE EL ES FR IT CY LV LT LU HU MT 1 Not at all informed 1 Überhaupt nicht informiert NL AT PL PT RO SI SK FI SE UK Very well informed 7 Sehr gut informiert
178 Special Eurobarometer 360 QC12.1 De façon générale, dans quelle mesure estimez-vous être informé(e) des risques potentiels liés aux produits chimiques suivants? Veuillez utiliser l échelle de 1 à 7, '1' signifiant que vous n êtes "pas du tout informé(e)", et '7' que vous êtes "très bien informé(e)". Les produits de bricolage et de construction (p.ex. peintures, laques) QC12.1 On the whole, how well-informed do you feel about the potential risks posed by the following chemical products? Please use a scale from 1 to 7, where '1' means that you are "not at all informed", and '7' means you are "very well informed". DIY (Do It Yourself) products and building materials (e.g. paints, varnish) QC12.1 Wie gut fühlen Sie sich insgesamt gesehen über die möglichen Gefahren informiert, die von den folgenden chemischen Produkten ausgehen. Bitte verwenden Sie eine Skala von 1 bis 7, auf der '1' bedeutet, dass Sie "überhaupt nicht informiert" sind und '7', dass Sie "sehr gut informiert" sind. Heimwerkerprodukte und Baustoffe (z.b. Farben, Lacke) Total 'Pas informé(e)' Total 'Moyennement informé(e)' Total 'Informé(e)' % EU 27 BE BG CZ DE EE IE EL ES FR IT CY LV LT LU HU MT NL AT PL PT RO SI SK FI SE UK Total 'Not informed' Gesamt 'Nicht informiert' Total 'Of average informed' Gesamt 'Durchschnittlich informiert' Total 'Informed' Gesamt 'Informiert'
179 Special Eurobarometer 360 QC12.2 De façon générale, dans quelle mesure estimez-vous être informé(e) des risques potentiels liés aux produits chimiques suivants? Veuillez utiliser l échelle de 1 à 7, '1' signifiant que vous n êtes "pas du tout informé(e)", et '7' que vous êtes "très bien informé(e)". Les détergents domestiques (p.ex. lessives, produits de nettoyage) QC12.2 On the whole, how well-informed do you feel about the potential risks posed by the following chemical products? Please use a scale from 1 to 7, where '1' means that you are "not at all informed", and '7' means you are "very well informed". Every day detergents (e.g. washing powder, dish washing detergents) QC12.2 Wie gut fühlen Sie sich insgesamt gesehen über die möglichen Gefahren informiert, die von den folgenden chemischen Produkten ausgehen. Bitte verwenden Sie eine Skala von 1 bis 7, auf der '1' bedeutet, dass Sie "überhaupt nicht informiert" sind und '7', dass Sie "sehr gut informiert" sind. Alltägliche Reinigungsmittel (z.b. Waschpulver, Spülmittel) 1 Pas du tout informé(e) Très bien informé(e) % EU 27 BE BG CZ DE EE IE EL ES FR IT CY LV LT LU HU MT 1 Not at all informed 1 Überhaupt nicht informiert NL AT PL PT RO SI SK FI SE UK Very well informed 7 Sehr gut informiert
180 Special Eurobarometer 360 QC12.2 De façon générale, dans quelle mesure estimez-vous être informé(e) des risques potentiels liés aux produits chimiques suivants? Veuillez utiliser l échelle de 1 à 7, '1' signifiant que vous n êtes "pas du tout informé(e)", et '7' que vous êtes "très bien informé(e)". Les détergents domestiques (p.ex. lessives, produits de nettoyage) QC12.2 On the whole, how well-informed do you feel about the potential risks posed by the following chemical products? Please use a scale from 1 to 7, where '1' means that you are "not at all informed", and '7' means you are "very well informed". Every day detergents (e.g. washing powder, dish washing detergents) QC12.2 Wie gut fühlen Sie sich insgesamt gesehen über die möglichen Gefahren informiert, die von den folgenden chemischen Produkten ausgehen. Bitte verwenden Sie eine Skala von 1 bis 7, auf der '1' bedeutet, dass Sie "überhaupt nicht informiert" sind und '7', dass Sie "sehr gut informiert" sind. Alltägliche Reinigungsmittel (z.b. Waschpulver, Spülmittel) Total 'Pas informé(e)' Total 'Moyennement informé(e)' Total 'Informé(e)' % EU 27 BE BG CZ DE EE IE EL ES FR IT CY LV LT LU HU MT NL AT PL PT RO SI SK FI SE UK Total 'Not informed' Gesamt 'Nicht informiert' Total 'Of average informed' Gesamt 'Durchschnittlich informiert' Total 'Informed' Gesamt 'Informiert'
181 Special Eurobarometer 360 QC12.3 De façon générale, dans quelle mesure estimez-vous être informé(e) des risques potentiels liés aux produits chimiques suivants? Veuillez utiliser l échelle de 1 à 7, '1' signifiant que vous n êtes "pas du tout informé(e)", et '7' que vous êtes "très bien informé(e)". D autres produits de nettoyage (p.ex. déboucheurs pour canalisation, décapants pour four) QC12.3 On the whole, how well-informed do you feel about the potential risks posed by the following chemical products? Please use a scale from 1 to 7, where '1' means that you are "not at all informed", and '7' means you are "very well informed". Other cleaning products (e.g. drain cleaners, oven cleaners) QC12.3 Wie gut fühlen Sie sich insgesamt gesehen über die möglichen Gefahren informiert, die von den folgenden chemischen Produkten ausgehen. Bitte verwenden Sie eine Skala von 1 bis 7, auf der '1' bedeutet, dass Sie "überhaupt nicht informiert" sind und '7', dass Sie "sehr gut informiert" sind. Andere Reinigungsmittel (z.b. Abflussreiniger, Ofenreiniger) % EU 27 BE BG CZ DE EE IE EL ES FR IT CY LV LT LU HU MT 1 Pas du tout informé(e) 1 Not at all informed 1 Überhaupt nicht NL AT PL PT RO SI SK FI SE UK Très bien informé(e) 7 Very well informed 7 Sehr gut informiert
182 Special Eurobarometer 360 QC12.3 De façon générale, dans quelle mesure estimez-vous être informé(e) des risques potentiels liés aux produits chimiques suivants? Veuillez utiliser l échelle de 1 à 7, '1' signifiant que vous n êtes "pas du tout informé(e)", et '7' que vous êtes "très bien informé(e)". D autres produits de nettoyage (p.ex. déboucheurs pour canalisation, décapants pour four) QC12.3 On the whole, how well-informed do you feel about the potential risks posed by the following chemical products? Please use a scale from 1 to 7, where '1' means that you are "not at all informed", and '7' means you are "very well informed". Other cleaning products (e.g. drain cleaners, oven cleaners) QC12.3 Wie gut fühlen Sie sich insgesamt gesehen über die möglichen Gefahren informiert, die von den folgenden chemischen Produkten ausgehen. Bitte verwenden Sie eine Skala von 1 bis 7, auf der '1' bedeutet, dass Sie "überhaupt nicht informiert" sind und '7', dass Sie "sehr gut informiert" sind. Andere Reinigungsmittel (z.b. Abflussreiniger, Ofenreiniger) Total 'Pas informé(e)' Total 'Moyennement informé(e)' Total 'Informé(e)' % EU 27 BE BG CZ DE EE IE EL ES FR IT CY LV LT LU HU MT Total 'Not informed' Gesamt 'Nicht informiert' Total 'Of average informed' Gesamt 'Durchschnittlich informiert' Total 'Informed' Gesamt 'Informiert' NL AT PL PT RO SI SK FI SE UK
183 Special Eurobarometer 360 QC12.4 De façon générale, dans quelle mesure estimez-vous être informé(e) des risques potentiels liés aux produits chimiques suivants? Veuillez utiliser l échelle de 1 à 7, '1' signifiant que vous n êtes "pas du tout informé(e)", et '7' que vous êtes "très bien informé(e)". Les produits d entretien automobile (p.ex. lustrants, huiles de vidange, nettoyants pour jantes) QC12.4 On the whole, how well-informed do you feel about the potential risks posed by the following chemical products? Please use a scale from 1 to 7, where '1' means that you are "not at all informed", and '7' means you are "very well informed". Car/ Vehicle care products (e.g. car wax, lubricating oils, wheel cleaners) QC12.4 Wie gut fühlen Sie sich insgesamt gesehen über die möglichen Gefahren informiert, die von den folgenden chemischen Produkten ausgehen. Bitte verwenden Sie eine Skala von 1 bis 7, auf der '1' bedeutet, dass Sie "überhaupt nicht informiert" sind und '7', dass Sie "sehr gut informiert" sind. Pflegeprodukte für Autos/ Fahrzeuge (z.b. Autopolitur, Motorenöl, Felgenreiniger) % EU 27 BE BG CZ DE EE IE EL ES FR IT CY LV LT LU HU MT 1 Pas du tout informé(e) 1 Not at all informed 1 Überhaupt nicht NL AT PL PT RO SI SK FI SE UK Très bien informé(e) 7 Very well informed 7 Sehr gut informiert
184 Special Eurobarometer 360 QC12.4 De façon générale, dans quelle mesure estimez-vous être informé(e) des risques potentiels liés aux produits chimiques suivants? Veuillez utiliser l échelle de 1 à 7, '1' signifiant que vous n êtes "pas du tout informé(e)", et '7' que vous êtes "très bien informé(e)". Les produits d entretien automobile (p.ex. lustrants, huiles de vidange, nettoyants pour jantes) QC12.4 On the whole, how well-informed do you feel about the potential risks posed by the following chemical products? Please use a scale from 1 to 7, where '1' means that you are "not at all informed", and '7' means you are "very well informed". Car/ Vehicle care products (e.g. car wax, lubricating oils, wheel cleaners) QC12.4 Wie gut fühlen Sie sich insgesamt gesehen über die möglichen Gefahren informiert, die von den folgenden chemischen Produkten ausgehen. Bitte verwenden Sie eine Skala von 1 bis 7, auf der '1' bedeutet, dass Sie "überhaupt nicht informiert" sind und '7', dass Sie "sehr gut informiert" sind. Pflegeprodukte für Autos/ Fahrzeuge (z.b. Autopolitur, Motorenöl, Felgenreiniger) Total 'Pas informé(e)' Total 'Moyennement informé(e)' Total 'Informé(e)' % EU 27 BE BG CZ DE EE IE EL ES FR IT CY LV LT LU HU MT Total 'Not informed' Gesamt 'Nicht informiert' Total 'Of average informed' Gesamt 'Durchschnittlich informiert' Total 'Informed' Gesamt 'Informiert' NL AT PL PT RO SI SK FI SE UK
185 Special Eurobarometer 360 QC12.5 De façon générale, dans quelle mesure estimez-vous être informé(e) des risques potentiels liés aux produits chimiques suivants? Veuillez utiliser l échelle de 1 à 7, '1' signifiant que vous n êtes "pas du tout informé(e)", et '7' que vous êtes "très bien informé(e)". Les produits de jardinage (p.ex. engrais, fertilisants pour plantes) QC12.5 On the whole, how well-informed do you feel about the potential risks posed by the following chemical products? Please use a scale from 1 to 7, where '1' means that you are "not at all informed", and '7' means you are "very well informed". Gardening products (e.g. fertilizers, plant conditioners) QC12.5 Wie gut fühlen Sie sich insgesamt gesehen über die möglichen Gefahren informiert, die von den folgenden chemischen Produkten ausgehen. Bitte verwenden Sie eine Skala von 1 bis 7, auf der '1' bedeutet, dass Sie "überhaupt nicht informiert" sind und '7', dass Sie "sehr gut informiert" sind. Produkte für die Gartenarbeit (z.b. Düngemittel) % EU 27 BE BG CZ DE EE IE EL ES FR IT CY LV LT LU HU MT 1 Pas du tout informé(e) 1 Not at all informed 1 Überhaupt nicht NL AT PL PT RO SI SK FI SE UK Très bien informé(e) 7 Very well informed 7 Sehr gut informiert
186 Special Eurobarometer 360 QC12.5 De façon générale, dans quelle mesure estimez-vous être informé(e) des risques potentiels liés aux produits chimiques suivants? Veuillez utiliser l échelle de 1 à 7, '1' signifiant que vous n êtes "pas du tout informé(e)", et '7' que vous êtes "très bien informé(e)". Les produits de jardinage (p.ex. engrais, fertilisants pour plantes) QC12.5 On the whole, how well-informed do you feel about the potential risks posed by the following chemical products? Please use a scale from 1 to 7, where '1' means that you are "not at all informed", and '7' means you are "very well informed". Gardening products (e.g. fertilizers, plant conditioners) QC12.5 Wie gut fühlen Sie sich insgesamt gesehen über die möglichen Gefahren informiert, die von den folgenden chemischen Produkten ausgehen. Bitte verwenden Sie eine Skala von 1 bis 7, auf der '1' bedeutet, dass Sie "überhaupt nicht informiert" sind und '7', dass Sie "sehr gut informiert" sind. Produkte für die Gartenarbeit (z.b. Düngemittel) Total 'Pas informé(e)' Total 'Moyennement informé(e)' Total 'Informé(e)' % EU 27 BE BG CZ DE EE IE EL ES FR IT CY LV LT LU HU MT Total 'Not informed' Gesamt 'Nicht informiert' Total 'Of average informed' Gesamt 'Durchschnittlich informiert' Total 'Informed' Gesamt 'Informiert' NL AT PL PT RO SI SK FI SE UK
187 Special Eurobarometer 360 QC12.6 De façon générale, dans quelle mesure estimez-vous être informé(e) des risques potentiels liés aux produits chimiques suivants? Veuillez utiliser l échelle de 1 à 7, '1' signifiant que vous n êtes "pas du tout informé(e)", et '7' que vous êtes "très bien informé(e)". Les pesticides et les insecticides (p.ex. désherbants, antiparasites) QC12.6 On the whole, how well-informed do you feel about the potential risks posed by the following chemical products? Please use a scale from 1 to 7, where '1' means that you are "not at all informed", and '7' means you are "very well informed". Pesticides and insecticides (e.g. weed killers, vermin and pest control) QC12.6 Wie gut fühlen Sie sich insgesamt gesehen über die möglichen Gefahren informiert, die von den folgenden chemischen Produkten ausgehen. Bitte verwenden Sie eine Skala von 1 bis 7, auf der '1' bedeutet, dass Sie "überhaupt nicht informiert" sind und '7', dass Sie "sehr gut informiert" sind. Pestizide und Insektizide (z.b. Unkrautvernichtungsmittel, Schädlingsbekämpfungsmittel) % EU 27 BE BG CZ DE EE IE EL ES FR IT CY LV LT LU HU MT 1 Pas du tout informé(e) 1 Not at all informed 1 Überhaupt nicht NL AT PL PT RO SI SK FI SE UK Très bien informé(e) 7 Very well informed 7 Sehr gut informiert
188 Special Eurobarometer 360 QC12.6 De façon générale, dans quelle mesure estimez-vous être informé(e) des risques potentiels liés aux produits chimiques suivants? Veuillez utiliser l échelle de 1 à 7, '1' signifiant que vous n êtes "pas du tout informé(e)", et '7' que vous êtes "très bien informé(e)". Les pesticides et les insecticides (p.ex. désherbants, antiparasites) QC12.6 On the whole, how well-informed do you feel about the potential risks posed by the following chemical products? Please use a scale from 1 to 7, where '1' means that you are "not at all informed", and '7' means you are "very well informed". Pesticides and insecticides (e.g. weed killers, vermin and pest control) QC12.6 Wie gut fühlen Sie sich insgesamt gesehen über die möglichen Gefahren informiert, die von den folgenden chemischen Produkten ausgehen. Bitte verwenden Sie eine Skala von 1 bis 7, auf der '1' bedeutet, dass Sie "überhaupt nicht informiert" sind und '7', dass Sie "sehr gut informiert" sind. Pestizide und Insektizide (z.b. Unkrautvernichtungsmittel, Schädlingsbekämpfungsmittel) Total 'Pas informé(e)' Total 'Moyennement informé(e)' Total 'Informé(e)' % EU 27 BE BG CZ DE EE IE EL ES FR IT CY LV LT LU HU MT Total 'Not informed' Gesamt 'Nicht informiert' Total 'Of average informed' Gesamt 'Durchschnittlich informiert' Total 'Informed' Gesamt 'Informiert' NL AT PL PT RO SI SK FI SE UK
189 Special Eurobarometer 360 QC13 Où trouvez-vous en général des informations sur les dangers potentiels des produits chimiques? (ROTATION PLUSIEURS REPONSES POSSIBLES) QC13 Where do you generally find information about the potential dangers of chemical products? (ROTATE MULTIPLE ANSWERS POSSIBLE) QC13 Wo finden Sie in der Regel Informationen über die möglichen Gefahren chemischer Produkte? (ROTIEREN - MEHRFACHNENNUNGEN MÖGLICH) Les emballages des produits Les journaux Les magazines La télévision Product packaging Newspapers Magazines TV % EU 27 BE BG CZ DE EE IE EL ES FR IT CY LV LT LU HU MT NL AT PL PT RO SI SK FI SE UK Verpackung des Produkts Zeitungen Zeitschriften Fernsehen
190 Special Eurobarometer 360 QC13 Où trouvez-vous en général des informations sur les dangers potentiels des produits chimiques? (ROTATION PLUSIEURS REPONSES POSSIBLES) QC13 Where do you generally find information about the potential dangers of chemical products? (ROTATE MULTIPLE ANSWERS POSSIBLE) QC13 Wo finden Sie in der Regel Informationen über die möglichen Gefahren chemischer Produkte? (ROTIEREN - MEHRFACHNENNUNGEN MÖGLICH) % EU 27 BE BG CZ DE EE IE EL ES FR IT CY LV LT LU HU MT Radio Radio Radio Les brochures d information/ dépliants Information leaflets/ brochures Informationsblätt er/ -broschüren Internet Internet Internet Le bouche-àoreille Word of mouth Hörensagen NL AT PL PT RO SI SK FI SE UK
191 Special Eurobarometer 360 QC13 Où trouvez-vous en général des informations sur les dangers potentiels des produits chimiques? (ROTATION PLUSIEURS REPONSES POSSIBLES) QC13 Where do you generally find information about the potential dangers of chemical products? (ROTATE MULTIPLE ANSWERS POSSIBLE) QC13 Wo finden Sie in der Regel Informationen über die möglichen Gefahren chemischer Produkte? (ROTIEREN - MEHRFACHNENNUNGEN MÖGLICH) La famille, les amis ou les connaissances Family, friends or relatives Autre (SPONTANE) Other (SPONTANEOUS) Aucun (SPONTANE) None (SPONTANEOUS) NSP Familie, Freunde oder Verwandte Andere (SPONTAN) Nichts davon (SPONTAN) WN % EU 27 BE BG CZ DE EE IE EL ES FR IT CY LV LT LU HU MT NL AT PL PT RO SI SK FI SE UK
192 Special Eurobarometer 360 QC14 Parmi les sources suivantes, quelles sont celles auxquelles vous feriez le plus confiance pour des informations au sujet des dangers potentiels des produits chimiques? (ROTATION MAX. 4 REPONSES) QC14 Which of the following sources would you trust the most for information about the potential dangers of chemical products? (ROTATE MAX. 4 ANSWERS) QC14 Welchen der folgenden Quellen würden Sie bei Informationen über die möglichen Gefahren chemischer Produkte am meisten vertrauen? (ROTIEREN - MAX. 4 NENNUNGEN) Les vendeurs dans un magasin Les organisations non gouvernementales (ONG)/ Les organisations de protection des consommateurs Les fabricants des produits Les centres antipoison Sales person in a shop Non-Governmental Organisations (NGO)/ Consumer protection organisations Product manufacturers Poison centres Verkäufer in einem Geschäft Nichtregierungsorganisationen (NRO)/ Verbraucherschutzorga nisationen Produktherstellern Giftzentralen % EU 27 BE BG CZ DE EE IE EL ES FR IT CY LV LT LU HU MT NL AT PL PT RO SI SK FI SE UK
193 Special Eurobarometer 360 QC14 Parmi les sources suivantes, quelles sont celles auxquelles vous feriez le plus confiance pour des informations au sujet des dangers potentiels des produits chimiques? (ROTATION MAX. 4 REPONSES) QC14 Which of the following sources would you trust the most for information about the potential dangers of chemical products? (ROTATE MAX. 4 ANSWERS) QC14 Welchen der folgenden Quellen würden Sie bei Informationen über die möglichen Gefahren chemischer Produkte am meisten vertrauen? (ROTIEREN - MAX. 4 NENNUNGEN) La famille, les amis ou les connaissances Les médecins Les pharmaciens Les journalistes Family, friends or relatives Doctors Pharmacists Journalists Familie, Freunden oder Verwandten Ärzten Apothekern Journalisten % EU 27 BE BG CZ DE EE IE EL ES FR IT CY LV LT LU HU MT NL AT PL PT RO SI SK FI SE UK
194 Special Eurobarometer 360 QC14 Parmi les sources suivantes, quelles sont celles auxquelles vous feriez le plus confiance pour des informations au sujet des dangers potentiels des produits chimiques? (ROTATION MAX. 4 REPONSES) QC14 Which of the following sources would you trust the most for information about the potential dangers of chemical products? (ROTATE MAX. 4 ANSWERS) QC14 Welchen der folgenden Quellen würden Sie bei Informationen über die möglichen Gefahren chemischer Produkte am meisten vertrauen? (ROTIEREN - MAX. 4 NENNUNGEN) Les scientifiques/ les chercheurs Les autorités sanitaires nationales L UE et ses institutions (en l'occurence l agence européenne des produits chimiques ECHA) Le Gouvernement (NATIONALITE) Scientists/ researchers National Health Authorities The EU and its institutions (for instance, the European Chemicals Agency ECHA) (NATIONALITY) Government Wissenschaftlern/ Forschern Nationalen Gesundheitsbehörden Der EU und ihren Institutionen (z.b. der Europäischen Chemikalienagentur ECHA) Der (NATIONALEN) Regierung % EU 27 BE BG CZ DE EE IE EL ES FR IT CY LV LT LU HU MT NL AT PL PT RO SI SK FI SE UK
 QC14 Which of the following sources would you trust the most for information about the potential dangers of chemical products? (ROTATE MAX.")
195 Special Eurobarometer 360 QC14 Parmi les sources suivantes, quelles sont celles auxquelles vous feriez le plus confiance pour des informations au sujet des dangers potentiels des produits chimiques? (ROTATION MAX. 4 REPONSES) QC14 Which of the following sources would you trust the most for information about the potential dangers of chemical products? (ROTATE MAX. 4 ANSWERS) QC14 Welchen der folgenden Quellen würden Sie bei Informationen über die möglichen Gefahren chemischer Produkte am meisten vertrauen? (ROTIEREN - MAX. 4 NENNUNGEN) Autre (SPONTANE) Aucun (SPONTANE) NSP Other (SPONTANEOUS) None (SPONTANEOUS) Andere (SPONTAN) Nichts davon (SPONTAN) WN % EU 27 BE BG CZ DE EE IE EL ES FR IT CY LV LT LU HU MT NL AT PL PT RO SI SK FI SE UK
Special Eurobarometer 464b. Report
 Europeans attitudes towards security Survey requested by the European Commission, Directorate-General for Migration and Home Affairs and co-ordinated by the Directorate-General for Communication This document
Special Eurobarometer 469. Report
 Integration of immigrants in the European Union Survey requested by the European Commission, Directorate-General for Migration and Home Affairs and co-ordinated by the Directorate-General for Communication
Special Eurobarometer 461. Report. Designing Europe s future:
 Designing Europe s future: Trust in institutions Globalisation Support for the euro, opinions about free trade and solidarity Fieldwork Survey requested by the European Commission, Directorate-General
INTERNAL SECURITY. Publication: November 2011
 Special Eurobarometer 371 European Commission INTERNAL SECURITY REPORT Special Eurobarometer 371 / Wave TNS opinion & social Fieldwork: June 2011 Publication: November 2011 This survey has been requested
Special Eurobarometer 440. Report. Europeans, Agriculture and the CAP
 Survey requested by the European Commission, Directorate-General for Agriculture and Rural Development and co-ordinated by the Directorate-General for Communication This document does not represent the
Special Eurobarometer 455
 EU Citizens views on development, cooperation and November December 2016 Survey conducted by TNS opinion & social at the request of the European Commission, Directorate-General for International Cooperation
EU DEVELOPMENT AID AND THE MILLENNIUM DEVELOPMENT GOALS
 Special Eurobarometer 405 EU DEVELOPMENT AID AND THE MILLENNIUM DEVELOPMENT GOALS REPORT Fieldwork: May - June 2013 Publication: November 2013 This survey has been requested by the European Commission,
Special Eurobarometer 467. Report. Future of Europe. Social issues
 Future of Europe Social issues Fieldwork Publication November 2017 Survey requested by the European Commission, Directorate-General for Communication and co-ordinated by the Directorate- General for Communication
PUBLIC PERCEPTIONS OF SCIENCE, RESEARCH AND INNOVATION
 Special Eurobarometer 419 PUBLIC PERCEPTIONS OF SCIENCE, RESEARCH AND INNOVATION SUMMARY Fieldwork: June 2014 Publication: October 2014 This survey has been requested by the European Commission, Directorate-General
EUROPEANS ATTITUDES TOWARDS SECURITY
 Special Eurobarometer 432 EUROPEANS ATTITUDES TOWARDS SECURITY REPORT Fieldwork: March 2015 Publication: April 2015 This survey has been requested by the European Commission, Directorate-General for Migration
The European Emergency Number 112. Analytical report
 Flash Eurobarometer 314 The Gallup Organization Gallup 2 Flash Eurobarometer N o 189a EU communication and the citizens Flash Eurobarometer European Commission The European Emergency Number 112 Analytical
The European emergency number 112
 Flash Eurobarometer The European emergency number 112 REPORT Fieldwork: December 2011 Publication: February 2012 Flash Eurobarometer TNS political & social This survey has been requested by the Directorate-General
Flash Eurobarometer 431. Report. Electoral Rights
 Electoral Rights Survey requested by the European Commission, Directorate-General for Justice and Consumers and co-ordinated by the Directorate-General for Communication This document does not represent
EUROPEAN UNION CITIZENSHIP
 Flash Eurobarometer EUROPEAN UNION CITIZENSHIP REPORT Fieldwork: November 2012 Publication: February 2013 This survey has been requested by the European Commission, Directorate-General Justice and co-ordinated
The Rights of the Child. Analytical report
 Flash Eurobarometer 273 The Gallup Organisation Analytical Report Flash EB N o 251 Public attitudes and perceptions in the euro area Flash Eurobarometer European Commission The Rights of the Child Analytical
Flash Eurobarometer 430. Summary. European Union Citizenship
 European Union Citizenship Survey requested by the European Commission, Directorate-General for Justice and Consumers and co-ordinated by the Directorate-General for Communication This document does not
Flash Eurobarometer 364 ELECTORAL RIGHTS REPORT
 Flash Eurobarometer ELECTORAL RIGHTS REPORT Fieldwork: November 2012 Publication: March 2013 This survey has been requested by the European Commission, Directorate-General Justice and co-ordinated by Directorate-General
The. Special Eurobarometer 368. Special Eurobarometer 368 / Wave EB 75.3 TNS opinion & social. This document. of the authors.
 Special Eurobarometer 368 European Commission The Common Agricultural Policy REPORT Special Eurobarometer 368 / Wave TNS opinion & social Fieldwork: May 2011 Publication: September 2011 This survey has
Special Eurobarometer 471. Summary
 Fairness, inequality and intergenerational mobility Survey requested by the European Commission, Joint Research Centre and co-ordinated by the Directorate-General for Communication This document does not
CITIZENS AWARENESS AND PERCEPTIONS OF EU REGIONAL POLICY
 Flash Eurobarometer CITIZENS AWARENESS AND PERCEPTIONS OF EU REGIONAL POLICY REPORT Fieldwork: June 2015 Publication: September 2015 This survey has been requested by the European Commission, Directorate-General
Flash Eurobarometer 430. Report. European Union Citizenship
 European Union Citizenship Survey requested by the European Commission, Directorate-General for Justice and Consumers and co-ordinated by the Directorate-General for Communication This document does not
Standard Eurobarometer 89 Spring Report. European citizenship
 European citizenship Fieldwork March 2018 Survey requested and co-ordinated by the European Commission, Directorate-General for Communication This document does not represent the point of view of the European
Flash Eurobarometer 431. Summary. Electoral Rights
 Survey requested by the European Commission, Directorate-General for Justice and Consumers and co-ordinated by the Directorate-General for Communication This document does not represent the point of view
The Rights of the Child. Analytical report
 The Gallup Organization Flash EB N o 187 2006 Innobarometer on Clusters Flash Eurobarometer European Commission The Rights of the Child Analytical report Fieldwork: February 2008 Report: April 2008 Flash
Special Eurobarometer 428 GENDER EQUALITY SUMMARY
 Special Eurobarometer 428 GENDER EQUALITY SUMMARY Fieldwork: November-December 2014 Publication: March 2015 This survey has been requested by the European Commission, Directorate-General for Justice and
Women in the EU. Fieldwork : February-March 2011 Publication: June Special Eurobarometer / Wave 75.1 TNS Opinion & Social EUROPEAN PARLIAMENT
 EUROPEAN PARLIAMENT Women in the EU Eurobaromètre Spécial / Vague 74.3 TNS Opinion & Social Fieldwork : February-March 2011 Publication: June 2011 Special Eurobarometer / Wave 75.1 TNS Opinion & Social
EUROPEAN CITIZENSHIP
 Standard Eurobarometer 78 Autumn 2012 EUROPEAN CITIZENSHIP REPORT Fieldwork: November 2012 This survey has been requested and co-ordinated by the European Commission, Directorate-General for Communication.
EUROPEAN YOUTH: PARTICIPATION IN DEMOCRATIC LIFE
 Flash Eurobarometer 375 EUROPEAN YOUTH: PARTICIPATION IN DEMOCRATIC LIFE SUMMARY Fieldwork: April 2013 Publication: May 2013 This survey has been requested by the European Commission, Directorate-General
Special Eurobarometer 474. Summary. Europeans perceptions of the Schengen Area
 Summary Europeans perceptions of the Schengen Area Survey requested by the European Commission, Directorate-General for Migration and Home Affairs and co-ordinated by the Directorate-General for Communication
Standard Eurobarometer 89 Spring Report. Europeans and the future of Europe
 Fieldwork March 2018 Survey requested and co-ordinated by the European Commission, Directorate-General for Communication This document does not represent the point of view of the European Commission. The
Young people and science. Analytical report
 Flash Eurobarometer 239 The Gallup Organization The Gallup Organization Flash EB N o 187 2006 Innobarometer on Clusters Flash Eurobarometer European Commission Young people and science Analytical report
Data Protection in the European Union. Data controllers perceptions. Analytical Report
 Gallup Flash Eurobarometer N o 189a EU communication and the citizens Flash Eurobarometer European Commission Data Protection in the European Union Data controllers perceptions Analytical Report Fieldwork:
Views on European Union Enlargement
 Flash Eurobarometer 257 The Gallup Organization Flash EB N o 255 Dual circulation period, Slovakia Flash Eurobarometer European Commission Views on European Union Enlargement Analytical Report Fieldwork:
September 2012 Euro area unemployment rate at 11.6% EU27 at 10.6%
 STAT/12/155 31 October 2012 September 2012 Euro area unemployment rate at 11.6% at.6% The euro area 1 (EA17) seasonally-adjusted 2 unemployment rate 3 was 11.6% in September 2012, up from 11.5% in August
EUROBAROMETER 72 PUBLIC OPINION IN THE EUROPEAN UNION. Autumn The survey was requested and coordinated by Directorate-General Communication
 Standard Eurobarometer EUROBAROMETER 72 PUBLIC OPINION IN THE EUROPEAN UNION Autumn 2009 NATIONAL REPO Standard Eurobarometer 72 / Autumn 2009 TNS Opinion & Social UNITED KINGDOM The survey was requested
WOMEN IN DECISION-MAKING POSITIONS
 Special Eurobarometer 376 WOMEN IN DECISION-MAKING POSITIONS SUMMARY Fieldwork: September 2011 Publication: March 2012 This survey has been requested by Directorate-General Justice and co-ordinated by
Fieldwork: November December 2010 Publication: June
 Special Eurobarometer European Commission SPECIAL EUROBAROMETER 359 Attitudes on Data Protection and Electronic Identity in the European Union REPORT Fieldwork: November December 2010 Publication: June
Special Eurobarometer 470. Summary. Corruption
 Corruption Survey requested by the European Commission, Directorate-General for Migration and Home Affairs and co-ordinated by the Directorate-General for Communication This document does not represent
PATIENTS RIGHTS IN CROSS-BORDER HEALTHCARE IN THE EUROPEAN UNION
 Special Eurobarometer 425 PATIENTS RIGHTS IN CROSS-BORDER HEALTHCARE IN THE EUROPEAN UNION SUMMARY Fieldwork: October 2014 Publication: May 2015 This survey has been requested by the European Commission,
Special Eurobarometer 469
 Summary Integration of immigrants in the European Union Survey requested by the European Commission, Directorate-General for Migration and Home Affairs and co-ordinated by the Directorate-General for Communication
MEDIA USE IN THE EUROPEAN UNION
 Standard Eurobarometer 76 Autumn 2011 MEDIA USE IN THE EUROPEAN UNION REPORT Fieldwork: November 2011 Publication: March 2012 This survey has been requested and co-ordinated by Directorate-General for
Firearms in the European Union
 Flash Eurobarometer 383 Firearms in the European Union SUMMARY Fieldwork: September 2013 Publication: October 2013 This survey has been requested by the European Commission, Directorate-General for Home
Civil protection Full report
 Special Eurobarometer European Commission Civil protection Full report Fieldwork: September-October 2009 Publication: November 2009 Special Eurobarometer 328 / Wave TNS Opinion & Social This survey was
EUROPEAN CITIZENSHIP
 Standard Eurobarometer 80 Autumn 2013 EUROPEAN CITIZENSHIP REPORT Fieldwork: November 2013 This survey has been requested and co-ordinated by the European Commission, Directorate-General for Communication.
A. The image of the European Union B. The image of the European Parliament... 10
 Directorate General for Communication Direction C Relations with citizens PUBLIC OPINION MONITORING UNIT EUROPEAN ELECTIONS 2009 25/05/2009 Pre electoral survey First wave First results: European average
Europeans attitudes towards climate change
 Special Eurobarometer 313 EUROPEAN PARLIAMENT EUROPEAN COMMISSION Europeans attitudes towards climate change Special Eurobarometer 313 / Wave 71.1 TNS Opinion & Social Report Fieldwork: January - February
EUROBAROMETER The European Union today and tomorrow. Fieldwork: October - November 2008 Publication: June 2010
 EUROBAROMETER 66 Standard Eurobarometer Report European Commission EUROBAROMETER 70 3. The European Union today and tomorrow Fieldwork: October - November 2008 Publication: June 2010 Standard Eurobarometer
Data Protection in the European Union. Citizens perceptions. Analytical Report
 Gallup Flash Eurobarometer N o 189a EU communication and the citizens Flash Eurobarometer European Commission Data Protection in the European Union Citizens perceptions Analytical Report Fieldwork: January
Flash Eurobarometer 408 EUROPEAN YOUTH SUMMARY
 Flash Eurobarometer 408 EUROPEAN YOUTH SUMMARY Fieldwork: December 2014 Publication: April 2015 This survey has been requested by the European Commission, Directorate-General for Education and Culture
EUROPEAN CITIZENSHIP
 Standard Eurobarometer 81 Spring 2014 EUROPEAN CITIZENSHIP REPORT Fieldwork: June 2014 This survey has been requested and co-ordinated by the European Commission, Directorate-General for Communication.
Euro area unemployment rate at 9.9% EU27 at 9.4%
 STAT/11/76 April 2011 Euro area unemployment rate at 9.9% EU27 at 9.4% The euro area 1 (EA17) seasonally-adjusted 2 unemployment rate 3 was 9.9% in April 2011, unchanged compared with March 4. It was.2%
Special Eurobarometer 468. Report. Attitudes of European citizens towards the environment
 Attitudes of European citizens towards the environment Fieldwork September- Publication November 2017 Survey requested by the European Commission, Directorate-General for Environment and co-ordinated by
EUROPEAN CITIZENSHIP
 Standard Eurobarometer 77 Spring 2012 EUROPEAN CITIZENSHIP REPORT Fieldwork: May 2012 This survey has been requested and co-ordinated by the European Commission, Directorate-General for Communication.
Directorate General for Communication Direction C - Relations avec les citoyens PUBLIC OPINION MONITORING UNIT 27 March 2009
 Directorate General for Communication Direction C - Relations avec les citoyens PUBLIC OPINION MONITORING UNIT 27 March 2009 EUROPEANS AND THE ECONOMIC CRISIS Standard Eurobarometer (EB 71) Population:
ATTITUDES OF EUROPEAN CITIZENS TOWARDS THE ENVIRONMENT
 Special Eurobarometer 416 ATTITUDES OF EUROPEAN CITIZENS TOWARDS THE ENVIRONMENT SUMMARY Fieldwork: April - May 2014 Publication: September 2014 This survey has been requested by the European Commission,
CITIZENS AWARENESS AND PERCEPTIONS OF EU REGIONAL POLICY
 Flash Eurobarometer 384 CITIZENS AWARENESS AND PERCEPTIONS OF EU REGIONAL POLICY SUMMARY Fieldwork: September 2013 Publication: December 2013 This survey has been requested by the European Commission,
The European Emergency Number 112
 Gallup 2 Flash Eurobarometer N o 189a EU communication and the citizens Flash Eurobarometer European Commission The European Emergency Number 112 Summary Fieldwork: January 2008 Publication: February 2008
EUROBAROMETER 68 AUTUMN 2007 NATIONAL REPORT UNITED KINGDOM. Standard Eurobarometer PUBLIC OPINION IN THE EUROPEAN UNION
 Standard Eurobarometer European Commission EUROBAROMETER 68 PUBLIC OPINION IN THE EUROPEAN UNION AUTUMN 2007 Standard Eurobarometer 68 / Autumn 2007 TNS Opinion & Social NATIONAL REPORT UNITED KINGDOM
PUBLIC OPINION IN THE EUROPEAN UNION
 Standard Eurobarometer 77 Spring 2012 PUBLIC OPINION IN THE EUROPEAN UNION REPORT Fieldwork: May 2012 This survey has been requested and co-ordinated by the European Commission, Directorate-General for
EUROPEANS, THE EUROPEAN UNION AND THE CRISIS
 Standard Eurobarometer 80 Autumn 2013 EUROPEANS, THE EUROPEAN UNION AND THE CRISIS REPORT Fieldwork: November 2013 This survey has been requested and co-ordinated by the European Commission, Directorate-General
Convergence: a narrative for Europe. 12 June 2018
 Convergence: a narrative for Europe 12 June 218 1.Our economies 2 Luxembourg Ireland Denmark Sweden Netherlands Austria Finland Germany Belgium United Kingdom France Italy Spain Malta Cyprus Slovenia Portugal
EUROPEAN CITIZENSHIP
 Standard Eurobarometer 82 Autumn 2014 EUROPEAN CITIZENSHIP REPORT Fieldwork: November 2014 This survey has been requested and co-ordinated by the European Commission, Directorate-General for Communication.
Europeans attitudes towards climate change
 Special Eurobarometer European Commission Europeans attitudes towards climate change Fieldwork: August - September 2009 Publication: November 2009 Special Eurobarometer 322 / Wave 72.1 TNS Opinion & Social
INTRODUCTION OF THE EURO IN THE MORE RECENTLY ACCEDED MEMBER STATES
 Eurobarometer INTRODUCTION OF THE EURO IN THE MORE RECENTLY ACCEDED MEMBER STATES REPORT Fieldwork: April 2013 Publication: June 2013 This survey has been requested by the European Commission, Directorate-General
Citizens awareness and perceptions of EU regional policy
 Flash Eurobarometer 298 The Gallup Organization Flash Eurobarometer European Commission Citizens awareness and perceptions of EU regional policy Fieldwork: June 1 Publication: October 1 This survey was
Views on European Union enlargement
 Flash Eurobarometer 257 The Gallup Organization Flash EB N o 257 Views on European Union enlargement Flash Eurobarometer European Commission Views on European Union enlargement Fieldwork: February 2009
Post-electoral survey 2009
 Special Eurobarometer EUROPEAN PARLIAMENT European Commission Post-electoral survey 2009 Report Fieldwork: June-July 2009 Publication: November 2009 Special Eurobarometer 320/ Wave TNS opinion & social
Employment and Social Policy
 Special Eurobarometer 77 European Commission Employment and Social Policy SUMMARY Special Eurobarometer 77 / Wave EB76. TNS opinion & social Fieldwork: September- October 0 Publication: November 0 This
Making a difference in the world: Europeans and the future of development aid
 Special Eurobarometer 375 European Commission Making a difference in the world: Europeans and the future of development aid REPORT Special Eurobarometer 375 / Wave 7.61 TNS opinion & social Fieldwork:
EUROBAROMETER 72 PUBLIC OPINION IN THE EUROPEAN UNION Volume 2
 Standard Eurobarometer European Commission EUROBAROMETER 72 PUBLIC OPINION IN THE EUROPEAN UNION Volume 2 REPORT Fieldwork: October - November 2009 Standard Eurobarometer 72 / Autumn 2009 - TNS opinion
Standard Eurobarometer 85. Public opinion in the European Union
 Public opinion in the European Union Fieldwork: May 2016 Survey conducted by TNS opinion & social at the request of the European Commission, Directorate-General for Communication Survey coordinated by
Europeans and the crisis
 EUROPEAN PARLIAMENT Europeans and the crisis Report Fieldwork: August September 2010 Publication: November 2010 Special Eurobarometer/Wave 74.1 TNS Opinion & Social Eurobaromètre spécial / Vague 74.1 TNS
Context Indicator 17: Population density
 3.2. Socio-economic situation of rural areas 3.2.1. Predominantly rural regions are more densely populated in the EU-N12 than in the EU-15 Context Indicator 17: Population density In 2011, predominantly
PUBLIC OPINION IN THE EUROPEAN UNION
 Standard Eurobarometer 81 Spring 2014 PUBLIC OPINION IN THE EUROPEAN UNION FIRST RESULTS Fieldwork: June 2014 Publication: July 2014 This survey has been requested and co-ordinated by the European Commission,
SPECIAL EUROBAROMETER 365
 Special Eurobarometer European Commission SPECIAL EUROBAROMETER 365 Attitudes of European citizens towards the environment SUMMARY Fieldwork: April May 2011 Special Eurobarometer 365 / Wave 75.2 TNS Opinion
EUROBAROMETER 69 SPRING 2008 NATIONAL REPORT UNITED KINGDOM. Standard Eurobarometer PUBLIC OPINION IN THE EUROPEAN UNION
 Standard Eurobarometer 69 / Spring 2008 TNS Opinion & Social Standard Eurobarometer European Commission EUROBAROMETER 69 PUBLIC OPINION IN THE EUROPEAN UNION SPRING 2008 NATIONAL REPORT UNITED KINGDOM
Cross-border health services in the EU. Analytical report
 Flash Eurobarometer European Commission Cross-border health services in the EU Analytical report Fieldwork: May 2007 Report: June 2007 Flash Eurobarometer 210 This survey was requested by Health and Consumer
Flash Eurobarometer 429. Summary. The euro area
 LOGO CE_Vertical_EN_NEG_quadri rouge Summary Survey requested by the European Commission, Directorate-General for Economic and Financial Affairs and co-ordinated by the Directorate-General for Communication
Electoral rights of EU citizens. Analytical Report
 Flash Eurobarometer 292 The Gallup Organization Flash EB No 292 Electoral Rights Analytical Report Flash Eurobarometer European Commission Electoral rights of EU citizens Analytical Report Fieldwork: March
Standard Eurobarometer 88 Autumn Report. Media use in the European Union
 Media use in the European Union Fieldwork November 2017 Survey requested and co-ordinated by the European Commission, Directorate-General for Communication This document does not represent the point of
The Unitary Patent and the Unified Patent Court. Dr. Leonard Werner-Jones
 The Unitary Patent and the Unified Patent Court Dr. Leonard Werner-Jones Background The Past: No centralization at all Prosecution country-by-country Litigation country-by-country Patents actions 2 Background
SIS II 2014 Statistics. October 2015 (revision of the version published in March 2015)
") SIS II 2014 Statistics October 2015 (revision of the version published in March 2015) European Agency for the operational management of large-scale IT systems in the area of freedom, security and justice
SIS II 2014 Statistics October 2015 (revision of the version published in March 2015) European Agency for the operational management of large-scale IT systems in the area of freedom, security and justice
ERGP REPORT ON CORE INDICATORS FOR MONITORING THE EUROPEAN POSTAL MARKET
 ERGP (15) 27 Report on core indicators for monitoring the European postal market ERGP REPORT ON CORE INDICATORS FOR MONITORING THE EUROPEAN POSTAL MARKET 3 December 2015 CONTENTS 1. EXECUTIVE SUMMARY...
CULTURAL ACCESS AND PARTICIPATION
 Special Eurobarometer 399 CULTURAL ACCESS AND PARTICIPATION SUMMARY Fieldwork: April May 2013 Publication: November 2013 This survey has been requested by the European Commission, Directorate-General for
of the European Commission. and the Communication. This document of the authors. Standard Eurobarometer 75 / Spring 2011 TNS opinion & social
 Standard Eurobarometer European Commission EUROBAROMETER 75 SPRING 2011 Europeans, the European Union crisis and the REPORT Standard Eurobarometer 75 / Spring 2011 TNS opinion & social Fieldwork: May 2011
Alternative views of the role of wages: contours of a European Minimum Wage
 Alternative views of the role of wages: contours of a European Minimum Wage Europe at a crossroads which way to quality jobs and prosperity? ETUI-ETUC Conference Brussels, 24-26 September 2014 Dr. Torsten
Flash Eurobarometer 405 THE EURO AREA SUMMARY
 Flash Eurobarometer 405 THE EURO AREA SUMMARY Fieldwork: October 2014 Publication: October 2014 This survey has been requested by the European Commission, Directorate-General for Economic and Financial
International Trade. Summary. Fieldwork: August - September 2010 Publication: November Special Eurobarometer 357
 Special Eurobarometer 357 European Commission International Trade Fieldwork: August - September 2010 Publication: November 2010 Special Eurobarometer 357 / Wave 74.1 TNS Opinion & Social Summary This survey
European Parliament Eurobarometer (EB79.5) ONE YEAR TO GO UNTIL THE 2014 EUROPEAN ELECTIONS Institutional Part ANALYTICAL OVERVIEW
 ONE YEAR TO GO UNTIL THE 2014 EUROPEAN ELECTIONS Institutional Part ANALYTICAL OVERVIEW") Directorate-General for Communication Public Opinion Monitoring Unit Brussels, 21 August 2013. European Parliament Eurobarometer (EB79.5) ONE YEAR TO GO UNTIL THE 2014 EUROPEAN ELECTIONS Institutional
Directorate-General for Communication Public Opinion Monitoring Unit Brussels, 21 August 2013. European Parliament Eurobarometer (EB79.5) ONE YEAR TO GO UNTIL THE 2014 EUROPEAN ELECTIONS Institutional
Territorial Evidence for a European Urban Agenda
 ESPON Workshop: Territorial Evidence for a European Urban Agenda The territorial and urban issues in the 6th Cohesion Report Alexandros Karvounis Economic Analysis Unit, DG REGIO 25 November 2014, Brussels
Special Eurobarometer 468. Attitudes of European citizens towards the environment
 Attitudes of European citizens towards the environment Fieldwork September- Publication November 2017 Survey requested by the European Commission, Directorate-General for Environment and co-ordinated by
Council of the European Union Brussels, 24 April 2018 (OR. en)
") Council of the European Union Brussels, 24 April 2018 (OR. en) 8279/18 SIRIS 41 COMIX 206 NOTE From: eu-lisa To: Delegations No. prev. doc.: 8400/17 Subject: SIS II - 2017 Statistics Pursuant to Article
Council of the European Union Brussels, 24 April 2018 (OR. en) 8279/18 SIRIS 41 COMIX 206 NOTE From: eu-lisa To: Delegations No. prev. doc.: 8400/17 Subject: SIS II - 2017 Statistics Pursuant to Article
RECENT POPULATION CHANGE IN EUROPE
 RECENT POPULATION CHANGE IN EUROPE Silvia Megyesiová Vanda Lieskovská Abstract Population ageing is going to be a key demographic challenge in many Member States of the European Union. The ageing process
ENTREPRENEURSHIP IN THE EU AND BEYOND
 Flash Eurobarometer 354 ENTREPRENEURSHIP IN THE EU AND BEYOND COUNTRY REPORT JAPAN Fieldwork: July 2012 This survey has been requested by the European Commission, Directorate-General Enterprise and Industry
Report on women and men in leadership positions and Gender equality strategy mid-term review
 EUROPEAN COMMISSION MEMO Brussels, 14 October 2013 Report on women and men in leadership positions and Gender equality strategy mid-term review 1. New Report on Women in Decision-Making: What is the report
Standard Eurobarometer 77 Spring 2012 EUROPE 2020 REPORT
 Standard Eurobarometer 77 Spring 2012 EUROPE 2020 REPORT Fieldwork: May 2012 This survey has been requested and co-ordinated by the European Commission, Directorate-General for Communication. http://ec.europa.eu/public_opinion/index_en.htm
I m in the Dublin procedure what does this mean?
 EN I m in the Dublin procedure what does this mean? B Information for applicants for international protection found in a Dublin procedure, pursuant to article 4 of Regulation (EU) No 604/2013 1 You have
ENTREPRENEURSHIP IN THE EU AND BEYOND
 Flash Eurobarometer 354 ENTREPRENEURSHIP IN THE EU AND BEYOND COUNTRY REPORT GERMANY Fieldwork: June 2012 This survey has been requested by the European Commission, Directorate-General Enterprise and Industry
What does the Tourism Demand Surveys tell about long distance travel? Linda Christensen Otto Anker Nielsen
 What does the Tourism Demand Surveys tell about long distance travel? Linda Christensen Otto Anker Nielsen Overview of the presentation 1. The Tourism Demand Survey 2. Data 3. Share of respondents travelling
Looking Through the Crystal Ball: For Growth and Productivity, Can Central Europe be of Service?
 Looking Through the Crystal Ball: For Growth and Productivity, Can Central Europe be of Service? ARUP BANERJI REGIONAL DIRECTOR FOR EUROPEAN UNION MEMBER STATES THE WORLD BANK 6 th Annual NBP Conference