PUBLIC OPINION IN THE EUROPEAN UNION
|
|
|
- Alan Pope
- 5 years ago
- Views:
Transcription


1 Standard Eurobarometer 77 Spring 2012 PUBLIC OPINION IN THE EUROPEAN UNION REPORT Fieldwork: May 2012 This survey has been requested and co-ordinated by the European Commission, Directorate-General for Communication. This document does not represent the point of view of the European Commission. The interpretations and opinions contained in it are solely those of the authors. Standard Eurobarometer 77 / Spring 2012 TNS Opinion & Social
2 EUROBAROMÈTRE STANDARD 77 L OPINION PUBLIQUE DANS L UE PRINTEMPS 2012 Standard Eurobarometer 77 Spring 2012 Public Opinion in the European Union Survey carried out by TNS Opinion & Social at the request of the European Commission, Directorate-General for Communication Survey coordinated by the European Commission, Directorate-General for Communication Research and Speechwriting Unit 0
3 TABLE OF CONTENTS INTRODUCTION... 3 I. LIFE IN THE EUROPEAN UNION Personal aspects The personal situation of Europeans today The professional and financial situation The concerns of Europeans The national situation compared with the European average The quality of life and the cost of living Future prospects The situation of young people The situation of the environment Economic aspects Evaluation of the current economic situation The national, European and world situations Employment Public finances Expectations for the next twelve months The national, European and world situations The employment situation The main national concerns The main concerns at European level Political aspects Interest in politics Trust in institutions The direction in which things are going II. THE EUROPEAN UNION AND ITS CITIZENS Attachment to the European Union What does the European Union mean to citizens? Support for EU membership and the perceived benefits of membership (candidate countries) Democracy in the European Union Perceptions of how democracy works at national and European levels The extent to which personal, national and European interests are taken into account Opinions on the speed of European integration Europeans and globalisation Is globalisation an opportunity for economic growth? Globalisation requires worldwide governance The EU and the effects of globalisation The negative wording (SPLIT A) The positive wording (SPLIT B)
4 5. The European institutions Awareness of the European institutions and the trust they inspire Trust in the European Union The European Union s image Knowledge of the European Union Subjective knowledge of how the European Union works Objective knowledge of how the European Union works III. THE EUROPEAN UNION TODAY AND TOMORROW Support for European policies The objective of the building of Europe The perceived objectives of the building of Europe The desired objectives of the building of Europe The future of the European Union The European institutions priorities for the future Optimism for the EU s future ANNEXES Technical specifications Questionnaire 2
5 INTRODUCTION This Standard Eurobarometer survey was carried out between 12 and 27 May 2012 in 34 countries and territories 1 : the 27 Member States of the European Union, the six candidate countries (Croatia, the Former Yugoslav Republic of Macedonia, Turkey, Iceland, Montenegro and Serbia), and the Turkish Cypriot Community in the part of the country not controlled by the government of the Republic of Cyprus. The autumn 2011 Standard Eurobarometer survey (EB76) was marked by declines in many economic indicators, including the evolution of the European economy and national, European and world economic prospects. At the same time, indicators of support for the European Union deteriorated. In February 2012, before the spring 2012 survey was conducted, the European Commission published its interim economic forecasts for spring 2012, predicting a stagnating economy in the European Union and a slight recession in the euro zone. A modest return to growth was forecast for the second half of the year. The weeks preceding this survey were also marked by several political events. The parliamentary elections held in Greece on 6 May 2012 did not result in a majority, and the Greek electorate returned to the ballot box on 17 June In France, François Hollande won the presidential election, becoming the first socialist president since François Mitterrand (president from 1981 to 1995). Lastly, some weeks before, the leftist Direction Social Democracy party won the parliamentary elections in Slovakia. During the fieldwork, a G8 summit was also held at Camp David in the USA, concluding by emphasising the importance of promoting growth and jobs. Just after the survey was conducted, other important events awaited the European Union: parliamentary elections in Greece and France; the G20 summit at Los Cabos in Mexico; and, at the end of June, the European Council. The full Standard Eurobarometer report consists of several volumes. The first volume analyses the results of the historical indicators of the Standard Eurobarometer survey. Four other volumes present the state of European public opinion on other themes: the financial and economic crisis; the Europe 2020 strategy; European citizenship; values. This volume is devoted to the state of public opinion in the European Union. This first volume is divided into three parts. The first part considers personal, social, economic and political life in the European Union as it is experienced by its citizens. It examines the financial and personal situation of citizens; their feelings about the national, European, and world economic situations; their assessments of the situation in their country as compared with the average for other European countries; their main concerns; and their future expectations. This part of the report also explores interest in politics and public opinion on the direction in which things are going, nationally and in the European Union, while also analysing public trust in national institutions and the UN. 1 Please consult the technical specifications for the exact fieldwork dates in each country. 3
6 The second part of the report presents the principal indicators of the EU s image, and of trust in the European Union and its institutions. We first consider the attachment of Europeans to the European Union, followed by whether or not Europeans believe that the Union takes their personal and national interests into account. This part of the report also considers the attitudes of European to the speed of European integration, and to globalisation. We then ask how familiar Europeans are with the European institutions, and how far they trust them, before studying public knowledge of the European Union. The third part of the report first analyses public support for a range of European policies. It then examines the opinions of Europeans about the main aims of European integration, both as they perceive them and as they would wish them to be. Finally, we consider public opinion on the future of the European Union. The general analysis and the socio-demographic analyses are based on the average for the 27 Member States. This average has been weighted to reflect the actual population of each Member State. The averages for previous years represent the results obtained in all the Member States of the European Union, as it was composed at the time of the survey. Some 32,728 people from different social and demographic groups were interviewed on a face-to-face basis in their homes in their mother tongue, at the request of the European Commission. The methodology used is that of the Standard Eurobarometer surveys conducted by the Directorate-General for Communication ( Research and Speechwriting Unit) 2. A technical note concerning the interviews conducted by the institutes of the TNS Opinion & Social network is attached to this report. This note also specifies the confidence intervals The results tables are annexed. It should be noted that the total of the percentages indicated in the tables in this report may exceed 100% when the respondent was able to choose several answers to the same question. 4
7 The following abbreviations are used in this report: ABBREVIATIONS BE Belgium LV Latvia CZ Czech Republic LU Luxembourg BG Bulgaria HU Hungary DK Denmark MT Malta DE Germany NL The Netherlands EE Estonia AT Austria EL Greece PL Poland ES Spain PT Portugal FR France RO Romania IE Ireland SI Slovenia IT Italy SK Slovakia CY Republic of Cyprus*** FI Finland LT Lithuania SE Sweden UK United Kingdom CY (tcc) Turkish Cypriot Community HR Croatia EU27 European Union 27 Member States TR Turkey MK Former Yugoslav Republic of Macedonia EU15 **** BE, IT, FR, DE, LU, NL, DK, UK, IE, PT, ES, EL, AT, SE, FI* IS Iceland NMS12 BG, CZ, EE, CY, LT, LV, MT, HU, PL, RO, SL, SK** ME Montenegro Eurozone BE, FR, IT, LU, DE, AT, ES, PT, IE, NL, FI, EL, EE, SI, CY, MT, SK RS Serbia Non- Eurozone BG, CZ, DK, LV, LT, HU, PL, RO, SE, UK * EU15 refers to the 15 European Union Member States before the enlargements of 2004 and 2007 ** The NMS12 countries are the 12 new Member States that joined the European Union at the time of the 2004 and 2007 enlargements *** Cyprus as a whole is one of the 27 European Union Member States. However, the acquis communautaire has been suspended in the part of the country which is not controlled by the government of the Republic of Cyprus. For practical reasons, only the interviews carried out in the part of the country controlled by the government of the Republic of Cyprus are included in the CY category and in the EU27 average. The interviews carried out in the part of the country that is not controlled by the government of the Republic of Cyprus are included in the CY(tcc) (tcc: Turkish Cypriot Community) category) **** Provisional abbreviation which in no way prejudges the definitive name of this country, which will be agreed once the current negotiations at the United Nations have been completed * * * * * We wish to thank all the people interviewed throughout Europe who took the time to take part in this survey. Without their active participation, this survey would not have been possible. 5
8 I. LIFE IN THE EUROPEAN UNION 1. Personal aspects 1.1. The personal situation of Europeans today Europeans are still satisfied with the life they lead, with a slight increase in positive opinions and optimism A clear majority of Europeans are still satisfied with their lives (77%). This proportion is 2 percentage points higher than in the previous Standard Eurobarometer survey (75% in autumn 2011), which followed a 4-point fall (79% in EB75 of spring 2011). The proportion of Europeans who are dissatisfied with their lives has fallen slightly (23%, -1) 4, but still represents almost a quarter of the respondents. 4 QA1 On the whole, are you very satisfied, fairly satisfied, not very satisfied or not at all satisfied with the life you lead? 6
9 Europeans are also slightly more optimistic about the future: although a majority of the respondents still believe that their life in general will not change over the next twelve months (56%, =), the proportion who think that it will be better has increased slightly (23%, +2) and pessimism has declined (17% think that it will be worse, -3 percentage points, after a 6-point rise in autumn 2011) 5. A majority of respondents remain positive about their current personal situation in 22 Member States, the exceptions being Greece (where 68% are dissatisfied), Portugal (66%), Bulgaria (58%), Hungary (58%) and Romania (51%). 5 QA5 What are your expectations for the next twelve months: will the next twelve months be better, worse or the same, when it comes to...? 7
,")
.")
 and Serbia (63%).")

, compared with 11 in autumn 2011, but only five the")

10 In the candidate countries, a majority of respondents are positive about their personal situation in Iceland (96%), Turkey (71%), Croatia (67%) and the Former Yugoslav Republic of Macedonia (64%). However, respondents are predominantly dissatisfied in Montenegro (52%) and Serbia (63%). Looking ahead over the next twelve months, the optimism index 6 is negative in 10 Member States (Bulgaria, Czech Republic, Greece, Spain, Italy, Cyprus, Hungary, Poland, Portugal and Slovenia), compared with 11 in autumn 2011, but only five the previous spring (EB75). 6 Index which reflects the difference between optimistic and pessimistic forecasts for the next twelve months in a country (if it is positive, that means that optimism outweighs pessimism and vice versa). 8
 and continues to decline in Greece (32%, -5) after a 9-point fall in autumn 2011.")
11 Points of note: Personal satisfaction has decreased in Portugal (34%, -10 percentage points since EB76). It has also decreased by 7 points in Hungary (42%) and continues to decline in Greece (32%, -5) after a 9-point fall in autumn In contrast, it has increased significantly in France (85%, +9) after falling by 7 points in the previous survey. However, there has been a significant increase in the optimism index 7 : in France (+19 percentage points to +27), Romania (+17 to +16), Estonia (+11 to +24), Finland (+11 to +27) and the United Kingdom (+10 to +19); and in countries where the index remains low, such as Slovakia (+18 to +3), or even negative such as Portugal (+21, to -23), two countries in which recorded a sharp rise in pessimism in autumn Three countries are exceptions to this pattern, with an increase in pessimism: Spain (-9 percentage points, with an index now in negative territory at -5), Italy (-7 to -6) and Bulgaria (-3 to -5). 7 Index which reflects the difference between optimistic and pessimistic forecasts for the next twelve months in a country (if it is positive, that means that optimism outweighs pessimism and vice versa). 9
12 1.2. The professional and financial situation - Although Europeans are slightly more positive about their job situation and the financial health of their household, the increase is not enough to make up the ground lost in autumn The household s financial situation Just over six out of ten Europeans continue to consider that the financial situation of their household is good (62%, versus 36% who consider that it is bad ) 8. This indicator has improved slightly since EB76 of autumn 2011 (+1 percentage point), but not enough to offset the deterioration noted at that time (-4). Europeans are also slightly more positive about the future, but once again the increase in optimism is not enough to offset the fall in optimism recorded in autumn 2011 (EB76). Thus, a growing majority of respondents think that the financial situation of their household will stay the same (58%, +2), while the proportion who think that the next twelve months will be better has increased by 1 percentage point (18%). Pessimists still outnumber optimists, but the proportion of pessimists has fallen (21%, -3 after a 7-point rise in autumn 2011) 9. A majority of respondents are positive about the financial situation of their household in 19 Member States. The exceptions are Greece (78% describe it as bad ), Hungary (72%), Portugal (68%), Bulgaria (66%) and Romania (57%). These countries have been joined by three others in which a narrow majority of respondents are now pessimistic: Cyprus (51%, after an increase of 4 percentage points), Italy (50%, +4) and Ireland (49%, +2). Only one country has recorded a significant change for this indicator, namely Lithuania, where optimism has increased to 56% (+7). The optimism index has improved in most Member States. Whereas only eight of them had a positive or neutral optimism index in autumn 2011, that number has now increased to 13. The most significant improvements have been recorded in Romania (+18 percentage points: the index now stands at +13), France (+17 to +16), Latvia (+14 to +24), Estonia (+13 to +22), but also in countries where the index is negative, such as Portugal (+21 to -32) and Slovakia (+19 to -6). Conversely, expectations have deteriorated significantly in Spain (-12 percentage points, to -12) and Italy (-11 to -19). 8 QA4a How would you judge the current situation in each of the following? 9 Q5a What are your expectations for the next twelve months: will the next twelve months be better, worse or the same, when it comes to...? 10
, the optimism index remains positive (and has even risen by 4 percentage points to +28).")
13 In the candidate countries, we note: A significant improvement in expectations in Turkey (51%, +11), together with an improvement in the optimism index (+19 percentage points to +6). Although negative opinions have gained ground in Montenegro (65%, +16), the optimism index remains positive (and has even risen by 4 percentage points to +28). In Serbia, where the Standard Eurobarometer survey was conducted for the first time, respondents are predominantly negative about the financial situation of their household: 69% of the respondents consider say that it is bad. Asked about their expectations for the future, 45% of respondents say that things will stay the same, while 28% expect the coming year to be worse and almost a quarter expect it to be better (24%). 11
14 The job situation Europeans are also very slightly more positive about their job situation: 52% consider that it is good (+1 percentage point after a 4-point fall in the previous survey) while 30% say that it is bad (unchanged). Expectations for the future, which also deteriorated in autumn 2011, are more or less unchanged: a majority of respondents continue to believe that their job situation will remain the same in the next twelve months (60%, +1), while the proportion of interviewed people who believe that it will be worse has fallen by 1 percentage point (12%), after a 4-point rise in autumn The proportion of Europeans who consider that it will be better is unchanged (16%). Points of note: A majority of respondents are satisfied with their job situation in 20 Member States. The exceptions are Bulgaria, Greece, Spain, Italy, Hungary, Portugal and Romania. Satisfaction has increased significantly in the United Kingdom (61%, +10) and has also gained ground in France (55%, +7). But it has decreased in Spain (40%, -7). This worsening situation in Spain is mirrored in expectations for the future: the optimism index has fallen sharply in Spain (-10 percentage points to -3), as it has in Italy (-10 to -12). In contrast, the optimism index has improved significantly in Slovakia (+10), where it is now just positive at +1. There are strong socio-demographic divisions for all these indicators of personal satisfaction. The most educated respondents and those who almost never have difficulties paying their bills are, on average, more satisfied than Europeans as a whole. Managers are also more satisfied than white-collar and manual workers. Similar trends underlie short-term expectations, but with less pronounced differences. Unemployed people are the most likely to believe that the financial situation of their household and their job situation will get better over the next twelve months. 12

15 EUROBAROMÈTRE STANDARD 77 L OPINION PUBLIQUE DANS L UE PRINTEMPS
 are by far the most pressing concern of Europeans, followed by unemployment (21%).")
, in proportions similar to those recorded for the social issues most closely linked to financial considerations: health and")
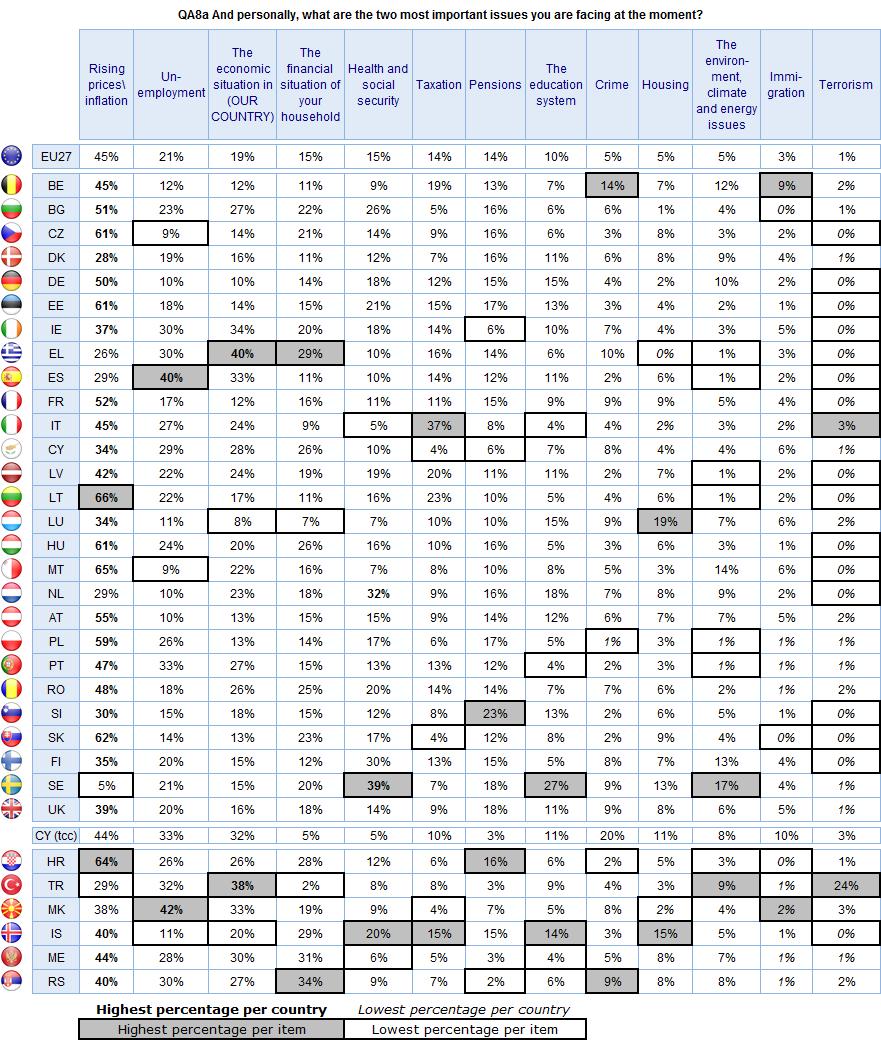
16 1.3. The concerns of Europeans - Economic issues are at the heart of the personal concerns of Europeans - The list of problems which face Europeans is largely dominated by economic issues. Rising prices (45%) are by far the most pressing concern of Europeans, followed by unemployment (21%). Interviewed people are more likely to be worried about their country s economic situation (19%) than about the financial situation of their household (15%). Taxation also figures prominently among the concerns of Europeans (14%), in proportions similar to those recorded for the social issues most closely linked to financial considerations: health and social security (15%) and pensions (14%). The education system was mentioned by 10% of respondents. These issues were followed by three items with identical scores, the environment, climate and energy issues (5%), housing (5%) and crime (5%). Finally, they mentioned immigration (3%) and terrorism (1%) QA8 And personally, what are the two most important issues you are facing at the moment? 14
17 It is not possible to measure the evolutions against the results of the previous survey because of several changes made to the question asked*; however, economic issues continue to top the list of concerns. In the EB76 survey, the three most frequently mentioned issues were rising prices (45%), the economic situation (25%) and unemployment (19%). *The following changes have been made in this survey: The item the economic situation has been changed to the economic situation in (OUR COUNTRY) A new item has been added, namely the financial situation of your household The environment, climate change and energy issues have been combined under the item the environment, climate and energy issues Healthcare has been replaced by health and social security Defence and foreign policy has been deleted Rising prices are the main concern in 23 countries, in particular in Lithuania (66%) and Malta (65%), though this item was also mentioned by more than 60% of respondents in four other countries (Czech Republic, Estonia, Hungary and Slovakia). Unemployment is the primary concern in Spain (40%). It was also mentioned by a third of the people polled in Portugal (33%). The national economic situation is the main personal concern in Greece (40%). Greece is also the country in which most respondents mentioned the financial situation of the household (29%), but with a considerably lower score than that recorded for the national economic situation. This is a noticeable trend in the Eurozone countries: respondents are more concerned about the economic situation in their country (20%) than about the financial situation of their household (14%), whereas the opposite is true in the non-eurozone countries (17/19). Health and social security is the first concern in Sweden (39%) and the Netherlands (32%). People polled in Sweden are also more likely than average to mention the education system (27%) and the environment, climate and energy issues (17%). European Citizens are more likely in Italy than elsewhere to see taxation as a major concern (37%). Pensions are at the forefront of the concerns of citizens in Slovenia (23%, in 2nd place after rising prices). Housing is the chief concern of interviewed people in Luxembourg (19%, in 2nd place after rising prices). People polled in Belgium are more likely than average to mention crime (14%) and immigration (9%). 15
18 16
 and the economic situation in their country (28%); these issues worry them more than the financial situation of their")
19 A socio-demographic analysis reveals that rising prices and inflation are the first concern in all categories, except among unemployed people who are very likely to mention unemployment (73%). Self-employed people are far more concerned than average about taxation (30%) and the economic situation in their country (28%); these issues worry them more than the financial situation of their household (16%). The same trend is evident among managers: 22% mention their country s economic situation and 15% their household finances; and the same applies to Europeans who never have difficulty paying their bills (17% mention the economic situation in their country and 14% that of their household). Unemployed people place these two items on an equal footing (19% cite the national situation and 18% the household situation). The youngest respondents are more concerned than average about unemployment (28%), which is their second concern, after rising prices (37%) and just ahead of the education system (25%). 5 most frequently mentioned items 17
. The quality of life and the environment are exceptions - 2.1.")
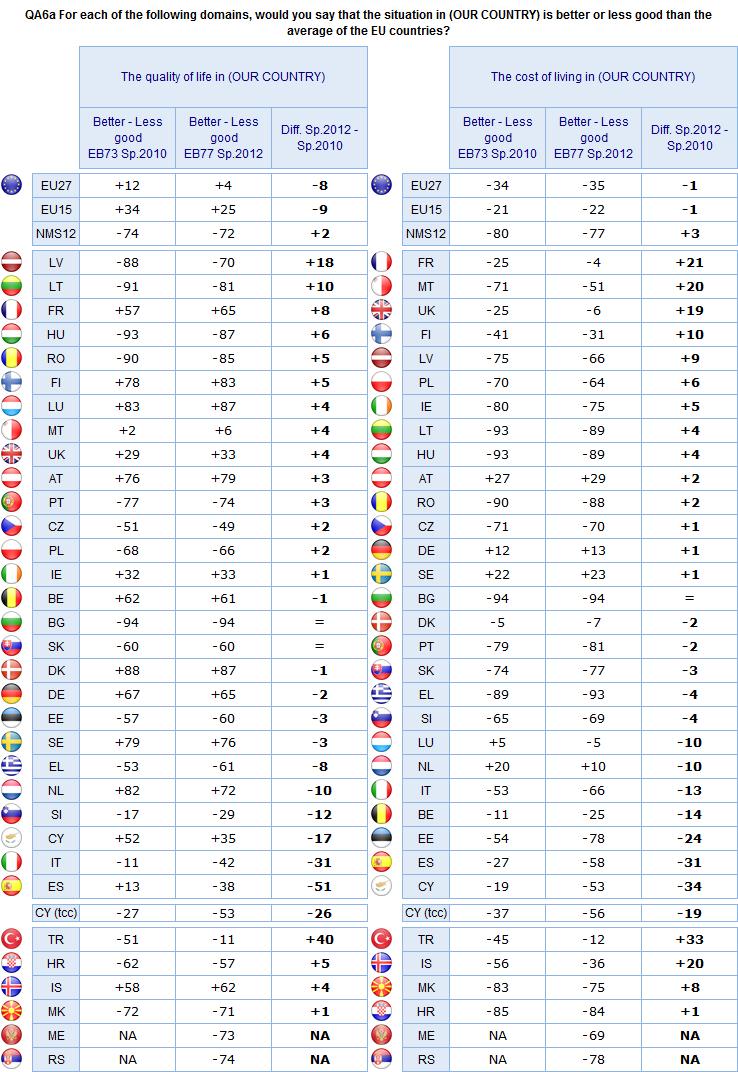
20 2. The national situation compared with the European average - Europeans have the impression that the situation is worse in their country than elsewhere in Europe on a majority of issues (cost of living, employment, prospects for the future, youth). The quality of life and the environment are exceptions The quality of life and the cost of living The quality of life Half of Europeans (50%) say that the quality of life in their country is better than the average of the EU countries 11. While this still represents a narrow majority, the proportion has fallen since spring 2010 (EB73), when this view was shared by 53% of Europeans. Conversely, the proportion of Europeans who consider that the situation is less good has increased significantly (46%, +5). A majority of respondents in fifteen Member States have the impression that the quality of life in their country is better than the European average. This is particularly true in Luxembourg (93% think that the situation in their country is better, including 44% who replied much better ), Denmark (92%), Finland (91%), Austria (89%), Sweden (87%), the Netherlands (85%) and Germany (81%). The next highest scores were recorded in Belgium and France, followed by Cyprus, Ireland, the United Kingdom and Malta. On average, respondents in the EU15 countries are very positive about their national situation, since 60% of them consider that it is better than the EU average, whereas the vast majority of people polled in the NMS12 countries say that the quality of life is less good in their country (84%). The countries where respondents are the most convinced that their quality of life is less good are NMS12 countries: Bulgaria (96% believe that their situation is less good than the EU average, including 68% who think that it is definitely less good ), Hungary (93%), Romania (90%) and Lithuania (89%). However, the list also includes some EU15 countries which have experienced serious economic problems, such as Portugal (84%) and Greece (80%). 11 QA6a For each of the following domains, would you say that the situation in (OUR COUNTRY) is better or less good than the average of the EU countries? 18
21 The most significant evolutions since EB73 of spring 2010 also concern Spain and Italy: in Spain, the feeling that the quality of life is better than average has fallen by 25 percentage points to 28%, and is now the minority opinion (compared with 66% for whom it is less good, +26), while in Italy, it has fallen by 15 points (27%). The cost of living Judgements of the cost of living are more severe. Almost two-thirds of Europeans consider that the situation in their country is less good than the EU average (64%). This proportion is more or less unchanged in comparison with the EB73 survey (+1, versus 29% who answered better, unchanged). A majority of respondents believe that the cost of living in their country is better than the European average in only four Member States. These four countries are also among the most positive about their quality of life: Austria (62% answered better, though only 7% said much better ), Sweden (58%), Germany (53%) and the Netherlands (53%). Points of note: Finland, the European country with the third highest proportion of respondents considering that their quality of life is better than the average, ranks only 10th when it comes to assessing the cost of living, evidence that these two subjects are only partially linked. The countries in which the respondents are the most negative are Bulgaria (96%), Greece (96%), Hungary (94%), Lithuania (93%), Romania (91%), Portugal (88%) and Slovakia (88%). The most striking changes in comparison with spring 2010 (EB73) are: The feeling that the national cost of living is better than average has deteriorated sharply in Cyprus (21%, -16 percentage points), Spain (17%, -15) and Estonia (9%, -10). However, this view has gained significant ground in France (42%, +12), the United Kingdom (41%, +11) and Malta (20%, +10). Points of note: there is a difference, albeit narrower than in the EB73 survey, between answers in Eurozone countries (where 33% say that the situation is better in their country) and the responses given outside the Eurozone (25%). 19
22 In the candidate countries: A majority of respondents consider that their quality of life is less good than the European average, with the notable exception of Iceland (80% say that their situation is better ). However, interviewed people in Iceland continue to be unhappy about the cost of living since, despite a clear improvement since EB73, 65% say that it is less good. This nevertheless represents as 7-point fall. In Turkey, although a majority of respondents still compare the country s situation unfavourably with the European average, judgments have improved significantly: 41% (+22) say their situation is better in terms of their quality of life, and 41% (+19) in terms of the cost of living.. In Serbia, the respondents have a very poor opinion of both the quality of life in their country (85% say that it is less good, including 52% for whom it is definitely less good ) and the cost of living (87%, including 55% for whom it is definitely less good ). A socio-demographic analysis reveals that respondents opinions of the national situation are strongly influenced by their personal situation. The following categories are more likely to consider that the situation in their country is better than the European average: Respondents who studied up to the age of 20 or beyond (57% for the quality of life and 35% for the cost of living, versus 42% and 25% among Europeans who left school before the age of 16). Managers (63% and 40%, whereas the scores for self-employed people, whitecollar workers and manual workers are in line with the European average, and unemployed people are more critical: 37% and 21%). Europeans who never struggle to pay their bills (59% and 37% versus 32% and 17% among Europeans who have difficulties most of the time). 20
23 21
. There are wide variations between Member States: a majority of respondents in twelve countries believe that the future looks brighter than elsewhere in Europe.")

. The most pessimistic countries are Greece (94%, including 63% who replied definitely less good ), Portugal (84%), Hungary (83%) and Spain (82%).")
24 2.2. Future prospects When asked to compare the future prospects of their country with the European average, a narrow majority of Europeans say that the future looks less good (49% versus 43% for better ). There are wide variations between Member States: a majority of respondents in twelve countries believe that the future looks brighter than elsewhere in Europe. These include the countries which were most positive about the quality of life - namely Sweden (90%), Finland (89%), Denmark (88%), Austria (83%), Luxembourg (80%) - but also includes Germany, the Netherlands, Belgium, the United Kingdom, France and Cyprus. This view is also shared by a narrow majority of interviewed people in Malta, 30% of whom could not answer the question. Points of note: although scores are high in some of the above-mentioned countries (sometimes as high as 90%), the feeling that the future prospects in their country are much better than the EU average never exceeds 19% (recorded in Austria). The most pessimistic countries are Greece (94%, including 63% who replied definitely less good ), Portugal (84%), Hungary (83%) and Spain (82%). There are once again significant differences between EU15 countries (50% say that their situation is better ) and the NMS12 countries (only 19%). The difference between the Eurozone and non-eurozone countries is much smaller (46% and 40% respectively). 22

25 2.3. The situation of young people When asked to compare the situation of young people in their country with that of their European neighbours, a majority of Europeans are negative about their country: 59% describe the situation as less good, while only 35% say better. Once again, there are wide variations between Member States. A majority of respondents in ten countries think that the situation is better in their country: Denmark (82%), Austria (82%), Finland (77%), Luxembourg (76%), the Netherlands (76%), Sweden (74%), Germany (73%), Belgium (63%) and, by a narrow majority, France (46%) and Malta (45%). Respondents believe that the situation of young people is worse in their country than elsewhere in Greece (98%), Hungary (91%), Lithuania (90%), Spain (88%) and Portugal (88%). A socio-demographic analysis does not reveal any differences by age of the respondents: 37% of year-olds say that the situation in their country is better than elsewhere, compared with an average of 35%. On this question, as with the previous questions, the level of education and social status of the respondents are more discriminatory factors: 43% of the most educated respondents consider that the situation of young people in their country is better than in the European average, compared with only 26% of those who left school before the age of 16. This view is shared by 44% of those who almost never have difficulties paying their bills, but by only 17% of those who have difficulties most of the time. 23
.")
26 2.4. The situation of the environment A majority of Europeans consider that current situation of the environment in their country is better than the EU average: 53% versus 38%. This proportion has increased by 3 percentage points since spring 2010 (EB73). A majority of people polled in sixteen Member States say the situation of the environment is better in their country, notably in the Nordic countries: Finland (94%, including 33% who replied much better ), Denmark (92%) and Sweden (92%). These respondents were also the most positive about the quality of life in their country. Respondents in Hungary (74% say that situation is less good ), Romania (74%), Bulgaria (73%), and Greece, Italy and Portugal (all 63%) are the most negative about the situation of the environment in their country. 24

27 3. Economic aspects 3.1. Evaluation of the current economic situation The national, European and world situations Opinions of Europeans about the economic situation in their country are more or less unchanged, after having deteriorated sharply in autumn 2011: more than seven out of ten Europeans consider that it is bad (71%, =), while 27% say it is good (-1). Three out of ten Europeans still describe it as very bad (30%, -1, following a 6-point rise in EB76 of autumn 2011). Opinions of the European economic situation, which had become far more gloomy in EB76 of autumn 2011 (77% described it as bad, a 16-point rise since EB75 of spring 2011), are now slightly less negative, but have not recovered the ground lost in autumn 2011: 75% of Europeans describe it as bad (-2, including 25% for whom it is very bad, -2), while 19% say it is good (+1). There has been a real shift of opinion as regards the situation of the economy in the world. The proportion of people who say that it is bad rose sharply in autumn 2011 (77%, +11), but has now fallen significantly (69%, -8), though without regaining the EB75 level of spring 2011 (66%). Just under a quarter of Europeans now consider that the situation of the world economy is good (22% +5) QA4. How would you judge the current situation in each of the following? 25
, while non-eurozone respondents are slightly more positive, and record a slightly higher result than previously (23%,")
28 Eurozone respondents continue to be slightly more upbeat than non-eurozone respondents about the national economic situation (29%, -1, versus 23%, +2), but the gap is narrowing. Only 17% of Eurozone respondents say that the European economy is good (stable), while non-eurozone respondents are slightly more positive, and record a slightly higher result than previously (23%, +3). Regarding the national economic situation: Only six Member States consider that the national economic situation is good: Sweden (83%), Luxembourg (82%), Germany (77%), Finland (68%), Austria (66%) and Denmark (55%). Denmark is also the only country in which opinions of the national economic situation have improved strongly (+12). However, they have also improved, albeit to a lesser extent, in Belgium (37%, +7 after -24 in autumn 2011) and Malta (41%, +7). However, in the Netherlands, favourable opinions have decreased fairly sharply and are now in the minority (40%, -16). They have also lost ground in Cyprus (14%, -7). Negative opinions continue to exceed 90% in eight Member States (Greece, Spain, Portugal, Ireland, Hungary, Italy, Bulgaria and Romania). In Greece, they are as high as 100% (including 82% describing the situation as very bad ) Regarding the European economic situation: Interviewed people are predominantly negative in all the Member States except for Lithuania, where opinions have improved significantly (48%, +12). In other countries, opinions are also more positive than in autumn 2011, notably in Estonia (36%, +12), Slovenia (27%, +10) and Denmark (21%, +12). Respondents are the most negative in Ireland (92% describe the situation of the European economy as bad, including 54% who consider that it is very bad ), Spain (90% and 40%) and Italy (90% and 36%). Half the UK respondents also described the economic situation in the European Union as very bad (50% out of a total score of 85% for bad ). 26
, Estonia (35%, +12), the Netherlands (32%, +12), Finland (39%, +11) and Sweden (29%, +13).")
29 Regarding the world economic situation: Lithuania is once again the only country where a majority of respondents are positive about the situation, with a significant improvement (46%, +11). The proportion of positive opinions has also increased sharply in Denmark (28%, +17), Estonia (35%, +12), the Netherlands (32%, +12), Finland (39%, +11) and Sweden (29%, +13). In the candidate countries: Opinions about the national economic situation are predominantly and increasingly negative in Turkey (45%, +10). However, negative views are now less widespread in the Former Yugoslav Republic of Macedonia (27%, -11). The latter is the only country in which a majority of respondents are still positive about the European economic situation (54%), but positive opinions have gained ground in Turkey (35%, +9). The same is true as regards the world economy (49%, +3 in the Former Yugoslav Republic of Macedonia, but also 32%, +10 in Turkey). Opinions on this subject have also improved in Iceland (21%, +10). People polled in Serbia are very negative about the economic situation in their country (89% say that it is bad ). However, they are slightly more positive than the European average about the economic situation in the European Union (62% consider that it is bad versus an average of 75%). Perceptions of the national economic situation compared with the European average When asked how the situation of their national economy compares with the EU average, 43% of Europeans say that the situation in their country is better. This represents a 5-point rise since EB73 of spring A smaller majority of people (51%, -3) continue to believe that the situation in their country is less good than elsewhere. Unsurprisingly, the countries in which the respondents are most likely to consider that their national economic situation is better than the European average are those in which they are the most positive about the national economy: Sweden (94%), Denmark (91%), Finland (90%), Luxembourg (89%), Austria (86%) and Germany (85%). 27
, Bulgaria (94%), Hungary (90%) and Spain (89%).")

30 Conversely, the respondents who make comparisons which are least favourable to their country are those who are the most gloomy about their national economy, led by respondents in Greece (99% say that their situation is less good, including 79% for whom it is definitely less good ), Bulgaria (94%), Hungary (90%) and Spain (89%). Points of note: an unchanged proportion of Europeans who say that the economic situation in their country is bad nevertheless believe that it is better than in the rest of Europe: 30% (+1). The most significant evolutions since EB73 of spring 2010 include: A significant rise in the numbers who say that their national economic situation is better than average in the United Kingdom (63%, +21), Malta (53%, +17), Belgium (67%, +15), France (57%, +13) and Germany (85%, +11). A sharp deterioration in judgements in Cyprus (42%, -21), Italy (13%, -12) and the Netherlands (74%, -11). 28
.")
31 A socio-demographic analysis reveals very striking divisions. The Europeans who studied the longest look more favourably than the least educated respondents on the economic situation in their country (33% versus 19%). They are also far more likely to say that it is better than elsewhere, with an even more pronounced differential (52% versus 34%). The same is true of managers, 40% of whom say that the national economic situation is good (versus 29% of white-collar workers, 26% of manual workers and only 14% of unemployed people) and 60% of whom believe that it is better (versus 46% of white-collar workers, 45% of manual workers and 29% of unemployed people). Similarly, Europeans who never or almost never have difficulties in paying their bills are also likely to view their national economy in a favourable light (36% versus 11% of those who have difficulties most of the time; 54/24 for the comparison with the EU average). 29

32 Employment The opinions of European about the employment situation in their country are fairly stable: a clear majority of respondents continue to say that it is bad (77%, -1, versus 21% for good, unchanged). However, almost four out of ten Europeans think that their national employment situation is better than the European average (38%). Although this is still the minority opinion (57% say that it is less good ), this proportion has increased significantly since EB73 of spring 2010 (+8), when only 15% of Europeans believed that the employment situation in their country was good. A majority of respondents believe that the national employment situation is good in only four Member States: Austria (64%), Germany (62%), Luxembourg (57%) and Finland (55%). Logically, these countries also figure among those that consider that their national situation is better than the EU average. Denmark is an interesting case: positive opinions of the national employment situation are still in a minority, though they have gained ground significantly (39%, +9), but this is the country where interviewed people are the most likely to believe that the situation is worse elsewhere (88% consider that the situation in their country is better than the EU average). 30
, Spain (99% and 92%),")
, Italy (95% and 87%) and Bulgaria (94% and 96%). 3.")

")
33 The countries that are the most critical of the national employment situation, whether in itself or in comparison with the other European countries, include Greece (100% replied bad and 98% replied less good than the EU average), Spain (99% and 92%), Portugal (98% and 89%), Hungary (96% and 88%), Ireland (96% and 83%), Italy (95% and 87%) and Bulgaria (94% and 96%) Public finances Asked for the first time to compare the situation of public finances in their country with the EU average, a majority of Europeans consider that their national situation is less good than elsewhere: 54%, while 37% think that it is better. Just over two in ten Europeans even say that it is definitely less good (21%). The answers to this question reveal very pronounced differences between the EU15 countries (44% better versus 48% less good ) and the NMS12 countries (13% versus 74%). However, the differences between Eurozone countries (39% versus 54%) and non-eurozone countries (33% versus 54%) are far less pronounced. 31
, Spain (86%), Italy (85%) and Portugal (85%), ahead of Hungary")

34 The most critical people include those who were previously the most negative about their national economic situation, led by Greece (98% describe their situation as less good, including 77% for whom it is definitely less good ), Spain (86%), Italy (85%) and Portugal (85%), ahead of Hungary (84%), Ireland (83%), Latvia (83%) and Slovenia (83%). In ten Member States, the majority of the respondents consider that their country s public finances are in a better state than the European Union average. The highest scores were recorded in Finland (88%), Sweden (86%), Luxembourg (84%) and Denmark (83%). 32
, the economic forecasts of Europeans for the next twelve months are less gloomy.")
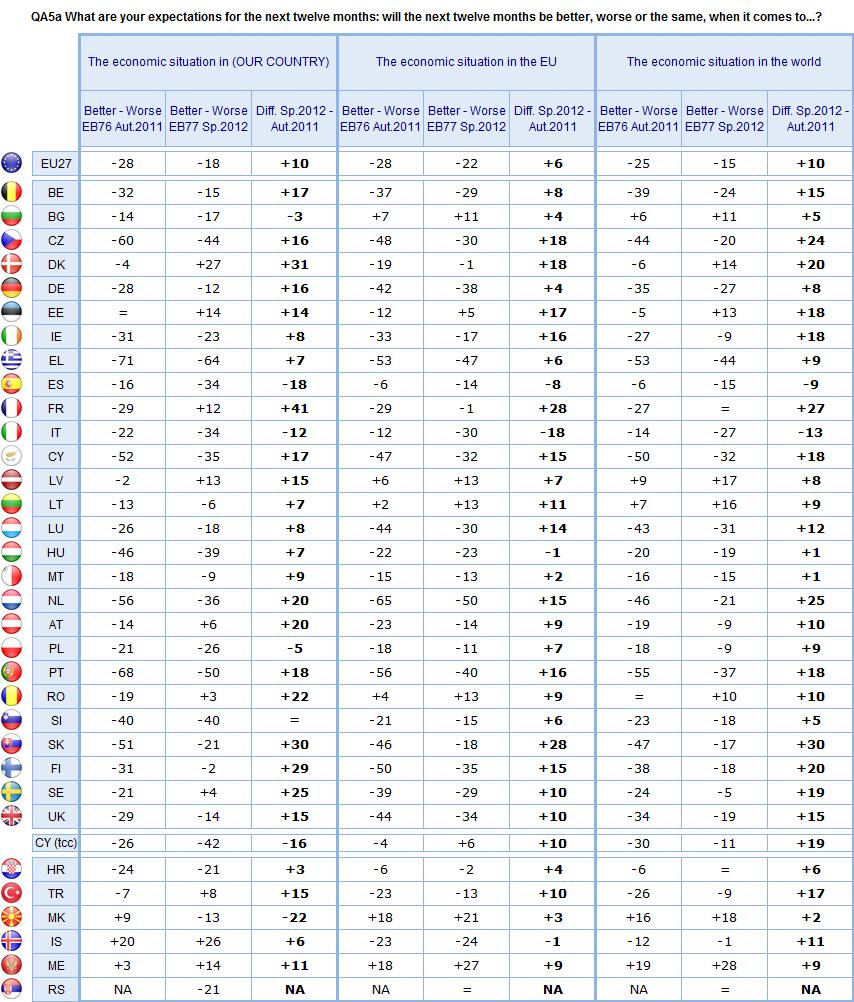
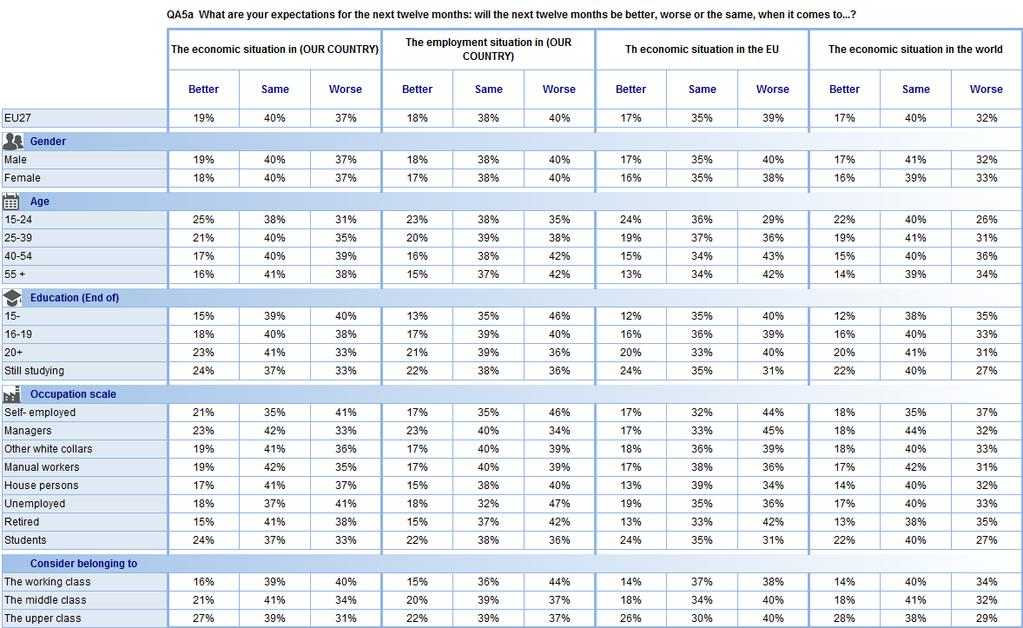
35 3.2. Expectations for the next twelve months The national, European and world situations After a sharp deterioration in autumn 2011 (EB76), the economic forecasts of Europeans for the next twelve months are less gloomy. Although it would not be accurate to talk of renewed optimism, the feeling that things will stabilise has gained ground, while at the same time pessimism has decreased. A majority of respondents now consider that the national economic situation will stay the same over the next twelve months (40%, +4). Pessimism still outweighs optimism, but has declined (37%, -7) and the feeling that the next twelve months will be better has gained ground (19%, +3). Forecasts for the European economic situation are also brighter, but respondents remain more divided than in the case of the national economy: although pessimism has decreased, pessimists are still in a majority (39%, -5). More than a third of Europeans now believe that things will stay the same (35%, +4). Europeans who believe that the next twelve months will be better are still in a minority, with a more or less unchanged score (17%, +1). Finally, pessimism has fallen the most sharply in respect of the world economic situation: 40% of Europeans think that it will stay the same (40%, +6), while 32% believe that the next twelve months will be worse (-9) and 17% think that they will be better (+1). 33
36 Expectations regarding the national economic situation are fairly similar in the EU15 countries (where 40% believe that the economic situation will stay the same) and in the NMS12 countries (42%); the same holds true for the Eurozone countries (39%) and the non-eurozone countries (42%). However, forecasts regarding the European economic situation reveal that respondents in the EU15 countries are far more pessimistic (42% think that the next twelve months will be worse ) than those in the NMS12 countries (26% versus 42% for same ). This is also true for the Eurozone countries (41%) compared with the non-eurozone countries (35%). Forecasts for the national economic situation: The optimism index has moved back into positive territory in seven Member States, in some cases with very strong improvements: in Denmark (the index is +27, a 31-point rise since EB76 of autumn 2011), Estonia (+14 and +14), Latvia (+13 and +15), France (+12 and +41, the largest rise seen in any Member State), Austria (+6 and +20), Sweden (+4 and +25) and Romania (+3 and +22). Although respondents are still predominantly pessimistic, the optimism index for the national economic situation has also improved significantly in the Netherlands (to -36, but with a rise of +20 percentage points), Slovakia (-21 but +30) and Finland (-2 but +29). The two countries which continue to have the weakest optimism index, despite an improvement, are Greece (-64, after an increase of +7 percentage points) and Portugal (-50 and +18). The optimism index has declined in four Member States: Spain (-34 and -18 versus EB76), Italy (-34 and -12), Poland (-26 and -5) and Bulgaria (-17 and -3). The optimism index for the economic situation in the European Union and in the world is positive in five Member States: Bulgaria (+11 for Europe /+11 for the world), Estonia (+5/+13), Lithuania (+13/+16), Latvia (+13/+17) and Romania (+13/+10). In Denmark, the optimism index is negative for the EU (-1), but positive for the world economy (+14). The countries with the weakest optimism index readings for the EU economic situation are the Netherlands (-50), Greece (-47) and Portugal (-40), but the index has nevertheless improved in all three countries (rising by +15, +6 and +16 percentage points respectively since EB76). The optimism index for the European economy has fallen in three countries: Italy (-18 percentage points, with an index of -30), Spain (-8 and -14) and Hungary (-1 and -23). 34
37 35
38 In the candidate countries: Expectations have improved at all levels in Turkey: the national index is now positive (+8 after an increase of 15 percentage points); respondents are still predominantly pessimistic about the economy in the European Union and the world, but the indices have improved (+10 since EB76 for the economic situation in the European Union and +17 for the world). The trend is similar in Montenegro, where the three indices are positive. In Iceland, the national index is still positive (+26), but forecasts for the European Union are still negative (-24). In Serbia, where the question was asked for the first time, the optimism index for the national situation is slightly more pessimistic than the European average (-21). But forecasts for both the European and world economic situations are more optimistic (the proportion of respondents who expect the coming months to be better is the same as that of those who expect them to be worse ) The employment situation After increasing significantly in autumn 2011, pessimism about the national employment situation has fallen, while remaining the majority opinion: 40% think that the next twelve months will be worse (-6 percentage points) and 38% think that things will stay the same (+3). Optimism has gained a few points (18%, +3). 36
39 The optimism index for the national employment situation has improved in the vast majority of Member States (after declining sharply in autumn 2011). It is positive in five Member States (compared with two in the EB76 survey) as a result of some significant rises: in Denmark (the index is +24, a 22-point rise since autumn 2011), Estonia (+15 and +17), Latvia (+12 and +9), France (+9 and +43, being the largest improvement of any Member State) and Sweden (+2 and +27). Despite an improvement, Greece (index of -69 despite an increase of 7 percentage points) and Portugal (-59, +12) remain the most pessimistic countries. This index has nevertheless fallen in five Member States, notably in Spain (-21 since EB76 to -39) and Italy (-16 to -41) and, to a lesser extent, Bulgaria (-6 to -30), Hungary (-2 to -44) and Slovenia (-2 to -48). In the candidate countries, Iceland continues to be an exception, with an optimism index for the national employment situation significantly above the European average (+37. a 14-point rise since EB76). In Serbia, pessimism easily outweighs optimism with an index of
40 38
. These economic issues are therefore more prominent than social or societal issues.")
41 3.3. The main national concerns Europeans consider that the most important issue facing their country is unemployment (46%), followed by the economic situation (35%) and rising prices (24%). Government debt also seems to be a central concern (19%). These economic issues are therefore more prominent than social or societal issues. Nonetheless, 12% of respondents mentioned health and social security, closely followed by crime (11%), ahead of pensions (9%), the education system (8%) and immigration (8%). Another more economic issue, taxation (9%), obtained a similar score. Housing (4%) and the environment, climate and energy issues (4%) are seen as less pressing issues. Only 2% of Europeans mentioned terrorism as an important issue facing their country. 39
42 It is not possible to measure the evolutions against the results of the previous survey because of several changes made to the question asked*. It will be remembered that EB76 of autumn 2011 saw a shake-up in the order of the national concerns of Europeans, with the economic situation returning the forefront for the first time since the beginning of In EB76, the three main issues facing the country were the economic situation (46%), unemployment (45%) and rising prices/inflation (27%). * In this Eurobarometer survey, certain items have been deleted or changed: The addition of Public debt (which may have resulted in fewer respondents mentioning the economic situation in the broad sense) Environment, climate change and energy issues have been combined under the item the environment, climate and energy issues Healthcare has been transformed into health and social security The order in which national concerns are ranked is slightly different in Eurozone and non- Eurozone countries. The three most frequently mentioned concerns are the same, namely unemployment, the economic situation and rising prices. However, people polled in the Eurozone countries rank government debt in fourth place, with a high score of 23%, while respondents outside the Eurozone seem more preoccupied with health and social security (15%, compared with only 12% for government debt) and crime (14%). Unemployment tops the list of concerns in 17 Member States, led by Spain (76%), where, as we have seen, forecasts for employment are increasingly gloomy, but also in Portugal (68%), Sweden (63%) and Ireland (62%). The economic situation is the main national concern in six Member States: Greece (66%), the Netherlands (56%), Slovenia (55%), Romania (45%), the Czech Republic (39%) and Belgium (27%). Rising prices are seen as the most pressing concern in Estonia (51%), Malta (42%) and Austria (37%). Government debt is the main concern in Germany (37%), and was also mentioned by a large proportion of people polled in the Netherlands (28%) and Austria (27%), where it is ranked as the second most worrying issue. Other points of note: Respondents in Finland are very concerned about health and social security (33%, in 2nd place behind unemployment). Respondents in Bulgaria are very conscious of the issue of crime (21%). In Italy, taxation figures prominently (29%). Immigration was mentioned very frequently in Malta (25%). Respondents in Sweden are very likely to mention the education system (25%), and environment, climate and energy issues (20%). In Luxembourg, housing is the second most important concern (36%), after unemployment (38%). 40
. Turkey is the exception since respondents are above all worried about terrorism (62%, in first place).")
43 In the candidate countries: Almost all candidate countries are preoccupied by either unemployment (Croatia, the Former Yugoslav Republic of Macedonia and Serbia) or the economic situation (Iceland and Montenegro). Turkey is the exception since respondents are above all worried about terrorism (62%, in first place). Crime was mentioned far more frequently than the European average in Montenegro (40%), the Former Yugoslav Republic of Macedonia (30%), Croatia (29%) and Serbia (29%). A socio-demographic analysis does not reveal any striking differences, given the strong concerns in all categories about unemployment and the economic situation. However, self-employed people and managers are more likely to be worried about government debt, whereas this issue seems of less interest to white-collar workers, manual workers and unemployed people, who worry more about rising prices. 41
, although it is mentioned slightly less often than in autumn 2011 (-5 percentage points).")
. Rising prices is in fourth place (15%, -2).")
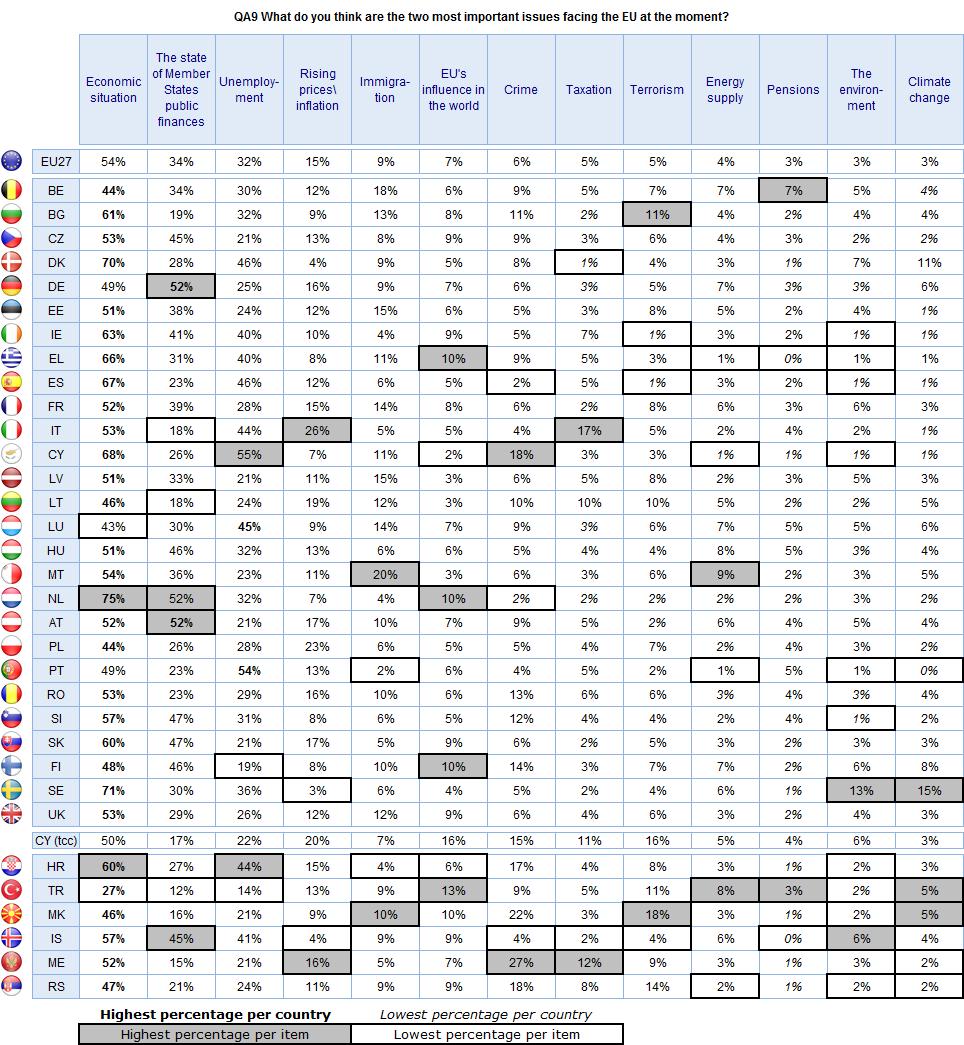
44 3.4. The main concerns at European level The order of importance in which Europeans rank the issues facing the European Union is the same as in autumn 2011, though the salience of certain issues has changed. The economic situation is still seen as the most important issue (54%), although it is mentioned slightly less often than in autumn 2011 (-5 percentage points). The state of the Member States public finances remains the second most important issue facing the EU in the eyes of Europeans, with a higher score than in autumn 2011 (34%, +3), followed by unemployment, also with a higher score (32%, +6). Rising prices is in fourth place (15%, -2). The next highest scores, in proportions in line with those noted in autumn 2011 (EB76), were recorded for immigration (9%), the EU s influence in the world (7%), crime (6%) and taxation (5%). Although terrorism was mentioned slightly less frequently than in autumn 2011 (5%, -2), it is still placed ahead of energy supply (4%, =), pensions (3%, =), climate change (3%) and the environment (3%). On the whole, perceptions of the most important issues facing the European Union are fairly similar in Eurozone and non-eurozone countries, despite different levels of mentions. For example, Eurozone respondents are more likely to cite the public finances of the Member States (36% versus 29% in non-eurozone countries) and unemployment (34% versus 28%). 42
45 Points of note: The economic situation is seen as the main problem facing the European Union in almost all Member States, except for Germany, which lends more importance to the state of the public finances of Member States (52%), Luxembourg, where unemployment tops the list of European concerns (45%) and Austria, where the state of the public finances of Member States is ranked equally with the economic situation (both 52%). The state of the public finances of Member States was mentioned far more frequently than in autumn 2011 in France (39%, +8), Hungary (46%, +8), Ireland (41%, +7) and Portugal (23%, +7). Mentions of unemployment have increased more spectacularly, most strikingly in Luxembourg (45%, +19), but also in the Netherlands (32%, +16), Portugal (54%, +13), Denmark (46%, +12), Germany (25%, +12) and Sweden (36%, +12). These increases are correlated in some cases with declining mentions of the economic situation (-13 in Denmark and -10 in Luxembourg). Respondents in the candidate countries also see the economic situation as the main problem facing the European Union. While respondents in Iceland rank the state of the public finances of Member States in second place, respondents in the Former Yugoslav Republic of Macedonia and Montenegro attach more importance to crime. In Serbia, unemployment is ranked in second place among European concerns, after the economic situation, with the state of the public finances of Member States in third place. People polled in Serbia are also more likely than average to mention crime (18%) and terrorism (14%) among the most important issues facing the EU. 43
46 44

47 Strictly speaking, personal, national and Europeans concerns cannot be compared directly, because the lists of items are not identical. Nonetheless, we note that: Economic issues continue to outweigh social and societal issues at personal, national and European levels. At national and European levels respondents are particularly attentive to the issue of government debt. However, personal concerns continue to be dominated by prices, an issue with a day-to-day impact. And, against the background of a slight easing of opinions and forecasts about the broader economy at world level, Europeans are more focused, both personally and on behalf of their country, on the issue of unemployment, which also has more impact on their day-to-day lives. Personal concerns about immigration and crime have fallen sharply. However immigration has gained ground at European level, while crime is more meaningful at national level. 45
48 4. Political aspects 4.1. Interest in politics The index of interest in politics, constructed using the answers to questions on the interviewed people s interest in local, national and European politics, has recorded very few changes 13 : a majority of respondents are still moderately interested in politics (44%, unchanged since EB76 of autumn 2011). People who follow politics very closely ( strong interest) represent 16% of the respondents (+1 percentage point since autumn 2011, but +3 compared with EB74 of autumn 2010). Just under a quarter of Europeans are slightly interested in politics (23%, unchanged) and 17% (-1) are not at all interested. All in all, six out of ten Europeans are interested, either strongly or moderately, in politics. In more detail, the national analysis shows that people polled in Greece are particularly interested in politics (45% have a strong interest), with an increase of 9 percentage points, following a 5-point rise in autumn Respondents in the Netherlands are also far more interested in politics than average and their interest has grown (31%, +5). While remaining below the average, interest in politics has also increased in Italy (15%, +5). These changes can undoubtedly be attributed in part to tensions around the economic situation in their country. A socio-demographic analysis shows that the interviewed people s interest in politics: Increases with age, since 8% of year-olds have a strong interest in politics, compared with 19% of those aged 55 or over. However, when we aggregate the strong and moderate categories, respondents in the age group are the most likely to be interested in politics (66%, versus 61% of those aged 55 or over and 45% of those aged 15 to 24). Interest is far more pronounced among the respondents who studied the longest (72% of those who studied up to the age of 20 or beyond have a strong or moderate interest in politics compared with 49% of those who left school before the age of 16). Managers (75%) are also more likely than white-collar (65%) and manual workers (57%) to be interested in politics. Europeans were also asked whether they ever tried to persuade their friends, relatives or fellow workers to share their views when they hold a strong opinion 14. More than half of the people (52%) answered never (23%) or only rarely (29%). However 36% do so from time to time and 11% replied often (proportions in line with those recorded in EB76). 13 A score was attributed to each answer: Never = 0; Occasionally = 1; Often = 2. An index was then constructed by adding together the scores for the three dimensions (local, national and European). Each group corresponds to a different index level: not at all interested in politics = 0; slightly = 1 to 2; moderately = 3 to 4; strongly = 5 to QA3 When you hold a strong opinion, do you ever find yourself persuading your friends, relatives or fellow workers to share your views? Does this happen? Often; From time to time; Rarely; Never. 46
 represents 15% of Europeans (unchanged), the second (+) 35% (+1 percentage point), the third (-) 28% (unchanged) and the last (--) 22% (-1).")

49 This question, combined with the index of interest in politics, has enabled us to construct an opinion leadership index 15. This index is generally unchanged since autumn The first group (++) represents 15% of Europeans (unchanged), the second (+) 35% (+1 percentage point), the third (-) 28% (unchanged) and the last (--) 22% (-1). This index reveals the same divisions as those measured for interest in politics, but with some slight differences: In terms of age, 55% of the youngest respondents belong to the (++) and (+) groups combined, compared with only 43% of those aged 55 or over. This (++) and (+) grouping also reveals a division in terms of education: 59% of the Europeans who studied up to the age of 20 or beyond belong to this group, compared with only 37% of those who left school before the age of 16. Occupation is also a determinant: 61% of managers, 51% of white-collar workers employees and 50% of manual workers belong in this group Trust in institutions After a significant decline in autumn 2011, trust in national institutions has risen, though without returning to the levels of spring 2011 (EB75): 28% tend to trust their government (+4, but following an 8-point fall in EB76 of spring 2011), while distrust is still in the majority, despite a decrease (67%, -3). A similar proportion of respondents trust their national parliament (28%, +1, versus 66%, unchanged). The only three Member States where a majority of respondents trust both their government and their parliament are Luxembourg (68% and 55% respectively), Sweden (58% and 70%) and Finland (57% and 59%). Opinions are evenly divided in Austria (48% trust and 48% distrust both institutions). 15 This index is divided into 4 groups (1. ++; 2. +; 3. -; ). If a respondent often or from time to time tries to persuade someone, or regularly discusses politics then they are considered as an opinion leader in category 1 (++). Conversely, if a respondent never or rarely tries to persuade someone or never discusses politics, they are considered not to be an opinion leader and fall into category 4 (--). 47
50 Trust in national institutions has increased significantly in several countries which have experienced major political changes since autumn 2011 (EB76), although distrust is still more widespread. This is the case in France, after the presidential election (44%, +23 for the government and 42%, +16 for the national parliament), Slovakia following the parliamentary elections in March (43%, +22 and 39%, +14), Slovenia which saw a change of government in February (22%, +10 and 18%, +8), Romania where the government changed at the beginning of May (27%, +17 and 16%, +7), and Belgium, where the coalition government was formed just after the last EB76 survey (44%, +10 and 46%, +4). Trust in national institutions has declined significantly in Bulgaria (28%, -10 and 17%, -8). In the candidate countries: Turkey is still the only country where a (rising) majority of interviewed people trust both the government (57%, +8) and the national parliament (54%, +10). However, levels of trust have also improved in Croatia which had a change of government shortly after EB76 of autumn 2011 (27%, +18 and 20%, +11). Trust in political parties has also improved slightly, but is still significantly outweighed by distrust (18%, +4 percentage points, versus 78%, -3) in all Member States. However, there have been significant improvements since autumn 2011 in France (25%, +16), Sweden (42%, +12) and Slovakia (26%, +10). Trust in regional and local public authorities continues to decline (43%, -2, versus 51% distrust, +3). However, it is still the majority opinion in 11 Member States (opinion is equally divided in two further countries), led by Luxembourg (74%), Denmark (71%), Austria (65%) and Sweden (65%). In Malta, trust has regained the ground lost in autumn 2011 (44%, +11), whereas it has fallen sharply in Spain (21%, -11). Trust in the United Nations, which had already fallen by 3 percentage points in the last survey, has lost a further 3 points and is now the minority opinion (42%, versus 45% distrust, +4 and +8 since EB75 of spring 2011). However, a majority of people polled in 19 Member States still trust this organisation, notably in Sweden (75%), Denmark (73%) and Finland (71%). However, trust in the UN has declined, in some cases sharply, in Greece (only 16% trust it, -3 percentage points), Cyprus (21%, -8), Spain (24%, -14), Italy (26%, -8), Slovenia (34%, =), Portugal (36%, -3), Romania (41%, -2), and Germany (42%, +1). 48
.")
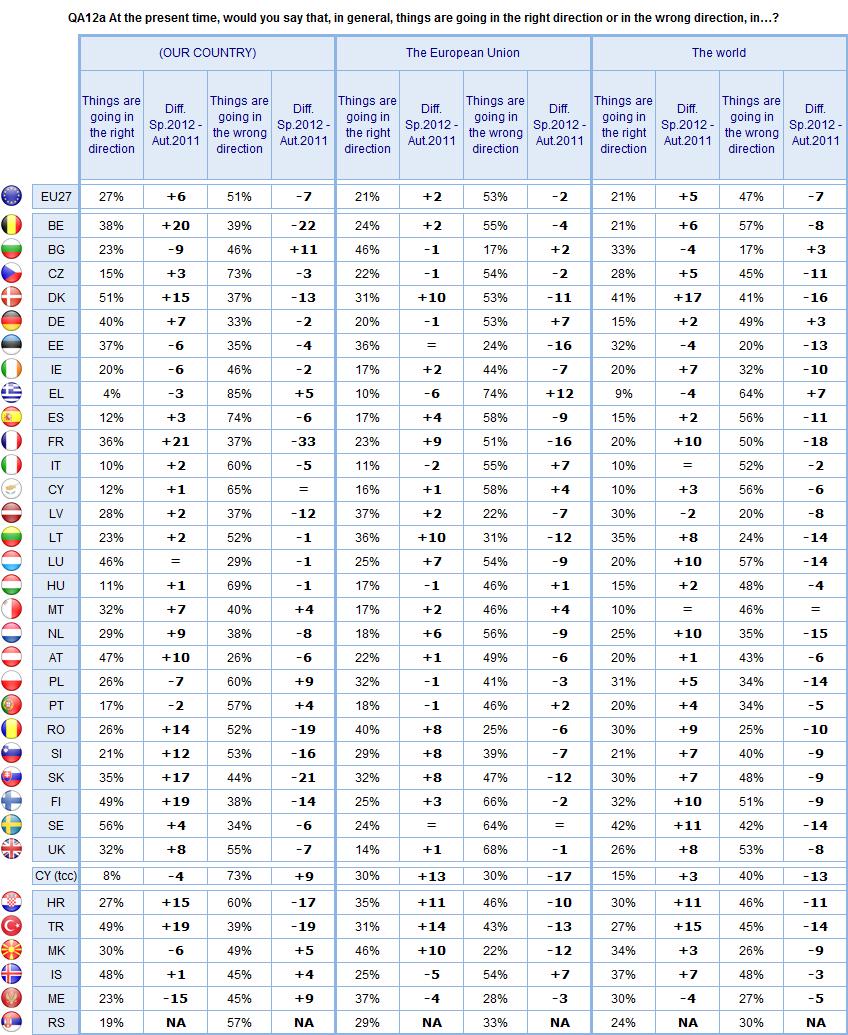
51 4.3. The direction in which things are going The impression that things are going in the wrong direction, whether at national, European or world level, had increased significantly in autumn 2011 (EB76). This opinion is still shared by a large majority of respondents, but has lost some ground: 51% think that things are going in the wrong direction in their country (-7 percentage points, while 27% think things are going in the right direction, +6), 53% in the case of the European Union (-2, versus 21%) and finally 47% think that things are going in the wrong direction in the world (-7, versus 21%, +5). A majority of respondents in seven Member States (up from only four in the last survey) now believe that things are going in the right direction in their country. In some cases, this follows a marked improvement in judgements: Sweden (56%, +4), Denmark (51%, +15), Finland (49%, +19), Austria (47%, +10), Luxembourg (46%, =), Germany (40%, +7) and Estonia (37%, -6). In other countries, while there is no majority consensus that things are going in the right direction nationally, opinions have improved significantly. This is so in France (36%, +21), Belgium (38%, +20), Slovakia (35%, +17) and Romania (26%, +14). Respondents in Greece (85% think that things are going in the wrong direction, +5), Spain (74%, -6) and the Czech Republic (73%, -3) remain extremely critical. Opinions have deteriorated sharply in Bulgaria (46% replied wrong direction, +11) and Poland (60%, +9). Positive opinions on the direction in which things are going in the European Union outweigh negative ones in five Member States (compared with three in autumn 2011): Bulgaria (46%, -1), Romania (40%, +8), Latvia (37%, +2), Lithuania (36%, +10) and Estonia (36%, =). While remaining predominantly negative, judgements have improved noticeably in Denmark (31%, +10) and France (23%, +9). 49
52 The impression that things are going in the wrong direction in the European Union has decreased in most European countries, but remains strong. Respondents in Greece are the most critical, and opinions are hardening (74% think that things are going in the wrong direction, +12). They are also particularly critical in the United Kingdom (68%, -1), Finland (66%, -2) and Sweden (64%, unchanged). Points of note: the impression that things are going in the wrong direction nationally has declined significantly in the Eurozone countries (48%, -10, versus 27%, +8 in the right direction), but less so in the non-eurozone countries (55%, -4, versus 29%, +4). The difference in perceptions of the situation in the European Union is less pronounced (54%, -2 in the Eurozone 50%, -2 in the non-eurozone countries). The impression that things are going in the right direction at world level is shared by a majority of respondents in the same five Member States as for the EU (Bulgaria, Romania, Latvia, Lithuania and Estonia, equally with the spontaneous answer neither the one nor the other in this last case). It has also gained significant ground in Denmark (41%, +17), Sweden (42%, +11), France (20%, +10), Luxembourg (20%, +10), the Netherlands (25%, +10) and Finland (32%, +10). In the candidate countries: There are signs of a clear improvement in morale in Turkey, since the impression that things are going in the right direction has gained significant ground for the national (49%, +19, now the majority), European (31%, +14) and world (27%, +15) levels. The trend is similar in Croatia (27%, +15, 35%, +11 and 30%, +11). 50
53 51
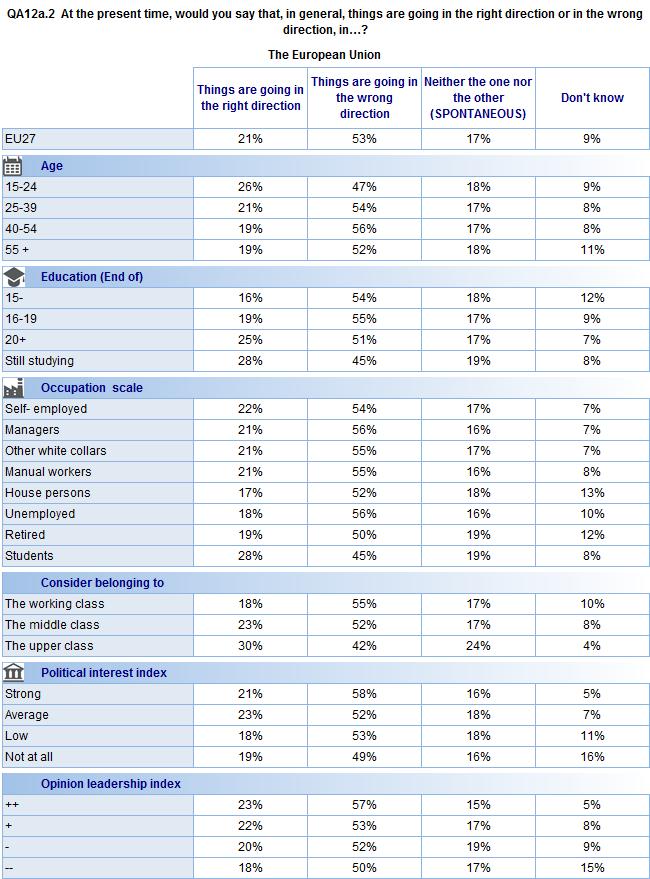
54 A socio-demographic analysis reveals few differences in the answers regarding the direction in which things are going in the European Union: a clear majority of respondents still consider that things are going in the wrong direction. However: This opinion is slightly less widespread among young people (47% of yearolds) and students (45%) compared with an average of 53%, whereas it stands at 56% in the age group. There are no perceptible differences on this question between managers (56%), white-collar workers (55%) and manual workers (55%), or indeed unemployed people, who are now less critical (56%, -5). However, this feeling is still more common among the Europeans who have difficulties paying their bills (59% versus 51% of those who almost never have such difficulties). Europeans who have strong interest in politics are more likely to share this view (58%, compared with 53% among those who are slightly interested in politics and 49% of who are not at all interested). A similar difference is also apparent for the opinion leadership index: 57% of respondents with the strongest index (++), versus 50% of those with the lowest index (--). But the former are also more likely than the latter to consider that things are going in the right direction (23% versus 18%). 52
55 53
, the freedom to travel, study")
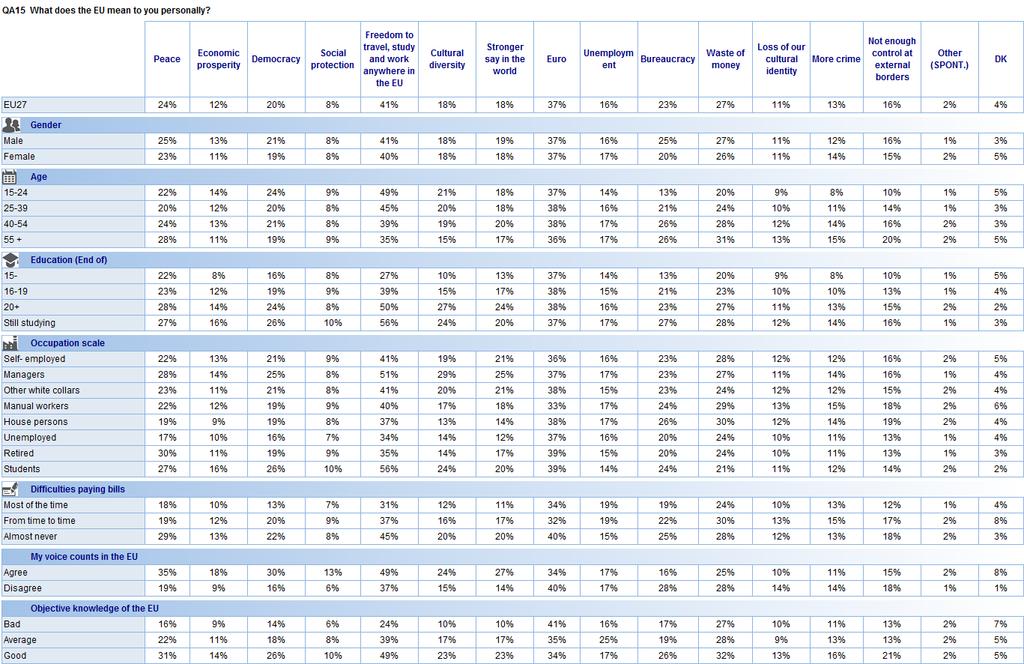
56 II. THE EUROPEAN UNION AND ITS CITIZENS 1. Attachment to the European Union 1.1. What does the European Union mean to citizens? The European Union s identity remains firmly based in freedom of movement and the euro With scores of 41% and 37% respectively (unchanged since the autumn 2011 survey), the freedom to travel, study and work anywhere in the EU and the euro easily top the list of depictions associated with the European Union, with waste of money (27%, -1 percentage point) in third place, followed by peace (24%, +3), bureaucracy (23%, unchanged) and democracy (20%, -1). This indicator is characterised by great stability, demonstrating the deep-rooted nature of the symbols of the European Union in European eyes. The only striking change in this survey is the increase in the score recorded for peace 16. In all countries or groups of countries, the most frequently mentioned symbol is either the freedom to travel, study and work anywhere in the EU or the euro, except in the United Kingdom where waste of money tops the list (30%, versus 27% and 17% respectively). The ranking may then vary somewhat, depending on the countries concerned. For respondents in the Eurozone and EU15 countries, the euro is the leading symbol associated with the European Union (46% and 40% respectively), ahead of freedom of movement (40% and 38%) and waste of money (29% and 29%). The NMS12 interviewed people first associate freedom of movement with the European Union (50%), then democracy and the euro (ranked equally on 24%). Finally, in the non-eurozone countries, freedom of movement (42%) easily tops the list, followed by several closely grouped items: bureaucracy (23%), waste of money (22%), peace (21%), democracy (20%) and the euro (20%). 16 QA15. What does the EU mean to you personally? 54
57 A national analysis reveals that freedom of movement within the European Union is most frequently mentioned in the Nordic countries (60% in Sweden, 58% in Denmark and 56% in Finland) and the Baltic States (67% in Estonia, 63% in Lithuania and 61% in Latvia). People polled in Austria (69%), Slovakia (59%), Greece (57%), Belgium (54%) and Germany (52%) most often mention the euro as a symbol of the European Union, while in Austria they are also most likely to associate waste of money with the EU (58%, +5 percentage points), ranking this item in second place. However, this item has lost ground in Germany (45%, -4 percentage points) and France (30%, -8), since the previous survey. A socio-demographic analysis reveals that respondents under the age of 55 associate the European Union above all with freedom of movement within the EU (49% among year-olds, 45% among year-olds and 39% among year-olds), while the euro is the leading symbol of the EU for those aged 55 or over (36%). The oldest respondents (31% of those aged 55 or over) are more likely than the youngest group (20% of those aged 15 to 24) to associate the European Union with a waste of money. In general, this hold true for all the negative representations, in particular bureaucracy (26% of respondents aged 40 or over compared with 13% of year-olds) and not enough controls at external borders (20% of those aged 55 and over versus 10% of year-olds). There are more marked differences according to the interviewed people s level of education. Respondents who studied up to the age of 20 or beyond (50%) and students (56%) are far more likely than those who left school before the age of 16 (27%) to mention freedom of movement within the European Union. However, the identification of the European Union with a waste of money or unemployment is more widespread among the least educated respondents (33% and 21% respectively) than among those who studied beyond the age of 19 (22%, 10%) and students (16%, 12%). 55
58 Freedom of movement also tops the list in most occupational categories, notably among managers (51%) and students (56%). For house persons and unemployed people, the euro is the main symbol of the European Union. In general, managers are more likely than average to mention most of these items, in particular those with a positive connotation. This trend is also apparent in the categories of respondents for whom the European Union conjures up a positive image, such as those who never have difficulties paying their bills, and those who say that their voice counts in the European Union. In this last group, 49% mentioned the freedom to travel, study and work anywhere in the EU (compared with 37% of those who believe that their voice does not count in the European Union), 35% mentioned peace (versus 19%), 30% democracy (versus 16%), 27% a stronger say in the world (versus 14%) and 24% cultural diversity (versus 15%). Conversely, these respondents are less likely to associate the European Union with a waste of money (19%, compared with 32% of those who think that their voice does not count in the EU), bureaucracy (19%, versus 25%) and unemployment (12% versus 19%). Finally, respondents with a good objective knowledge of the European Union are more likely to mention most of these items: this applies not only to those with a positive connotation, such as the freedom to travel, study and work anywhere in the EU (49% versus 24% of those with a poor knowledge of the EU), and peace (31% versus 16%), but also to negative items, such as bureaucracy (28% versus 13%) and the waste of money (26% versus 21%). 56
59 57
60 1.2. Support for EU membership and the perceived benefits of membership (candidate countries) This Eurobarometer survey measures support for EU membership 17 and the perceived benefits of membership 18 in the candidate countries. These two questions were asked in the same countries in spring 2011 (EB75). They have now been asked for the first time in Serbia. After the referendum on 22 January 2012 approving Croatia s membership of the EU, support for EU membership has increased significantly in this country 19 : 38% of respondents in Croatia (+8 percentage points since spring 2011) believe that their country s membership of the European Union will be a good thing, whereas 26% (-8) take the opposite view. More than a third of respondents (34%, +2) say that EU membership will be neither good nor bad and 2% (-2) expressed no opinion. For the first time in the Eurobarometer survey, more respondents in Croatia approve of the country s membership of the European Union than disapprove. This change is based on a far more positive perception of the benefits of EU membership: 51% of people polled in Croatia (+9) consider that their country will benefit from membership, whereas 39% (-8) believe that it will not. In one year, the ratio of opinions on the benefits of membership has therefore been totally reversed in Croatia. A large majority of respondents in the Former Yugoslav Republic of Macedonia continue to support membership: 62% (-3 percentage points since spring 2011) of these interviewed people would regard membership in a positive light. And 70% (-4) are convinced that their country would benefit from EU membership. A majority of respondents in Montenegro still support EU membership, but this support has fallen sharply, from 58% to 47%, in the year. However, it is indecision rather than opposition which has grown: the neutral response that membership would be neither good nor bad has gained seven percentage points (31%), while negative opinions have only seen a 2-point rise (14%). Although a majority of respondents are still convinced of the benefits of EU membership (55%), another sign that doubts are rising is the fact that this majority has fallen significantly in the year (-12). 17 QA10a. Generally speaking, do you think that (OUR COUNTRY) s membership of the EU would be a good thing, a bad thing, neither good nor bad? 18 QA11a. Taking everything into consideration, would you say that (OUR COUNTRY) would benefit or not from being a member of the EU? % of Croats voted yes to EU membership in the referendum on 22 January 2012, which was marked by a low turnout (43.5%). 58
61 The ratio of opinions on EU membership has narrowed considerably in Turkey: 37% of the respondents (-4 percentage points) are in favour, 35% (+6) are against, 16% (-4) gave a neutral response and 12% (+2) expressed no opinion. In one year, the ratio of support to opposition for Turkish membership has thus narrowed from 41%:29% to 37%:35%. Respondents in Turkey are less convinced of the benefits of membership than a year ago: 44% (-4) say that Turkey would benefit from joining the EU, while 37% (-1) take the opposite view and 19% (+5) expressed no opinion. A majority of the respondents in Iceland opposed EU membership in previous surveys and their opposition has now strengthened: 46% (+5 percentage points) of people polled in Iceland believe that membership would be a bad thing, while 21% (-5) consider that it would be a good thing, 30% (+2) think that it would be neither good nor bad and 3% (-2) expressed no opinion. Opposition to EU membership can be attributed to the widespread and fast-growing belief that Iceland would not benefit from joining the EU: 64% of the respondents in Iceland (+10) consider that their country would not benefit. Finally, a relative majority of people polled in Serbia, where these questions were asked for the first time, are in favour of EU membership (40% versus 24%, while 28% say that membership would be neither good nor bad). This support is based the perception that membership would be in Serbia s interest: 49% of the respondents consider that Serbia would benefit from joining the EU, while 31% take the opposite view and 20% expressed no opinion. 59
 are satisfied today with the way democracy")
62 2. Democracy in the European Union 2.1. Perceptions of how democracy works at national and European levels The way in which democracy works at national level More than half of Europeans (51%) are satisfied today with the way democracy works in their country, while 47% are dissatisfied and 2% expressed no opinion 20. Although the evolutions since the autumn 2011 survey are minor, the opinion ratio has continued to narrow. Positive opinions have decreased by one percentage point since autumn 2011 (EB76), by three points since spring 2010 (EB73) and by seven since autumn 2007 (EB68). Over the same period, dissatisfaction with how national democracy works has increased by one, three and eight percentage points respectively. As in the previous survey, respondents are predominantly satisfied with the way national democracy works in 13 of the 27 EU countries. Satisfaction is greatest in the Nordic countries (87% in Denmark, 85% in Sweden and 77% in Finland), the Benelux countries (84% in Luxembourg, 78% in the Netherlands and 68% in Belgium), and Germany (70%). However, people polled in 14 Member States are predominantly dissatisfied, most strikingly in Greece (85%), Lithuania (79%), Romania (78%), Bulgaria (78%), Portugal (77%), Hungary (73%), Italy (72%), Slovenia (69%) and the Czech Republic (67%). 20 QA20a. On the whole, are you very satisfied, fairly satisfied, not very satisfied or not at all satisfied with the way democracy works in (our country)? 60
63 This indicator reveals a clear divide between the EU15 countries, where a majority of respondents are satisfied with the way national democracy works (55% versus 43%), and the NMS12 countries, where a large majority of interviewed people are dissatisfied (62% versus 34%). In contrast, the differences between the Eurozone countries (52% versus 47%) and the non-eurozone countries (49% versus 47%) are very minor. There have been some very contrasting evolutions between countries for this indicator. Undoubtedly as a result of the presidential election in May 2012, satisfaction with how democracy works has risen by 14 percentage points in France over a six-month period (67%) 21. People polled in Belgium are also far more satisfied (+7). However, opinions of how national democracy works have deteriorated significantly in Poland (-11), Bulgaria (-7) and in the Mediterranean countries affected by the financial and debt crisis (-8 in Spain, -7 in Portugal and Italy). Assessments of national democracy are very closely linked to the socio-economic living conditions of respondents. A majority of the most educated interviewed people and those in the most advantaged social categories express satisfaction, whereas those in more modest categories and who have financial difficulties are more likely to be critical of their democratic system. 21 The French presidential election was characterised by a high turnout: 79.5% in the first round on 22 April and 80.3% in the second round on 6 May. 61
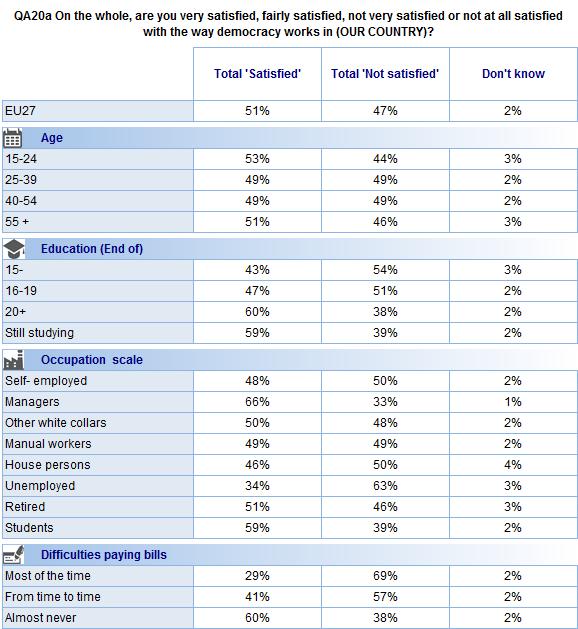
64 62

65 The way in which democracy works in the European Union For the first time in the history of the Eurobarometer survey, assessments of the way democracy works in the European Union are no longer predominantly positive. European opinion is now split down the middle on this indicator: 44% of Europeans are satisfied with how democracy works in the EU (-1 percentage point since autumn 2011), while 44% (+1) are dissatisfied and 12% (unchanged) expressed no opinion 22. Although evolutions since the previous Eurobarometer survey are small, there is a perceptible downward trend: since autumn 2009, the proportion of satisfied respondents has fallen by 10 percentage points, while over the same period the proportion of dissatisfied respondents has increased by 12 percentage points. An absolute or relative majority of respondents are satisfied in 16 EU countries, compared with 19 last Autumn. The three countries which have left this group are Germany (47% versus 47%), Hungary (45% versus 45%) and Sweden (45% versus 45%), in all of which opinions are now split down the middle. The fall in positive opinions is moderate in Germany (-2 percentage points), but very marked in Hungary (-8) and Sweden (-7). In contrast, as a result of a strong increase in positive opinions (+8), France (50% versus 37%), has joined the group of countries where a majority of respondents are satisfied with the way democracy works in the EU. Within this group, Denmark (64%), Luxembourg (63%), Belgium (63%), Poland (58%) and Latvia (57%) have the highest satisfaction levels. Respondents are predominantly dissatisfied in eight EU countries: by an absolute majority in Greece (70%), Portugal (66%), Italy (57%), Austria (54%) and Spain (52%) and by a relative majority in the United Kingdom (46% versus 37%), Slovakia (48% versus 44%) and the Czech Republic (44% versus 43%). The most striking changes have occurred in Italy and Spain, where levels of dissatisfaction have increased by 10 and 8 percentage points respectively since the previous Eurobarometer survey. 22 QA20b. On the whole, are you very satisfied, fairly satisfied, not very satisfied or not at all satisfied with the way democracy works in the European Union? 63
66 Results for this indicator vary greatly from one group of countries to another. People polled in the NMS12 countries (52% versus 31%) and in the non-eurozone countries (47% versus 36%) are predominantly satisfied with the way European democracy works; however people polled in the EU15 countries (48% versus 41%) and within the Eurozone (48% versus 42%) are predominantly dissatisfied. This is the strict reverse of the situation recorded for assessments of the way democracy works at national level. The age and social position of respondents significantly influence opinions on how European democracy works. For example, respondents in the age group (52%) and managers are predominantly satisfied (54%). However, people aged 55 or over (45% versus 40%), unemployed people (52%) and those who struggle to pay their bills most of the time (55%) are predominantly dissatisfied. Opinions are also shaped by the level of knowledge about the EU: a majority of the interviewed people who have a good objective knowledge are satisfied (52%), whereas a majority of those whose knowledge of the EU is poor are dissatisfied (41% versus 27%). The extent to which citizens believe that their voice counts in the EU has a significant influence on assessments of the way European democracy works: 70% (versus 24%) of those who have the impression that their voice counts in the EU are satisfied with the way democracy works in the EU whereas 55% (versus 32%) of those who think that their voice does not count are dissatisfied. Finally, perceptions of how European democracy works are shaped to a large extent by the image that the EU conjures up for respondents. Thus, 70% (versus 22%) of the Europeans who have a positive image of the EU are satisfied with the way democracy works, whereas 69% (versus 20%) of those who have a negative image are critical. 64
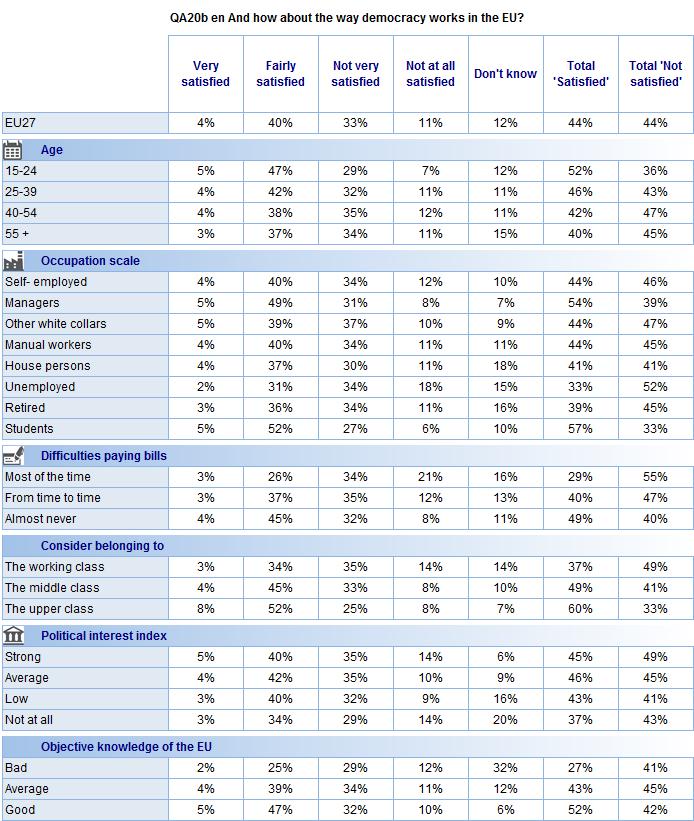
67 65

68 2.2. The extent to which personal, national and European interests are taken into account A narrow majority of Europeans have the impression that their voice counts in their country, whereas a large majority of Europeans feel that their voice does not count in the EU. This helps to explain why Europeans are more positive about the way in which democracy works in their country than about how European democracy works. These two indicators have evolved differently since they were last analysed in the Eurobarometer survey: the proportion of respondents who feel that their voice counts in their country has decreased slightly whereas the proportion of respondents who feel that their voice counts in the EU has increased significantly, though they still represent the minority. Thus, 51% (-1 percentage point since EB74 of autumn 2010) of Europeans feel that they have an influence on their national democracy in their country, whereas 46% (+3) take the opposite view 23. There are significant differences for this indicator, depending on the groups of countries analysed. A majority of people polled in the EU15 countries (54% versus 44%) and in the Eurozone (54% versus 43%) have the impression that their voice counts in their country, whereas majorities in the NMS12 countries (57% versus 38%) and the non-eurozone countries (52% versus 44%) take the opposite view. Since 2010, the proportion of respondents who feel that their voice counts in their country has increased significantly in France (84%, +11 percentage points) thanks to the presidential election; on the other hand it has fallen significantly in Portugal (22%, -15), Spain (37%, -13) and Poland (50%, -10). 23 QA21a.5 Please tell me to what extent you agree or disagree with each of the following statements. My voice counts in (OUR COUNTRY). 66
69 Almost two-thirds of respondents believe that their voice does not count in the European Union (63%, -2 percentage points since EB76 of autumn 2011), while fewer than a third consider that their voice counts (31%, +5) 24. Denmark (57%) and the Netherlands (50%) are the only two European Union countries where a majority of citizens have the impression that their voice counts in the EU. Unlike the previous case, there are no significant differences for this indicator between the groups of countries analysed. People belief that their voice counts in the EU has gained ground in 22 of the 27 EU Member States. It has increased very sharply in France (47%, +13 percentage points). It has also increased by 11 percentage points in Estonia, nine in Latvia and eight in the Netherlands. A significant decline is recorded in Hungary (-8) and Portugal (-5). This increase in the proportion of respondents who feel that their voice counts in the EU is matched by their growing belief that their country s interests are adequately taken into account in the EU. Since the autumn 2011 survey, the proportion who considers that their country s interests are adequately taken into account has increased by four percentage points, whereas the proportion who takes the opposite view has fallen by one percentage point. Nevertheless, the predominant view is still that national interests are not properly taken into account (50% versus 42%) 25. A national analysis reveals that a majority of people polled in eight European Union countries consider that national interests are adequately taken into account in the EU. These countries are Luxembourg (70%), Belgium (61%), Germany (59%), Denmark (57%), France (57%), Sweden (53%), the Netherlands (51%) and Malta (49% versus 40%). In all the other countries the predominant view is that national interests are not adequately taken into account, most strikingly in Greece (84%), Hungary (68%), Cyprus (67%), Latvia (67%) and the Czech Republic (64%). An absolute majority of the respondents in the NMS12 countries (54% versus 37%) and in the non-eurozone countries (56% versus 34%) have the impression that national interests are not adequately taken into account, whereas the opinion ratio is more balanced in the Eurozone countries (47% versus 46%) and in the EU15 (49% versus 43%). The belief that national interests are adequately taken into account in the EU has gained ground in 25 European Union countries, in particular in Slovenia (+21 percentage points), Sweden (+16), the Netherlands (+12), Luxembourg (+11), Estonia (+9), Malta (+9), Austria (+7), Belgium (+8), Latvia (+8) and Portugal (+8). 24 QA21a.4 Please tell me to what extent you agree or disagree with each of the following statements. My voice counts in the EU. 25 QA21a.2 Please tell me to what extent you agree or disagree with each of the following statements. The interests of (OUR COUNTRY) are well taken into account in the EU. 67
70 As in previous surveys, there is a consensus regarding the international influence of the European Union: 64% of the respondents agree that the EU s voice counts in the world, while only 29% disagree and 9% expressed no opinion. The evolutions for this indicator since autumn 2011 are minor 26. However, the feeling of safety conferred by membership of the EU has lost ground since autumn 2010 (EB74), the last time this item was tested in the Eurobarometer survey. 48% of Europeans (-1 percentage point) feel safer because their country is a member of the EU, while 46% (+4) disagree and 6% (-3) expressed no opinion 27. The feeling of safety is notably more widespread in the NMS12 countries (56% versus 37%) than in the EU15 countries (46% versus 48%). However, very similar results are recorded in the Eurozone (48% versus 47%) and outside it (48% versus 45%). In comparison with EB74 of autumn 2010, the feeling of safety has deteriorated very sharply in Italy (-14 percentage points) and Hungary (-11), two countries in which only a minority now feel this way, and in Portugal (-9). In contrast, this view has gained ground in Romania and Malta (both +12). 26 QA21a.6 Please tell me to what extent you agree or disagree with each of the following statements. The EU s voice counts in the world. 27 QA21a.6 Please tell me to what extent you agree or disagree with each of the following statements. I feel safer because (OUR COUNYTRY) is a member of the EU. 68

71 3. Opinions on the speed of European integration In this survey, the respondents were asked for their views on the current speed of the building of Europe, and the speed that they would prefer. For this purpose, they were asked to position themselves on one of the figures below, where number 1 is standing still and number 7 is running as fast as possible. An average speed is then calculated on the basis of the aggregated answers. On this scale from 1 to 7, the average perceived speed is 3.2 while the average desired speed is This indicator of the perceived speed of European integration was last tested in the Eurobarometer survey in autumn 2008 (EB70). Although there has always been a gap between the desired and perceived speeds of European integration, this gap has opened up as a result of the crisis, and is now wider than at any time since The average desired speed is close to that measured previously, but the average perceived speed is the lowest ever recorded, falling from 3.9 in autumn 2008 to 3.2 today. 28 QA24a and b. In your opinion, what is the current speed of building Europe? Please look at these figures. N 1 is standing still, N 7 is running as fast as possible. Choose the one which best corresponds with your opinion of the current speed of building Europe. And which corresponds best to the speed you would like? 69
72 The average perceived speed of European integration has decreased in all 27 Member States, with falls ranging from -0.3 in Denmark to -1.2 in Slovakia. The desired speed for European integration is highest in Bulgaria (5.8), Greece (5.7), Romania (5.6), Poland (5.5), Portugal (5.5) and Hungary (5.5). It is lowest in Finland (4.1) and the United Kingdom (4.3). There are almost no differences in the desired speed of European integration in the Eurozone (4.8) and the non-eurozone countries (4.9). However, the desired speed is faster in the NMS12 countries (5.4) than in the EU15 (4.7). Finally, it is interesting to note that respondents in countries experiencing severe financial difficulties want European integration to be speeded up: since autumn 2008, the average desired speed of European integration has increased from 4.9 to 5.3 in Spain, from 5.2 to 5.5 in Portugal and from 4.8 to 5.0 in Italy. In Greece it remains at one of the highest levels recorded in the EU (5.7). 70

73 4. Europeans and globalisation 4.1. Is globalisation an opportunity for economic growth? Perceptions of globalisation are still ambivalent 49% of respondents agree that globalisation is an opportunity for economic growth, while 35% disagree and 16% expressed no opinion 29. Perceptions that globalisation can play a positive role growth have increased slightly, by two percentage points since autumn 2011 (EB76). The proportion of Europeans who are negative about globalisation has remained stable since the last survey. Previous Eurobarometer reports had highlighted a trend towards a deterioration in the image of globalisation as a growth opportunity since spring 2010 (EB73). This trend has therefore halted in this survey, but the economic image of globalisation is still far below its highest levels. The difference between positive and negative perceptions of globalisation is now +14, compared with +12 six months ago; but it stood at +18 a year ago and was as high as +29 two years ago. A majority of people polled in 22 Member States see globalisation as a driver for growth, most strikingly in the Nordic countries (80% in Denmark, 78% in Sweden and 64% in Finland), the Netherlands (72%) and Germany (63%). Positive opinions narrowly outweigh negative responses in Portugal (39% versus 37%) and Romania (35% versus 33%). The economic role of globalisation is seen as negative by an absolute majority of the people polled in Greece (62%), Cyprus (53%) and Italy (51%) and by a relative majority in France (46% versus 44%) and the Czech Republic (44% versus 41%). 29 QA21a.7 Please tell me for each statement, whether you tend to agree or tend to disagree. Globalisation is an opportunity for economic growth. 71
 do not agree.")
74 As in previous Eurobarometer surveys, a socio-demographic analysis reveals significant divisions over the image of globalisation: Thus: 60% of year-olds (versus 24%) see globalisation as an opportunity for economic growth, whereas 42% of those aged 55 or over (versus 38%) do not agree. 58% of the respondents who studied up to the age of 20 or beyond (versus 34%) see it as an opportunity for growth, whereas 33% of those who left school before the age of 16 (versus 40%) disagree. 61% of managers, 54% of white-collar workers, and 56% of the Europeans who almost never have difficulties paying their bills agree that globalisation is an opportunity for economic growth, while 39% of unemployed people, 41% of retired respondents and 31% of the Europeans who struggle to pay their bills do not share this view. 72
 see globalisation primarily as a threat to employment, whereas 40% see it firstly as a good opportunity for companies.")
75 However, the opinions of Europeans are far more divided on the question of whether globalisation is an opportunity for their country s companies or a threat to employment in their country. More than four out of ten (42%) see globalisation primarily as a threat to employment, whereas 40% see it firstly as a good opportunity for companies. Fewer than one in five interviewed people (18%) expressed no opinion 30. The perception of globalisation as a threat is unchanged since EB72 of autumn 2009, while positive perceptions have fallen by three percentage points over the same period. The representation of globalisation as an economic opportunity is predominant in 15 EU countries, attracting an absolute majority of people polled in Denmark (72%), the Netherlands (68%), Sweden (68%), Germany (53%), Finland (52%), Estonia (52%) and Malta (51%). The view of globalisation as a threat to employment is predominant in 12 countries, with an absolute majority in France (65%), Greece (64%), Cyprus (59%), Belgium (57%), Hungary (54%), Latvia (53%) the Czech Republic (50%) and a relative majority in Italy (48% versus 29%), Austria (47% versus 41%), Slovenia (46% versus 42%), Portugal (44% versus 31%) and Romania (33% versus 29%). In comparison with autumn 2009, positive perceptions of globalisation have lost ground very sharply in Slovakia (-15 percentage points), the Czech Republic (-14), Spain (-12), Italy (-11), Romania (-10) and Hungary (-7). As a result of these changes, the opinion ratio has been reversed in this survey in the Czech Republic and Romania, where globalisation is now primarily seen as a threat. However, positive perceptions are now more widespread in Ireland (+6 percentage points), Finland (+6) and Germany (+4). 30 QA22. Which one of the following two statements is closest to your opinion regarding globalisation? 73
 see globalisation as an economic opportunity, whereas 42% of those aged 55 or over (versus 36%) see it as a threat to employment.")
76 As in the previous Eurobarometer surveys, there are significant socio-demographic divisions, in particular reflecting the age, education, social status and economic situation of the respondents. Thus: 46% of year-olds (versus 36%) see globalisation as an economic opportunity, whereas 42% of those aged 55 or over (versus 36%) see it as a threat to employment. 50% of respondents who studied up to the age of 20 or beyond (versus 38%) see it positively, whereas 45% of those who left school before the age of 16 (versus 27%) perceive it negatively. 46% (versus 38%) of the respondents who almost never have difficulties paying their bills are positive about globalisation, whereas 52% (versus 24%) of those who have difficulties most of the time see it mainly as a cause for anxiety. 74
, support for common global rules has declined by eight percentage points, and opposition to this idea has increased by six points.")
77 4.2. Globalisation requires worldwide governance Almost two-thirds of Europeans (65%) consider that globalisation requires worldwide governance, while 20% disagree and 15% expressed no opinion 31. However, in comparison with autumn 2009 (EB71), support for common global rules has declined by eight percentage points, and opposition to this idea has increased by six points. Despite these changes, the national and socio-demographic analyses show that there is a strong consensus in Europe on the need for worldwide governance. It is easily the predominant view in all 27 EU countries and is supported by an absolute majority in 25 of them, and by a comfortable relative majority in Portugal (47% versus 25%) and Romania (41% versus 24%). Nonetheless, it is noteworthy that, in comparison with the autumn 2009 survey, support for this idea has fallen sharply in the EU Member States that are the most vulnerable economically, an undoubted sign of the increasing temptation for opinion to turn inwards in these countries. It has fallen by 20 percentage points in Spain and Romania, by 18 points in Italy and Slovakia, by 17 points in Portugal, by 16 points in the Czech Republic and by 15 points in Hungary. Finally, a majority of respondents at all levels of the European population support worldwide governance, advantaged and disadvantaged categories alike. 31 QA21a.8. Please tell me to what extent you agree or disagree with each of the following statements. Globalisation requires common global rules. 75

78 4.3. The EU and the effects of globalisation In order to gain a better insight into how Europeans perceive the EU s role in globalisation, the sample was divided into two groups. People polled in the first group were asked for their views via a negative statement on globalisation: the EU helps to protect European citizens from the negative effects of globalisation. The second group were presented with a positively worded statement: the EU enables European citizens to better benefit from the positive effects of globalisation. Whether the wording is positive or negative, the trend is the same: favourable assessments of the EU s role have lost ground since the surveys carried out in spring 2010 (EB73), autumn 2009 (EB72) and spring 2009 (EB71) The negative wording (SPLIT A) More than four out of ten Europeans (41%) now consider that the EU helps to protect European citizens from the negative effects of globalisation. This proportion has fallen by one percentage point since spring 2010 and by five points since spring Four out of ten respondents (40%) take the opposite view, a 2-point rise since spring 2010 and a 3-point rise since spring Since 2009, therefore, the idea that the European Union acts as a buffer against the effects of globalisation has lost ground in public opinion. 32 QA21a.9. Split A. Please tell me to what extent you agree or disagree with each of the following statements. The EU helps to protect European citizens from the negative effects of globalisation. 76
, Finland (54%), Sweden (53%), Belgium (52%) and Slovakia (50%).")
, the Czech Republic (42% versus 42%) and Romania (31% versus 31%).")
 and France (46% versus 41%), and to a lesser extent in Austria (47% versus 45%), Hungary (46% versus 45%) and Portugal (38% versus 36%). National evolutions are very mixed for this indicator.")
79 Respondents agree that the EU serves as a buffer against the negative effects of globalisation in 16 EU countries, with the support of an absolute majority of the people polled in Denmark (64%), Malta (60%), Finland (54%), Sweden (53%), Belgium (52%) and Slovakia (50%). It is therefore in the countries where globalisation is seen most positively that the European Union s ability to protect its citizens from the negative effects of globalisation is most widely acknowledged. Opinions are split down the middle in three countries: Luxembourg (43% versus 43%), the Czech Republic (42% versus 42%) and Romania (31% versus 31%). The European Union is seen as unable to protect citizens in eight EU countries, by a clear majority in Greece (59% versus 34%), Italy (51% versus 33%), Slovenia (50% versus 38%), Cyprus (46% versus 38%) and France (46% versus 41%), and to a lesser extent in Austria (47% versus 45%), Hungary (46% versus 45%) and Portugal (38% versus 36%). National evolutions are very mixed for this indicator. The vision of the European Union as an effective buffer has gained significant ground since spring 2010 in Malta (+15 percentage points), Latvia (+14), France (+12) and Germany (+7). But elsewhere support has crumbled, especially in the countries with serious economic and budgetary difficulties (-17 percentage points in Italy and Cyprus, -11 in Romania, -9 in Slovakia, -7 in Hungary, -4 in Portugal and Spain). This indicator reveals the same divisions as those previously described with regard to opinions on globalisation. The younger generations and the most educated and affluent respondents are the most likely to consider that the European Union protects its citizens. However, this view is not shared by a majority of respondents aged 55+ or in the most modest and least educated categories. 77
 Europeans are more likely to agree with the positive wording, which states that the EU enables European citizens to better benefit from the positive effects of")
80 The positive wording (SPLIT B) Europeans are more likely to agree with the positive wording, which states that the EU enables European citizens to better benefit from the positive effects of globalisation. However, the answers follow the same downward trend as that described above. Almost half of Europeans (46%) agree with the statement, while 35% take the opposite view and 19% expressed no opinion 33. Positive assessments of the EU s role have decreased by two percentage points since spring 2010 (EB73), by nine points since autumn 2009 (EB72) and by eight points since spring 2009 (EB71), while negative opinions have increased by three, seven and five percentage points respectively over the same period. 33 QA21a.10. Split B. Please tell me to what extent you agree or disagree with each of the following statements. The EU enables European citizens to better benefit from the positive effects of globalisation. 78
, Denmark (74%), Finland (64%), the Netherlands (57%) and Germany (57%).")
, Cyprus (48% versus 36%), the Czech Republic (48% versus 36%), Austria (46% versus 45%) and France (42% versus 41%).")
 and the Netherlands (+5), but has declined significantly in Hungary (-15), the Czech Republic (-12), Slovakia (-9), Luxembourg")
81 The belief that the EU enables its citizens to benefit from globalisation is predominant in 21 Member States and is supported by an absolute majority in 12, led by Sweden (74%), Denmark (74%), Finland (64%), the Netherlands (57%) and Germany (57%). The opposite view is predominant in six countries, with the support of an absolute majority in Greece (60%) and of a relative majority in Italy (48% versus 35%), Cyprus (48% versus 36%), the Czech Republic (48% versus 36%), Austria (46% versus 45%) and France (42% versus 41%). The idea that the EU helps Europeans to benefit from globalisation has gained ground notably in Finland (+9 percentage points), Germany (+8), Malta (+8) and the Netherlands (+5), but has declined significantly in Hungary (-15), the Czech Republic (-12), Slovakia (-9), Luxembourg (-8), Greece (-7), Spain (-7) and Italy (-7). 79
82 5. The European institutions 5.1. Awareness of the European institutions and the trust they inspire The European Parliament remains the best-known European institution with a score of 90% (-1 percentage point since autumn 2011). However Europeans are now more likely to have heard of all the other European institutions: there has been a 6-point rise for the Council of the European Union, a 3-point rise for the European Commission and a 1-point rise for the European Central Bank. For the second consecutive time, the European Central Bank appears to be slightly better known than the European Commission. Since spring 2010 (EB73) awareness of the Court of Justice of the European Union has increased by five percentage points 34. However, this increased awareness of the European institutions is not reflected in any increase in trust in them. 34 QA Have you heard of? The European Parliament/The European Commission/The European Central Bank/The Council of the European Union/The Court of Justice of the European Union. 80
83 The Standard Eurobarometer surveys of spring 2011 (EB75) and autumn 2011 (EB76) were characterised by a sharp decline in trust in the main European institutions. That downward trend has continued in this survey, but to a lesser extent. Levels of trust have stabilised at their lowest levels: results for the Council of the European Union and the European Commission have not changed over the last six months; those for the European Parliament and the European Central Bank have fallen slightly by one percentage point. But these stabilised levels of trust are accompanied by a rise in distrust: slight for the European Parliament (+1 percentage point), but a more marked, 3-point rise for the European Commission, the European Central Bank and the Council of the European Union. The trust-distrust ratio for the main European institutions has therefore continued to deteriorate and, for the second consecutive time in the Eurobarometer survey, more interviewed people distrust than trust the European Parliament, the European Commission, the European Central Bank and the Council of the European Union 35. The deterioration of the trust-distrust ratio for the main European institutions is particularly striking in the Mediterranean countries which are weakened by the debt crisis (Spain, Greece, Italy, Portugal and Cyprus). However, this ratio has improved significantly in France and, to a lesser extent, in Germany. 35 QA For each of the following European bodies, please tell me if you tend to trust it or tend not to trust it. The European Parliament; The European Commission; The Council of the European Union; The European Central Bank; The Court of Justice of the European Union. 81
84 The European Parliament As in autumn 2011, more respondents distrust than trust the European Parliament, and the trust-distrust ratio has even deteriorated very slightly. Four out of ten Europeans (40%, -1 percentage point) trust the European Parliament, while 46% (+1) distrust it and 14% (unchanged) expressed no opinion. The trust index 36 has therefore fallen to -6 from -4 last autumn, whereas there was a positive reading (+7) a year ago, in spring Since EB76 of autumn 2011, the trust-distrust ratio has moved back into positive territory in France (45%:39% versus 40%:44% six months ago), Latvia (43%:37% versus 38%:47%) and Germany (44%:43% versus 39%:47%); however it is now negative in Italy (35%:49% versus 45%:37%), Cyprus (38%:43% versus 45%:33%) and Portugal (38%:50% versus 44%:44%). Overall, trust in the European Parliament outweighs distrust in 17 Member States (Belgium, Bulgaria, Denmark, Germany, Estonia, France, Latvia, Lithuania, Luxembourg, Hungary, Malta, the Netherlands, Poland, Romania, Slovakia, Finland and Sweden), with the highest scores in Denmark (62%), Luxembourg (59%) and Sweden (58%). Distrust outweighs trust in 10 EU countries (the United Kingdom, Greece, Slovenia, Spain, Austria, Ireland, the Czech Republic, Italy, Portugal and Cyprus), led by Greece (70%), the United Kingdom (65%), Spain (62%) and Slovenia (52%). 36 Difference between the tend to trust and tend not to trust percentages 82

, Romania")
 and")


85 Trust has fallen sharply in Italy (-10 percentage points), Romania (-8), Spain (-8), Cyprus (-7) and Portugal (-6). However, it has increased significantly in France (+5), Germany (+5) and Latvia (+5). 83
86 The European Commission Trust in the European Commission is stable at its lowest ever level (36%), while distrust has increased by three percentage points to 46%. As a result the trust index has slumped to the most negative level ever recorded in the history of the Eurobarometer survey and now stands at -10, compared with -7 in autumn 2011 and a positive reading of +3 in spring As in autumn 2011 (EB76), there is a significant difference between the NMS12 countries, where a majority of respondents trust the European Commission (47% versus 33%) and the EU15 countries, where these figures are almost completely reversed (49% distrust versus 33%). In six months, distrust has increased by one percentage point in the NMS12 countries and by three percentage points in the EU15 countries. In contrast, there are very few differences between the Eurozone countries (36% for trust versus 47% for distrust) and the non-eurozone countries (37% versus 43%), though distrust has increased more significantly in the Eurozone (+3) than outside it (+1). Since autumn 2011 (EB76), the trust-distrust ratio has improved spectacularly in France (43%:38% versus 33%:45%). In contrast, the ratio has become negative in Italy (32%:48% versus 40%:38%) and Cyprus (35%:43% versus 42%:34%). Finally, although trust has increased by three percentage points in Germany, in this instance unlike in case of the European Parliament - this is insufficient to reverse the negative trust-distrust ratio (35%:44%). Overall, trust is predominant in 15 countries (Belgium, Bulgaria, Denmark, Estonia, France, Lithuania, Luxembourg, Hungary, Malta, the Netherlands, Poland, Romania, Slovakia, Finland and Sweden), with the highest scores in Denmark (58%), Belgium (57%), Luxembourg (55%), Slovakia (54%), Estonia (54%), Finland (52%), the Netherlands (52%) and Sweden (52%). Conversely, distrust is predominant in 12 countries (the Czech Republic, Germany, Ireland, Spain, Greece, Italy, Cyprus, Latvia, Austria, Portugal, Slovenia and the United Kingdom), most strikingly in Greece (76%), the United Kingdom (62%), Spain (61%), Austria (54%) and Portugal (51%). 84

, Greece")
, Cyprus (+9)")

,")
87 Distrust has surged in Spain (+12 percentage points), Greece (+10), Italy (+10), Cyprus (+9) and Portugal (+7). However, trust has increased in France (+10), Estonia (+7) and Sweden (+6). 85
88 The European Central Bank The European Central Bank has not escaped the growing distrust of European institutions. 35% (-1 percentage point) of respondents now trust it, while 49% (+3) distrust it. The trust index is therefore now -14, compared with -10 in autumn 2011 and +2 in Spring Distrust of the European Central Bank is therefore at its highest level in the history of the Eurobarometer survey. The crisis of trust has spread very rapidly within the Eurozone and EU15 countries, since, for the first time, an absolute majority of people polled in these two groups of countries distrust the European Central Bank. The trust-distrust ratio has deteriorated in the EU15 countries from 34%:49% in autumn 2011 to 33%:53% today and from 37%:47% to 34%:52% in the Eurozone. The deterioration is far less pronounced outside the Eurozone (35%:44% today versus 35%:43% six months ago) and in the NMS12 countries (42%:36% versus 43%:34%), the only group where trust still predominates. Since autumn 2011, the trust-distrust ratio has become negative in Cyprus (34%:46% versus 44%:34%) and is once again evenly balanced (38%:38%) in Latvia, where it was negative (33%:44%) six months ago. In total, distrust outweighs trust in 11 Member States (Germany, Ireland, Greece, Spain, France, Italy, Cyprus, Hungary, Portugal, Slovenia and the United Kingdom), rising sharply in Italy (+16 percentage points), Spain (+12), Cyprus (+12) and Greece (+9). Trust has increased in France (+5) and Germany (+5), but not enough to reverse a negative opinion ratio (35%:47% in France and 42%:48% in Germany). Of the countries where trust predominates, it is now more widespread in Estonia (+7 points). In contrast, the trust-distrust ratio has narrowed sharply in Romania, falling from 44%:29% six months ago to 40%-37% today. The Council of the European Union Just under a third of Europeans (32%, unchanged) trust the Council of the European Union, while 44% (+3 percentage points) distrust it. The DK rate has fallen by three percentage points but remains high at 24%. The national evolutions are very similar to those noted for the previous institutions. The trust-distrust ratio has deteriorated sharply in Greece, Italy, Spain, Cyprus and Portugal, but has improved significantly in France, Germany and Estonia. 86
89 The Court of Justice of the European Union The Court of Justice is the only European institution which is trusted by a majority of respondents. In this Eurobarometer survey, 46% of Europeans say that they trust it, while 36% do not trust it and 18% expressed no opinion. Nonetheless, like the other institutions, it too is suffering from the crisis of trust which is affecting the European Union: the proportion of respondents who trust the Court of Justice has fallen by four percentage points since it was last measured in spring 2010 (EB73); at the same time, the proportion who distrust it has risen by eight percentage points. In spring 2010, a majority of people polled in all the EU countries trusted the Court of Justice of the EU, except for the United Kingdom. As a result of the massive increase in distrust, Greece (60%, +16 percentage points), Spain (57%, +26), Italy (47%, +19) and Portugal (44%, +15) have now joined the United Kingdom (52%, +11). Conversely, trust in this institution has increased strongly in the Baltic States: Estonia (65%, +15 percentage points), Lithuania (51%, +7) and Latvia (47%, +11). Awareness and trust An analysis of trust in the institutions in the light of the extent to which respondents have heard of them reveals that trust is far higher when Europeans have heard of the institution: this is true for the European Parliament (41% of those who have heard of it trust it, compared with 12% of those who have not heard of it), the European Commission (41% versus 12%), the Council of the European Union (41% versus 11%), the Central Bank (38% versus 10%) and the Court of Justice of the European Union (53% versus 14%). Levels of distrust are fairly similar, whether or not the respondents have heard of the European institution. 87
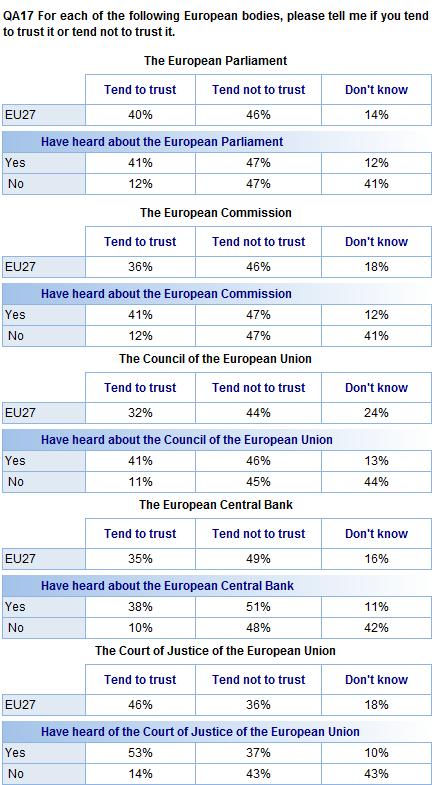
90 88
91 5.2. Trust in the European Union Distrust in the European Union has continued to increase since the last Eurobarometer survey in autumn 2011; 60% of Europeans now distrust the European Union, representing a rise of + 5 percentage points, and 13 points more than in spring 2011 (EB75). Only 31% of the respondents trust the European Union, a 3-point decline since autumn 2011, and ten percentage points less than in spring The increase in distrust (+5) exceeds the decline in trust (-3), making the current trust-distrust ratio the worst ever recorded for the European Union in the Eurobarometer survey. The growth of distrust is evident in all groups of countries. The trust-distrust ratio, already negative six months ago, has deteriorated even further in the EU15 countries (from 30%:59% to 28%:63%), the Eurozone (from 32%:56% to 30%:61%) and the non-eurozone countries (from 37%:53% to 33%:58%). Crucially, for the first time in the history of the Eurobarometer survey, distrust now outweighs trust in the NMS12 countries, following a 5-point fall in trust and 6-point rise in distrust: the ratio has therefore deteriorated from 48%:41% six months ago to 43%:47% today. A national analysis shows that few countries have escaped the decline in trust: trust was predominant in 16 countries a year ago (EB75 in spring 2011) and in 12 countries six months ago (EB76). It is now predominant in only seven countries: Bulgaria (55% versus 30%), Estonia (52% versus 35%), Denmark (49% versus 46%), Slovakia (49% versus 47%), Romania (48% versus 43%), Lithuania (47% versus 39%) and Malta (45% versus 40%). 37 QA13.4. For each of the following institutions, please tell me if you tend to trust it or tend not to trust it. The European Union. 89
92 Since autumn 2011, four countries have tipped into a negative trust-distrust ratio, namely Cyprus (32%:62% versus 47%:42% six months ago), Luxembourg (43%:49% versus 47%:45%), Hungary (38%:55% versus 47%:44%) and Poland (41%:46% versus 47%:41%). Finally, the ratio is now evenly balanced in Belgium (49% versus 49%), where it was positive six months ago (50%:46%). A majority of people polled in 19 Member States now distrust the EU, with the highest scores in Greece (79%), the United Kingdom (75%), Spain (72%), Portugal (63%), the Czech Republic (63%), Italy (62%), Cyprus (62%), Germany (61%) and Austria (61%). The trust index has deteriorated in 22 Member States, in particular in Cyprus (where it has fallen by 35 percentage points), Italy (-23), Greece (-21), Hungary (-20), Spain (-19) and the Czech Republic (-16). Therefore, only five countries have escaped this growing crisis of trust. The trust ratio is unchanged in Malta and has improved in Slovenia (+1 percentage point), Estonia (+5) and notably in France (+11) and Ireland (+12). There are contrasting evolutions within the candidate countries. Trust in the European Union has increased significantly in Croatia (39%, +9 percentage points) and in Turkey (27%, +9), while remaining the minority opinion. Following an increase of nine percentage points, a majority of respondents (51%) in the Former Yugoslav Republic of Macedonia once again trust the European Union. Trust is more or less unchanged in Iceland, where it remains low (33%, +1), while it has deteriorated in Montenegro (43%, -8). Finally, trust is easily outweighed by distrust in Serbia, where it was measured in the Eurobarometer survey for the first time (37% versus 53%). The previous Eurobarometer report had analysed a major sociological change, namely the emergence of distrust of the European Union among the socially advantaged classes and the younger generations. This trend has gathered pace in this survey. In six months, the trust-distrust ratio has deteriorated even further among year-olds (from 43%:45% to 40%:50%), managers (from 42%:50% to 37%:56%) and those who almost never struggle to pay their bills (from 37%:53% to 35%:56%). At the same time, distrust continues to gain ground in the social categories where it was already the highest, and has now reached record levels among those aged 55 or over (62%), who left school before the age of 16 (67%) and who struggle to pay their bills most of the time (70%). Objective knowledge of the European Union has a significant influence on trust in the European Union, but not enough to reverse the opinion ratio: the level of trust is 39% (versus 55%) among those who have a good knowledge of the European Union, compared with 19% (versus 63%) among those whose knowledge of it is poor. Students (45% versus 44%) and the respondents with a positive image of the EU (65% versus 28%) are the only categories of the European population where trust in the European Union is still prevalent. 90
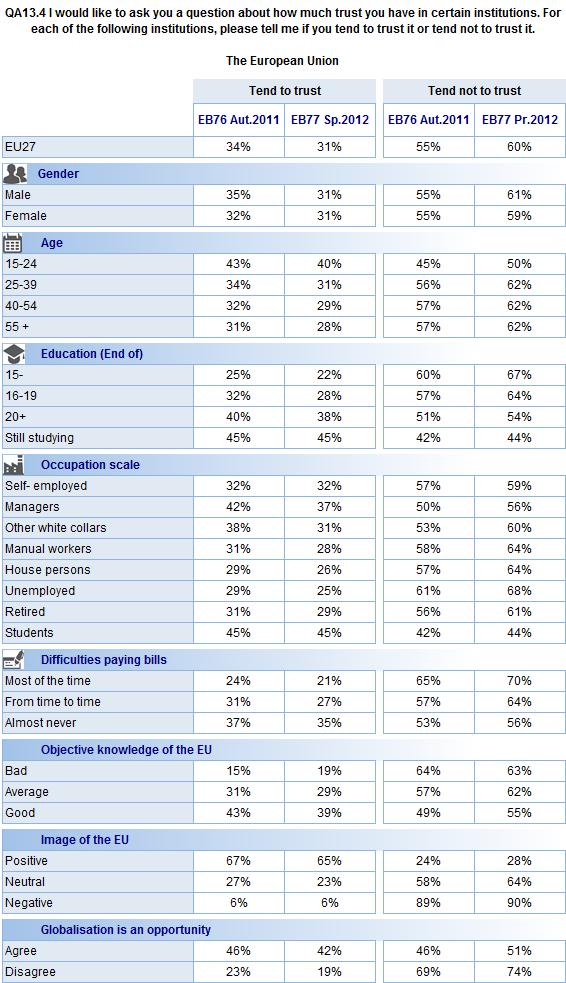
93 91
94 5.3. The European Union s image The proportion of respondents for whom the European Union has a positive image is unchanged, while negative perceptions have increased slightly The European Union s image had deteriorated very sharply in the previous Eurobarometer survey. This trend has almost been halted in this survey, despite a slight deterioration, since the proportion of positive perceptions is unchanged at 31%. However, negative perceptions have increased by two percentage points to 28%, to the detriment of neutral perceptions which have fallen, also by two percentage points, to 39% 38. The 3-point gap between positive and negative opinions is thus the narrowest ever measured in the Eurobarometer survey. The proportion of positive opinions exceeds the European average of 31% in 15 Member States (Belgium, Bulgaria, Denmark, Germany, Estonia, Ireland, France, Lithuania, Luxembourg, Malta, the Netherlands, Poland, Romania, Slovenia and Slovakia), with the highest rates in Bulgaria (54%) and Romania (48%). Within this group, the EU s image has improved considerably in France (39%, +7 percentage points), Estonia (35%, +6), Lithuania (35%, +4) and Germany (33%, +3). 38 QA14. In general, does the EU conjure up for you a very positive, fairly positive, neutral, fairly negative or very negative image? 92
95 The percentage of negative perceptions exceeds the European average of 28% in 12 Member States (the Czech Republic, Greece, Spain, Italy, Cyprus, Hungary, the Netherlands, Austria, Portugal, Finland, Sweden and the United Kingdom), with the highest scores in the United Kingdom (45%), Greece (40%), Cyprus (36%) and Austria (36%). Logically, the European Union s image has deteriorated the most in the countries where trust has fallen the most sharply: thus negative perceptions of the EU s image are significantly more widespread in Cyprus (+15 percentage points), Spain (+10), Italy (+8), Hungary (+6) and Greece (+3). 6. Knowledge of the European Union 6.1. Subjective knowledge of how the European Union works The proportion of Europeans who consider that they know how the European Union works has increased significantly. More than half of the respondents (52%, +10 percentage points since EB76 of autumn 2011) now say that they understand how the European Union works, while 45% (-7) disagree and 3% (-3) expressed no opinion 39. This is the first time in the history of the Eurobarometer survey that the feeling of understanding how the European Union works has been so widespread. 39 QA21a.1 Please tell me to what extent you agree or disagree with each of the following statements. I understand how the European Union works. 93
96 Respondents belief that they understand how the EU works has gained ground in all the 27 Member States, with the lowest increases being recorded in Greece (+1 percentage point), Ireland (+3) and Cyprus (+3) and the largest in Sweden (+30), Denmark (+15), the Netherlands (+15), Germany (+11), Austria (+11), Estonia (+10), Belgium (+10) and Spain (+10). As a result of these evolutions this feeling is now predominant in 17 Member States, compared with only 10 in autumn A majority of people polled in Italy (62%), Portugal (57%), the United Kingdom (52%), Hungary (52%), Finland (51%), Malta (51%), the Czech Republic (51%), Greece (51%), Spain (50%) and France (50%) still feel that they do not know how the EU works Objective knowledge of how the European Union works This Eurobarometer survey also included an objective EU knowledge test. For this purpose, the respondents were asked to indicate whether each of the following three statements was true or false: the EU currently consists of 27 Member States ; the members of the European Parliament are directly elected by the citizens of each Member State ; Switzerland is a member of the EU. Overall, 63% of Europeans gave three right answers, 20% were wrong and 17% did not answer. An absolute majority interviewed people gave three right answers in all the Member States, with the lowest scores in the United Kingdom (53%) and Spain (54%) and the highest in Slovenia (79%), Greece (77%), Luxembourg (77%) and Slovakia (74%). 94
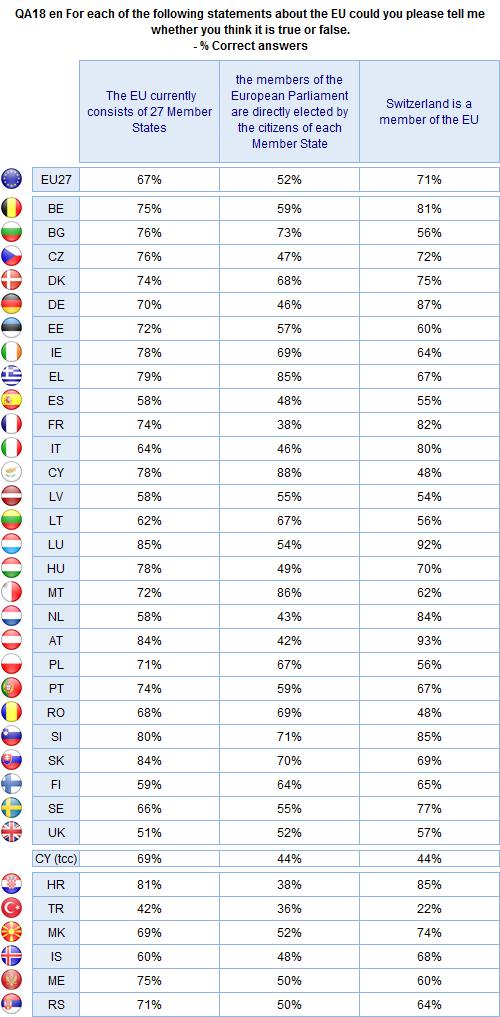
97 95
98 More specifically: 71% of Europeans know that Switzerland is a not a member of the EU, while 16% gave the wrong answer and 13% said they did not know 40. There have been no major changes for this indicator since the previous survey in autumn The highest percentage of right answers was recorded in Austria (93%) and the lowest in Cyprus (48%) and Romania (48%). These are also the only two countries where an absolute majority of the respondents did not give the right answer. 67% of Europeans are aware that the EU currently consists of 27 Member States, while 12% gave the wrong answer and 21% did not answer 41. Once again there have been no major changes since the previous survey in autumn An absolute majority of the respondents gave the right answer in all EU countries, with scores ranging from 51% in the United Kingdom to 85% in Luxembourg. 52% of Europeans are aware that MEPs are directly elected by the citizens of each Member State, while 30% gave the wrong answer and 18% said they did not know 42. Objective knowledge regarding the election of MEPs has fallen sharply, by six percentage points, since autumn 2011, no doubt because the European elections of 2009 are an increasingly distant memory. A relative majority of the respondents gave the wrong answer in the Netherlands (47% versus 43%), Austria (44% versus 42%) and France (40% versus 38%). The highest percentage of right answers was recorded in Cyprus (88%), Malta (86%) and Greece (85%). Europeans with a good level of education and a strong interest in European affairs have the highest level of objective knowledge. For example, 71% of the respondents who studied up to the age of 20 answered all three questions correctly, compared with 55% of those who left school before the age of 16. The average proportion of right answers is 69% among people who are interested in European politics, but only 54% among those with no interested in this subject. 40 QA18.3 For each of the following statements about the EU could you please tell me whether you think it is true or false. Switzerland is a member of the EU. 41 QA18.1 The EU currently consists of 27 Member States. 42 QA18.2 The members of the European Parliament are directly elected by the citizens of each Member State. 96

 and a common foreign policy (61%) has fallen by three percentage points since autumn 2011, while support for economic and monetary union")
99 III. THE EUROPEAN UNION TODAY AND TOMORROW 1. Support for European policies Against a background of distrust the European Union, there has been a slight dip in support for European policies, although a majority of Europeans still support three of the four policies tested. Support for both a common defence and security policy (71%) and a common foreign policy (61%) has fallen by three percentage points since autumn 2011, while support for economic and monetary union has fallen by one percentage point (to 52%). However, beyond these changes, the main lesson learnt is that, despite the crisis, these policies continue to enjoy the support of an absolute majority of Europeans. However, as was the case in the previous Eurobarometer survey, Europeans are predominantly opposed to a further enlargement of the EU in future years (53% against, unchanged). 97
100 A common defence and security policy among EU Member States There is still a fairly broad consensus among Europeans about this policy. More than seven out of ten respondents (71%) are in favour, while 20% are opposed and 9% expressed no opinion 43. The approval rate has fallen by three percentage points since autumn 2011, while opposition has increased by two percentage points. Apart from Ireland, where this policy is supported by a relative majority, (43% versus 34%), an absolute majority of the people polled in all EU countries support the idea of a common defence and security policy. Support is particularly widespread in Slovakia (88%), Cyprus (86%) and Belgium (85%). Although it has dipped in most EU countries, the only countries where support has fallen significantly are Hungary (68% support, -10 points) and to a lesser extent Poland (77%, -7). This in no way undermines the broad consensus in favour of this policy throughout the European Union. A common foreign policy of the 27 Member States of the EU Just over six out of ten Europeans (61%, -3 percentage points) are in favour of a common foreign policy of the 27 EU Member States, while 28% (+2) oppose the idea and 11% (+1) expressed no opinion 44. People polled in the United Kingdom and the Nordic countries are the least likely to support this policy: an (increased) majority of respondents oppose this idea in the United Kingdom (49%, +3 percentage points, versus 37%) and Sweden (59%, +7, versus 39%). Opponents are also now in a majority in Denmark (52% versus 45%, compared with 47%- 48% six months ago in autumn 2011) and Finland (51% versus 44%, compared with 46%-50% six months ago). Everywhere else, except for Malta where there is only a relative majority (48% versus 34%); an absolute majority of respondents support a common foreign policy (with the highest scores in Slovakia (81%), Greece (75%) and Bulgaria (74%). The evolutions for this policy are far more pronounced than for the previous policy tested. Although a common foreign policy is still supported by a majority of respondents, support has fallen sharply in the Benelux countries (Luxembourg, -14 percentage points; Belgium, -8; the Netherlands, -7), and in Spain (-11), Hungary (-10), Lithuania (-7) and Poland (-7). 43 QA19.4. Please tell me for each statement, whether you are for or against it. A common defence and security policy among EU Member States. 44 QA19.2. Please tell me for each statement, whether you are for or against it. A common foreign policy of the 27 Member States of the EU. 98
101 A European economic and monetary union with one single currency, the euro An absolute majority of Europeans (52%) still support economic and monetary union, while four out of ten are against it and 8% expressed no opinion 45. Although this only represents a minor change since autumn 2011 (-1 percentage point for support; opposition unchanged), it is worth observing that the gap between support for and opposition to economic and monetary union is the lowest ever measured in the Eurobarometer survey. The divide between the Eurozone and non-eurozone counties remains an important determinant of opinions on economic and monetary union: 63% of the people polled in the Eurozone countries (-1 percentage point) support this policy, compared with only 31% (-1) of non-eurozone respondents. Despite the crisis, there is still widespread support for economic and monetary union inside the Eurozone. It is also important to note that a majority of respondents in the Mediterranean countries, where distrust of the European Union has increased particularly sharply in this survey, continue to support economic and monetary union, although there have been some contrasting evolutions: support remains unchanged at a high level in Greece (75%), has strengthened in Portugal (58%, +4 points), and is still in the majority despite a decline in Italy (53%, -4), Cyprus (52%, -3) and above all in Spain (55%, -8). 45 QA19.1. Please tell me for each statement, whether you are for or against it. A European economic and monetary union with one single currency, the euro. 99
102 In total, a majority of people polled in 20 EU countries support economic and monetary union: in addition to the countries mentioned previously, the list includes Slovenia (80%), Slovakia (80%), Ireland (79%), Luxembourg (78%), Belgium (75%), Finland (74%), the Netherlands (73%), Estonia (71%), France (69%), Austria (65%), Germany (65%), Malta (63%), Romania (60%), which is the highest placed non-eurozone country on this list, Bulgaria (54%) and Hungary (47% versus 42%). Within this group, support for economic and monetary union has increased significantly in Estonia (+7), Austria (+7) and France (+6); conversely, support has fallen the most sharply in Hungary (-7) and Belgium (-5). In contrast, as in the previous survey, people polled in seven Member States are predominantly opposed to economic union. These countries are the United Kingdom (79%), Sweden (71%), the Czech Republic (71%), Denmark (69%), Poland (55%), Latvia (54%) and Lithuania (47% versus 42%). There have been no substantial evolutions in this group since the last survey. In the candidate countries, a large majority of respondents in Croatia (62%, -1), the Former Yugoslav Republic of Macedonia (78%, +4) and Montenegro (72%, -6) support economic and monetary union. A majority of respondents are also in favour of monetary union in Serbia, where support has been measured for the first time (63% versus 21%). Support has also strengthened significantly in Iceland, where 47% (+6) of the respondents are in favour of economic and monetary union, while 49% (-4) are opposed. Finally, support has increased by three percentage points in Turkey, but remains very much the minority position (29% versus 42%, with a high DK rate of 29%). Support for economic and monetary union increases in line with the interviewed people s social status. Thus, 61% of those who studied up to the age of 20 or beyond, 58% of managers, 57% of self-employed people and 56% of those who almost never have difficulties paying their bills are in favour of a European economic and monetary union with a single currency, the euro. Conversely, those who left school before the age of 16 (45%), unemployed people (45%), manual workers (49%) and those who struggle to pay their bills (44%) are against this idea. Finally, the Europeans who see globalisation as an opportunity (63%) are generally in favour of an economic and monetary union, with a single currency. 100
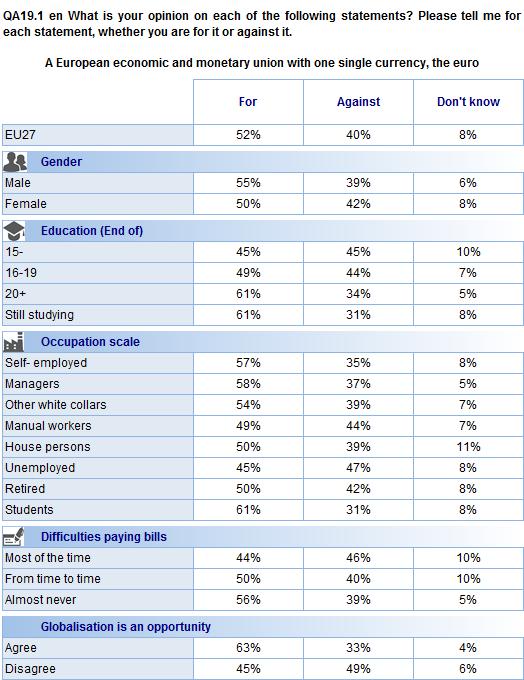
103 101
104 Further enlargement of the EU to include other countries in future years The previous Eurobarometer survey of autumn 2011 (EB76) revealed a sharp decline in support for further enlargement, which fell from 42% to 36%, while opposition rose from 47% to 53%. This opinion ratio has stabilised in this survey, and is exactly the same as it was six months ago. Therefore, an absolute majority of Europeans (53%) are still against further enlargement of the EU in the coming years 46. As was the case six months ago, and with no significant evolutions, an absolute majority of the people polled in the EU15 countries (60%) and in the Eurozone (60%) are opposed to further enlargement, whereas an absolute majority in the NMS12 countries (56%) and a relative majority of non-eurozone respondents (46% versus 41%) are in favour of it. In this survey, the opinion ratio has been reversed in favour of enlargement in Portugal (44%:41% versus 37%:44% six months ago), Sweden (51%:45% versus 47%:49%) and Latvia (48%:41% versus 45%:45%). Respondents continue to be predominantly in favour of enlargement in Poland (62%, -7 percentage points), Romania (58%, unchanged), Lithuania (58%, -2), Bulgaria (56%, +2), Slovenia (56%, +6), Hungary (54%, -2), Slovakia (52%, +4), Malta (48%, -2 versus 32%), Estonia (47%, +1 versus 44%) and more narrowly in Spain (41%, -4 versus 39%). In the other countries, respondents are predominantly opposed to enlargement, with most hostility in Germany (74%, -2 percentage points), Austria (73%, -4), Finland (71%, +1), France (70%, -1), Luxembourg (66%, +4), the Netherlands (62%, -2), Belgium (61%, -2) and the United Kingdom (60%, +1). Except in Iceland (41% versus 50%), a majority of the people polled in the candidate countries are in favour of enlargement, with an absolute majority in the Former Yugoslav Republic of Macedonia (88%, +3 percentage points), Croatia (65%, +1), Montenegro (62%,-10) and Serbia (58%), and a relative majority in Turkey (40%, +9 versus 32%), where the high DK rate has fallen significantly (28%, -11). 46 QA19.3. Please tell me for each statement, whether you are for or against it. Further enlargement of the EU to include other countries in future years. 102

. 2.1.")
105 2. The objective of the building of Europe In this survey Europeans were asked for their views on the main objective of European integration as they perceive it and as they would wish it to be. The main lesson is that the perceived and desired objectives of European integration converge, since the top three priorities the same order for both. The second lesson is that, in these times of economic and financial crisis, Europeans see growth both as the main objective actually pursued and as the goal which should be aspired to. To develop the EU s economy and boost growth easily leads the other objectives and has gained significant ground since it was last measured in autumn 2008 (EB70) The perceived objectives of the building of Europe With a score of 29% (+6 percentage points since autumn 2008), developing the economy and boosting growth in the EU easily tops the list of the main perceived objectives of European integration, ahead of improving the standard of living of all EU citizens (17%, unchanged) and maintaining peace and stability (14%, -2). All the other objectives recorded scores of less than 10% QA25a. In your opinion, at the current time, what is the main objective of the building of Europe? (One answer only). 103
, ahead of boosting growth (26%), the order in which respondents rank the three main perceived")

106 There is now a broad consensus within the European Union on the main perceived objective of the EU. Apart from Latvia, where improving the standard of living of Europeans obtained the highest score (29%), ahead of boosting growth (26%), the order in which respondents rank the three main perceived objectives is in line with the EU average in all countries. The highest scores for boosting growth were recorded in the Netherlands (55%), Ireland (45%), Denmark (45%) and Sweden (41%) The desired objectives of the building of Europe The desired objectives therefore converge with perceptions of the objectives currently pursued. With a score of 24% (+6 percentage points), developing the EU s economy and boosting growth is seen as the primary objective, whereas it came in second place in autumn This objective now ranks ahead of improving the standard of living of all citizens (23%, +1) and maintaining peace and stability (14%, -3). These are followed by protecting European citizens against the negative effects of globalisation (12%, +2). All the other objectives recorded scores of less than 10% 48. People polled in the Netherlands (36%, +13 percentage points), Ireland (35%, +9), Slovenia (32%, +16) and Denmark (30%, +18) are the most likely to mention boosting growth as the main desired objective of European integration. The scores recorded for this item have also increased sharply in Malta (22%, +14), Spain (26%, +12), Hungary (27%, +11), the United Kingdom (22%, +10), Romania (29%, +9), Finland (19%, +8), Luxembourg (21%, +8), the Czech Republic (23%, +7), Greece (26%, +6), Portugal (22%, +6) and France (21%, +6). 48 QA25b. And what should be the main objective of the building of Europe? (One answer only). 104
107 Support for improving the standard of living of all EU citizens is particularly strong in Latvia (43%, +6 percentage points), Bulgaria (39%, -2), Malta (36%, +11), Slovakia (34%, -7), Portugal (33%, +9), Lithuania (33%, +8), Greece (32%, -3) and Romania (32%, +2). People polled in Germany (24%, -3 percentage points) and Finland (22%, -3) are most likely to mention maintaining peace and stability. Finally, protecting European citizens against the negative effects of globalisation as a desired objective recorded scores considerably above the European average in France (19%, +6 points) and the Czech Republic (19%, +6), that is to say in two countries where anxiety about globalisation is particularly intense. 3. The future of the European Union 3.1. The European institutions priorities for the future - The economy takes priority for the future - Asked to identify the priorities on which the European institutions should focus in the coming years to strengthen the EU in the future, Europeans first mention economic and monetary policy (43%), ahead of health policy (32%), immigration policy and education policy (both 28%), the fight against crime (27%), social policy (26%), energy policy (25%), the fundamental rights of EU citizens (23%) and environment policy (21%). The other policies tested obtained scores of less than 20% 49. The evolutions are particularly interesting for this indicator. Economic and monetary policy is the only item to have recorded a strong increase in mentions (+7 percentage points) since spring 2011 (EB75). The only two other increases are minor ones and concern policies ranked by Europeans as middle or lower order priorities (+3 percentage points for the fundamental rights of citizens; +2 for regional development policy). The scores for all the other policies tested are unchanged or have fallen. The situation is essentially stable for social, education and health policies. Immigration policy (-5) and combating crime (-4) were mentioned far less frequently than in autumn 2011 (EB76). Finally, environmental issues are visibly of secondary importance in times of crisis: mentions of the fight against climate change (-5), protecting the environment (-4) and energy (-4) have fallen significantly. 49 QA23. European integration has been focusing on various issues in the last years. In your opinion, which aspects should be emphasized by the European institutions in the coming years, to strengthen the EU in the future? 105

 and the Eurozone (47%) than in the non-eurozone")
,")
, Estonia (50%), Germany (47%), Spain (47%), Italy (46%), Slovenia (46%), the Czech")
108 There is a broad consensus among Europeans that the European institutions should give priority to economic and monetary policy in the future. This is seen as the first priority for the EU in all groups of countries, though scores are much higher in the EU15 countries (45%) and the Eurozone (47%) than in the non-eurozone countries (36%) and NMS12 (37%). This item tops the list of priorities in 17 of the 27 Member States: in Hungary (63%), Finland (62%), the Netherlands (60%), Greece (55%), Slovakia (52%), Cyprus (51%), Austria (50%), Estonia (50%), Germany (47%), Spain (47%), Italy (46%), Slovenia (46%), the Czech Republic (45%), Lithuania (45%), France (44%), Portugal (38%, equal with health policy) and Luxembourg (36%). 106


, Belgium (+11), the Netherlands (+10), Luxembourg (+10), Austria (+8) and")
, but as a result economic and monetary")
109 Since spring 2011 (EB75) the call for the EU to prioritise economic and monetary has become more widespread, not least in the countries that are suffering the most from economic and budgetary difficulties, and in those most affected by the Eurozone crisis. It has thus seen a rise of 22 percentage points in Greece, 15 in Cyprus, 11 in Italy and six in Spain. It has also gained significant support in Sweden (+15 percentage points), France (+11), Belgium (+11), the Netherlands (+10), Luxembourg (+10), Austria (+8) and Romania (+8). In Germany, the increase is smaller (+2), but as a result economic and monetary policy is now promoted to first place, whereas a year ago it was ranked behind energy policy, which has fallen by seven percentage points in this survey. Evolution Spring 2012 / Spring
, Belgium (41%, just ahead of economic and monetary policy on 40%) and the United Kingdom (41%).")
110 Health policy is the first priority in five countries: Romania (43%), Latvia (41%), Ireland (39%), Portugal (38%, equal with economic and monetary policy) and Poland (36%). Immigration policy is the first priority assigned to the EU in three countries: Malta (52%), Belgium (41%, just ahead of economic and monetary policy on 40%) and the United Kingdom (41%). Environment policy is first in Sweden (53%) and Denmark (42%). Finally, social policy receives most mentions in Bulgaria (54%). First seven items mentioned by at least 25% of the respondents 108

111 3.2. Optimism for the EU s future The previous Eurobarometer survey of autumn 2011 recorded an abrupt rise in pessimism about the future of the EU (+10 percentage points). That increase has been halted in this survey and the optimismpessimism ratio has stabilised at the level of six months ago. Public opinion therefore remains much divided over the EU s future: 49% of Europeans (+1 percentage point) say they are optimistic, while an unchanged 46% are are pessimistic 50. The respondents are more optimistic in the NMS12 (57%, +1 percentage point) and the non-eurozone countries (52%, +3) than in the Eurozone (47%, unchanged) and in the EU15 countries (46%, -3). However, the overall stability of this opinion ratio should not be allowed to mask the very diverse national situations and evolutions. Thus, optimism for the EU s future has increased sharply in the Baltic States (+12 percentage points in Estonia, +9 in Lithuania and +8 in Latvia), Malta (+13), France (+11), the United Kingdom (+7), Slovakia (+7), the Netherlands (+6) and Slovenia (+6). As a result of these movements, the opinion ratio has been reversed in France and Slovakia: these two countries are now once again predominantly optimistic, whereas pessimism was prevalent six months ago in autumn 2011 Conversely, pessimism has increased strongly in the countries most affected by the economic crisis and/or the debt crisis: +13 in Italy, +12 in Spain, +6 in Portugal, and +4 in Cyprus and Hungary. As a result, pessimism has consolidated in Portugal and Hungary, where it was already predominant six months ago, and the opinion ratio has been reversed in Cyprus, Spain and Italy, where interviewed people are now predominantly pessimistic, whereas majorities were optimistic six months ago. In total, therefore, there are now nine countries including Greece (64%, +1 point), the Czech Republic (57%, -3), Austria (52%, -2) and the United Kingdom (51%, -5) where respondents are predominantly pessimistic about the future of the European Union. Optimism is widespread in the other 18 Member States, with the highest levels in Denmark (71%, +3 percentage points), Romania (66%, +4), Lithuania (66%, +9), Poland (63%, -3) and Estonia (62%, +12). Social variables are key determinants of expectations for the future of the European Union. Firstly, the level of optimism is very closely correlated with the interviewed people s socio- 50 QA26. Would you say that you are very optimistic, fairly optimistic, fairly pessimistic or very pessimistic about the future of the EU? 109
112 economic situation: 61% of those who struggle to pay their bills most of the time and 56% of those who left school before the age of 16 are pessimistic, whereas 58% of those who studied up to the age of 20 or beyond and 54% of those who almost never have financial difficulties are optimistic. Optimism also declines with age: 59% of year-olds, 49% of year-olds, 47% of year-olds and 45% of those aged 55 or over. Finally, the more familiar respondents are with the EU, the more likely they are to be optimistic about its future: 55% of those who have a good objective knowledge of the European Union are optimistic compared with only 36% of those whose knowledge is poor. Finally, the extent to which respondents trust the EU and the EU s image are two further significant variables. Thus, 79% of those who trust the EU and 79% of those for whom the EU conjures up a positive image are optimistic about its future, whereas 61% of those who distrust the EU and 78% of respondents whose image of the EU is negative are pessimistic about its future. 110
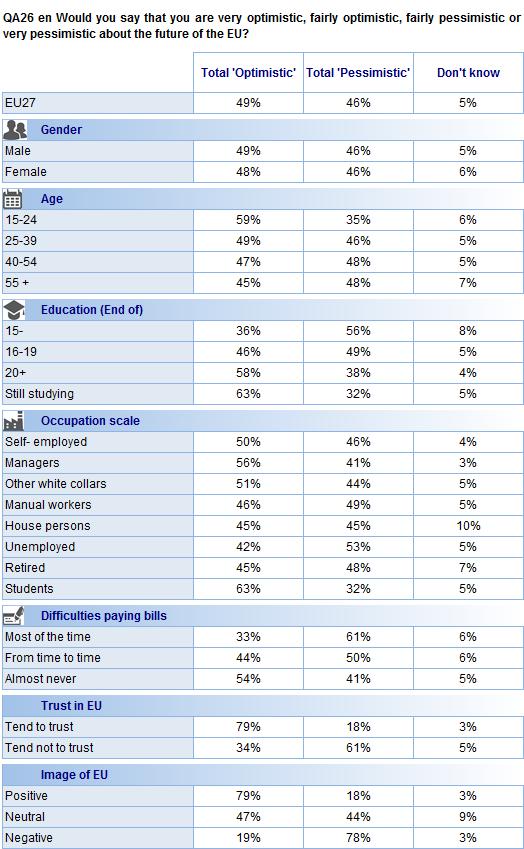
113 111
MEDIA USE IN THE EUROPEAN UNION
 Standard Eurobarometer 76 Autumn 2011 MEDIA USE IN THE EUROPEAN UNION REPORT Fieldwork: November 2011 Publication: March 2012 This survey has been requested and co-ordinated by Directorate-General for
PUBLIC OPINION IN THE EUROPEAN UNION
 Standard Eurobarometer 81 Spring 2014 PUBLIC OPINION IN THE EUROPEAN UNION FIRST RESULTS Fieldwork: June 2014 Publication: July 2014 This survey has been requested and co-ordinated by the European Commission,
EUROPEAN CITIZENSHIP
 Standard Eurobarometer 78 Autumn 2012 EUROPEAN CITIZENSHIP REPORT Fieldwork: November 2012 This survey has been requested and co-ordinated by the European Commission, Directorate-General for Communication.
Standard Eurobarometer 85. Public opinion in the European Union
 Public opinion in the European Union Fieldwork: May 2016 Survey conducted by TNS opinion & social at the request of the European Commission, Directorate-General for Communication Survey coordinated by
Standard Eurobarometer 89 Spring Report. European citizenship
 European citizenship Fieldwork March 2018 Survey requested and co-ordinated by the European Commission, Directorate-General for Communication This document does not represent the point of view of the European
EUROPEAN CITIZENSHIP
 Standard Eurobarometer 80 Autumn 2013 EUROPEAN CITIZENSHIP REPORT Fieldwork: November 2013 This survey has been requested and co-ordinated by the European Commission, Directorate-General for Communication.
EUROBAROMETER The European Union today and tomorrow. Fieldwork: October - November 2008 Publication: June 2010
 EUROBAROMETER 66 Standard Eurobarometer Report European Commission EUROBAROMETER 70 3. The European Union today and tomorrow Fieldwork: October - November 2008 Publication: June 2010 Standard Eurobarometer
EUROPEAN CITIZENSHIP
 Standard Eurobarometer 77 Spring 2012 EUROPEAN CITIZENSHIP REPORT Fieldwork: May 2012 This survey has been requested and co-ordinated by the European Commission, Directorate-General for Communication.
EUROPEANS, THE EUROPEAN UNION AND THE CRISIS
 Standard Eurobarometer 80 Autumn 2013 EUROPEANS, THE EUROPEAN UNION AND THE CRISIS REPORT Fieldwork: November 2013 This survey has been requested and co-ordinated by the European Commission, Directorate-General
Special Eurobarometer 461. Report. Designing Europe s future:
 Designing Europe s future: Trust in institutions Globalisation Support for the euro, opinions about free trade and solidarity Fieldwork Survey requested by the European Commission, Directorate-General
EUROPEAN CITIZENSHIP
 Standard Eurobarometer 81 Spring 2014 EUROPEAN CITIZENSHIP REPORT Fieldwork: June 2014 This survey has been requested and co-ordinated by the European Commission, Directorate-General for Communication.
Standard Eurobarometer 88 Autumn Report. Media use in the European Union
 Media use in the European Union Fieldwork November 2017 Survey requested and co-ordinated by the European Commission, Directorate-General for Communication This document does not represent the point of
EUROPEAN CITIZENSHIP
 Standard Eurobarometer 82 Autumn 2014 EUROPEAN CITIZENSHIP REPORT Fieldwork: November 2014 This survey has been requested and co-ordinated by the European Commission, Directorate-General for Communication.
EUROBAROMETER 72 PUBLIC OPINION IN THE EUROPEAN UNION. Autumn The survey was requested and coordinated by Directorate-General Communication
 Standard Eurobarometer EUROBAROMETER 72 PUBLIC OPINION IN THE EUROPEAN UNION Autumn 2009 NATIONAL REPO Standard Eurobarometer 72 / Autumn 2009 TNS Opinion & Social UNITED KINGDOM The survey was requested
EUROBAROMETER 64 FIRST RESULTS
 Standard Eurobarometer European Commission PUBLIC OPINION IN THE EUROPEAN UNION FIRST RESULTS Fieldwork : October-November 2005 Publication : December 2005 Standard Eurobarometer 64 / Autumn 2005 - TNS
PUBLIC OPINION IN THE EUROPEAN UNION
 Standard Eurobarometer 77 Spring 2012 PUBLIC OPINION IN THE EUROPEAN UNION FIRST RESULTS Fieldwork: May 2012 Publication: July 2012 This survey has been requested and co-ordinated by the European Commission,
Special Eurobarometer 467. Report. Future of Europe. Social issues
 Future of Europe Social issues Fieldwork Publication November 2017 Survey requested by the European Commission, Directorate-General for Communication and co-ordinated by the Directorate- General for Communication
PUBLIC OPINION IN THE EUROPEAN UNION
 Standard Eurobarometer 79 Spring 2013 PUBLIC OPINION IN THE EUROPEAN UNION FIRST RESULTS Fieldwork: May 2013 Publication: July 2013 This survey has been requested and co-ordinated by the European Commission,
Standard Eurobarometer 89 Spring Public opinion in the European Union
 Public opinion in the European Union Fieldwork March 2018 Survey requested and co-ordinated by the European Commission, Directorate-General for Communication This document does not represent the point
Standard Eurobarometer 89 Spring Report. Europeans and the future of Europe
 Fieldwork March 2018 Survey requested and co-ordinated by the European Commission, Directorate-General for Communication This document does not represent the point of view of the European Commission. The
Special Eurobarometer 464b. Report
 Europeans attitudes towards security Survey requested by the European Commission, Directorate-General for Migration and Home Affairs and co-ordinated by the Directorate-General for Communication This document
EUROPEANS ATTITUDES TOWARDS SECURITY
 Special Eurobarometer 432 EUROPEANS ATTITUDES TOWARDS SECURITY REPORT Fieldwork: March 2015 Publication: April 2015 This survey has been requested by the European Commission, Directorate-General for Migration
Special Eurobarometer 455
 EU Citizens views on development, cooperation and November December 2016 Survey conducted by TNS opinion & social at the request of the European Commission, Directorate-General for International Cooperation
Special Eurobarometer 440. Report. Europeans, Agriculture and the CAP
 Survey requested by the European Commission, Directorate-General for Agriculture and Rural Development and co-ordinated by the Directorate-General for Communication This document does not represent the
Special Eurobarometer 469. Report
 Integration of immigrants in the European Union Survey requested by the European Commission, Directorate-General for Migration and Home Affairs and co-ordinated by the Directorate-General for Communication
INTERNAL SECURITY. Publication: November 2011
 Special Eurobarometer 371 European Commission INTERNAL SECURITY REPORT Special Eurobarometer 371 / Wave TNS opinion & social Fieldwork: June 2011 Publication: November 2011 This survey has been requested
EU DEVELOPMENT AID AND THE MILLENNIUM DEVELOPMENT GOALS
 Special Eurobarometer 405 EU DEVELOPMENT AID AND THE MILLENNIUM DEVELOPMENT GOALS REPORT Fieldwork: May - June 2013 Publication: November 2013 This survey has been requested by the European Commission,
EUROBAROMETER 72 PUBLIC OPINION IN THE EUROPEAN UNION Volume 2
 Standard Eurobarometer European Commission EUROBAROMETER 72 PUBLIC OPINION IN THE EUROPEAN UNION Volume 2 REPORT Fieldwork: October - November 2009 Standard Eurobarometer 72 / Autumn 2009 - TNS opinion
Europeans attitudes towards climate change
 Special Eurobarometer 313 EUROPEAN PARLIAMENT EUROPEAN COMMISSION Europeans attitudes towards climate change Special Eurobarometer 313 / Wave 71.1 TNS Opinion & Social Report Fieldwork: January - February
Standard Eurobarometer 77 Spring 2012 EUROPE 2020 REPORT
 Standard Eurobarometer 77 Spring 2012 EUROPE 2020 REPORT Fieldwork: May 2012 This survey has been requested and co-ordinated by the European Commission, Directorate-General for Communication. http://ec.europa.eu/public_opinion/index_en.htm
Flash Eurobarometer 430. Summary. European Union Citizenship
 European Union Citizenship Survey requested by the European Commission, Directorate-General for Justice and Consumers and co-ordinated by the Directorate-General for Communication This document does not
EUROBAROMETER 73 FIRST RESULTS
 Standard Eurobarometer European Commission EUROBAROMETER 73 PUBLIC OPINION IN THE EUROPEAN UNION FIRST RESULTS Fieldwork: May 2010 Publication: August 2010 Standard Eurobarometer 73/ Spring 2010 - TNS
EUROBAROMETER 69 SPRING 2008 NATIONAL REPORT UNITED KINGDOM. Standard Eurobarometer PUBLIC OPINION IN THE EUROPEAN UNION
 Standard Eurobarometer 69 / Spring 2008 TNS Opinion & Social Standard Eurobarometer European Commission EUROBAROMETER 69 PUBLIC OPINION IN THE EUROPEAN UNION SPRING 2008 NATIONAL REPORT UNITED KINGDOM
EUROPEAN UNION CITIZENSHIP
 Flash Eurobarometer EUROPEAN UNION CITIZENSHIP REPORT Fieldwork: November 2012 Publication: February 2013 This survey has been requested by the European Commission, Directorate-General Justice and co-ordinated
Flash Eurobarometer 431. Summary. Electoral Rights
 Survey requested by the European Commission, Directorate-General for Justice and Consumers and co-ordinated by the Directorate-General for Communication This document does not represent the point of view
PUBLIC PERCEPTIONS OF SCIENCE, RESEARCH AND INNOVATION
 Special Eurobarometer 419 PUBLIC PERCEPTIONS OF SCIENCE, RESEARCH AND INNOVATION SUMMARY Fieldwork: June 2014 Publication: October 2014 This survey has been requested by the European Commission, Directorate-General
Special Eurobarometer 470. Summary. Corruption
 Corruption Survey requested by the European Commission, Directorate-General for Migration and Home Affairs and co-ordinated by the Directorate-General for Communication This document does not represent
of the European Commission. and the Communication. This document of the authors. Standard Eurobarometer 75 / Spring 2011 TNS opinion & social
 Standard Eurobarometer European Commission EUROBAROMETER 75 SPRING 2011 Europeans, the European Union crisis and the REPORT Standard Eurobarometer 75 / Spring 2011 TNS opinion & social Fieldwork: May 2011
of the European Commission. Communication. This document of the authors. Standard Eurobarometer 75 / Spring 2011 TNS opinion & social
 Standard Eurobarometer European Commission EUROBAROMETER 75 SPRING 2011 Europe 2020 REPORT Standard Eurobarometer 75 / Spring 2011 TNS opinion & social Fieldwork: May 2011 Publication: August 2011 This
Flash Eurobarometer 431. Report. Electoral Rights
 Electoral Rights Survey requested by the European Commission, Directorate-General for Justice and Consumers and co-ordinated by the Directorate-General for Communication This document does not represent
Standard Eurobarometer 88 Autumn Public opinion in the European Union
 Public opinion in the European Union Fieldwork November 2017 Survey requested and co-ordinated by the European Commission, Directorate-General for Communication This document does not represent the point
EUROBAROMETER 68 AUTUMN 2007 NATIONAL REPORT UNITED KINGDOM. Standard Eurobarometer PUBLIC OPINION IN THE EUROPEAN UNION
 Standard Eurobarometer European Commission EUROBAROMETER 68 PUBLIC OPINION IN THE EUROPEAN UNION AUTUMN 2007 Standard Eurobarometer 68 / Autumn 2007 TNS Opinion & Social NATIONAL REPORT UNITED KINGDOM
Women in the EU. Fieldwork : February-March 2011 Publication: June Special Eurobarometer / Wave 75.1 TNS Opinion & Social EUROPEAN PARLIAMENT
 EUROPEAN PARLIAMENT Women in the EU Eurobaromètre Spécial / Vague 74.3 TNS Opinion & Social Fieldwork : February-March 2011 Publication: June 2011 Special Eurobarometer / Wave 75.1 TNS Opinion & Social
Special Eurobarometer 471. Summary
 Fairness, inequality and intergenerational mobility Survey requested by the European Commission, Joint Research Centre and co-ordinated by the Directorate-General for Communication This document does not
Flash Eurobarometer 430. Report. European Union Citizenship
 European Union Citizenship Survey requested by the European Commission, Directorate-General for Justice and Consumers and co-ordinated by the Directorate-General for Communication This document does not
September 2012 Euro area unemployment rate at 11.6% EU27 at 10.6%
 STAT/12/155 31 October 2012 September 2012 Euro area unemployment rate at 11.6% at.6% The euro area 1 (EA17) seasonally-adjusted 2 unemployment rate 3 was 11.6% in September 2012, up from 11.5% in August
CITIZENS AWARENESS AND PERCEPTIONS OF EU REGIONAL POLICY
 Flash Eurobarometer CITIZENS AWARENESS AND PERCEPTIONS OF EU REGIONAL POLICY REPORT Fieldwork: June 2015 Publication: September 2015 This survey has been requested by the European Commission, Directorate-General
A. The image of the European Union B. The image of the European Parliament... 10
 Directorate General for Communication Direction C Relations with citizens PUBLIC OPINION MONITORING UNIT EUROPEAN ELECTIONS 2009 25/05/2009 Pre electoral survey First wave First results: European average
Flash Eurobarometer 364 ELECTORAL RIGHTS REPORT
 Flash Eurobarometer ELECTORAL RIGHTS REPORT Fieldwork: November 2012 Publication: March 2013 This survey has been requested by the European Commission, Directorate-General Justice and co-ordinated by Directorate-General
EUROPEAN YOUTH: PARTICIPATION IN DEMOCRATIC LIFE
 Flash Eurobarometer 375 EUROPEAN YOUTH: PARTICIPATION IN DEMOCRATIC LIFE SUMMARY Fieldwork: April 2013 Publication: May 2013 This survey has been requested by the European Commission, Directorate-General
Directorate General for Communication Direction C - Relations avec les citoyens PUBLIC OPINION MONITORING UNIT 27 March 2009
 Directorate General for Communication Direction C - Relations avec les citoyens PUBLIC OPINION MONITORING UNIT 27 March 2009 EUROPEANS AND THE ECONOMIC CRISIS Standard Eurobarometer (EB 71) Population:
Firearms in the European Union
 Flash Eurobarometer 383 Firearms in the European Union SUMMARY Fieldwork: September 2013 Publication: October 2013 This survey has been requested by the European Commission, Directorate-General for Home
Special Eurobarometer 428 GENDER EQUALITY SUMMARY
 Special Eurobarometer 428 GENDER EQUALITY SUMMARY Fieldwork: November-December 2014 Publication: March 2015 This survey has been requested by the European Commission, Directorate-General for Justice and
Europeans and the crisis
 EUROPEAN PARLIAMENT Europeans and the crisis Report Fieldwork: August September 2010 Publication: November 2010 Special Eurobarometer/Wave 74.1 TNS Opinion & Social Eurobaromètre spécial / Vague 74.1 TNS
PATIENTS RIGHTS IN CROSS-BORDER HEALTHCARE IN THE EUROPEAN UNION
 Special Eurobarometer 425 PATIENTS RIGHTS IN CROSS-BORDER HEALTHCARE IN THE EUROPEAN UNION SUMMARY Fieldwork: October 2014 Publication: May 2015 This survey has been requested by the European Commission,
Standard Eurobarometer 90 Autumn Public opinion in the European Union
 Autumn 2018 Public opinion in the European Union Fieldwork November 2018 Survey requested and co-ordinated by the European Commission, Directorate-General for Communication This document does not represent
Special Eurobarometer 474. Summary. Europeans perceptions of the Schengen Area
 Summary Europeans perceptions of the Schengen Area Survey requested by the European Commission, Directorate-General for Migration and Home Affairs and co-ordinated by the Directorate-General for Communication
STANDARD EUROBAROMETER 74 INFORMATION ON EUROPEAN MATTERS - AUTUMN 2010 EUROBAROMETER 74 AUTUMN 2010 INFORMATION ON EUROPEAN POLITICAL MATTERS
 Standard Eurobarometer European Commission EUROBAROMETER 74 AUTUMN 2010 INFORMATION ON EUROPEAN POLITICAL MATTERS REPORT Fieldwork: November 2010 Publication: February 2011 Standard Eurobarometer 74 /
The European emergency number 112
 Flash Eurobarometer The European emergency number 112 REPORT Fieldwork: December 2011 Publication: February 2012 Flash Eurobarometer TNS political & social This survey has been requested by the Directorate-General
Euro area unemployment rate at 9.9% EU27 at 9.4%
 STAT/11/76 April 2011 Euro area unemployment rate at 9.9% EU27 at 9.4% The euro area 1 (EA17) seasonally-adjusted 2 unemployment rate 3 was 9.9% in April 2011, unchanged compared with March 4. It was.2%
Special Eurobarometer 469
 Summary Integration of immigrants in the European Union Survey requested by the European Commission, Directorate-General for Migration and Home Affairs and co-ordinated by the Directorate-General for Communication
Autumn 2018 Standard Eurobarometer: Positive image of the EU prevails ahead of the European elections
 European Commission - Press release Autumn 2018 Standard Eurobarometer: Positive image of the EU prevails ahead of the European elections Brussels, 21 December 2018 According to a new Eurobarometer survey
EUROBAROMETER 66 PUBLIC OPINION IN THE EUROPEAN UNION AUTUMN
 Standard Eurobarometer European Commission EUROBAROMETER 66 PUBLIC OPINION IN THE EUROPEAN UNION AUTUMN 2006 NATIONAL REPORT Standard Eurobarometer 66 / Autumn 2006 TNS Opinion & Social EXECUTIVE SUMMARY
Employment and Social Policy
 Special Eurobarometer 77 European Commission Employment and Social Policy SUMMARY Special Eurobarometer 77 / Wave EB76. TNS opinion & social Fieldwork: September- October 0 Publication: November 0 This
ATTITUDES OF EUROPEAN CITIZENS TOWARDS THE ENVIRONMENT
 Special Eurobarometer 416 ATTITUDES OF EUROPEAN CITIZENS TOWARDS THE ENVIRONMENT SUMMARY Fieldwork: April - May 2014 Publication: September 2014 This survey has been requested by the European Commission,
The Unitary Patent and the Unified Patent Court. Dr. Leonard Werner-Jones
 The Unitary Patent and the Unified Patent Court Dr. Leonard Werner-Jones Background The Past: No centralization at all Prosecution country-by-country Litigation country-by-country Patents actions 2 Background
Special Eurobarometer 468. Report. Attitudes of European citizens towards the environment
 Attitudes of European citizens towards the environment Fieldwork September- Publication November 2017 Survey requested by the European Commission, Directorate-General for Environment and co-ordinated by
The Rights of the Child. Analytical report
 Flash Eurobarometer 273 The Gallup Organisation Analytical Report Flash EB N o 251 Public attitudes and perceptions in the euro area Flash Eurobarometer European Commission The Rights of the Child Analytical
Context Indicator 17: Population density
 3.2. Socio-economic situation of rural areas 3.2.1. Predominantly rural regions are more densely populated in the EU-N12 than in the EU-15 Context Indicator 17: Population density In 2011, predominantly
European Parliament Eurobarometer (EB79.5) ONE YEAR TO GO UNTIL THE 2014 EUROPEAN ELECTIONS Institutional Part ANALYTICAL OVERVIEW
 ONE YEAR TO GO UNTIL THE 2014 EUROPEAN ELECTIONS Institutional Part ANALYTICAL OVERVIEW") Directorate-General for Communication Public Opinion Monitoring Unit Brussels, 21 August 2013. European Parliament Eurobarometer (EB79.5) ONE YEAR TO GO UNTIL THE 2014 EUROPEAN ELECTIONS Institutional
Directorate-General for Communication Public Opinion Monitoring Unit Brussels, 21 August 2013. European Parliament Eurobarometer (EB79.5) ONE YEAR TO GO UNTIL THE 2014 EUROPEAN ELECTIONS Institutional
ATTITUDES OF EUROPEANS TOWARDS TOURISM
 Flash Eurobarometer 370 ATTITUDES OF EUROPEANS TOWARDS TOURISM SUMMARY Fieldwork: January 2013 Publication: March 2013 This survey has been requested by the European Commission, Directorate-General for
WOMEN IN DECISION-MAKING POSITIONS
 Special Eurobarometer 376 WOMEN IN DECISION-MAKING POSITIONS SUMMARY Fieldwork: September 2011 Publication: March 2012 This survey has been requested by Directorate-General Justice and co-ordinated by
Flash Eurobarometer 408 EUROPEAN YOUTH SUMMARY
 Flash Eurobarometer 408 EUROPEAN YOUTH SUMMARY Fieldwork: December 2014 Publication: April 2015 This survey has been requested by the European Commission, Directorate-General for Education and Culture
EUROBAROMETER 72 PUBLIC OPINION IN THE EUROPEAN UNION
 Standard Eurobarometer European Commission EUROBAROMETER 72 PUBLIC OPINION IN THE EUROPEAN UNION AUTUMN 2009 COUNTRY REPORT SUMMARY Standard Eurobarometer 72 / Autumn 2009 TNS Opinion & Social 09 TNS Opinion
Data Protection in the European Union. Data controllers perceptions. Analytical Report
 Gallup Flash Eurobarometer N o 189a EU communication and the citizens Flash Eurobarometer European Commission Data Protection in the European Union Data controllers perceptions Analytical Report Fieldwork:
ERGP REPORT ON CORE INDICATORS FOR MONITORING THE EUROPEAN POSTAL MARKET
 ERGP (15) 27 Report on core indicators for monitoring the European postal market ERGP REPORT ON CORE INDICATORS FOR MONITORING THE EUROPEAN POSTAL MARKET 3 December 2015 CONTENTS 1. EXECUTIVE SUMMARY...
Electoral rights of EU citizens. Analytical Report
 Flash Eurobarometer 292 The Gallup Organization Flash EB No 292 Electoral Rights Analytical Report Flash Eurobarometer European Commission Electoral rights of EU citizens Analytical Report Fieldwork: March
Views on European Union Enlargement
 Flash Eurobarometer 257 The Gallup Organization Flash EB N o 255 Dual circulation period, Slovakia Flash Eurobarometer European Commission Views on European Union Enlargement Analytical Report Fieldwork:
The Rights of the Child. Analytical report
 The Gallup Organization Flash EB N o 187 2006 Innobarometer on Clusters Flash Eurobarometer European Commission The Rights of the Child Analytical report Fieldwork: February 2008 Report: April 2008 Flash
Convergence: a narrative for Europe. 12 June 2018
 Convergence: a narrative for Europe 12 June 218 1.Our economies 2 Luxembourg Ireland Denmark Sweden Netherlands Austria Finland Germany Belgium United Kingdom France Italy Spain Malta Cyprus Slovenia Portugal
Europeans attitudes towards climate change
 Special Eurobarometer European Commission Europeans attitudes towards climate change Fieldwork: August - September 2009 Publication: November 2009 Special Eurobarometer 322 / Wave 72.1 TNS Opinion & Social
The European Emergency Number 112. Analytical report
 Flash Eurobarometer 314 The Gallup Organization Gallup 2 Flash Eurobarometer N o 189a EU communication and the citizens Flash Eurobarometer European Commission The European Emergency Number 112 Analytical
Standard Eurobarometer 86. Public opinion in the European Union
 Public opinion in the European Union This survey has been requested and co-ordinated by the European Commission, Directorate-General for Communication. This report was produced for the European Commission
CULTURAL ACCESS AND PARTICIPATION
 Special Eurobarometer 399 CULTURAL ACCESS AND PARTICIPATION SUMMARY Fieldwork: April May 2013 Publication: November 2013 This survey has been requested by the European Commission, Directorate-General for
Data Protection in the European Union. Citizens perceptions. Analytical Report
 Gallup Flash Eurobarometer N o 189a EU communication and the citizens Flash Eurobarometer European Commission Data Protection in the European Union Citizens perceptions Analytical Report Fieldwork: January
CITIZENS AWARENESS AND PERCEPTIONS OF EU REGIONAL POLICY
 Flash Eurobarometer 384 CITIZENS AWARENESS AND PERCEPTIONS OF EU REGIONAL POLICY SUMMARY Fieldwork: September 2013 Publication: December 2013 This survey has been requested by the European Commission,
Views on European Union enlargement
 Flash Eurobarometer 257 The Gallup Organization Flash EB N o 257 Views on European Union enlargement Flash Eurobarometer European Commission Views on European Union enlargement Fieldwork: February 2009
Civil protection Full report
 Special Eurobarometer European Commission Civil protection Full report Fieldwork: September-October 2009 Publication: November 2009 Special Eurobarometer 328 / Wave TNS Opinion & Social This survey was
Alternative views of the role of wages: contours of a European Minimum Wage
 Alternative views of the role of wages: contours of a European Minimum Wage Europe at a crossroads which way to quality jobs and prosperity? ETUI-ETUC Conference Brussels, 24-26 September 2014 Dr. Torsten
Flash Eurobarometer 429. Summary. The euro area
 LOGO CE_Vertical_EN_NEG_quadri rouge Summary Survey requested by the European Commission, Directorate-General for Economic and Financial Affairs and co-ordinated by the Directorate-General for Communication
Malta-Valletta: Provision of interim services for EASO 2017/S Contract award notice. Results of the procurement procedure.
 1 / 10 This notice in TED website: http://ted.europa.eu/udl?uri=ted:notice:241884-2017:text:en:html Malta-Valletta: Provision of interim services for EASO 2017/S 120-241884 Contract award notice Results
HB010: Year of the survey
 F4: Quality of life HB010: Year of the survey Year (four digits) Flags 2018 Operation 158 F4: Quality of life HB020: Country Reference period Constant Mode of collection Frame BE Belgique/Belgïe BG Bulgaria
Looking Through the Crystal Ball: For Growth and Productivity, Can Central Europe be of Service?
 Looking Through the Crystal Ball: For Growth and Productivity, Can Central Europe be of Service? ARUP BANERJI REGIONAL DIRECTOR FOR EUROPEAN UNION MEMBER STATES THE WORLD BANK 6 th Annual NBP Conference
Young people and science. Analytical report
 Flash Eurobarometer 239 The Gallup Organization The Gallup Organization Flash EB N o 187 2006 Innobarometer on Clusters Flash Eurobarometer European Commission Young people and science Analytical report
Making a difference in the world: Europeans and the future of development aid
 Special Eurobarometer 375 European Commission Making a difference in the world: Europeans and the future of development aid REPORT Special Eurobarometer 375 / Wave 7.61 TNS opinion & social Fieldwork:
European Parliament Eurobarometer (EB79.5) ONE YEAR TO GO TO THE 2014 EUROPEAN ELECTIONS Economic and social part DETAILED ANALYSIS
 ONE YEAR TO GO TO THE 2014 EUROPEAN ELECTIONS Economic and social part DETAILED ANALYSIS") Directorate-General for Communication Public Opinion Monitoring Unit Brussels, 18 October 2013 European Parliament Eurobarometer (EB79.5) ONE YEAR TO GO TO THE 2014 EUROPEAN ELECTIONS Economic and social
Directorate-General for Communication Public Opinion Monitoring Unit Brussels, 18 October 2013 European Parliament Eurobarometer (EB79.5) ONE YEAR TO GO TO THE 2014 EUROPEAN ELECTIONS Economic and social
Flash Eurobarometer 354. Entrepreneurship COUNTRY REPORT GREECE
 Flash Eurobarometer 354 Entrepreneurship COUNTRY REPORT GREECE Fieldwork: June 2012 This survey has been requested by the European Commission, Directorate-General Enterprise and Industry and co-ordinated
Malta-Valletta: Provision of interim services for EASO 2017/S Contract award notice. Results of the procurement procedure.
 1 / 8 This notice in TED website: http://ted.europa.eu/udl?uri=ted:notice:339167-2017:text:en:html Malta-Valletta: Provision of interim services for EASO 2017/S 165-339167 Contract award notice Results
The European Emergency Number 112
 Gallup 2 Flash Eurobarometer N o 189a EU communication and the citizens Flash Eurobarometer European Commission The European Emergency Number 112 Summary Fieldwork: January 2008 Publication: February 2008
ENTREPRENEURSHIP IN THE EU AND BEYOND
 Flash Eurobarometer 354 ENTREPRENEURSHIP IN THE EU AND BEYOND COUNTRY REPORT GERMANY Fieldwork: June 2012 This survey has been requested by the European Commission, Directorate-General Enterprise and Industry