EUROPEAN ATTITUDES TOWARDS URBAN TRAFFIC PROBLEMS AND PUBLIC TRANSPORT
|
|
|
- Doris Malone
- 5 years ago
- Views:
Transcription
1 EUROPEAN ATTITUDES TOWARDS URBAN TRAFFIC PROBLEMS AND PUBLIC TRANSPORT -SURVEY REPORTfor THE COMMISSION OF THE EUROPEAN COMMUNITIES and THE INTERNATIONAL UNION OF PUBLIC TRANSPORT (UITP) INRA(EUROPE) EUROPEAN COORDINATION OFFICE sa July 1991 INRA (EUROPE) European Coord.notion Office SA/NV Avenue R Vondendriessche Brussels Belgium Tel «32/2/ Fox «32/2/ TVA RCB
2 Introduction Over the past years, the problems caused by rapidly increasing urban car traffic have received more and more attention both from the citizens directly concerned and from political decision makers. Most Industrialized societies have witnessed a growing environmental sensitivity and an increasing concern about the negative consequences of excessive car traffic on the health of the urban population and on the quality of life in inner cities. This evolution has pushed the issue of fundamental re-orientation of urban traffic planning and the future of public transport to the centre of public attention. Therefore the COMMISSION OF THE EUROPEAN COMMUNITIES decided to set up a Europe-wide public opinion study on the attitudes of EC citizens about the urban traffic problems and public transport. It involves three different Directorates General of the Commission of the EC: DG VII TRANSPORT responsible for the matter of PUBLIC TRANSPORT DG XVII ENERGY, with a focus on the analysis of all energy related aspects of the problem of urban congestion DG XI ENVIRONMENT, NUCLEAR SAFETY AND CIVIL DEFENCE, introducing the environmental issues in the research programme The project was supported by the INTERNATIONAL UNION of PUBLIC TRANSPORT (UITP). The study was organised in the framework of the regular EUROBAROMETER surveys and had the following aims: to precisely identify the perceptions of the citizens; their problem-awareness and their own preferences for different solutions to the problems described; to compare the different national results in order to identify national specificities and common European problems; to use the insights gained in the citizens' perceptions to actively promote a policy in favour of public transport.
3 Although national results are, of course, comparable with each other, the attention of the reader should be drawn to the fact that interpreting such differences and their underlying reasons must always take the different national backgrounds into account: not only different national infrastructures in the field of public transport, different degrees of urbanization and car ownership, but also diverging socio-cultural patterns like receptiveness to 'green issues' must be taken into consideration. To show how important a role national transport structures and consumer behaviour plays, 70% of the Dutch population use a bicycle everyday or at least several times a week. Such factors cannot be ignored when developing national policies. The results presented in this study have been obtained during face-to-face interviews with a representative sample of the European population 1. Fieldwork was carried out between April 2nd, 1991 and April 22nd, 1991 in the framework of the EUROBAROMETER-study of the Commission of the EC. INRA (Europe) is responsible for the coordination of the survey, data-processing and data analysis, and the final contents of this report. Data of this type needs to be analyzed carefully before drawing final conclusions. Attitudes of respondents need to be verified beyond face-value. Especially in matters of intensive public debate, such as urban congestion and public transport, the "social desirability" of certain opinions can, to a certain extent, guide the respondents in their answers. In accordance with the normal practice for this type of survey the COMMISSION OF THE EUROPEAN COMMUNITIES disclaims all responsibility for questions, results and commentaries. The report, written by INRA(EUROPE) does not necessarily express the view of the Commission of the European Communities or of U1TP.
4 i - Content: page Summary: I) Perception of the present situation A) Evolution of car traffic in urban areas over the past 10 years B) Consequences of urban car traffic C) Car traffic as a source of air deterioration in urban centres D) Car traffic as a source of air deterioration in living areas E) Risk of traffic accidents in urban areas II) Opinion about traffic planning A) Which preferential treatment? B) Correct judgement by political decision makers III) Which means of transport do people use A) Who uses public transport and how often? Buses Tram. Metro. Train B) Private cars : Private cars as driver : Private cars as passengers C) Bicycles, mopeds and motorbikes IV) Reasons for not using public transport A) There are no convenient lines of public transport, catering for my needs, for example the schedules are not convenient for me or public transport doesn't go where I want to go B) Public transport is too stow, takes too long C) Public transport is too restricting for me D) Public transport is too expensive / public transport is not regular, you cannot trust the schedules E) Various other reasons
5 .ii. V) Reasons for using public transport A) Public transport is a comfortable and practical means of getting around B) I don't have a car or motorbike C) Public transport is cheap D) Public transport is regular, one can trust the schedules E) Public transport enables me to save time F) Public transport avoids accidents G) Public transport does not cause much pollution H) Various other arguments VI) Support for different statements about public transport A) Confrontation wrth other kinds of people B) Changes in petrol prices C) Confidence in technological progress D) Increasing cost for the use of cars VII. Possible solutions for traffic congestion problems A) Developing public transport B) Creating more pedestrian areas C) Limiting car traffic in town centres D) Building new urban highways E) Tight parking restrictions in centres F) Motorist toll for entering urban centres G) Putting up petrol prices Conclusion APPENDICES: Appendix I : Technical specifications of EUROBAROMETER 35.1 Appendix II: Description of the sample Appendix III: Questionnaire

6 Summary: In this summary we concentrate on the results of this survey at the European level A survey on opinion and behaviour regarding traffic problems, public and private transport and its consequences, should of course take differences between the various countries into account In the detailed report that follows, country-by-country and socio-demographic differences are described extensively. Car traffic: how big is the problem? Two thirds of the European citizens are of the opinion that car traffic in urban areas has gotten worse over the past ten years. Almost six out of ten Europeans consider the consequences of car traffic in their urban area as unbearable or hardly bearable. And almost all of those (90%) consider car traffic as the main or as an important cause of the deterioration of air quality. Figure 1 Three quarters of all European citizens consider car traffic as responsible tor the deterioration of air quality in inner cities. In the areas where people live. the situation is perceived to be less dramatic, but stilt close to half of the people see cars as a source of air deterioration there, too.
.")
7 .ii- Air quality deterioration is seen as the main negative effect of car traffic, but the risk of traffic accidents is also seen as important Almost seven out of ten European citizens see "some" or "high" risks for cyclists (eight out of ten of those who find that the consequences of car traffic are "unbearable"). The perceived risk for pedestrians is somewhat lower, the risk for public transport users is seen as the lowest Preference for future traffic situation : citizens and politicians. Two thirds of all European citizens opt for a preferential treatment of public transport, when conflicts arise in traffic planning decisions between cars on the one hand, and public transport on the other. This opinion is largely shared by people who frequently use cars themselves. A majority of European citizens find that political decision makers do not judge people's feelings on traffic planning correctly; only 19% think that politicians have the correct judgement. One third of all Europeans citizens think that people are less in favour of cars than politicians think they are (that is 50 % of those who express an opinion about politicians' judgement and 68% of those who think politicians are wrong in their judgement of people's feelings). Figure 2
8 Ill- Eight out of ten EC citizens consider developing public transport to be an effective means to solve traffic congestion problems. Other effective means consist of creating more pedestrian areas (75%), and strictly limiting car traffic in urban centres (71%). Cost increasing measures (toll for cars in city centres and increasing petrol prices) are seen as less effective by the citizens. Why not use public transport? There are no convenient lines of public transport, catering for my needs, for example the schedules are not convenient for me or public transport doesn't go where I want to go." This is the main reason why four out of ten persons of those, who never or occasionally use public transport (69% of all EC citizens) do so. Figure 3: basis = those using public transport occasionally or never; N = Public transport is also perceived as too stow. takes too long" (29% of non users), too restricting for me" (21 %); "public transport is not regular, you cannot trust the schedules", say 18%. Detailed analysis (Chapter IV) show that these reasons are mainly given by people who belong to the "white collar" professions. Related to that: most of these reasons are supported by those working
9 -IVin urban areas. "Opinion leaders", those who tend to discuss their views with others and try to persuade them, are also the ones who tend to give these reasons for not using public transport 19% of non public transport users say ft is too expensive. Motives for using public transport With a view to publicity measures, it is of crucial importance to be well aware of those motives that are listed by people who do use public transport (29% of all interviewees). Figure 4: basis = those using public transport at least once a week; N = More than four out of ten public transport users find it "a comfortable and practical means of getting around". But we should warn that opinion leaders are less positive about this point than others. While we observed before that one out of five non-users found public transport too expensive. we now observe that almost one out of every three users find it cheap.
10 -V- 21% of the users find public transport "regular, one can trust the schedules", and 20% say rt "enables me to save time". The fact that public transport prevents accidents is a reason that plays a role for 18% of the users. 15% of them use it because public transport does not cause much pollution. These observations are important when confronted with the previous findings: although large majorities of the European population are convinced that pollution and accident risks are related to car traffic in urban areas, these negative factors only manage to motivate 4% to 6% of the total population to use public transport. It is also important to note that opinion leaders support both arguments (pollution and accident risk) rather strongly. Five concluding statements on usage versus non'usage. 1. In general terms we can observe that nearly the same type of arguments, motivating the users positively, are used by non users in a negative way. 2. People appear to be very much aware of traffic congestion problems, have very negative opinions about it. but this hardly makes them decide to use public transport. 3. Objective advantages of public transport, when available, seem to play a role in people's behaviour, but only a limited one. 4. But their awareness of the traffic problems, certainty in urban areas, makes them say that public transport should be further developed and car traffic limited, whether they are car users or not 5. This is what people expect from urban planning and, consequently, from urban political decision makers. Citizens feel that politicians overestimate them in being in favour of cars.

11 - 1- I) Perception of the present situation A) Evolution of car traffic in urban areas over the past 10 years. 65% of European citizens are of the opinion, that car traffic has become worse in the course of the past decade. The question, if car traffic in urban areas has improved, has not changed or has got somewhat worse over the past 10 years, was the starting point of the analysis. Only a very small minority (14%) thinks that the situation has improved. Figure 5 Evolution of car traffic in urban areas over past 10 years In all EC member states, the perception of an aggravating situation obtained a significantly stronger support than the opposite answer. In eight out of twelve countries, more than 60% of all interviewed shared such a negative view: Italy (83% "worse": 5% "improved"). the United Kingdom (83%: 7%), Luxembourg (75%: 9%), and Greece (72%: 11%) are situated above the European
, the Netherlands (45% : 25%), Portugal (43% : 30%) and Denmark (40% : 22%), the evolution of car traffic is perceived as less threatening than in the other countries.")
12 .2- average (65% : 14%). In Spain (62% : 16%). Belgium (62% : 15%), Germany (62% : 13%) and Ireland (62%: 22%), the results confirm this tendency to a slightly tower degree. In Prance (45% : 23%), the Netherlands (45% : 25%), Portugal (43% : 30%) and Denmark (40% : 22%), the evolution of car traffic is perceived as less threatening than in the other countries. But still, a carcritical attitude prevails. All interviewees were asked about their 'degree of urbanization', that is the fact of living and/or working in an urban area of more than inhabitants. Within the total population, those living and/or working in an urban area in general display a more negative perception of the situation (11% "improved" vs. 71 % "has got worse") than the EC average. Quite naturally, those interviewed who are not living or working in an urban area, were slightly less pessimistic: 16 % thought that the situation has improved, and 60% believed that the situation has become worse - still an absolute majority. The same is valid even for frequent car users: 66% of them replied that car traffic has got worse. The results of all questions can be confronted with socio-demographic variables like age, sex, opinion-leadership 2, education, profession, etc. of all respondents. A closer look at the results of this question reveals the following details: with increasing age, the interviewed become more car-critical; the same is true for opinion-leaders. The occupational status of the interviewed has been summarized to group the results into the following categories: Independent: Farmer/fishermen, professional (lawyers, medical practitioners, etc.), shop- or company owners. 'White collar": employed professional, general management, middle management, other office employees, non-office employees (non manual); 'blue collar': supervisors, skilled manual workers, other manual workers; other: retired, housewife or not otherwise employed, military service or temporarily not working.
13 -3- Table 1: Degree of urbanization by different professional groups (%, EC 12+). In the case of the question, whether in the course of the past 10 years the car traffic had changed, the results obtained from the several groups particularly stand out: employed professionals (82% "worse": 8% "improved"), independent professionals (76%: 8%), and other office employees (72%: 11 %) are of the opinion that car traffic in urban areas has become worse. These professional categories can be considered as the groups most directly concerned by urban traffic problems: 'white collar' workers appear to be concentrated (living and/or working) in urban areas (see table 1). They are thus more frequently affected by urban traffic difficulties. and - as we will see later - they more frequently opt for the development of public transport as the best solution to these difficulties.

14 -4- B) Consequences of urban car traffic. "Would you say that the consequences of car traffic in this urban area are bearable, hardly bearable, or unbearable?" The responses obtained to this question widely vary across the EC countries. With the exception of Denmark, where 71 % of interviewees think that the consequences of urban car traffic are "bearable", people from most of the other member states consider cars as an important nuisance for urban areas. Figure 6 The average results for the EC (56% "hardly bearable" and "unbearable", as opposed to 39% "bearable") clearly show that most Europeans are aware of the damage to the orban environment In three countries. Italy (80% : 15%), Greece (71% : 26%) and Luxembourg (69 % : 29%). this perception is particularly widespread. In Spain (61% : 36%). Belgium (59% : 39%). the Netherlands (53%: 39%). and Germany (52%: 44%), still more than half of all interviewed are sceptical about the effects caused by cars. Portugal (49% : 42%). France (49% : 47%) and the United
15 -5- Kingdom (48%: 50%) show a more or less balanced score. Only in two countries - Ireland (40% : 56%) and Denmark (26% : 71%) - we find a dear majority of those thinking that the consequences are "bearable". On the EC level, these negative consequences are perceived stronger by opinion leaders and older people. But also people in the two age groups (25-39 and years) that make most frequently use of a car (see chapter III.B of this report) do not particularly deny the negative consequences of cars: only 39% respectively 41% think these are "bearable". An analysis by usage of public transport against non-usage shows that the evaluation of the traffic situation in urban centres is not related to actual usage of public transport Those who think that the situation is "hardly bearable* or "unbearable" do not use public transport more frequently than others. Within the professional categories, independent professionals, office employees and retired persons were more critical towards cars than average; responses obtained from the general and the middle management were less critical Apparently urbanization did not influence the answers: even 54% of those not living or working in an urban area confirmed that consequences were "hardly bearable" or "unbearable", as opposed to 41 % saying that the situation is "bearable". The results obtained from interviewees living and working in cities (40% "bearable" against 60% "hardly/not bearable") were only slightly higher. The results of all questions have further been confronted with the results obtained from one specific question: whether interviewees believe that local politicians in urban areas correctly interpret people's feelings in the domain of traffic planning. In case of a negative answer, two alternatives were put forward: a) no. politicians believe that people are more in favour of cars than they actually are in reality: b) no, politicians believe that people are less in favour of cars than they actually are in reality. A cross-tabulation of these results allows us to analyze, what precisely the groups of those satisfied or unsatisfied with the judgement of urban politicians think about the present traffic situation and possible solutions suggested. In the specific case of evaluating the consequences of urban car traffic, the group that thinks political decision-makers do judge people's feelings correctly were in fact the only ones showing a majority (57%) to assess the car situation as "bearable".
 of all Europeans believe, that cars are to a large extent responsible for the deterioration of the air quality in inner cities.")
16 -6- C) Car traffic as a source of air deterioration in urban centres. A broad majority (76%) of all Europeans believe, that cars are to a large extent responsible for the deterioration of the air quality in inner cities. We are not aware of any front-page news on smog-alarm or smog-related traffic restrictions on cars during the interviewing period, so it would seem that a large majority of Europeans is aware of the negative impact of cars. Figure 7 For the sake of presenting a dear overview, the different answer-categories of this question have been grouped in the graphics: 'pro-car' answers are on the right, 'anti-car' answers are on the left. On the EC average, the answers of those thinking that cars are "an important cause of air deterioration among other sources" (42%) or even "the main cause" (34%) add up to 76%. compared with 21% thinking that cars are relatively harmless in this respect A comparison of the national results shows that the Italians are particularly worried (93% harmful : 4% harmless). In nine out of twelve countries. 2/3 of all interviewees share the view that cars are damaging the air-quality in urban centres. In the remaining three countries, an absolute majority
17 .7. does. These results clearly underline how strong these convictions are in all EC countries. It should be noted as well, that the percentage of those thinking that cars do not cause any deterioration at all was extremely weak all over Europe, varying between 17% in Greece and 1% in the Eastern part of Germany and in Italy. Compared to that, the percentage of those in support of the other extreme point of view - that cars are the main cause for a deterioration - was significantly higher in all countries: the minimum was 19% in the Netherlands, the EC average was 34%, and the maximum - obtained in Italy - was 50%. The following social groups share a more critical attitude towards cars: young people (79% harmful: 18% harmless), the better educated (79%: 19%), students (82%: 16%), and people with a high score on the opinion leadership index: Among the professional groups, office employees (86% harmful: 12% harmless), independent professionals (85%: 13%). and employed professionals (83%: 14%) had a more critical attitude towards cars than the EC average in general and the different sub-groups of workers and the non-professionalty active in particular. Once again, those of the interviewed who are directly affected by the problem because they are living and working in a city. showed a more critical attitude towards cars: 85% believed that cars are to an important degree responsible for the decline of the quality of air in urban centres: only 14% thought that cars only cause slight or no deteriorations at all. Those living and working outside urban centres were again slightly less critical (69% vs. 26%). The group of respondents, who considered the present situation as "unbearable", were the ones to particularly consider cars as mainly responsible for the deterioration of air quality in urban centres:
18 .8. those saying bearable* those saying hardly bearable* those saying unbearable' average EC 12 care an the main cause tor air deterioration 22% 37% 50% 34% cars are an important cause, among others 40% 49% 40% 42% cars only cause alight deteriorations 25% 10% 8% 15% cam do not cause any deterioration at all 11% 3% 2% 6% dont know, no answer 3% 2% 2% 4% Total 101% 101% 100% 101% D) Car traffic as a source of air deterioration in living areas. The second part of this question was probing more specifically into the effects of cars on the quality of air in the living areas of the interviewed. It led to different results: On the EC level, a majority (52%) now believes that cars only cause "slight deteriorations* or even "no deterioration at air in living areas. 44% think, that cars are the main cause or an important cause among others for the degradation of the air quality. Only in Italy the relation which is favourable for cars was reversed: 52% of Italians thought that cars were harmful to the air-quality in their living areas, while 46% said that cars were harmless in this respect In all other countries, the interviewees - to a rather widely varying degree - supported the view that cars are not the main cause for air deterioration. Once again, we find Denmark (26% harmful: 66% harmless) and Ireland (24% : 71%) at the bottom of our ranking. Those with a higher education and those who are to be considered opinion leaders scored above the overall EC average. A majority of employed professionals and other office employees (56% and 53% respectively) were convinced of the rather negative consequences of cars for their living area. On the other side, farmers were particularly convinced of the insignificance of cars in this case: only 16% considered them as harmful
 believed that cars are only to a small proportion responsible for the bad air in living areas.")
19 .9. Figure 8 Car users (42% harmful vs. 54% harmless), and - to an even higher degree - those neither living nor working in urban areas (31% vs. 64%) believed that cars are only to a small proportion responsible for the bad air in living areas. Among those, who actually live and work in cities, this perception was reversed: 64% of these urban residents agreed upon the large responsibility of cars for the deterioration of air quality. The same was the case for the majority of public transport users (55% vs. 42%). As in the case of the previous part of the question, interviewees who were particularly critical towards the consequences of car traffic also tend to think that cars are responsible for the deteriorating air quality in living areas: A clear majority (55%) of those saying that consequences of car traffic were "unbearable" expressed the opinion, that cars are harmful to the air quality in living areas, compared to 43% of all EC citizens.
20 .10- E) Risk of traffic accidents in urban areas The interviewees were asked to evaluate on a scale ranking from 1 (= low risk) to 6 (= high risk) - the risk of traffic accidents in urban areas that users of different means of transport are running (pedestrians, cyclists, car drivers and public transport users). Public transport is in alt European countries and by far considered to be the safest means of urban transport 78% of all interviewees said that the risk to public transport users is low; only 17% considered their risk to be high. The risk to users of other means of transport was perceived as being significantly higher: Figure 9 Country-by-country scores for public transport vary between Denmark (6% high risk, 90% low risk) and Italy (25% high risk, 71% tow risk). In each of the member states, however, public transport is seen as the safest means of transport For car drivers, the risk is perceived to be much higher; national results vary between on the one hand Denmark (26% high risk, 73% low risk) and on the other Italy, showing quasi inverted results (66% high risk. 31% low risk).
, but very much so in the Eastern parts of Germany (83% high risk. 15% tow risk).")
21 -11- Figure 10 The evaluation of the risk for pedestrians varies between Denmark (35% high risk. 65% low risk) and the Eastern parts of Germany (69% high risk, 30% low risk). Finally, the risk for cyclists was perceived to be relatively less dramatic in Portugal (51% high risk. 41% low risk), but very much so in the Eastern parts of Germany (83% high risk. 15% tow risk). A closer look at the socio-demographic variables reveals a significant difference in perception of the risk to public transport users between men and women: women (74% low risk) tend to consider public transport as somewhat less safe than men do (82%). Other categories perceiving public transport as less safe, compared to the average, are: elderly people in the age group 55+ years (74% low risk), those respondents who have a low opinion leadership index (69%). and the less educated (71%). It should be underlined, that these opinions concerning safety are independent from the actual use of public transport (see chapter III) in daily life. If we look at transport behaviour in daily life. both public transport users (80% low risk) and non-users (77%) show rather similar opinions.
22 -12- Those who have a negative Judgement of the consequences of urban car traffic also have a more pessimistic opinion on the traffic safety of all means of transport than other citizens: Those saying that consequences High risk for... of care are 'unbearable' EC average...eye 80% 68%...pedestrians 73% 55%...car driven 65% 49%...public transport users 25% 17%

23 -13- II) Opinion about traffic planning A) Which preferential treatment? The interviewees were asked a series of questions related to the fundamental orientations of traffic planning and the future support for different means of transport Three concepts were submitted to their judgement These concepts assumed the existence of conflicts in traffic planning decisions between private cars and other means of transport (public transport cyclists and pedestrians). The interviewees were asked, to which means of transport preference should be given in the case of conflict Figure 11 The majority of Europeans in all member states are against further preferences given to cars when conflicts arise with the interests of public transport, cyclists and pedestrians. Of course, the absolute strength of these convictions varies from country to country. It should be noted as well.
24 -14- that the level of "don't knows" was quite high (often reaching about 10%, in some cases even up to around 20% in Greece and Ireland, and up to around 30% in Portugal). But in all cases submitted to the judgement of the interviewees, less than 30% opted for further preferences given to care, in many cases only between 10% and 20%. A closer look at the case of conflicting planning decisions between public transport and private cars confirms the above statement The European average in favour of preferential treatment for public transport reaches 73%, against 14% in favour of cars. This result clearly shows the importance that citizens attribute to the further development of public transport. Support for the further development of public transport is even stronger in six member states: Italy (82% favour public transport: 9% favour cars), Spain (80%: 9%), Luxembourg (79%: 14%). the Netherlands (78%: 14%), Germany (75%: 14%) and the United Kingdom (74% : 16%). The other countries. Denmark (69% : 19%), Greece (68% : 11%), Portugal (65% : 7%), Belgium (64% : 22%) and France (62% : 62%), still have more than an absolute majority in favour of public transport. In Ireland, which ranks last, almost twice as many citizens (49%) opted in favour of preferential treatment for public transport than for cars (25%). This generally positive attitude to the further development of public transport was shared by all socio-professional groups, but the strength of support varied slightly. On a scale ranking from +1 (= dear preference for cars) to +4 (=clear preference for public transport), the EC average was Stronger approval for public transport could be observed among opinion leaders (3.27) and employed professionals (3.35). Employed.professionals in fact belong to the most frequent users of tram/underground and train. As expected, those living and working in urban areas (3.21) and - of course - public transport users in general (3.33) opt for a further preferential treatment of public transport. But even frequent car users show a rather high degree of support (3.12). Expressed in percentages, this means that 45% of car users opted for "preferential treatment for public transport with certain disadvantages for private cars", and another 29% of car users opted for "clear preferential treatment for public transport to the detriment of private cars". In the case of conflicting planning decisions, only 15% opted for preferential treatment for private cars, to the detriment of, or with certain disadvantages for public transport As shown in figures 12 and 13, the results obtained from two supplementary questions give further evidence to the argument that Europeans are dearly against further preferential treatment for cars where conflicting traffic planning decisions are concerned. In the case of conflicts


25 -15- Figure12 Figure 13 between pedestrians and private cars. 75% of all interviewees took the side of pedestrians. This opinion was supported most strongly in Italy (83%). the UK and the Netherlands (both 80%).
26 -16- Spain (79%), and Denmark (78%). Even in Portugal (63%) and Ireland (59%) - the two countries at the bottom end of the scale - a dear majority opted for further preferential treatment for pedestrians. In the case of conflicts between cyclists and private cars, the overall tendency was similar. 64% of all Europeans took the side of cyclists, as compared to 23% for private cars. Support for cyclists was very high in the Netherlands (81%), Denmark (76%) and Italy (71%). Again, Ireland and Portugal showed a relatively weaker support for cyclist: 52% of the Irish opted for further preferential treatment for cyclists, and 24% for cars. Portugal was the only EC country, that came dose to a balanced support for cyclists (37%) and cars (30%). B) Correct judgement by political decision makers. Interviewees were asked whether they believe that political decision makers in their urban area have judged people's feelings on traffic planning of the people correctly or not The vast majority of those expressing an opinion on the subject are convinced that political decision makers responsible for traffic planning in urban areas do not make the judgements of people's feelings correctly on these issues. Before analyzing the national results in greater detail, attention should be drawn to the fact that this question obtained a particularly high percentage of "don't know" responses, varying between 18% in the UK and 41% in Portugal (average EC 12 = 28%). The European average of 53% "not judged correctly" compared to only 19% "judged correct" reveals a lack of confidence in politician's capacity to appropriately react to the desires and political preferences of their electorate in the field of traffic planning. This opinion is prevailing in Italy (63% "not judged correctly" : 12% "judged correctly"), in the U.K. (57% : 24%). and in Germany (55% : 16%). In Greece (53% : 15%), Luxembourg (53% : 27%), Belgium (52% : 14%) and in the Netherlands (51 %: 22.%). an absolute majority of interviewees shared this perception. In all other EC countries, the feeling about inaccurate judgements by decision makers was less wide-spread. However, nowhere did the view that people's feelings were correctly assessed by political decision makers prevail.
27 .17- Figure 14 Figure 15
28 - 18- A closer examination of those who think that politicians have a incorrect perception of reality leads to the following results: a broad majority of citizens are convinced that people are in reality less in favour of cars than decision makers think they are. Between 26% of all interviewees (in Portugal) and 44% (in the Eastern part of Germany) share this view, the EC12 average is 36% The opposite opinion - people being in reality more in favour of cars than politicians think they are - is supported to a much lesser degree. The maximum was obtained in the Western part of Germany (21%) and the minimum in Portugal (10%). the European average being 17%. Socio-professional categories: within the group of those thinking that political decision makers do judge people's feelings correctly (EC average = 19%), only few variations could be observed: this option obtained a particularly low score among the independent professionals (12%). A higher percentage (26%) of supervisors considered the politician's judgement to be correct The opinion that people are less in favour of cars than politicians believe (EC average = 36%), is particularly shared by employed professionals (49%), other office employees (44%). and the middle (42%) and general management (39%). It obtained a particularly low score among farmers/fishermen (28%), supervisors (26%) and retired people (32%). For this item. the degree of urbanization and the transport behaviour of the interviewee plays an important role: 44% of those living and working in an urban area supported the view that politicians over-estimate people's favourable view of care, compared to 31 % of those neither living nor working in cities. 41% of public transport users and 36% of car users shared this opinion. It should be underlined that only 16% of car users believed that politician's judgement is correct The last option - people being in reality more in favour of cars than politicians believe - only scored slightly above the EC average (17%) within two groups: the general managers (23%) and the independent professionals (27%). Finally, only 16% of car users actually said that people in reality are more in favour of cars than politicians believe.

29 -19- Ill) Which means of transport do people use In the questions analysed until now, the analysis of people's opinion has been dominant We tried to identify what precisely people in the EC think and believe about certain concepts related to traffic problems and public transport Now we want to analyse the interviewees' actual behaviour in this domain. Naturally, this depends not only on their personal preference for one means of transport or another, but it is largely determined by other factors (existing transport infrastructure in urban and rural areas, income and the fact of having a car or not, demographic factors, etc.) Figure 16 In order to identify the mobility of people in everyday life, they were asked for their frequency of use of various means of transport For our analysis, a specific factor was attributed to each of the possible answer categories in order to facilitate the comparison and interpretation of the results. The following scale was used:
30 -20- Frequency of use factor (almost) everyday 1-2 per week 1-3 per month lees than 1 per month not in past 6 months = = The average values obtained and represented in the graphics facilitate the comparison of results for different countries and different means of transport The summary graph clearly indicates that the direct comparison between the combined results of public transport (bus, tram/metro/train) on the one hand, and private cars (used as drivers and passengers) on the other, leads to rather unfavourable results for public transport In fact. the use of private cars is. in all European countries, significantly higher than the use of public transport The most favourable result for public transport obtained in the Eastern part of Germany, should be carefully interpreted. Obviously the situation in the ex-gdr is changing. East Germans have been using cars less frequently and public transport (and bicycles, etc.) more frequently than West Germans. These results are linked to a different organisation of social life, and will probably change toward to the pattern of the ex-frg in the near future. On the following pages, we shall analyse in greater detail the results for each of the different means of transport Although listed as an option during the interviews, taxis have not been included here for their minor statistical significance 3. ' The EC average of use tor taxis is 1.50; the highest results were obtained in Greece (2.37). the U.K. (2.06) and Luxembourg (2.03)

31 -21 - A) Who uses public transport and how often? The two figures on the previous page show the overall social, demographic, and professional composition of the group of public transport users. In the following part of this report, the results obtained for each of the means of public transport shall be analyzed in greater detail 1. Buses: Buses are the means of public transport most widely used in the EC (average = 2.97). They are particularly popular in Greece (3.76). in the U.K. (3.35) and in Portugal (3.33). The scores obtained in Luxembourg (3.14), Italy (3.11), Denmark (3.06) and Spain (3.06) are still above the European average. On the lower end of the scale we find Germany (2.93), the Netherlands (2.64) Ireland (2.53), France (2.43) and finally Belgium (2.33). Figure 17


32 -22- Figure 18 Figure 19
33 -23- When we examine the socio-demographic groups, we observe a significant difference between men (2.65) and women (3.27) concerning the frequency of using buses. The scores in the different age groups also show a lot of variation: years =4.14, this high index is due to the fact that 24% of all interviewees in this age group use buses everyday or almost everyday. The corresponding EC average is 12% years = 2.55; years = 2.61; we see that the age groups that are most active in professional life achieve a score that is distinctly below average. 55 years + = 2.84; use of buses within the group of older people is slightly below the average. The highest index among all socio-professional groups was obtained by those who are still studying (5.0). Within the different professional groups, buses are relatively popular among office employees (3.28) and those doing their military service or those who are temporarily not working (3.23). On the other hand, shop or company owners (1.90), farmers (1.92), the general management (2.13) and independent professionals (2.26) less often use buses; a fact that can probably be explained by the transport and flexibility requirements related to their professional activities. Among those living in an urban area, the frequency of bus use was significantly higher (3.83) than the EC average; those working in an urban area (3.49) equally obtained an above average score. Within the group of frequent public transport users, buses were more often used (6.95) than trains, trams, and metres (4.23).
34 Tram, Metro, Train: The European average (2.17) shows that trams, metres and trains are generally less frequently used than buses. Of course, these results have to carefully interpreted for each country separately, and must be seen - as was already mentioned before - in an overall perspective of the existing infrastructure (how many metros/trams exist in the different urban and metropolitan areas, number of commuters, seriousness of traffic congestion problems, competitiveness of prices etc.). Figure 20 Among the national results, the Eastern parts of Germany score highest (2.85), but again we can suppose that these results will sooner or later be closer aligned to the results obtained in the Western pans of the country (2.36). The frequency of using trams, metres and trains in the Netherlands (2.32). Denmark (2.31). France (2.22) and Belgium (2.19) is above the EC average. Italy (2.13). Spain (2.07). Portugal (2.02). Greece (1.97) and the United Kingdom (1.92) are not too far below this average. The results from Ireland (1.42) and from Luxembourg (1.10) are significantly lower.
35 -25- A breakdown of the results by socio-demographic categories leads to similar findings regarding the use of trams, trains or metres as was the case for buses: old people (55 years + = 1.83) are less frequent users, while young people between 15 and 24 (2.88), those still studying (3.55) and opinion leaders use these means of public transportation more often. Within the professional groups, we find the following groups who use trams, metres or trains less than the average citizen: farmers (1.52) and shop owners (1.61), supervisors (1.88). skilled manual workers (1.83) and other manual workers (1.92), housewives (1.76) and retired (1.81). On the other hand, the "white collar" groups tend use trams, trains, and metres more frequently: professionals (2.60). employed professionals (2.93), the general management (2.52), the middle management (2.54), and other office employees (2.51) score higher than the average. The frequency of use of these means of transport obtained a relatively high index (3.00) among those living and working in urban areas among those only living there, and 3.12 among those working there.

36 -26- B) Private cars 1: Private care as driver. While most people are aware of the negative consequences of car traffic in urban areas in general, and or. the deterioration of air quality in particular, the same people continue to use cars as their preferred means of transport in everyday life. The use of private cars as driver (5.54) obtained by far the highest average score among all means of transport suggested. On top of that, using private cars as passenger (3.85) clearly scored second. Figure 21 Of course these results are related to the variation of wealth within the EC, factors like GNP. ownership of cars. and road networks. Luxembourg (6.38). France (6.36), Belgium (6.26) and the Western parts of Germany (6.23) obtained scores above the index Denmark (5.96). Italy (5.80). and the UK (5.58) are placed above the EC average. Then follow the Netherlands (5.45) and Ireland (5.38) with dose-to-average results. Spain (3.81), Portugal (3.54) and Greece (3.45) obtain significantly lower scores.
37 -27- The analysis of the socio-professional categories leads to results, that could nearly be expected: men (6.85) drive cars more often than women (4.31), as do the professionally active age groups (25-39 years = 6.98,40-54 years = 6.50) when compared to young (15-24 years = 4.81) and old people (55 years + = 4.03). And although opinion leaders are particularly conscious of traffic problems, they are also well represented among those taking the steering-wheel most frequently: The data obtained from the different professional groups show plausible results: People working outside their homes, like farmers, professionals, managers, employees and workers, drive a car more often than the average, while pensioners, housewives, and soldiers score below the average. occupation Independent Professionals Shop/company owners Farmers/Fishermen Employed General management Professionals Middle management Office employees Other employees Workers Supervisors Skilled manual workers Other manual workers Other Millitary service Retired Housewives average percentage Within group driving a ear (almost) everyday

38 -28-2: Private care as passengers. When compared with the previous section, the data look different with regard to the distribution of results among both the EC countries and the socio-professional groups. When we look at the index expressing the use of private cars as passengers, the EC average (3.85) is exceeded by the UK (4.39), Belgium (4.36). the Netherlands (4.20). Denmark (4.15) and Italy (4.09). The results from Greece (3.83), Ireland (3.80), Luxembourg (3.70), Prance (3.68). Spain (3.59), and Germany are relatively closely grouped together. Portugal (2.75) scores at the bottom. Figure 22 With regard to the socio-demographic and professional groups, it was to be expected that the inverted version of the. previous question's distribution would be found. However, the results did not show as much variation as before: women (4.46) use cars more often as passengers than men (3.17). and students (5.34) and young people in general (5.03) more often than the other age groups (25-39 years = years = 3.64, 55 years + = 3.22). The professional categories that scored particularly high for their active use of the car, use it less frequently as passengers than the average, white housewives (4.56) and soldiers (4.33) score above the average here.

39 -29- C) Bicycles, mopeds and motorbikes. A comparison of the indices of the use of bikes, mopeds and motorbikes (EC average 2.95) shows that they are used as often as buses (2.97). But in the case of "two wheels", the national differences vary to a much larger degree, which is obviously due to the very high results obtained in two countries: the Netherlands (6.72) and Denmark (5.39). In the Netherlands, 53% of all interviewees said they use this category of vehicles (almost) everyday (Denmark = 40%. EC average = 14%). Another 17% of the Dutch use them once or twice per week (Denmark = 14%, EC average = 12%). Germany (3.88) Belgium (3.64) and Italy (3.14) score above the EC average as well. The Irish results (2.52) are between the EC-score and the remaining group of countries, which score around Figure 23 With the exception of young people (4.16). students (4.78) and - at the other end of the scale - old people (2.40) and particularly the retired (2.31), no important variations were observed within the socio-demographic groups.
40 .31. IV) Reasons for not using public transport: In order to find out precisely what prevents people from using public transportation in daily life, a list of reasons was presented to the interviewees. The following figure presents an overview of the importance attached to these reasons. Figure 24: basis = those using public transport occasionally or never; N = On the following pages, we shall examine each of these reasons in closer detail.
41 -32- A) Reasons for not using public transport: There are no convenient lines of public transport, catering for my needs, for example the schedules are not convenient for me or public transport doesn't go where I want to go. Throughout the Community, this was the reason most frequently cited (38%) by those who don't use public transport, when they were asked for their motives. Figure 25 In some of the countries though, this response was given even more often: in Italy (52%), in Germany (51%). in Denmark and Luxembourg (43%). and in Belgium (40%), inconvenient lines were cited very frequently. The same reason was less important for the interviewees in the Netherlands (36%). in the UK (30%) and in France (27%). It obtained a relatively low score in the other Southern European countries: Portugal (31%), Greece (24%) and Spain (21%). Inconvenient lines as a reason for not using public transport were particularly important for opinion leaders and for the better-educated, while housewives (32%). soldiers (30%) and old people (27%) considered it as less important
42 .33- Looking at professional groups, an interesting phenomenon becomes apparent We have observed before, that three specific groups, middle management, employed professionals, and other office employees, were relatively frequent public transport users. Within these same groups there are a large number of non-users who give the lack of convenient lines as a reason for thenbehaviour: Prof. group supervisors middle management general management farmer/fishermen employed professionals professionals other offlce employees other manual workers skilled manual workers avenge of PT usage (EC average = 5.14) 4.37 & % of non-users citing this reason (EC= 38%) More research is needed to conclude whether this phenomenon is a result of pure (selective) perceptions about the existing facilities, or whether in their case there is an 'objective' lack of convenient lines. Nevertheless, the lack of convenient lines typically appears to be an argument used by the active population and the more so by white collar groups. B) Reasons for not using public transport: Public transport is too slow, takes too long. Again, the opinion that public transport is too stow was particularly wide-spread in the North of Europe: in Denmark (36%). the Netherlands and Belgium (35%), and Germany (30%). This argument was frequently cited in Greece (31%) as well. Italy, Ireland, and the UK (all 27%), Luxembourg (25%) and Spain (24%) are close to the EC average (27%). In Portugal (21%) and in France (19%), this reason was slightly less often cited. As was the case with regard to the previous reason (inconvenient lines) we find that men (30%) list the slowness more often than women (23%); young people do so more often than old people, and those situated at the top of the opinion-leadership- and education-scale more often than others.
43 -34. Figure 26 This lack of speed on the part of public transport is of particular importance to the white collar professions: general management 41%, office employs 38%. middle management 35%. employed professionals 34%. non-office employees 32%. The lack of speed was less important tor workers - with the exception of skilled manual workers (32%) - and the independent professions. The lack of speed of public transport is particularly important tor those who are either living and working (36%) or only working (36%) in urban areas.
44 -35- C) Reasons for not using public transport: Public transport is too restricting for me. Both the country-by-country comparison and the breakdown by professional groups show similar patterns as before. Non-users of public transport in the Netherlands (33%), Belgium (32%), Denmark and the UK (25%), and finally Germany and Ireland (24%) cited the argument of public transport being too restricting more often than the EC average (21%). France (22%), Luxembourg (20%) and Italy (18%) are relatively dose to the EC result The other Southern European countries have significantly lower results: Spain (9%). Greece and Portugal (8%) are below 10%. Figure 27 The notion that public transport is too restricting was roughly speaking important for the working population, and more so tor white collar workers. It was particularly wide-spread among independent professionals (30%). supervisors (34%). skilled manual workers (26%) and - as in the case of the previous arguments - employed white collar professions: professionals (31%), middle management (30%), other office employees (26%), and general managers (23%) cited this argument for not using public transport more often than others (workers, independents, and housewives).
45 -36- For most of the suggested reasons for not using public transport, people working in cities obtained results dose to the EC average. The degree of urbanization of the interviewees thus did not play an obvious role - except for two specific arguments: "public transport is slow" and "public transport is too restricting" Both reasons are important for those who are working in urban areas. D) Reasons for not using public transport: Public transport is too expensive (EC = 19%) / public transport is not regular, you cannot trust the schedules (EC = 18%). Both reasons for not using public transport obtained results close to 20 % on the EC level. Figure 28 The argument of public transport being too expensive is difficult to compare between member states because the results are related to different national income structures and varying rates tor public transport. The argument of cost is frequently listed in the Netherlands (36%). Germany (31%), Belgium (29%), the UK (28%). and Portugal (25%). The Danish result (19%) equals the EC average. The remaining countries obtain significantly lower outcomes, ranging from 13% for Spain to 7% for France at the bottom end of the scale.
46 -37- When judging the reliability of public transport schedules, the scope of variation between the national results is even wider. The argument of unreliable schedules was voiced by the non-users in Italy (28%) and in the UK (26%). Most of the other countries obtained results between 12% (Germany) and 21% (Belgium). Unreliable schedules were scarcely cited in two of the EC countries: in France (8%), and in Denmark (4%). Figure 29 Apart from those who are still studying ("too expensive" = 26%, "unreliable schedules" = 25%), no particularly striking variations in results could be observed within the demographic groups. Support tor the statement that public transport is too expensive varied between 11% (shop owners) and 23% (middle management and manual workers). (General and middle) management claim that public transport is too expensive and, at the same time. that public transport is too slow, the underlying argument being 'time is money'. The argument of unreliable schedules was particularly often cited among employed professionals and other office employees (29%). People living and/or working in urban areas gave this answer more frequently (23-24%) than the EC average.
47 -38- E) Various other reasons for not using public transport As shown before in figure 24, the other motives for not making use of the public transport network appeared to play an unimportant rote. On the whole. lack of information, physical problems, the argument that "public transport is not for people like me", or lacking cleanliness seem hardly to be the reasons that make people run away from public transport. The same is true for "not feeling safe on public transport" or "unfriendly star. I am not well informed about public transport services: On the EC average, 9% of the interviewees gave this reason for not using public transport. Figure 30 In four of the EC member states, more than 10% non users of public transport said they were not well informed about public transport services. These countries are Germany (14%). Luxembourg (12%), Italy and Belgium (11%). Lacking information seemed to be slightly less important for non-
48 -39- users in Ireland, in the UK (both 8%), in Denmark and in Greece (both 7%). Only 6% of the nonusers in France and in the Netherlands gave this answer. Finally, missing information about the services was rarely cited at all in Portugal (4%) and in Spain (3%). I have physical problems, disabilities which make the use of public transport difficult 5% of all non-users in the EC said that physical problems were one of the reasons not to use public transport Figure 31 The frequency of this argument in the 12 member states did not vary significantly. The highest frequency of this answer was obtained in the UK (8%), while non-users in France (3%), Spain and Greece (both 3%) cited physical problems less often. As was expected, the motive of physical problems was particularly often cited by old people (55 years + = 11%, retired = 14%).
49 -40- Public transport is not for people like me: On the EC level, only 5% of those who do not frequently use public transport gave this reason. Figure 32 A comparison of the national results shows, that this argument was slightly more often cited by non-users in Ireland (10%). Belgium (8%), Italy (7%). the UK and Spain (both 6%). This reason hardly plays a role at all for non-users in Luxembourg (3%) and in Germany and Portugal (2%). Education, age, sex, and opinion leadership index does not seem related to the invoking of this reason. Slight differences could be observed between some professional groups: independent professionals (9%) and shop or company owners (7%) gave this answer relatively often, but it was less important for employed professionals (3%) and general managers (1%).
50 -41 - Public transport is dirty: 5% of the non users in Europe said that lack of cleanliness is a reason for them not to use public transport This result was more often found among non users in the ex-gdr (15%) and in the UK (12%). In Greece, Ireland and Portugal (all 3%), in Spain and Luxembourg (both 2%), and in Denmark and the Netherlands (both 1%), a lack of cleanliness of public transport hardly played a role. Within the professional groups, three results can be mentioned: employed professionals (14%). supervisors (11%), and soldiers (10%) cited this argument relatively often. A final remark: when interpreting these results, it should be kept in mind, that not all of the reasons for not using public transport have been identified comprehensively; 28% of the interviewees for this question cited other reasons, which were not included in the originally preceded reasons for their behaviour.
51 .43. V) Reasons for using public transport The next step of the analysis identifies the motives of those using public transport in daily life. The following figure presents an overview of the reasons given by public transport users. Figure 33: basis = those using public transport at least once a week; N = 3719 In a next step. these reasons will be examined more closely.

52 .44. A) Reasons for using public transport: Public transport is a comfortable and practical means of getting around. On the EC level, this reason tor using public transport was, with 42% by tar most often listen. The fact that this reason is mentioned more often than the lack of alternative private transport only adds to its importance. Figure 34 A closer look at the national results reveals large differences: In Italy (60%) and France (62%). around 2/3 of the users said that public transport is comfortable and practical Percentages tor this assessment of public transport outscore the EC average of 42% in Portugal and Belgium (50%), as well as Luxembourg (46%), Denmark (44%), and Spain (43%). The result obtained from Irish users follows closely (40%). Results from the Netherlands (35%), the UK (34%) and Greece (31%) hover around the 1/3 mark, and only Germany (22%) - and especially the ex-gdr (14%) - scores rather low.
53 .45- Users who can be considered as opinion leaders appeared to be somewhat more critical (++ = 38%, -- = 46%) about the comfort and practicality of public transport Among professional groups, the differences in results are of a much more distinct nature. The frequency of citing the argument that public transport is comfortable and practical varies between 12% (farmers) at the bottom end of the frequency scale, and 59% (independent professionals) at the top. Public transport users above 55 years of age (47%) mention this reason to a much higher degree than other age groups. Other variables, like urbanization, use of different means of transport, or agreement with political decision makers' judgement, do not seem to be related to the degree of support for this and most of the following reasons for using public transport.
54 -46- B) Reasons for using public transport I dont have a car or motorbike. Throughout the EC, 35% of public transport users state that they use it, because they do not possess a personal car or motorbike. Figure 35 National variations of the results obtained for this argument were wide-spread again. Among the European public-transport users, this argument was cited most frequently in Ireland (54%) and in the UK (48%). In five other countries, the frequency of this argument surpassed the EC average: Denmark (44%). Belgium (42%). Portugal (40%). the Netherlands (38%) and Greece (36%). Below the EC-average (35%). we encounter Spain (33%). Italy (32%), Luxembourg (31%), and Germany (30%); France scores very low with 23%. Using public transport due to tacking alternatives is particularly important for young people (45%) and for those still studying (42%). Besides that. ft is interesting to note that men cite this argument less often than women (32 vs. 37%). as do opinion leaders (33% for those with a high opinion leadership index, compared to 41% for those with a low index).
55 -47. C) Reasons for using public transport: Public transport is cheap. 29% of European public transport users said they do so because it is cheap. Again, results vary widely by country: Figure 36 The incentive of a low price is frequently cited in Greece (55%). Italy (41%). and Spain (37%). The results obtained tor this reason in Denmark (34%), Luxembourg (33%) and the Netherlands (31%) are clearly situated above the average as well France (30%) and the UK (28%) come dose to the EC result In Ireland (22%), Portugal (21%), Belgium and Germany (both 16%), the public transport's price tag does not seem to play a very stimulating role. The low price is often referred to by the less educated and soldiers (both 34%). As could be expected, this argument was less frequently cited by the general and the middle management (22 and 20% respectively). For these rather wealthy income groups, the cost of public transport does not seem to play an important role in the decision to use it or not The tact that it can save them time, however, does. Apart from these remarks, very few significant variations were observed among the socio-demographic and professional groups.
56 -48- D) Reasons tar using public transport: Public transport is regular, one can trust the schedules. Figure 37 The regularity of public transport schedules stands out in Germany (29%) when compared to the EC average of 21%. Within this country, we can observe a targe discrepancy between the Western parts (33%. the highest result), and the Eastern part (14%. EC-wide one of the lowest results). The results from most of the other countries come in fact very dose to the EC average, the only significant exceptions being Italy (15%), Spain (14%) and Ireland (13%). Among the socio-demographic groups, one result particularly stands out 40% of supervisors using public transport said they do so because they can rely on the schedules. This result amounts to nearly twice the EC average. Most other demographic and professional groups deviate only slightly (3-4 percentage points) from the EC result, the only exceptions being the retired (26%) on the one hand and soldiers (16%) on the other.
57 .49- E) Reasons for using public transport: Public transport enables me to save time. EC-wide, level, 20% of public transport users stated they do so because it enables them to save time. The national results show a relatively wide diversity. Public transport users in France (33%) and Portugal (29%) clearly score above the average. Users in Greece and in the Netherlands (both 5%) seem to attach little value to this argument Figure 38 When we examine the results among the different professional groups, one conclusion immediately becomes evident: "saving time" is a major argument in favour of public transport among the white collar professions, and especially so for independent professionals (48%). The fact that 27% of the highly educated supported this option as well, provides additional evidence to this conclusion. The argument of saving time was one of the few items, where varying results within the different urbanization-groups could be observed:
58 .5Oworking in urban ana 27% living and working in urban area 24% living in urban area 20% neither living nor working in urban area 15% F) Reasons for using public transport: Public transport avoids accidents Figure 39 The traffic safety of public transport was particularly appreciated by Its users in Italy and in the ex-gdr (both 24%). The other national results were rather dose to the EC average of 18%. Portugal (14%) and Prance (13%) rank at the bottom end of the scale in this case. Once again, opinion leaders and the group of higher educated cited this argument more frequently than their counterparts in the respective groups.
59 .51. G) Reasons for using public transport: Public transport does not cause much pollution. Support tor this ecological argument was very unevenly spread throughout the Community. The EC average of 15% is composed of rather high results obtained in the Netherlands (32%). Germany (29%), and Denmark (26%) on the one hand. and tow results from public transport users in Greece and Portugal (both 4%), and France and Ireland (both 6%) on the other. This argument only moderately motivates users in the remaining countries: Luxembourg (14%), Spain, the UK and Italy (all 12%), and Belgium (11%). Figure 40 The environment-friendly quality of public transport was particularly appreciated by. once again, opinion leaders (24%). and the better educated (23%). It is therefore reflected in a slightly higher score for white collar workers.
60 .52. H) Various other arguments for using public transport Public transport is modem: This motive was relatively wide-spread among users in the UK (23%) and Ireland (22%). but was mentioned only by 13% of all European users. Figure 41 Public transport's modernity plays a role for older people, the lower educated and those with a low opinion leadership index, supervisors (32%). other manual workers, housewives, soldiers and retired (all 16%). The different groups of employees all obtained below-average results. Easy access for old and disabled persons counted in Germany (14%), in the UK (13%), and in Ireland (11%). and obtained an average of 9% throughout the EC. Not surprisingly, old people, the ones directly concerned, died this argument nearly twice as often (17%) as the average citizen, while opinion leaders (5-7%) and the higher educated (5%) did hardly give it as a reason.
61 .53- The cleanliness of public transport was not unimportant for the users in the Netherlands (11%) and in Germany and Ireland (both 9%), but the EC average of 5% clearly indicates its low overall significance. The attitude of the staff obviously played a neglectable role as a motive: the highest results were obtained in Portugal (8%) and in Ireland (6%), while its 3% EC average represents the lowest result for any of the possible reasons to use public transport It should be underlined, that most of the reasons in favour of public transport are also recognized by those public transport users, who also use other means especially cars - on a regular basis. The results obtained for these groups were not distinctively lower than the EC average in the specific case of avoiding accidents, car drivers (20%) cited this argument even slightly more often than the EC average (18%). Public transport users who have a negative opinion on the consequences of urban car traffic cited several 'practical' reasons for using public transport more often than others: 44% of those saying that these consequences are "unbearable" cited public transport's comfort and practicality, 33% its low price, 21% its time-saving qualities and the motive of avoiding accidents.

62 .55. VI) Support for different statements about public transport A) Confrontation with other kinds of people. The vast majority of citizens in every member state strongly disapprove of the following statement: "/ personally do not feel very much at ease when using public transport because I might have to sit next to people of another nationality, of another race, of another culture or of another social class.' 89% disagree either slightly or strongly. Figure 42 If we only consider the two most forceful statements - "agree strongly" vs. "disagree strongly" - this unambiguous result becomes even reinforced: only 2% of all interviewees "agree strongly" with the above statement with regard to other kinds of people, while 72% of all interviewees "disagree strongly". In France, even though the level of agreement is highest of all member states. it still only amounts to 14%.
63 .56- The same opinion is nearly unanimously shared by all different social, demographic or professional groups. No significant deviations of the results could be observed. Those who are actually using public transport, rejected the statement even somewhat more (92%) than the group of non users (88%). B) Changes in petrol prices. Most EC citizens (60%) agree with the statement: 'Up till now. changes in petrol prices have not altered my use of the car.', but 23% of the Europeans state that they have changed their behaviour. It should be noted as well. that the percentage of people responding with "don't know" or giving no answer at all was rather high (EC =17%). especially in the case of Greece (44%) and Spain (27%). Figure 43
64 -57. Among those who say they actually introduced changes into their use of cars due to changes in petrol prices, the Greeks are foremost (34%). Luxembourg and Italy (both 31 %), Germany (27%), and Portugal (24%) still score higher than the EC average. In the other countries, between 17% and 21 % of respondents indicated a change in the use of cars. Danish car users appeared to be the least affected (11%) by changing petrol prices. Several groups among the interviewees claim to have even less frequently altered their use of the car. Men (65%) seem to be less influenced by changing petrol prices than women (56%). probably because they are more likely to use a car for professional purposes; the same is true for the professionally active age groups between 25 and 54 years, for opinion leaders and for the better educated. A more-than-avarage proportion of all professional groups - with the exception of other office employees - say that changing petrol prices did not cause them to modify their use of cars. As ft was to be expected. 69% of frequent car users claimed not to have changed their behaviour. against 42% of public transport users. Urbanization did not play a role: city dwellers and commuters did not change their behaviour more or less frequently than others. C) Confidence in technological progress 40% of EC citizens agrees with the statement that technological progress will ultimately solve the problem of traffic congestion, while 44% disagree. The national differences were distinctly marked. Scepticism about the technological capacities to solve the problem of traffic congestion was strongest in the UK (54%). Luxembourg (54%), and the Netherlands (53%). In Italy (47%), Germany (43%), and Belgium (41%), disagreement was still stronger than agreement In France (41%) and Denmark (40%), respondents had a rather balanced view hi favour of or against the proposal, while interviewees in Spain, Ireland, Portugal and Greece tended to have confidence in the problem solving capacities of technological progress. Once again, the percentage of those who did not express an opinion was rather high in all countries, varying between 11% in the Netherlands and 32% in Portugal
65 58- Figure 44 This scepticism was slightly more pronounced among opinion leaders and the better educated, as well as among independent and employed professionals. Car users and public transport users do hot disagree on this statement Urbanization did play a role in the response: the level of agreement was higher among those living and working in rural areas. D) Increasing coot for the use of cam. 'Public authorities should contribute to solving the problems of congestion by increasing the cost of using cars' This statement, implying direct negative consequences on the financial situation of most interviewees, was obviously unpopular. In the entire Community. 64% of respondents rejected increasing car costs, and only 29% agreed. In the Netherlands (46% pro vs. 48% against), the supporters and those opposed were almost in balance. Support for increasing costs in Spain (42%), Luxembourg (35%). the UK (34%) and in Portugal (31%) was situated at a level
66 .59- superior to the EC average, in all other countries, support was rather weak. varying between 27% in Denmark and 20% in France. Figure 45 With the only minor exception of those still studying (37% "agree" vs. 55% "disagree"), priceincreasing measures would be equally unpopular among all socio-demographic groups. It should be underlined that rejection of such cost increases was not exceptionally strong among car users : 26% of car users even agreed with higher costs. Naturally, support for increasing costs for cars was stronger among public transport users (35%), but still the majority of this group (56%) clearly rejected this suggestion. Increasing car costs meets opposition especially among supervisors and general managers (both 77%). and skilled manual workers (72%).
67 .61 - VII. Possible solutions for traffic congestion problems Seven different concepts for the solution of traffic congestion problems were presented to the interviewees. They were asked to indicate for each of these concepts, whether they believed that it constituted an effective or ineffective solution for traffic congestion problems. A detailed analysis of the strength of support for the different concepts will show, that Europeans are strongly in favour of developing public transport, but are much less convinced of the effectiveness of other concepts implying immediate negative financial consequences. On the following pages, these possible solutions are examined in detail, in decreasing order of support A) Developing public transport Among the various solutions for traffic congestions, developing public transport was strongly supported by the interviewees. 80% of all EC citizens believed that developing public transport constituted an effective means to improve the present situation. Only 14% of all interviewees said it was ineffective. Backing for this solution was strongest in Spain (89%) and Italy (88%). Results from Germany (80%) and Portugal (79%) were very close to the EC average. In the UK (76%). Luxembourg (75%), the Netherlands (74%) and France, almost three out of every four interviewees opted in favour of the further development of public transport In Ireland (70%). Belgium (66%), and Denmark (63%). supporters of this solution outscored opponents by more than 2:1. Support was particularly high among the higher educated and opinion leaders:
 than those living and/or working in urban areas (83-84%).")
68 -62- Figure 46 Within the professional groups, white collar professions once again scored very highly: Those neither living nor working in cities supported the further development of public transport slightly less frequently (78%) than those living and/or working in urban areas (83-84%). The evaluation of the consequences of urban car traffic slightly influenced the results: 83% of those judging these consequences as "unbearable" opted for the further development of public transport, compared to 'only' 76% of those thinking that the consequences are "bearable". Even 80% of the car users were of the opinion that this would be an effective solution.
69 .63. B) Creating more pedestrian areas. This solution turned out to be the second most popular solution to traffic congestion problems among EC citizens. 75% of interviewees believed creating more pedestrian areas to be "effective": while only 18% believed the measure to be "ineffective". The national results varied within a relatively narrow margin. Support for pedestrian areas is particularly strong in the ex-gdr (82%). This result is quite different from the one obtained in the Western part of Germany (64%. the second lowest). In the group strongly supporting pedestrian areas, we find Spain and the UK (both 80%), Italy (79%), Greece and France (both 78%), Portugal and Ireland (both 76%), and Belgium (75%). Luxembourg (74%) and the Netherlands (72%) are not far below the EC-average, and only Germany (67%), and Denmark (57% "effective", vs. 36% "ineffective") are not so very convinced of the effectiveness of more pedestrian areas as a solution to traffic congestion. Figure 47

70 .64. C) Limiting car traffic in town centres. The two previous approaches to finding a solution to the problem of traffic congestion can be defined as 'constructive' ones: at first sight, they do not involve personal limitations upon interviewees. The next possible solution is the first one posing direct and concrete restrictions on many people. Still, limiting car traffic in town centres was widely perceived as an effective measure. Throughout EC. 71% of interviewees opted for, and only 22% against this particular measure. Support for limiting car traffic was strongest in Denmark (81 %), followed by Italy (78%). the UK (76%), Ireland (74%), the Netherlands (73%). Luxembourg (72%), and Spain (71%). Germany (69%), Portugal (68%), Greece (65%), France (63%), and Belgium (62%) scored under the average. Nevertheless. all member states displayed an absolute majority of those of the opinion that strictly limiting car traffic in town centres was an effective solution. Figure 48
71 .65- Once again, opinion leaders and the better educated supported this option to a relatively great extent. Support for this solution from white collar professions was higher than the EC average. Supervisors (67%) and skilled manual workers (66%) showed the lowest degree of support of all professional groups. The hypothesis that support for traffic limitations would be influenced by the evaluation of the consequences of urban car traffic, was confirmed by the results. 74% of those saying that these consequences are "unbearable* opted in favour of car traffic limitations. It is interesting to observe that respondents who are living or working in urban areas (71-72%) have the same opinion on traffic limitations in dty centres as respondents from rural areas. The same is true for frequent car users. D) Building new urban highways. A glance at the graph clearly shows that the issue of new urban highways is a highly controversial one in the EC. In this sense, the calculated average of 59% "effective" and 29% "ineffective" should be carefully interpreted. A closer look at the national result reveals considerable contrasts in judgement as far as new urban highways are concerned: In the Netherlands (73%) and in Denmark (70%). a very large majority of the interviewees is against new motorways as a remedy for traffic congestion. Only about a fifth of the whole population there is convinced of their effectiveness. In Luxembourg (51%) and in the Western parts of Germany (44%), resistance against new urban highways is much lower, but is still more important than support for them. In the UK (43%), Germany as a whole (39%). and Belgium (38%), respondents who are against this measure are already outscored by supporters. In Ireland and the mediterranean EC countries, those thinking that new highways are an effective solution for traffic congestion problems constitute a very broad majority. France (19%). Spain (16%), Greece (15%). Italy (10%). and Portugal (5% "ineffective" against 82% "effective") clearly opt in favour of new urban highways - a fact that could partly be explained by the present state of the highway infrastructure in these countries, which might be perceived as insufficient

72 .66 Figure 49 This (tern was one of the few, where a difference in perception between men and women became visible: 62% of the men said that new urban highways were "effective", whereas only 56% of women were of this opinion. Within the professional groups and sub-groups, the support for new highways was in fact very diverse, ranging from general management (47% "effective") to independent professionals (66%) and shop owners (68%). Once again, the degree of urbanization hardly influenced the results. Support for new urban highways was similar among city dwellers, commuters and non-city dwellers: Support for new urban highways was neither exceptionally strong (61%) among car users, nor exceptionally weak (56%) among public transport users. But it is remarkable that a relatively high percentage (64%) of those who think that consequences of urban car traffic are "unbearable" opted for new urban highways as a solution for traffic congestion problems.
73 -67- A closer look at the other results obtained by those who think that new urban highways are an effective solution shows that this specific group seems to be at least somewhat incoherent in its opinion. The same people that believe in the effectiveness of new urban highways, turned out to be outspokenly critical of cars in previous questions: 65% of them said that car traffic in urban areas has gotten somewhat worse; 58% of them said that consequences of car traffic in urban areas are "hardly bearable" or even "unbearable"; 76% of them said that cars are the main cause or an important cause of the deterioration of the air quality in urban centres; 43% of them even said that cars are harmful to the air quality in their own living area. 74% of them opt for further preferential treatment of public transport instead of cars in the case of conflicting traffic planning decisions; and, finally, 72% of them think that "strictly limiting car traffic in town centres" is an effective means to solve traffic congestion problems. E) Tight parking restrictions in centres. As in the previous case. the support for this solution varied widely among the different member states. In Ireland (78%) and Luxembourg (74%). roughly three out of every four interviewees believed in the efficiency of parking restrictions. Support was very high in Greece (67%). the UK and Denmark (both 65%), Portugal (64%), Germany (61%), and Spain (58%). These countries scored well above the EC average of 53% of interviewees thinking that tight parking restrictions in town centres constitute an "effective" solution to traffic congestion. In the Netherlands, the group of supporters was slightly smaller, but continued to make up a majority (52%). In Belgium (40%). France and Italy (both 38%), tight parking restrictions were not very much favoured as an effective solution against traffic congestion.

74 .68- Figure 50 Opinion leaders displayed a slightly stronger support (58% "effective") for parking restrictions than others. Those between 25 and 39 years of age were critical: 49% considered the restrictions as "effective", against 45% who found them "ineffective". Vvithin the professional groups, the results were comparably varied as for the previous item. Employed professionals (63%) were more convinced of this solution than independent professionals (49%) or office and non-office employees (46% and 49% respectively). As for the suggestion of strictly limiting the access of cars to crty centres, it was surprising to see that tight parking restrictions were not categorically refused by car users: on the contrary, 52% of them were of the opinion that such restrictions were an effective solution.

75 -69- F) Motorist toll for entering urban centres. This solution, which entails immediate costs for anyone entering a city by car. was the secondmost unpopular. In no member state, support was greater than rejection. The EC average 65% "ineffective" against 25% "effective" - clearly shows the low degree of acceptance this measure could count on. Among the member states, Denmark scored exceptionally high: 45% of its citizens were in favour of an urban toll system, no less than 10 percentage points more than in the following country. In Ireland and Luxembourg (both 35%), and the UK (34%), about one third of interviewees supported this solution. Germany (27%), Italy and the Netherlands (both 24%) are relatively close to the EC average. In the other countries, weak levels of support varied between 21% in Spain and 17% in France. Figure 51 All socio-demographic and professional categories, including the breakdown by urbanization, transport behaviour, or perception of politicians' realism, agreed to a similar extent on the ineffectiveness of motorist-tolls. The only exceptional result was the relatively high degree of support for this solution among employed professionals (39%).

76 .70. G) Putting up petrol prices. Figure 52 While a motorist-toll would only affect those who actually enter a city by car, increasing petrol prices would have to be paid by every car user. whether they are adding to urban traffic congestion or not That might be the reason why this solution was even more unpopular than the previous one. At the EC level, only 12% of interviewees considered higher prices to be an effective means to reducing traffic congestion; 80% were convinced of its ineffectiveness. The level of those saying that higher petrol prices were "effective" was highest in the Netherlands, where a quarter of the population accepted them. Support was relatively strong in Luxembourg (22%). Germany (16%). Denmark and the UK (15%), and Ireland (12%). Stronger objections were encountered in Portugal and Spain (both 10% "effective"), Belgium (9%). Greece (9%). Italy (7%). and France (5% "effective", against 89% "ineffective").
77 -71 Conclusion The results of this survey dearly show, that most Europeans are aware of the seriousness of traffic problems in urban areas. In the opinion of the majority of European citizens, a negative development has taken place over the last years: car traffic has got worse (65%), the consequences of urban car traffic are hardly bearable or even unbearable (56%), 76% believe that the car is either the main cause or an important cause for the deterioration of air quality in urban centres, and the risk of accidents tor most of the participants - with the only exception of public transport users is perceived as considerably high. In such a situation, a majority of all interviewees (53%) thinks, that urban political decision makers do not judge people's feelings concerning traffic planning correctly; more than one third of all Europeans said, that in reality people are less in favour of cars than these politicians believe they are. An even stronger majority of citizens is against further preferential treatment of private cars, when conflicts arise in traffic planning decisions. In the case of a conflict between cars and other means of transport, 75% of all interviewees opted for preferential treatment for pedestrians, 73% for public transport, and 64% for cyclists. In spite of the respondents' knowledge about the negative impact of car traffic in urban zones, the private car remains the most frequently used means of transport When asked for their reasons for not using public transport, many non-users listed the following reasons : no convenient lines (38%), lacking speed of public transport (27%), or the feeling that public transport is too restricting (21%), too expensive (19%) or simply unreliable (18%). Other reasons. like the attitude of public transport staff, the cleanliness or users' feeling of safety obviously only played a minor rote. Within the group of public transport users, the corresponding, essentially practical arguments were most frequently cited when asked for the reasons for using public transport When asked for their degree of support for several statements related to traffic and public transport, Europeans responded as follows:
78 -72. a very broad majority (89%) disagree with people who say "/ do not feel very much at ease when using public transport because I might have to sit next to people of another nationality, of another race, of another culture or of another social class '. most citizens (60%) said not to have altered their use of the car due to changing petrol prices; a comparable percentage (64%) of citizens disagrees with the statement, that public authorities should contribute to solving the problem of (traffic) congestions by increasing the cost of using cars. opinions on whether technological progress will ultimately solve the problem of traffic congestion are rather balanced: 40% agree, 44% disagree. Finally, when asked for the effectiveness of various measures to solve traffic congestion problems. most of the Europeans (80%) think that developing public transport is "effective". Support is high for the creation of more pedestrian areas (75% "effective"), or limiting car traffic in town centres (71% "effective"). Other measures, like the creation of new urban highways or tight parking restriction in centres were considered "effective" by a majority, but contested by a significant part of the interviewees. Other measures, that would imply direct financial consequences, were considered as "ineffective" by most of the interviewees.
79 Appendix I Technical specifications of EUROBAROMETER 35.1
80 EUROBAROMETER 35.1 Between March 28 and April INRA (EUROPE) carried out the 35.1 wave of the STANDARD EUROBAROMETER, on request of the COMMISSION OF THE EUROPEAN COMMUNITIES and of the INTERNATIONAL UNION OF PUBLIC TRANSPORT (U.LT.P). Entre le 28 mare et to 25 avril INRA (EUROPE) a réalisé la vague 35.1 de l'euro- BAROMETRE STANDARD, à la demande de te COMMISSION DES COMMUNAUTES EURO- PEENNES et de ('UNION INTERNATIONALE DES TRANSPORTS PUBLICS (U.l.T.P). INRA(Europe) is a European Network of Market- and Public Opinion Research agencies, co-ordinated by the European Co-ordination Office (E.C.O.), Avenue R. Vandendriessche 18. B-1150 Brussels. INRA (EUROPE) est une chaîne Européenne d'instituts de sondage d'opinion publique et d'études de marché, coordinée par le Bureau de Coordination Européen (E.C.O.), Avenue R. Vandendriessche 18, B Bruxelles. The results of the Eurobarometer are made available through the Unit "Surveys, Research, Analyses" of the DG ICC of the Commission of the European Communities. All requests for further information should be addressed to Mr. Karlheinz REIF. DG X - ICC - SRA. "Eurobarometer'. Rue de la Loi 200. B-1049 Brussels. Les résultats de l'eurobarometre sont disponibles à travers l'unité "Sondages. Recherches. Analyses" de la DG ICC de te Commission de» Communautés Européenne*. Toute demande d'information supplémentaire doit être adressée à Mr. Kartheinz REIF. DG X - ICC - SRA. "Eurobarométre". Rue de te Loi 200. B 1049 Bruxelles. All Eurobarometer data are stored at the Zentral Archiv (Universitât Köln, BachemerStrasse. 40. D-5000 Kôln 41). They are at the disposai of all Institutes members of the European Consortium for Political Research (Essex), of the Inter- University Consortium for Political and Social Research (Michigan) and all those interested in social science research. Toutes les données relatives aux Eurobaromètrès sont déposées au ZentralArchiv (Universe tât Kôln. Bachemer Strasse, 40. D-5000 Kôln 41). Elles sont tenues à la disposition des organismes membres du European Consortium for Political Research (Essex), du Inter-Univer-sity Consortium for search (Michigan) et des chercheurs justifiant d'un intérêt de recherche. DETAILS ON SAMPLING L'ECHANTILLONNAGE In ail 12 countries of the European Community. in total national citizens, of 15 years and over. were Interviewed in face-to-face, in their private residence. Dans les 12 pays-membres de te Communauté Européenne, au total citoyens nationaux de 15 ans et plus ont été interrogés en face-à-face à leur domicile.
81 COUNTRY/PAYS Belgique Danmark Deutschland (ex-brd) Deutechland (ex-rda) Ellas Espana France Ireland Italia Luxembourg Nederland Portugal UK: Great Britain UK: Northern Ireland The basic sample design applied In all Member States is a mum-stage, random (probability) one. In all Member States a number of sampling points was drawn with probability proportional to population size. for a total coverage of each Member State, and to population density. For doing so, the points were drawn systematically from all "administrative regional units", after stratification by Individual unit and type of area. They thus represent the whole territory of the Member States according to the EURO- STAT.NUTS II and according to the distribution of the national, resident population in terms of metropolitan, urban and rural areas. In each of the selected sampling points, a starting address was drawn, at random. That starting address formed the first of a duster of addresses. The remainder of the duster was selected as every Nth address by standard random route procedures from the initial address. In Great Britain, a full random selection of respondents was applied, using electoral registers as sampling basis. In each household the respondent was selected according to a random procedure, such as the first birthday method or the KISJ-grid. At every such address up to 2 recalls were made to achieve an interview with that respondent The maximum number of interviews per household is one. All interviews were taken face to face. NUMBER OF RESPONDENTS NOMBRE DE REPONDENTS (NON PONDÉRÉ) Le principe d'échantillonnage, appliqué dans tous les pays-membres est une sélection aléatoire à multiples phases. Dans tous les paysmembres un certain nombre de points de chute sont tirés avec probabilité proportionnelle à la taille de la population, avec couverture totale de chaque état-membre, et à la densité de la population. Les points de chute sont tirés systématiquement dans chacune des "unités régionales administratives". après stratification par unité et type de région. On représente ainsi le territoire complet de chaque pays-membre, selon les régions EUROSTAT-NUTS 11 et selon la distribution de la population nationale en termes d'urbanisation. Dans chacun des points de chute, une adresse de départ est imposée, qui est sélectionnée aléatoirement Cette adresse est la première d'un duster d'adresses. Les autres adresses du duster sont sélectionnées comme chaque adresse N. par procédure standardisée de "random route" de l'adresse Initiale.** En Grande- Bretagne. une sélection purement aléatoire des repondants est appliquée, utilisant les listes électorales comme base de sélection. Dans chaque ménage le repondant est sélectionné selon une procédure aléatoire, comme la méthode du premier anniversaire ou la grille dite KISJ. A chaque adresse, jusqu'à 2 révisites sont faites pour réaliser une interview avec la personne sélectionnée. Pas plus d'une interview par ménage n'est admise. Toutes les interviews sont réalisées en face à face.
82 REALISATION OF THE FIELD-WORK REALISATION DU TERRAIN COUNTRY/PAYS Belgique Danmark Deutschland (ex-brd) Deutschland (ex-rda) Ellas Espana France Ireland Italia Luxembourg Nederland Portugal United Kingdom FROM: / DU: 01/04 09/04 03/04 04/04 09/04 04/04 28/03 04/04 04/04 30/03 02/04 01/04 02/04 TO:/AU: 22/04 22/04 16/04 15/04 21/04 23/04 19/04 25/04 17/04 25/04 23/04 16/04 20/04 POPULATION TOTAL: EC In all member States, fieldwork was conducted on the basis or detailed and uniform instructions prepared by the European Co-ordination Office (ECO) of INRA (EUROPE). Dans chacun des pays-membres le terrain est réalisé sur base d'instructions détaillées et uniformes. préparées par le Bureau Européen de Coordination (ECO) de INRA (EUROPE). COMPARISON BETWEEN SAMPLES AND UNIVERSES AND WEIGHTING OF THE DATA For each of the countries a comparison between the samples and a proper universe description was carried out. This Universe description was made available by the National Research Institutes and by EUROSTAT. COMPARAISON DES ECHANTILLONS AVEC LA POPULATION ET PONDERATION Pour chacun des pays une comparaison entre les échantillons et les chiffres de ta population, description d'univers, est réalisée. Les chiffres d'univers sont mis à ta disposition par les Instituts Nationaux et par EUROSTAT. For all EC-member-countries a national weighting procedure, using marginal and intercellular pondération weighting, nationale was carried est réalisée, out sur based des don- this Pour tous les pays-membres une procédure de nées marginales ou croisées, tirées de cette Universe description. As such in all countries. description d'univers. Ainsi, dans tous les pays, minimum sex. age. region NUTS II and size of au moins le sexe. l'âge, les régions NUTS II et locality were introduced in the Iteration procedure. For some countries extra variables were ta procédure d'itération. Pour certains pay ta taille de l'agglomération sont Introduits dans added, when considered necessary. des variables supplémentaires sont Introduites si nécessaire. For international weighting INRA (EUROPE) applies the officia) population figures aged 15 years and older as published by EUROSTAT in the Regional Statistics Yearbook of The total population figures tar input in this postweighting procedure are listed above. Pour pondérer au plan international. INRA (EU- ROPE) applique les données officielles de ta population de 15 ans et plus, publiées par EU- ROSTAT dans l'annuaire 1988 des Statistiques Régionales. Les chiffres exacts Introduits dans cette routine de post-pondération sont résumés dans le tableau précédent.
83 ADMINISTRATIVE REGIONAL UNITS UNÎTES ADMIMISTRATIVES REGIONALES
84 Appendix II Description of the sample
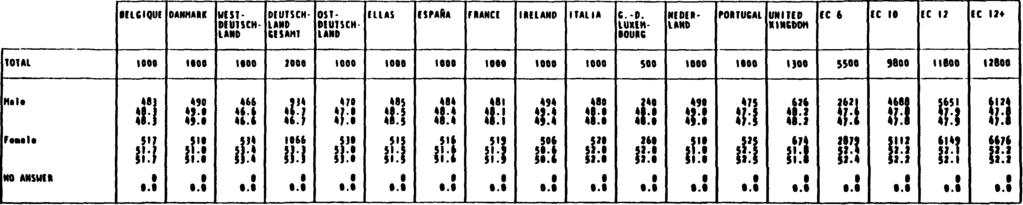

85

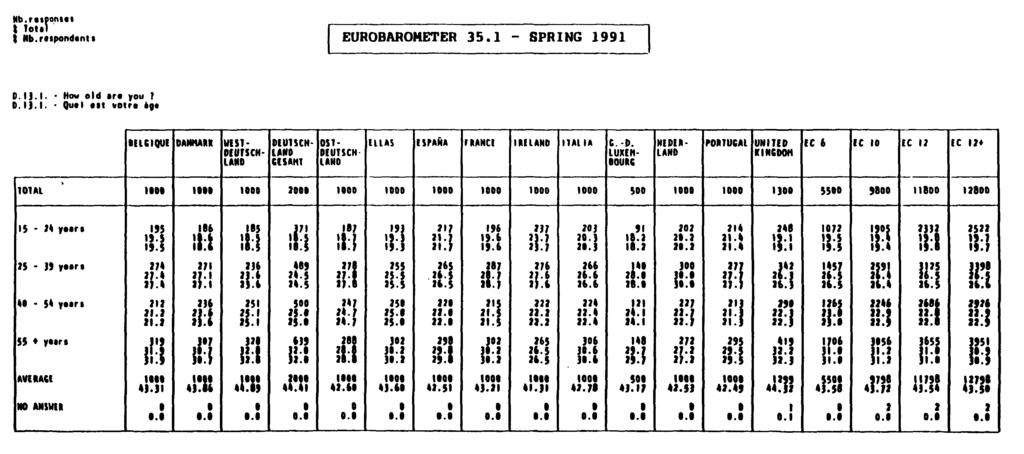
86
87
88
89
90 Appendix III Questionnaire

91
CONSUMER PROTECTION IN THE EU
 Special Eurobarometer European Commission CONSUMER PROTECTION IN THE EU Special Eurobarometer / Wave 59.2-193 - European Opinion Research Group EEIG Fieldwork: May-June 2003 Publication: November 2003
EUROPEANS AND RADIOACTIVE WASTE
 11/00452/99 EUROBAROMETER 50.0 EUROPEANS AND RADIOACTIVE WASTE REPORT BY INRA (EUROPE) EUROPEAN COORDINATION OFFICE sa FOR Directorate-General XI "Environment, Nuclear Safety and Civil Protection" MANAGED
Special Eurobarometer 469. Report
 Integration of immigrants in the European Union Survey requested by the European Commission, Directorate-General for Migration and Home Affairs and co-ordinated by the Directorate-General for Communication
INTERNAL SECURITY. Publication: November 2011
 Special Eurobarometer 371 European Commission INTERNAL SECURITY REPORT Special Eurobarometer 371 / Wave TNS opinion & social Fieldwork: June 2011 Publication: November 2011 This survey has been requested
EUROPEAN COMMISSION EUR BAROMETER PUBLIC OPINION IN THE EUROPEAN UNION. Report Number 56. Release : April 2002 Fieldwork : Oct Nov 2001
 EUROPEAN COMMISSION EUR BAROMETER PUBLIC OPINION IN THE EUROPEAN UNION Report Number 56 Release : April 2002 Fieldwork : Oct Nov 2001 Directorate-General Press and Communication Telephone : (.2) 296..63
DATA PROTECTION EXECUTIVE SUMMARY
 Special Eurobarometer European Commission DATA PROTECTION Fieldwork: September 2003 Publication: December 2003 Special Eurobarometer 196 Wave 60.0 - European Opinion Research Group EEIG EXECUTIVE SUMMARY
Women in the EU. Fieldwork : February-March 2011 Publication: June Special Eurobarometer / Wave 75.1 TNS Opinion & Social EUROPEAN PARLIAMENT
 EUROPEAN PARLIAMENT Women in the EU Eurobaromètre Spécial / Vague 74.3 TNS Opinion & Social Fieldwork : February-March 2011 Publication: June 2011 Special Eurobarometer / Wave 75.1 TNS Opinion & Social
The European emergency number 112
 Flash Eurobarometer The European emergency number 112 REPORT Fieldwork: December 2011 Publication: February 2012 Flash Eurobarometer TNS political & social This survey has been requested by the Directorate-General
The Rights of the Child. Analytical report
 Flash Eurobarometer 273 The Gallup Organisation Analytical Report Flash EB N o 251 Public attitudes and perceptions in the euro area Flash Eurobarometer European Commission The Rights of the Child Analytical
EUROBAROMETER 62 PUBLIC OPINION IN THE EUROPEAN UNION
 Standard Eurobarometer European Commission EUROBAROMETER 6 PUBLIC OPINION IN THE EUROPEAN UNION AUTUMN 004 Standard Eurobarometer 6 / Autumn 004 TNS Opinion & Social NATIONAL REPORT EXECUTIVE SUMMARY ROMANIA
EU DEVELOPMENT AID AND THE MILLENNIUM DEVELOPMENT GOALS
 Special Eurobarometer 405 EU DEVELOPMENT AID AND THE MILLENNIUM DEVELOPMENT GOALS REPORT Fieldwork: May - June 2013 Publication: November 2013 This survey has been requested by the European Commission,
Flash Eurobarometer 364 ELECTORAL RIGHTS REPORT
 Flash Eurobarometer ELECTORAL RIGHTS REPORT Fieldwork: November 2012 Publication: March 2013 This survey has been requested by the European Commission, Directorate-General Justice and co-ordinated by Directorate-General
Special Eurobarometer 440. Report. Europeans, Agriculture and the CAP
 Survey requested by the European Commission, Directorate-General for Agriculture and Rural Development and co-ordinated by the Directorate-General for Communication This document does not represent the
EUROPEAN UNION CITIZENSHIP
 Flash Eurobarometer EUROPEAN UNION CITIZENSHIP REPORT Fieldwork: November 2012 Publication: February 2013 This survey has been requested by the European Commission, Directorate-General Justice and co-ordinated
Attitudes towards minority groups in the European Union
 Attitudes towards minority groups in the European Union A special analysis of the Eurobarometer 2000 survey on behalf of the European Monitoring Centre on Racism and Xenophobia by SORA Vienna, Austria
Data Protection in the European Union. Data controllers perceptions. Analytical Report
 Gallup Flash Eurobarometer N o 189a EU communication and the citizens Flash Eurobarometer European Commission Data Protection in the European Union Data controllers perceptions Analytical Report Fieldwork:
Facts and Figures on THE EUROPEANS ON HOLIDAYS
 Facts and Figures on THE EUROPEANS ON HOLIDAYS 1997-1998 Executive Summary A Eurobarometer survey carried out on behalf of the European Commission Directorate General XXIII Enterprise policy. Distributive
European Parliament Eurobarometer (EB79.5) ONE YEAR TO GO UNTIL THE 2014 EUROPEAN ELECTIONS Institutional Part ANALYTICAL OVERVIEW
 ONE YEAR TO GO UNTIL THE 2014 EUROPEAN ELECTIONS Institutional Part ANALYTICAL OVERVIEW") Directorate-General for Communication Public Opinion Monitoring Unit Brussels, 21 August 2013. European Parliament Eurobarometer (EB79.5) ONE YEAR TO GO UNTIL THE 2014 EUROPEAN ELECTIONS Institutional
Directorate-General for Communication Public Opinion Monitoring Unit Brussels, 21 August 2013. European Parliament Eurobarometer (EB79.5) ONE YEAR TO GO UNTIL THE 2014 EUROPEAN ELECTIONS Institutional
Data Protection in the European Union. Citizens perceptions. Analytical Report
 Gallup Flash Eurobarometer N o 189a EU communication and the citizens Flash Eurobarometer European Commission Data Protection in the European Union Citizens perceptions Analytical Report Fieldwork: January
Special Eurobarometer 474. Summary. Europeans perceptions of the Schengen Area
 Summary Europeans perceptions of the Schengen Area Survey requested by the European Commission, Directorate-General for Migration and Home Affairs and co-ordinated by the Directorate-General for Communication
Special Eurobarometer 464b. Report
 Europeans attitudes towards security Survey requested by the European Commission, Directorate-General for Migration and Home Affairs and co-ordinated by the Directorate-General for Communication This document
The European Emergency Number 112
 Gallup 2 Flash Eurobarometer N o 189a EU communication and the citizens Flash Eurobarometer European Commission The European Emergency Number 112 Summary Fieldwork: January 2008 Publication: February 2008
Fieldwork: January 2007 Report: April 2007
 Flash Eurobarometer European Commission Entrepreneurship Survey of the EU ( Member States), United States, Iceland and Norway Summary Fieldwork: January 00 Report: April 00 Flash Eurobarometer The Gallup
EUROPEANS ATTITUDES TOWARDS SECURITY
 Special Eurobarometer 432 EUROPEANS ATTITUDES TOWARDS SECURITY REPORT Fieldwork: March 2015 Publication: April 2015 This survey has been requested by the European Commission, Directorate-General for Migration
The Rights of the Child. Analytical report
 The Gallup Organization Flash EB N o 187 2006 Innobarometer on Clusters Flash Eurobarometer European Commission The Rights of the Child Analytical report Fieldwork: February 2008 Report: April 2008 Flash
Special Eurobarometer 461. Report. Designing Europe s future:
 Designing Europe s future: Trust in institutions Globalisation Support for the euro, opinions about free trade and solidarity Fieldwork Survey requested by the European Commission, Directorate-General
EUROBAROMETER 72 PUBLIC OPINION IN THE EUROPEAN UNION. Autumn The survey was requested and coordinated by Directorate-General Communication
 Standard Eurobarometer EUROBAROMETER 72 PUBLIC OPINION IN THE EUROPEAN UNION Autumn 2009 NATIONAL REPO Standard Eurobarometer 72 / Autumn 2009 TNS Opinion & Social UNITED KINGDOM The survey was requested
Standard Eurobarometer 86. Public opinion in the European Union
 Public opinion in the European Union This survey has been requested and co-ordinated by the European Commission, Directorate-General for Communication. This report was produced for the European Commission
EUROBAROMETER 62 PUBLIC OPINION IN THE EUROPEAN UNION
 Standard Eurobarometer European Commission EUROBAROMETER 62 PUBLIC OPINION IN THE EUROPEAN UNION AUTUMN 2004 NATIONAL REPORT Standard Eurobarometer 62 / Autumn 2004 TNS Opinion & Social IRELAND The survey
Views on European Union enlargement
 Flash Eurobarometer 257 The Gallup Organization Flash EB N o 257 Views on European Union enlargement Flash Eurobarometer European Commission Views on European Union enlargement Fieldwork: February 2009
Fieldwork October-November 2004 Publication November 2004
 Special Eurobarometer European Commission The citizens of the European Union and Sport Fieldwork October-November 2004 Publication November 2004 Summary Special Eurobarometer 213 / Wave 62.0 TNS Opinion
Italian Report / Executive Summary
 EUROBAROMETER SPECIAL BUREAUX (2002) Italian Report / Executive Summary Survey carried out for the European Commission s Representation in ITALY «This document does not reflect the views of the European
The European Emergency Number 112. Analytical report
 Flash Eurobarometer 314 The Gallup Organization Gallup 2 Flash Eurobarometer N o 189a EU communication and the citizens Flash Eurobarometer European Commission The European Emergency Number 112 Analytical
PUBLIC OPINION IN THE EUROPEAN UNION
 Standard Eurobarometer 77 Spring 2012 PUBLIC OPINION IN THE EUROPEAN UNION REPORT Fieldwork: May 2012 This survey has been requested and co-ordinated by the European Commission, Directorate-General for
Standard Eurobarometer 89 Spring Report. European citizenship
 European citizenship Fieldwork March 2018 Survey requested and co-ordinated by the European Commission, Directorate-General for Communication This document does not represent the point of view of the European
The citizens of the European Union and Sport
 Special Eurobarometer European Commission The citizens of the European Union and Sport Fieldwork October-November 2004 Publication November 2004 Special Eurobarometer 213 / Wave 62.0 TNS Opinion & Social
Flash Eurobarometer 430. Report. European Union Citizenship
 European Union Citizenship Survey requested by the European Commission, Directorate-General for Justice and Consumers and co-ordinated by the Directorate-General for Communication This document does not
EUROBAROMETER 72 PUBLIC OPINION IN THE EUROPEAN UNION Volume 2
 Standard Eurobarometer European Commission EUROBAROMETER 72 PUBLIC OPINION IN THE EUROPEAN UNION Volume 2 REPORT Fieldwork: October - November 2009 Standard Eurobarometer 72 / Autumn 2009 - TNS opinion
EUROBAROMETER 72 PUBLIC OPINION IN THE EUROPEAN UNION
 Standard Eurobarometer European Commission EUROBAROMETER 72 PUBLIC OPINION IN THE EUROPEAN UNION AUTUMN 2009 COUNTRY REPORT SUMMARY Standard Eurobarometer 72 / Autumn 2009 TNS Opinion & Social 09 TNS Opinion
6. Are European citizens informed?
 6. Are European citizens informed? As has been stated in the editorial, the conduct of the Mega survey was principally to provide information in preparation for three information campaigns to be launched
Views on European Union Enlargement
 Flash Eurobarometer 257 The Gallup Organization Flash EB N o 255 Dual circulation period, Slovakia Flash Eurobarometer European Commission Views on European Union Enlargement Analytical Report Fieldwork:
Flash Eurobarometer 431. Report. Electoral Rights
 Electoral Rights Survey requested by the European Commission, Directorate-General for Justice and Consumers and co-ordinated by the Directorate-General for Communication This document does not represent
Iceland and the European Union
 Flash Eurobarometer European Commission Iceland and the European Union Fieldwork: December 2010 Report: March 2011 Flash Eurobarometer 302 The Gallup Organization This survey was requested by the Directorate-General
Europeans attitudes towards climate change
 Special Eurobarometer European Commission Europeans attitudes towards climate change Fieldwork: August - September 2009 Publication: November 2009 Special Eurobarometer 322 / Wave 72.1 TNS Opinion & Social
MEDIA USE IN THE EUROPEAN UNION
 Standard Eurobarometer 76 Autumn 2011 MEDIA USE IN THE EUROPEAN UNION REPORT Fieldwork: November 2011 Publication: March 2012 This survey has been requested and co-ordinated by Directorate-General for
EUROPEAN CITIZENSHIP
 Standard Eurobarometer 78 Autumn 2012 EUROPEAN CITIZENSHIP REPORT Fieldwork: November 2012 This survey has been requested and co-ordinated by the European Commission, Directorate-General for Communication.
What do Europeans think about the environment?
 What do Europeans think about the environment? 1999 THE MAIN RESULTS OF THE SURVEY CARRIED OUT IN THE CONTEXT OF EUROBAROMETER 51.1. EUROPEAN COMMISSION What do Europeans think about the environment? DG
Majorities attitudes towards minorities in European Union Member States
 Majorities attitudes towards minorities in European Union Member States Results from the Standard Eurobarometers 1997-2000-2003 Report 2 for the European Monitoring Centre on Racism and Xenophobia Ref.
Introduction of the euro in the new Member States. Analytical Report
 Flash Eurobarometer 270 The Gallup Organization Flash Eurobarometer European Commission Introduction of the euro in the new Member States Fieldwork: May 2009 This survey was requested by Directorate General
Directorate General for Communication Direction C - Relations avec les citoyens PUBLIC OPINION MONITORING UNIT 27 March 2009
 Directorate General for Communication Direction C - Relations avec les citoyens PUBLIC OPINION MONITORING UNIT 27 March 2009 EUROPEANS AND THE ECONOMIC CRISIS Standard Eurobarometer (EB 71) Population:
Special Eurobarometer 468. Report. Attitudes of European citizens towards the environment
 Attitudes of European citizens towards the environment Fieldwork September- Publication November 2017 Survey requested by the European Commission, Directorate-General for Environment and co-ordinated by
Preliminary results. Fieldwork: June 2008 Report: June
 The Gallup Organization Flash EB N o 87 006 Innobarometer on Clusters Flash Eurobarometer European Commission Post-referendum survey in Ireland Fieldwork: 3-5 June 008 Report: June 8 008 Flash Eurobarometer
Fieldwork: November December 2010 Publication: June
 Special Eurobarometer European Commission SPECIAL EUROBAROMETER 359 Attitudes on Data Protection and Electronic Identity in the European Union REPORT Fieldwork: November December 2010 Publication: June
Flash Eurobarometer 429. Summary. The euro area
 LOGO CE_Vertical_EN_NEG_quadri rouge Summary Survey requested by the European Commission, Directorate-General for Economic and Financial Affairs and co-ordinated by the Directorate-General for Communication
World Powers in the 21 st Century
 World Powers in the st Century The Results of a Representative Survey in,,,,,,, the, and the United States Berlin, June 2, 2006 CONTENTS FOREWORD... 1 OBJECTIVES AND CONTENTS...6 2 EXECUTION AND METHODOLOGY...8
European Parliament Elections: Turnout trends,
 European Parliament Elections: Turnout trends, 1979-2009 Standard Note: SN06865 Last updated: 03 April 2014 Author: Section Steven Ayres Social & General Statistics Section As time has passed and the EU
CITY USER PROFILE 15 ADELAIDE CITY COUNCIL RESEARCH REPORT
 CITY USER PROFILE 15 ADELAIDE CITY COUNCIL RESEARCH REPORT CONTENTS What is the City User Profile and why do we do it? p. 03 How is CUP data collected? p. 03 What are some of the key findings from CUP
This study was produced by OPTEM S.A.R.L. for Health & Consumer Protection DG and represents its views on the subject.
 This study was produced by OPTEM S.A.R.L. for Health & Consumer Protection DG and represents its views on the subject. These views have not been adopted or in any way approved by the Commission and should
Iceland and the European Union Wave 2. Analytical report
 Flash Eurobarometer European Commission Iceland and the European Union Wave 2 Analytical report Fieldwork: August 2011 Report: October 2011 Flash Eurobarometer 327 The Gallup Organization This survey was
Flash Eurobarometer 337 TNS political &social. This document of the authors.
 Flash Eurobarometer Croatia and the European Union REPORT Fieldwork: November 2011 Publication: February 2012 Flash Eurobarometer TNS political &social This survey has been requested by the Directorate-General
Citizens awareness and perceptions of EU regional policy
 Flash Eurobarometer 298 The Gallup Organization Flash Eurobarometer European Commission Citizens awareness and perceptions of EU regional policy Fieldwork: June 1 Publication: October 1 This survey was
EUROPEANS, THE EUROPEAN UNION AND THE CRISIS
 Standard Eurobarometer 80 Autumn 2013 EUROPEANS, THE EUROPEAN UNION AND THE CRISIS REPORT Fieldwork: November 2013 This survey has been requested and co-ordinated by the European Commission, Directorate-General
Special Eurobarometer 467. Report. Future of Europe. Social issues
 Future of Europe Social issues Fieldwork Publication November 2017 Survey requested by the European Commission, Directorate-General for Communication and co-ordinated by the Directorate- General for Communication
EUROBAROMETER 69 SPRING 2008 NATIONAL REPORT UNITED KINGDOM. Standard Eurobarometer PUBLIC OPINION IN THE EUROPEAN UNION
 Standard Eurobarometer 69 / Spring 2008 TNS Opinion & Social Standard Eurobarometer European Commission EUROBAROMETER 69 PUBLIC OPINION IN THE EUROPEAN UNION SPRING 2008 NATIONAL REPORT UNITED KINGDOM
MYPLACE THEMATIC REPORT: POLITICAL ACTIVISM
 MYPLACE THEMATIC REPORT POLITICAL ACTIVISM MYPLACE: Aims and Objectives The central research question addressed by the MYPLACE (Memory, Youth, Political Legacy & Civic Engagement) Project is: How is young
MODELLING EXISTING SURVEY DATA FULL TECHNICAL REPORT OF PIDOP WORK PACKAGE 5
 MODELLING EXISTING SURVEY DATA FULL TECHNICAL REPORT OF PIDOP WORK PACKAGE 5 Ian Brunton-Smith Department of Sociology, University of Surrey, UK 2011 The research reported in this document was supported
INTRODUCTION OF THE EURO IN THE MORE RECENTLY ACCEDED MEMBER STATES
 Eurobarometer INTRODUCTION OF THE EURO IN THE MORE RECENTLY ACCEDED MEMBER STATES REPORT Fieldwork: April 2013 Publication: June 2013 This survey has been requested by the European Commission, Directorate-General
Attitudes towards the EU in the United Kingdom
 Flash Eurobarometer European Commission Attitudes towards the EU in the United Kingdom Analytical Report Fieldwork: January 200 Publication: May 200 Flash Eurobarometer 203 The Gallup Organization This
EUROBAROMETER SPECIAL BUREAUX (2002) Executive Summary. Survey carried out for the European Commission s Representation in Germany
 Executive Summary. Survey carried out for the European Commission s Representation in Germany") EUROBAROMETER SPECIAL BUREAUX (2002) Executive Summary Survey carried out for the European Commission s Representation in Germany «This document does not reflect the views of the European Commission. Any
EUROBAROMETER SPECIAL BUREAUX (2002) Executive Summary Survey carried out for the European Commission s Representation in Germany «This document does not reflect the views of the European Commission. Any
Young people and science. Analytical report
 Flash Eurobarometer 239 The Gallup Organization The Gallup Organization Flash EB N o 187 2006 Innobarometer on Clusters Flash Eurobarometer European Commission Young people and science Analytical report
Special Eurobarometer 470. Summary. Corruption
 Corruption Survey requested by the European Commission, Directorate-General for Migration and Home Affairs and co-ordinated by the Directorate-General for Communication This document does not represent
ATTITUDES OF EUROPEAN CITIZENS TOWARDS THE ENVIRONMENT
 Special Eurobarometer 416 ATTITUDES OF EUROPEAN CITIZENS TOWARDS THE ENVIRONMENT SUMMARY Fieldwork: April - May 2014 Publication: September 2014 This survey has been requested by the European Commission,
Introduction: The State of Europe s Population, 2003
 Introduction: The State of Europe s Population, 2003 Changes in the size, growth and composition of the population are of key importance to policy-makers in practically all domains of life. To provide
Electoral rights of EU citizens
 Flash Eurobarometer 292 The Gallup Organization Flash EB No 292 Electoral Rights Flash Eurobarometer European Commission Electoral rights of EU citizens Fieldwork: March 2010 Publication: October 2010
Special Eurobarometer 455
 EU Citizens views on development, cooperation and November December 2016 Survey conducted by TNS opinion & social at the request of the European Commission, Directorate-General for International Cooperation
EUROPEAN CITIZENSHIP
 Standard Eurobarometer 81 Spring 2014 EUROPEAN CITIZENSHIP REPORT Fieldwork: June 2014 This survey has been requested and co-ordinated by the European Commission, Directorate-General for Communication.
SPECIAL EUROBAROMETER 360
 Special Eurobarometer European Commission SPECIAL EUROBAROMETER 360 Consumer understanding of labels and the safe use of chemicals REPORT Special Eurobarometer 360 / Wave TNS Opinion & Social Fieldwork:
CITIZENS AWARENESS AND PERCEPTIONS OF EU REGIONAL POLICY
 Flash Eurobarometer CITIZENS AWARENESS AND PERCEPTIONS OF EU REGIONAL POLICY REPORT Fieldwork: June 2015 Publication: September 2015 This survey has been requested by the European Commission, Directorate-General
Telephone Survey. Contents *
 Telephone Survey Contents * Tables... 2 Figures... 2 Introduction... 4 Survey Questionnaire... 4 Sampling Methods... 5 Study Population... 5 Sample Size... 6 Survey Procedures... 6 Data Analysis Method...
BUILDING RESILIENT REGIONS FOR STRONGER ECONOMIES OECD
 o: o BUILDING RESILIENT REGIONS FOR STRONGER ECONOMIES OECD Table of Contents Acronyms and Abbreviations 11 List of TL2 Regions 13 Preface 16 Executive Summary 17 Parti Key Regional Trends and Policies
Europeans and the crisis
 EUROPEAN PARLIAMENT Europeans and the crisis Report Fieldwork: August September 2010 Publication: November 2010 Special Eurobarometer/Wave 74.1 TNS Opinion & Social Eurobaromètre spécial / Vague 74.1 TNS
EUROBAROMETER The European Union today and tomorrow. Fieldwork: October - November 2008 Publication: June 2010
 EUROBAROMETER 66 Standard Eurobarometer Report European Commission EUROBAROMETER 70 3. The European Union today and tomorrow Fieldwork: October - November 2008 Publication: June 2010 Standard Eurobarometer
WOMEN IN DECISION-MAKING POSITIONS
 Special Eurobarometer 376 WOMEN IN DECISION-MAKING POSITIONS SUMMARY Fieldwork: September 2011 Publication: March 2012 This survey has been requested by Directorate-General Justice and co-ordinated by
Context Indicator 17: Population density
 3.2. Socio-economic situation of rural areas 3.2.1. Predominantly rural regions are more densely populated in the EU-N12 than in the EU-15 Context Indicator 17: Population density In 2011, predominantly
EUROBAROMETER 64 FIRST RESULTS
 Standard Eurobarometer European Commission PUBLIC OPINION IN THE EUROPEAN UNION FIRST RESULTS Fieldwork : October-November 2005 Publication : December 2005 Standard Eurobarometer 64 / Autumn 2005 - TNS
EUROBAROMETER 71 PUBLIC OPINION IN THE EUROPEAN UNION SPRING
 Standard Eurobarometer European Commission EUROBAROMETER 71 PUBLIC OPINION IN THE EUROPEAN UNION SPRING 2009 Standard Eurobarometer 71 / SPRING 2009 TNS Opinion & Social Standard Eurobarometer NATIONAL
STATISTICS BRIEF URBAN PUBLIC TRANSPORT IN THE 21 ST CENTURY
 STATISTICS BRIEF URBAN PUBLIC TRANSPORT IN THE 21 ST CENTURY This Statistics Brief is an abridged version of the extensive report, Urban Public Transport in the 21 st Century, available on the UITP MyLibrary
Standard Eurobarometer 85. Public opinion in the European Union
 Public opinion in the European Union Fieldwork: May 2016 Survey conducted by TNS opinion & social at the request of the European Commission, Directorate-General for Communication Survey coordinated by
European Parliament Eurobarometer (EB79.5) ONE YEAR TO GO TO THE 2014 EUROPEAN ELECTIONS Economic and social part DETAILED ANALYSIS
 ONE YEAR TO GO TO THE 2014 EUROPEAN ELECTIONS Economic and social part DETAILED ANALYSIS") Directorate-General for Communication Public Opinion Monitoring Unit Brussels, 18 October 2013 European Parliament Eurobarometer (EB79.5) ONE YEAR TO GO TO THE 2014 EUROPEAN ELECTIONS Economic and social
Directorate-General for Communication Public Opinion Monitoring Unit Brussels, 18 October 2013 European Parliament Eurobarometer (EB79.5) ONE YEAR TO GO TO THE 2014 EUROPEAN ELECTIONS Economic and social
Special Eurobarometer 471. Summary
 Fairness, inequality and intergenerational mobility Survey requested by the European Commission, Joint Research Centre and co-ordinated by the Directorate-General for Communication This document does not
Europeans attitudes towards climate change
 Special Eurobarometer 313 EUROPEAN PARLIAMENT EUROPEAN COMMISSION Europeans attitudes towards climate change Special Eurobarometer 313 / Wave 71.1 TNS Opinion & Social Report Fieldwork: January - February
PUBLIC PERCEPTIONS OF SCIENCE, RESEARCH AND INNOVATION
 Special Eurobarometer 419 PUBLIC PERCEPTIONS OF SCIENCE, RESEARCH AND INNOVATION SUMMARY Fieldwork: June 2014 Publication: October 2014 This survey has been requested by the European Commission, Directorate-General
I. Overview: Special Eurobarometer surveys and reports on poverty and exclusion
 Reflection Paper Preparation and analysis of Eurobarometer on social exclusion 1 Orsolya Lelkes, Eszter Zólyomi, European Centre for Social Policy and Research, Vienna I. Overview: Special Eurobarometer
Streetcar Community Attitudes Survey - Community Development and Transportation Principles
 PREPARED FOR: CITY OF LAKE OSWEGO Streetcar Community Attitudes Survey - Community Development and Transportation Principles October 2011 PREPARED BY: DHM RESEARCH (503) 220-0575 203 SW Pine St., Portland,
Special Eurobarometer 469
 Summary Integration of immigrants in the European Union Survey requested by the European Commission, Directorate-General for Migration and Home Affairs and co-ordinated by the Directorate-General for Communication
Main findings of the joint EC/OECD seminar on Naturalisation and the Socio-economic Integration of Immigrants and their Children
 MAIN FINDINGS 15 Main findings of the joint EC/OECD seminar on Naturalisation and the Socio-economic Integration of Immigrants and their Children Introduction Thomas Liebig, OECD Main findings of the joint
Post-electoral survey 2009
 Special Eurobarometer EUROPEAN PARLIAMENT European Commission Post-electoral survey 2009 Report Fieldwork: June-July 2009 Publication: November 2009 Special Eurobarometer 320/ Wave TNS opinion & social
The Ombudsman's synthesis The European Ombudsman and Citizens' Rights
 European Ombudsman The Ombudsman's synthesis The European Ombudsman and Citizens' Rights Special Eurobarometer Conducted by TNS Opinion & Social at the request of the European Parliament and the European
International Trade. Summary. Fieldwork: August - September 2010 Publication: November Special Eurobarometer 357
 Special Eurobarometer 357 European Commission International Trade Fieldwork: August - September 2010 Publication: November 2010 Special Eurobarometer 357 / Wave 74.1 TNS Opinion & Social Summary This survey
CHANGES IN WORKING LIFE AND THE APPEAL OF RIGHT-WING POPULISM IN EUROPE
 International Conference CHANGES IN WORKING LIFE AND THE APPEAL OF RIGHT-WING POPULISM IN EUROPE 17-18 June 2004, Vienna, Austria Xenophobe attitudes towards migrants and refugees in the enlarged European