Emerging Markets Drivers and hindrances of sustainable economic growth
|
|
|
- Emmeline Blair
- 5 years ago
- Views:
Transcription

1 Emerging Markets Drivers and hindrances of sustainable economic growth With focus on China, India and Brazil Bjørnar Dahl Supervisor Stein Oluf Kristiansen This master s thesis is carried out as a part of the education at the University of Agder and is therefore approved as a part of this education. However, this does not imply that the University answers for the methods that are used or the conclusions that are drawn. University of Agder, 2016 School of Business and Law
2 i
3 Preface This master thesis is written as a final part of the master program in Business and Administration, at School of Business and Law at University of Agder, the fall My interest for Emerging Markets came to life when I was working for National Oilwell Varco (NOV), a leading worldwide provider of equipment and components used in the petroleum industry. My former employer was well into what looked like a petroleumadventure in Brazil, but ended up being part of a complete chaos with cancellation of billiondollar size projects, bad-paying customers and where billions of dollars disappeared in corruption and political chaos. These experiences were the background for my paper in ORG440 International Management fall 2015, on the effects of Brazil s local content policies in the petroleum industry. My insight into the Emerging Markets was further increased in the course ORG448 Emerging Markets spring 2016, where I compared Brazil with South Korea in their divergent experiences of escaping the middle-income trap. I started planning this thesis in the spring of 2016, but it is mostly written from around mid- August During the writing of this thesis, I have also worked part-time as a Financial Officer at the Kristiansand Zoo and Amusement Park. This has been a very demanding and challenging experience, not just because of the limited time, but also academically challenging. I have learned a great deal, and hopefully I will get great use for this subject and the knowledge that I have acquired, in the future. There are several people I would like to show my gratitude to. First, I would like to thank my wife Helene and our unborn son, my main motivating factors in life. I would also like to thank the Nordic Model that gave me the possibility and opportunity to take a higher education and to get a master s degree at a University. If I had been born outside of the Nordic countries and their public education system, this would have been much more difficult to accomplish. I would also like to thank my employer for their patience during the writing of this master thesis. I would also like to kindly thank my parents for helping me through my initial years of schooling. Lastly, I would like to express my gratitude and appreciation to my supervisor, Professor Stein Oluf Kristiansen, for advice and guidance through this process. Bjørnar Dahl Kristiansand, November 2016 i
4 Executive summary: The term «Emerging Market» describes a country that has some characteristics of a developed high-income economy, such as the United States, Western Europe and Japan, but does not meet the standards of a fully developed economy. The Emerging Markets are in a transitional phase marked by rapid GDP growth towards rule of law and institutional credibility. Emerging Markets describe developing countries that are not among the poorest nor of the newly industrialized countries, but countries that have the potential to become a fully developed economy (Gaeta, 2012b) The reason that additional research on the Emerging Markets is a relevant topic is because there has been a change in the global economic landscape where the Emerging Markets have gone from being only a minor player a few decades ago to now dominating the world economic growth. Analysts are already talking about a new economic world order, with the Emerging Markets dominating the world economy in the future. This thesis look at factors that have made them grow in a quantitative data analysis for 25 different Emerging Markets as well as a case-study conducted to identify the main institutions and main drivers and hindrances for achieving sustainable economic growth in the three largest Emerging Markets; China, India and Brazil. A great potential for future economic growth is not a guarantee for future economic success and my findings support earlier research that indicate that there is a huge difference between their potential and the reality. It would be difficult to maintain the growth rates of the last 25 years for many of the Emerging Markets and it will take a long time before most of them could be even nearly as wealthy as the countries of the developed world. A common factor for most Emerging Markets is that they struggle with institutional weakness on key areas like rule of law, governance and economic freedom. Growth and economic success is the consequence of decent economic framework conditions and to live up to their potential, institutional reforms are needed in most Emerging Markets. ii
5 Table of Contents Preface...i Executive summary... ii Chapter 1 Introduction Background Research Questions Structure...2 Chapter 2 The Emerging Markets The term Identifying the Emerging Markets The rise of the Emerging Markets...7 Chapter 3 Growth theory overview Short-term economic growth The process of economic development The Malthusian Epoch The Post-Malthusian Regime The Sustained Growth Regime How low-income countries today differ from developed countries in their earlier stages Neoclassical growth theory Are the living standards between developing and developed nations converging? Chapter 4 Theoretical background and relevant literature The resource curse What is the curse? Explanations for the course The middle-income trap Specialization and technological focus Growth based on total factor productivity Decentralization, income distribution and expansion of the middle-class The importance of political leadership Demographics, investment ratios and inflation Robert Barro s determinants of Economic Growth Growth Environment Scores (GES) Inequality New Institutional Economics What are institutions? iii
6 4.5.2 What institutions are important for economic growth? Why have so few countries created and sustained the rules and norms that foster growth and social progress? Which institutions must function effectively if countries are to develop? How can poorer countries attain well-functioning institutions? Chapter 5 Data and Methodology The development of the research question Research design Methods Data collection Unit selection Statistical analyses Variables Institutional analysis Strengths and weaknesses of chosen methods Validity and reliability Chapter 6 Data analyses, results and discussion of findings Descriptive statistics Correlation analysis Pearson correlation Collinearity Correlation with the dependent variable Discussion of findings Chapter 7 China, India and Brazil Accelerating forces and hindrances of sustainable economic growth. Case study and discussion of findings China, India and Brazil - overview Avoiding the middle-income trap China Economy and economic growth Openness to trade Institutions Demographics Are they avoiding the middle-income trap? India Economy and economic growth Openness to trade Institutions Demographics iv
7 7.3.4 Are they avoiding the middle-income trap? Brazil Economy and economic growth Openness to trade Institutions Demographics Are they avoiding the middle-income trap? Discussion of findings Chapter 8 Conclusions Conclusion of the quantitative research Conclusion of the quantitative research Policy recommendations Limitations Prospects for future research References Appendixes Appendix 1: Table: The different lists of Emerging Markets Appendix 2: Table: Collection of data for the data analysis Appendix 3: Chosen variables for data analysis Appendix 4: Determinants of Growth Environment Scores and table with scores Appendix 5: Reflective note v
8 List of figures Figure 2.1 Structure of economies...4 Figure 4.1 Per capita income and inequality Figure 6.1 Scatterplot of relation between GDP per capita 1990 and average GDP growth Figure 6.2 Scatterplot of relation between average voice and accountability and average GDP growth Figure 6.3 Scatterplot of relation between average GINI-coefficient and average GDP growth Figure 6.4 Scatterplot of relation between average investment ratio to GDP and average GDP growth List of tables Table 2.1 GDP ranking 2015 (Nominal)...7 Table 2.2 Projected estimate of the 32 largest economies in 2050 in terms of GDP in PPP...8 Table 6.1 Mean scores and standard deviations for all variables Table 6.2 Pearson correlations Table: The different lists of Emerging Markets Table: Collection of data for the data analysis Table: Chosen variables for data analysis Table: Growth Environment Scores vi
9 Chapter 1 Introduction 1.1 Background The term «Emerging Market» describes a country that has some characteristics of a developed high-income economy, but does not yet meet the standards of a fully developed market. They are in a transitional phase between developing and developed status, and are developing countries that are not among the poorest nor of the newly industrialized countries, but have potential to become a fully developed economy. Over the last decades, the global economic landscape has changed dramatically. There has been a transformation in the global economy where the Emerging Markets has gone from being only a minor player a few decades ago, to now dominating the world economic growth with their commercial activity, economic output and population. According to predictions made by PWC, 4 of the 5 largest and 9 of the 15 largest economies in the world in 2050, in terms of GDP, will belong to the group that we now call Emerging Markets (PWC, 2015). Economists are already talking about a new economic world order, where the Emerging Markets will dominate the world economy in the future. The greatest success story of our generation is of course China. Their tremendous transformation during the last 30 years inspires other Emerging Markets, partly backed by the fact that China became the second largest economy in the world in 2010; while some analysts believe China will surpass the United States in terms of GDP by 2030 and become the world s largest economy (PWC, 2015; Ward, 2012). However, the reason they are still called Emerging Markets are that they have large unleashed potential. Based on GDP per capita, rather than overall GDP, it will take a long time before most of them could be even nearly as wealthy as the countries in the developed world. China is projected to become not far off double the size of the United States in total GDP by 2050, but in GDP per capita it is projected to be just half (Ward, 2012). A common factor for many Emerging Markets is that they struggle with institutional weaknesses. Many of them are still weak in key areas such as rule of law, governance, and economic freedoms. Growth and economic success is the consequence of decent economic framework conditions and long-term sustainable economic growth is dependent on a society with a sustainable basis for investment and development. To live up to their potential, reforms are needed in most of the Emerging Markets. 1
10 1.2 Research Questions This thesis will seek to find out why some countries succeed while others do not. I will try to find what factors and institutions are essential for improving a countries growth environment and for establishing long-term economic growth. The following research questions are raised: 1) Which factors are essential for improving a country s growth environment and for establishing long-term economic growth? 2) What are the main institutions of China, India and Brazil and their main drivers and hindrances for achieving sustainable growth? In addition to an analysis of 25 countries that belong to the Emerging Markets I also look more deeply into three of the major Emerging Markets; China, India and Brazil. What factors and institutions has helped them grow, what factors and institutions would help them or what will hinder their continued growth into a high-income economy? This thesis explores the connection between institutions and other vital factors and their effect on economic growth. 1.3 Structure Chapter 2 provides the reader with insight into the Emerging Markets. What do the term describe, which countries are we talking about, what are their characteristics and why they matter in the global economy? Chapter 3 provides an overview over relevant theory of economic growth and development, while chapter 4 provides more specific theory of economic growth which apply to the economic growth in Emerging Markets: Resource curse, middle income trap, inequality and New Institutional Economics (NIE). Chapter 5 describes and explains the methodology, while chapter 6 presents the results of the data analysis with discussion and chapter 7 presents the findings of a comparative analysis of three major Emerging Markets; Brazil, India and China as well as a discussion of the findings in accordance with theory and research questions. This is followed by conclusions, policy suggestions and suggestions on topics for further research in chapter 8 2
11 Chapter 2 The Emerging Markets 2.1 The term The term «Emerging Market» describes a country that has some characteristics of a developed high-income economy, such as the United States, Western Europe and Japan, but does not meet the standards of a fully developed economy. They are in a transitional phase between developing and developed status. Emerging Markets describe developing countries that are not among the poorest nor of the newly industrialized countries, but countries that have the potential to become a fully developed economy (Gaeta, 2012b). Various terms have been used to describe these countries. During the 1970s and 1980s, several group terms were used: Third World economies, least developed countries, newly industrializing countries, rapidly developing countries, or high performing (Asian) countries. In 1981, the term Emerging Markets was coined by then World Bank Economist, Antoine van Agtmael, to describe the more robust economies within the developing world with capital markets open to foreign investors, because most other terms were considered either too negative or too exclusive (Gaeta, 2012a). 2.2 Identifying the Emerging Markets Which countries are we talking about? Which countries are identified as Emerging Markets? For this thesis I select Emerging Markets that fit to the following criteria, based on MSCI Classification Framework (Morgan Stanley Capital International, 2016) and (Gaeta, 2012b): Emerging Markets are countries that are neither part of the least developed countries, nor of the newly industrialized countries. An emerging market is a market big enough to influence in the world economy or global politics, in terms of sizeable populations in combination with sizeable economic activity, but at the same time without high enough income-levels to qualify as a developed market. Emerging Markets are in a transitional phase marked by rapid GDP growth towards rule of law and institutional credibility, but they still struggle with economic and political instabilities and weak institutional infrastructure. They are markets with significant openness and access to foreign ownership and ease of capital inflows/outflows. A properly governed stock market is also a key criteria (Gaeta, 2012a; Morgan Stanley Capital International, 2016). However, this classification is not based on strict criteria and evolves over time. A potential problem is also that countries that earlier were considered Emerging Markets, has since developed past the Emerging Market phase. Possible examples of this are 3
 to describe countries either to small, or with investment restrictions, or at a to low")
12 South Korea, Singapore and Taiwan. Also, small countries or countries with limited market liquidity are often not considered. It is also worth noting the term Frontier Markets, a term coined by the International Finance Corporation (IFC) to describe countries either to small, or with investment restrictions, or at a to low development level to be considered Emerging Markets. It could describe future Emerging Markets or countries that has been considered Emerging Markets in the past, but have regressed to frontier status (Berger, Pukthuanthong, & Yang, 2011). The huge difference between these two types is that Emerging Markets provide both a better quality of business legislation and a more rules-based execution and resolution of legitimate interests. Frontier Markets are more dominated by the informal economy, where commercial interests need to be based on connections and influence and there is little purpose to go to the local administrative or justice systems for business problems and disagreements. These flaws of the institutional systems work as major barriers for investors in less developed markets, where there exists less incentives for making long-term investments and it is less likely to get their profits and investments back out. Markets with a dominance of a formal economic structure like prevalence of rule of law, institutions and transparency tend to outperform comparable informal economies in the long run. Sustainable growth and economic success is the result of decent economic framework conditions. The term Bandit economies describes markets with predominately informal economic structures; lack of rule of law, institutions, transparency. The figure below shows the gradual development towards a developed economy with solid institutions. Figure 2.1 Structure of Economies (collected from (Gaeta, 2012b, p. 11) 4
13 Emerging Markets, also called developing markets, has been made a household name after the term was first coined in Popular groupings for Emerging Markets has been made. The most visible Emerging Markets has been the much-hyped BRIC (Brazil, Russia, India and China) economies that are dominating by their sheer size, with a quarter of the world s land area as well as 40% of the world s population. Goldman Sachs investment bank which first coined the BRIC-term, have also identified the N-11 Next eleven (O Neill, Wilson, Purushothaman, & Stupnytska, 2005), which include other high potential economies like Bangladesh, Egypt, Indonesia, Iran, Mexico, Nigeria, Pakistan, the Philippines, Turkey, South Korea and Vietnam. Other popular acronyms and groupings to describe the future growth winners in the world economy include BRIC+S(outh Africa)+I(ndonesia)+M(exico)+T(urkey) (Goldman Sachs, 2007), CIVETS (Colombia, Indonesia, Vietnam, Egypt, Turkey South Africa), MINT (Mexico, Indonesia, Nigeria, Turkey), D-8 (a group of eight large, mostly Muslim nations; Bangladesh, Egypt, Indonesia, Iran, Malaysia, Nigeria, Pakistan and Turkey). Given the rapid growth of large number of economies, it could be challenging to make an exact list of which countries belong to the group of Emerging Markets. There exists different versions over which countries are listed, but if you combine the most commonly used and most prolific lists from IMF (International Monetary Fund, 2015a) and MSCI (Morgan Stanley Capital International, 2016), with Columbia University s list of where new top multinational enterprises come from (Columbia University, 2016) together with Citigroup s list of Global Growth Generators (Buiter & Rahbari, 2011), FTSEs (Financial Times Stock Exchange, 2016) lists of Advanced Emerging and Secondary Emerging Markets, as well as countries included in terms like BRIC(+S+I+M+T), N-11 Next eleven, CIVETS, MINT and D-8 you get in total 42 different countries. (See appendix for table of the different lists) Nevertheless, the list could easily be shortened to fit more with the ingoing criteria. Countries that are OECD-members or fully industrialized European countries like Bulgaria, Czech Republic, Estonia, Greece, Hungary Latvia, Lithuania, Poland, Slovenia, Romania as well as the Asian fully developed economies of South Korea and Taiwan have way to high GDP per capita levels to be included on a list of Emerging Economies. If I also exclude countries that have GDP per capita levels in terms of PPP above USD, I also exclude Chile, Israel, Malaysia, Qatar and the United Arab Emirates from the list. Russia is only kept because it is one of the BRICs countries and since they are among the four largest emerging and developing economies in the world. Jordan is excluded due to their relatively small 5
14 population, 8 million. Sub-Saharan Africa is unfortunately only represented with southern Africa (Republic of South Africa) and Western Africa (Nigeria), so to also add-in the eastern African perspective I include three countries without the sufficient size to matter alone, but as a region together fits these criteria; The three funding members of the East African community, Kenya, Tanzania and Uganda. This leaves me with the following countries/regions: Argentina East African community Iraq Pakistan Sri Lanka Bangladesh Egypt Mexico Peru Thailand Brazil India Mongolia Philippines Turkey China Indonesia Morocco Russia Venezuela Colombia Iran Nigeria South Africa Vietnam Altogether, 25 markets. This list could of course be disputed. Jim O Neill, chief economist of Goldman Sachs, and creator of the acronym BRICs says that countries like Brazil, Russia, India, China, South Korea, Indonesia and Turkey no longer should be coined Emerging Markets but Growth Markets since they are already an integrated part of the modern globalized economy (O'Neill, 2011). However, no new term has yet to gain traction. The Emerging Markets are a very heterogeneous group and hardly comparable, ranging from the global manufacturing leader to economies with some of the weakest public governance structures. The Emerging Markets include many recent successful stories of countries escaping poverty traps and countries that have succeeded in improving institutions and infrastructure, raising incomes, lowering infant mortality, improving educational access, narrowing gender disparities and increasing life expectancy. Classification by income does not necessarily reflect development status, the classification is just as important in terms of growth potential. Not all countries at the same income level experience the similar development. The refinement is done generally based on their size and growth, as well as their growth potential. However, the transition towards a developed economy is by no means assured for any of the emerging markets (Gaeta, 2012b, p. 8). 6

15 2.3 The rise of the Emerging Markets Table 2.1: GDP ranking 2015 (Nominal). Source: (The World Bank, 2016b) Over the last decades, the global economic landscape has changed dramatically. There has been a transformation in the global economy where the Emerging Markets has gone from being only a minor player a few decades ago, to now dominating the world economic growth with their commercial activity, economic output and population. While between 1980 and 1990, the United States, the European Union and Japan accounted for 62 percent of the additional world GDP at purchasing power parity (PPP), the subsequent two decades turned in favor of developing economies. During the period of 2000 to 2010, the share of additional (incremental) GDP growth of the traditionally highly developed economies, the United States, 7

16 the European Union and Japan fell to around 32 percent at purchasing power parity. For any additional unit of world GDP, developing markets accounted for double the value of growth of developed markets The complete reversal from two thirds in to about one third between 2000 and 2010 and further predictions of decline to about one quarter of the world s growth happening in developed economies demonstrate the rise of the and importance of developing economies (Gaeta, 2012b, pp ). This has of course had an impact of individuals, and according to Forbes 2016 list of billionaires, almost one third of the 100 richest people in the World are now from so-called Emerging Markets (Forbes, 2016). Table 2.2: Projected estimate of the 32 largest economies in 2050 in terms of GDP PPP (2014 US$bn) with the projected estimate for the same countries in 2030 as well as their GDP 8
17 in Source: Predictions 2030 and 2050 (PWC, 2015) and data 2014 (International Monetary Fund, 2014) According to predictions made by PWC, 4 of the 5 largest and 9 of the 15 largest economies in the world in 2050, in terms of GDP, will belong to the group that we now call Emerging Markets (PWC, 2015). Economists are already talking about a new economic world order, where the Emerging Markets will dominate the world economy in the future. The greatest success story of our generation is of course China, and you cannot talk about Emerging Markets without China. If you take China of out the Emerging Markets, there would be no story of the Emerging Markets (O'Neill, 2011). Their tremendous transformation during the last 30 years, inspires other emerging markets, partly backed by the fact that China became the second largest economy in the world in 2010 and some analysts believe China will surpass the United States GDP by 2030, and become the world s largest economy (in terms of nominal GDP, in terms of PPP China surpassed the United States by 2014) (PWC, 2015; Ward, 2012). However, some populistic Western politicians have labelled the rise of the Emerging Markets as a threat for their own country s economic growth and have gained support for increased trade barriers against the Emerging Markets and associated threats to leave the World Trade Organization. International trade is however, not a zero-sum game and protectionism could be one of the developed world s greatest barriers to future economic progress. Increased international trade is a win-win situation for most. The rise of the Emerging Markets is boosting international trade and thus helping the rest of the world (O'Neill, 2011). This concern could be caused by unfamiliarity and a concern that the Western world cannot longer influence the rest of the world the way it has done earlier and a fear of a new world order where decades of Westernization are rapidly being replaced by easternization (Art auctioneer Simon de Pury, quoted by O'Neill, 2011, p. 196). China is, by 2015, the largest manufacturer and exporter of goods in the world and at the same time the fastest growing consumer market and the second largest importer of goods in the world (World Trade Organization, 2016). China is also the second largest export market for the European Union (after the United States) and their largest import market. The largest economy in the European Union and the third largest exporter in the World in terms of USD (2015), Germany, now exports more to countries described as Emerging Markets than to their neighbor, France. Especially European luxury brands have seen an enormous growth in their businesses in Emerging Markets as well as some of the heavier industrial companies including 9
18 the chemical industry (O'Neill, 2011). Especially the rise of China in low-cost manufacturing industries has provided the Western world with cheaper consumer goods and given us stronger consumption. The Western world has traded better from less efficient industries it can afford to lose to more productive jobs. (O'Neill, 2011). Even if the center for economic growth has shifted away from the developed markets it does not mean that their role will diminish in the upcoming decades. The existing developed markets will remain very significant in the global economy due to their low risks and political and institutional strengths (PWC, 2015, p. 5). The developed markets will still retain much of its leadership in financial markets, for innovation and technological progress and also possibly keep its global leadership in terms of military and political functions (Gaeta, 2012b, p. 15). It is also worth noting that in PWCs predictions, the growth in both India and China will moderate after 2020 as they mature (PWC, 2015). Any such long-term growth predictions are also subject to many uncertainties. The growth rates experienced during the last years is also difficult to maintain. See also chapter 4.2, the middle-income trap. A common factor for many Emerging Markets is that they still struggle with institutional weakness. Many of them are still weak in key areas such as rule of law, governance, and economic freedoms. They also still have higher inequality, weaker institutions, lower levels of education and health than the developed world (Todaro & Smith, 2009). Growth and economic success is the consequence of decent economic framework conditions and longterm sustainable economic growth is dependent on a society with a sustainable basis for investment and development. To live up to their potential for many Emerging Markets, institutional reforms are needed. There are still much they can undertake to speed economic and social progress even further, but the transition towards a developed economy is by no means assured for any of the Emerging Markets (Gaeta, 2012b). 10
19 Chapter 3 Growth theory overview Economic growth is the increase of the market value of the goods and services by an economy over time. It is conventionally measured as the percent rate of increase in the real gross domestic product adjusted for inflation. Economic growth can be achieved either by more efficient use of inputs such as labor productivity, capital, energy or materials or by an increase in the amount of inputs available for use, such as expanding the existing workforce or gaining more capital (A. V. Banerjee & Duflo, 2005; Bjork, 1999). The field of research in economic development is still at relatively early stage and scholars have disagreements about cause and effect, but the major long-run causes on this subject that have been argued in some of the most influential research literature includes: 3.1 Short-term economic growth The Harrod-Domar model is a model for economic growth developed independently by Sir Roy F. Harrod and Evsey Domar in 1939 and 1946 respectively. Per the Harrod-Domar model, economic growth (g) is dependent on two variables; Savings (s) and capital output ratio (k): g=s/k. A high level of saving in a country provides funds for firms to borrow and invest. These investments could then generate economic growth through increase in production. The capital output ratio measures the productivity of the investment. If the capital output ratio decreases the economy will be more productive and fewer inputs generates more output. (Harrod, 1939) (Domar, 1946). Another, but not completely different model, for economic growth is Walt Whitman Rostow s Stages of Economic Growth Model. This model says, that any country or society that wants to go from a traditional static society to the level of an industrialized and specialized society with high mass consumption that covers basic needs for all its citizens, must go through five basic stages of economic development. To reach this goal, the society must go through a transformation; from agriculture to industry, from illiteracy to education, from rural society to urban society etc. This transformation is only possible with a high savings rate, mostly more than 10% to take-off, as well as high levels of innovation and new technology to increase productivity (Rostow, 1960). A third model on Economic Growth is the Solow-Swan Model. This model says that a country s GDP (Y) is a result of two factors; Labour (L) and Capital (K), and is written as an aggregate production function: Y = K a + L (1-a). In the long run, the economy will reach a long- 11
20 run equilibrium called steady state when investments equal the deprecation rate. In steady state, growth will only be achieved from technological progress (Solow, 1956; Swan, 1956) The models of Harrod-Domar, Rostow and Solow-Swan only describes short-term economic growth. If a country is to achieve sustainable long-term economic growth and development, this must be explained by other factors. 3.2 The process of economic development The Handbook of Economic Growth divides the process of economic development into three distinct regimes: The Malthusian Epoch, The Post Malthusian Regime, and the Sustained Growth Regime (Galor, 2005). The Malthusian Epoch is named after the English cleric and scholar Thomas Robert Malthus ( ) who in his book An Essay on the Principle of Population (Malthus, 1798) claimed that the supply of available resources and food could only grow at a linear rate while the population growth was exponentially. The shortage of available resources would hinder further population growth with wars, disease and starvation The Malthusian Epoch During the Malthusian epoch, that has characterized most of human history, most humans experienced a constant struggle for existence and the technological progress and population growth were insignificant by modern standards (Galor, 2005). This stagnation was observed all over the world and lasted until the end of the 18 th century for the entire world. The average growth rate of output per capita ranged from 0% in impoverished regions of Africa, to a rate of 0.14% in prosperous Western Europe. Population growth followed this pattern as well; the slow pace of resource expansion was reflected in a modest increase in the world s population. The world s population grew from 231 million people in 1 AD to 268 million in 1000 AD, an average growth rate of 0.02% per year. The resource expansion between 1500 and 1820 were followed by a growth in the world s population to from 438 million to 1041 million, an average growth of 0.27% per year. Episodes of technological progress, land expansion, favorable climatic conditions, or major epidemics brought temporary increases in real wages and income per capita (Clark, 2001). In the Malthusian epoch, periods of rising income per capita permitted a rise in the number of surviving offspring. Improved nourishment and health infrastructure led to increased fertility rates and reduced mortality rates. Periods of rising mortality rates like the black death caused an increase in fertility rates, since this led to an increase in the number of surviving offspring that could be supported by the existing resources (Galor, 2005). 12
21 3.2.2 The Post-Malthusian Regime The take-off from the Malthusian epoch in the developed regions of Western Europe and the Western Offshoots (United States, Canada, Australia and New Zealand), is associated with the industrial revolution and the associated technological progress. The transition to the Post- Malthusian regime occurred in Western Europe and the Western Offshoots at the beginning of the 19 th century and was followed by a considerable rise in the growth rates of income per capita and population (Galor, 2005). This take-off began in some regions, ironically, shortly before the publication of Malthus influential essay. The take-off in less developed regions occurred towards the beginning of the 20 th century and delayed well into the end of the 20 th century for some countries. The average growth rate of output per capita increased significantly and was followed by larger differences across regions in standards of living. The differential timing in the take-off from the Malthusian regime, increased the gap between the richest regions of Western Europe and the Western Offshoots to the impoverished regions of Africa from about 3: 1 in 1820 to approximately 5: 1 in The increase in income per capita was channeled partly towards an increase in the size of the population. The Malthusian mechanism linking higher income to higher population growth continued to function, but income per capita continued to rise despite the offsetting effects of population growth (Galor, 2005). The take-off from the Malthusian epoch in the developed regions was associated with a rapid process of industrialization as well as a considerable rise in urbanization. The increase of real wages income per capita during the post-malthusian regime also stimulated the accumulation of human capital in the form of literacy rates, schooling and health. In the first phase of the Industrial Revolution, human capital had a limited role in the production process and was not necessarily correlated with industrial development and differed across countries. The rise of education was motivated by reasons such as religion, enlightenment and social and national cohesion, but in the second phase of the Industrial Revolution the demand for education increased, reflecting the increased demand for specialization and skills in the industrialization process (Galor, 2005). The average number of years of schooling rose from 2.3 to 5.2 for English and Welsh children born in the period between 1801 to 1856 (Matthews, Feinstein, & Odling-Smee, 1982). Meantime life expectancy at birth rose from 33 to 40 in England and from 25 to 40 in France between 1740 and 1840, reflecting the increased health of the labor force. The relative importance of human capital in the process of industrialization increased 13
22 gradually in less developed economies as well. The post-malthusian regime ended with a decline in population growth in the 1970s in Latin America and Asia, and is still in motion in Africa at the beginning of the 21th century. The average years of schooling increased from 3.5 to 4.4 between 1960 and 1975 in Latin America, from 1.6 to 3.4 between 1960 to 2000 in Sub-Saharan Africa, and from 1.4 to 1.9 between 1960 and 1975 in South Asia (Barro & Lee, 2001) The Sustained Growth Regime The post-malthusian period ended with the decline in population growth in Western Europe and the Western Offshoots, countries that still make up much of the developed economies in the world today. The technological progress and industrialization in the Post-Malthusian regime combined with the increased accumulation of human capital brought the way for a demographic transition to an era of sustained economic growth. In this period, the rise in aggregate income were no longer counterbalanced by population growth. This transition occurred in Western Europe and the Western Offshoots towards the end of the 19 th century, while the transition happened in parts of Asia and Latin America towards the end of the 20 th century. Africa is still struggling to make this transition since their increased resources in the Post-Malthusian Regime has mostly been channeled towards population growth (Galor, 2005). Income per capita in Western Europe and the Western Offshoots, advanced at a stable rate of about 2% per year in the last century (Galor, 2005, p. 195). This transition to a state of sustained economic growth was characterized by increased accumulation of human capital combined with a sharp decline in fertility rates which were preceded by a decline in mortality in most of the Western world (Galor, 2005, p. 200). The decline in mortality rates in the Western world were corresponding to a gradual increase in life expectancy which generated a further inducement for investment in human capital. Life expectancy at birth in England continued to rise from about 41 years in the 1870s, to 60 years in 1930 and further increased to 81 years in 2014 (The World Bank, 2016b). The rise of life expectancy in less developed regions occurred throughout the 20 th century. Life expectancy nearly tripled in Asia from 24 years in 1900 to 66 years in 1999, while life expectancy in Africa more than doubled from 24 years to 52 years between 1900 and 1999, reflecting diffusion in medical technology as well as rise in income per capita (Galor, 2005). 14
23 The acceleration in the rate of technological progress in the industrialization process further increased the demand for human capital. The proportion of English children aged 5 to 14 in primary schools increased from 11% to 74% between 1855 and 1900 and a similar pattern was observed in other European countries. Literacy rates of English men reached nearly 100% at the end of the 19 th century (Galor, 2005). A factor that enhanced the process of industrialization was the expansion of international trade. Due to the rapid industrialization in Northwest Europe as well as the reduction of trade barriers and transportation cost, international trade expanded significantly during the 19 th century. The ratio of world trade to output rose from a level of about 2% in 1800, to 10% in 1870 and to 21% in 1913 (Estevadeordal, Frantz, & Taylor, 2002, cited by Galor (2005)). While much of this trade was between industrial economies, a significant proportion also were between industrial and non-industrial economies. By the end of the 19 th century a clear pattern of specialization had emerged; Western Europe and North America were net importers of primary products and net exporters of manufactured goods, while the rest of World were exporters of overwhelmingly primary products (Findlay & O'Rourke, 2003, cited by Galor, 2005). Pomeranz (2009) argues that the technological and development differences were minor between Europe and Asia around 1750, but that the discovery of the new world, and following colonialism and Atlantic trade as well as trade with Asia, had a major effect on European growth starting in the late 16 th century and enabled Europe to take off technologically. While it appears that technological advances alone could have spawned the Industrial Revolution, the expansion of international trade and the associated growth in exports increased the pace of industrialization and the growth rate per capita (Galor, 2005). 3.3 How low-income countries today differ from developed countries in their earlier stages It should be noted that today s position of most developing countries differs significantly in many important ways from what the developed countries went through in their era of modern economic growth. Todaro and Smith (2009) has identified eight significant differences in initial conditions: For a country to exploit natural resources and sustain long-term economic growth it is dependent of its human resources and skills of its people. The population of today s developing nations are often less educated, less informed, less experienced and less skilled 15
24 than their counterparts were in the early days of the economic growth in the Western countries (Todaro & Smith, 2009, p. 72). On average, the people living in today s developing countries also have a lower level of real income per capita compared to the levels of their developed-country counterparts had in the early days of the economic growth. 40% of the population in developing countries are living at bare minimum levels. At the beginning of their era of modern growth, the Western world was economically in advance of the rest of the world and could take advantage of their position to widen the income gaps between them and them and the rest of the world (Todaro & Smith, 2009). Before and during the early stages of growth, Western countries experienced a slow rise in population growth compared to today s developing countries. Even if the population growth increased during the industrialization process, no Western country had population growth rates above 2% per year and generally averaged less. In contrast, the population growth rates of many developing countries have exceeded 2.5% per year in decent decades and some are even rising that fast today. Another result is that many of today s developing countries have a much higher person-to-land ratio than the Western countries had in their early years of growth. Except for the former Soviet Union, no country that experienced a long-term period of growth approached the present-day population of India, Egypt, Pakistan, Indonesia, Nigeria or Brazil, nor were their growth rates anything like Kenya, the Philippines or Bangladesh (Todaro & Smith, 2009, p. 7). Another obstacle for today s developing economies compared to the Western world during their growth period is the more limited possibilities for emigration to reduce the pressures of overpopulation. Between 1850 and 1914, at a time when the world s population was less than a quarter of today s levels, over 60 million people migrated to the Americas from Europe. Their home countries were relieved from the costs of providing people who probably would be unemployed as well as reducing likelihood of severe famine and reduced pressure on land. A large percentage of the workers earnings were also sent home and these countries received a significant source of foreign capital. Even though over 50 million people have migrated to the Western world from the developing world since 1960, this is not nearly enough to reduce their pressures of overpopulation. The reason is not primarily lack of knowledge about opportunities in other countries, but the combined effects of distance, and most important the very restrictive nature of immigration laws for entering and residing in developed countries. The irony of international migration today is that those who can immigrate into developed 16
25 countries, are the personnel that the developing countries least can afford to lose; The highly educated and skilled specialist. Since specialists often move on a permanent basis, the developing countries experience what is known as Brain drain, which not only represents a loss of valuable human resources but could also be a limitation to their future economic progress. India, Philippines and a number of African countries to name some, has experienced that significant groups of their professional workers; doctors, university teachers, engineers, middle- and high level managers has emigrated to North America, Australia and Europe (Todaro & Smith, 2009, pp ). International free trade has been called the engine of growth and was a major catalyst for the development of the Western nations during their growth period. Rapidly expanding export markets combined with increased local demands led to the establishment of large manufacturing industries largely based on relatively free trade and movement of capital and labor across countries. Even if developing countries has experienced increased export volumes, their terms of trade (the relative price they receive for exports to the price of imports) has declined over several decades. Developing countries have mostly only been successful at becoming producers of lower-cost and simpler products like raw materials, textiles, clothing and some light manufactures they still have experienced various forms of barriers like tariffs, import quotas, sanitary requirements, licensing and intellectual property claims and other restrictions (Todaro & Smith, 2009). During the growth process of the Western world they were scientifically and technologically greatly ahead of the rest of the world. While developing countries technological industries has suffered from the extremely disadvantageous competitive position vis-à-vis the developed nations (Todaro & Smith, 2009, p. 77). Another difference lies in efficacy of domestic economic, political and social institutions. By the time of their early industrialization, many of todays developed nations had economic rules of the game that gave broad access to opportunities for entrepreneurs. As discussed later in chapter 4, the high inequality and the poor institutions of many developing nations were often established for extraction by colonial powers and provide few incentives for increased productivity. Such extraction is today often carried out by powerful local interests or foreigners (Todaro & Smith, 2009). 17
26 3.4 Neoclassical growth theory In the 1960s, growth theory mainly consisted of neoclassical growth contributions, as developed by (Solow, 1956), (Swan, 1956), (Ramsey, 1928), (Cass, 1965), (Koopmans, 1965). A feature of these models is their convergence hypothesis, which says that the lower a country s starting level of GDP per capita, the higher predicted growth rate. If all economies were intrinsically similar, except for their starting capital, then convergence between rich and the poor countries would apply in an absolute sense (Barro, 1996). Poor countries would tend to grow faster than richer countries. However, in the real world, economies are different in various factors; including saving ratio, demography, eagerness to work, access to technology, and government policies thus, the convergence force only applies in a conditional sense. Endogenous growth theories follow an extended version of the neoclassical models, and include possible explanation for long-term growth including government policies, human capital and the diffusion of technology. Technological improvements can be important to understand why GDP per capita can continue to grow indefinitely. 3.5 Are the living standards between developing and developed nations converging? During the last two centuries, we have witnessed dramatic changes in the distribution of income and population and a great divergence has occurred across regions in income per capita. The major factor behind has been the differential timing of the take-off from stagnation to growth and the corresponding variations in the timing of the demographic transition (Galor, 2005). Inequality in the world economy was almost negligible until the 17 th century and while the ratio of GDP per capita between the richest region (Europe and the Western Offshoots) and the poorest region (Africa) was only 2:1 in 1500 and 3:1 in 1820 it has widened considerably, today that ratio is near 100:1 (Todaro & Smith, 2009, pp ). This leaves no doubt that the developed countries of today has experienced far higher rates of economic growth than the developing countries of today. If their growth experience was similar, and you would expect a convergence of living standards between developed and developing nations again, developing nations should catch up by growing faster than the developed nations. The reasons to expect that to happen is because of technological transfer and the fact that they do not have to reinvent the wheel but simply copy the technology and successes that made the developed nations grow without the mistakes and dead-ends along. The later a country begins its modern economic growth, the shorter time they need to double the input per worker. One example is the development success story of South Korea where they doubled their input in just 11 years, compared to the United Kingdom that needed 60 18
27 years to achieve the same during their first years of economic development. You would also expect developing countries to be more attractive for investors because the marginal output of capital and investments would be higher in developing markets where capital intensity is lower. Despite the huge differences today, you would expect at least some tendencies of convergence between the group of countries (Galor, 2005). However, the poorer countries have tended to grow slower than the richer countries during the last 50 years. The differences between low- and high-income countries today may be very difficult to change. A poor country cannot force a rich country to lower its trade barriers. The only convergence witnessed has been among the OECD countries, nevertheless it is difficult to find, if any convergence between the least developed and the developed countries. This is likely a clear reflection of the differences in growth conditions between the groups of countries. The rapid growth in China and the recent acceleration of growth in South Asia, is at least a limited convergence towards developed countries income levels. In the period between 1990 and 2003 income grew at 24% in OECD countries while it grew 56% in South Asia and 196% in China in the same period. Meanwhile, even though these regions grew faster in the period from 1990 to 2003, because of China and South Asia s relatively low starting levels the gains in the OECD countries were larger in terms of absolute amount. The long-run path to catch-up is still a huge gap to fill and despite the current per capita income convergence many of the poorest countries remain in absolute stagnation (Todaro & Smith, 2009, pp ). 19
28 Chapter 4 Theoretical background and relevant literature There is still little consensus what the fundamental cause of large differences in income per capita between countries are, but especially differences in institutions and property rights have received considerable attention in recent years. In this chapter I will go through relevant theory on the challenges that are experienced by the Emerging Markets: the resource curse, the middle-income trap, Robert Barro s Determinants of Economic Growth, inequality and New Institutional Economics. 4.1 The resource curse I call petroleum the devil s excrement. It brings trouble Look at this locura - waste, corruption, consumption, our public services falling apart. And debt, debt we shall have for years. These are the powerful words of Juan Pablo Péres Alfonso, the Venezuelan politician primarily responsible for the creation of OPEC, during the oil-boom of the mid-1970s. A quote by the former Saudi-Arabian minister of Petroleum, Ahmed Zaki Yamani also highlights a similar experience: all in all, I wish we had discovered water (Ross, 1999). The so-called resource curse states that resource-rich countries will have slower economic growth compared to similar countries without large natural resources (Ross, 1999). In the traditional Ricardian theory of comparative advantage, natural resources have been viewed as a blessing for developing economies (Ricardo, 1817). But, since the 1980s there has been shown empirically and analyzed in several studies even after controlling for trends in commodity prices that countries that are rich in natural resources tends to experience lower growth rates than countries with less natural resources has been shown. Studies, which include (Auty, 1990), (Gelb, 1988), (Sachs & Warner, 1995, 2001), (Lane & Tornell, 1996), (Gylfason, Herbertsson, & Zoega, 1999) show that on average resource abundant countries lag behind countries with less resources. However, we cannot say that all resource rich countries are marked by this curse. Even though, most resource abundant countries are affected by negative economic, political and social outcome, resource rich countries like Botswana, Norway, Canada and Australia are among countries that has done quite well. (Mehlum, Moene, & Torvik, 2006) argue that the resource curse only appears in countries with inferior institutions and that the resource curse vanishes for countries with better institutions. This hypothesis is supported with observations from several countries. Norway was one of the poorest countries in Europe in 1900, but are 20
29 now among the richest. This growth has been led by natural resources such as timber, fish and hydroelectric power and more recently oil and gas. Norway is considered one of the most stable democracies and least corrupt countries in the world. Since its independence from the United Kingdom in 1966, Botswana has had the highest average economic growth rate in the world with an average of 9% per year from 1966 to 1999 (2015). Based on its purchasing power parity, gives a standard of living around that of Mexico and Turkey. This growth has been built on mining of diamonds. Meanwhile, Botswana has been rated as the least corrupt country in Africa (sharing the spot as the 28th least corrupt country in the world with Portugal), according to Transparency International (2016). Mehlum et al. (2006) predicts that natural resource abundance only hinder economic growth in countries with weak institutions such as weak rule of law, malfunctioning bureaucracy, and widespread corruption. However, the resource curse applies in resource-rich countries with weak institutions. The extremely resource-abundant countries such as the Oil States in the Gulf, or Nigeria, or Mexico and Venezuela have been resource-rich for a long time, but have not experienced sustained rapid economic growth. These findings are as mentioned, not easily explained by other variables, since these findings survive well after the introduction of a long list of control variables What is the curse? As mentioned earlier, a large number of studies has shown empirically, that natural resource abundance or at least abundance on some natural resources reduces economic growth. Wheeler (1984) found that among sub-saharan African countries, those that were rich in minerals grew slower than countries that did not have significant mineral resources during the 1970s. Gelb (1988) found a negative correlation between natural resources and economic growth present in hard mineral economies and even more in oil exporting economies. Scholars have also suggested that the problems of resource abundant countries go beyond low economic growth. Studies, among them Collier and Hoeffler (1998), Collier and Hoeffler (2005) and Doyle and Sambanis (2000) suggests that abundance of natural resources is associated with civil wars and the number of battle related deaths. Studies on the resource curse also suggests that abundance on natural resources is associated with low levels of democracy. Ross (2001, pp ) concluded after examining data from 113 states between 1971 and 1997 that a state s reliance on oil or mineral exports tends to make it less democratic; that this effect is not caused by other types of primary exports; that is 21
30 not limited to the Arabian Peninsula, to the Middle East; or to sub-saharan Africa; and that is not limited to small states. Most studies which try to explain the resource curse suggests that the main problem with abundance on natural resources is not the natural resources or the skewed export itself, but that it creates rents excess earnings above normal profits. These rents are seen as a contributor to negative development outcomes by promoting rent-seeking behavior by the political elites and/or the social actors, as well as weakening the state capacity to regulate and supervise the economy, empowering social elements that are opposed to growth-promoting policies, or encouraging foreign intervention (Rosser, 2006). Several scholars have also suggested that the problem is not abundance on natural resources, but abundance on particular natural resources. They have pointed out point source natural resources for instance; oil, minerals and plantation crops as particularly problematic. Isham, Woolcock, Pritchett, and Busby (2002) found that countries rich in point source natural resources grew more slowly during the 1980s and 1990s than countries that are rich in natural resources like wheat and plantation crops like cocoa and coffee Explanations for the resource curse Even if there are strong evidences that there is a resource curse, scholars argue on which variables that are attributed as explanation for the curse. We lack a universally accepted theory of the curse of natural resources (Sachs & Warner, 2001). Dutch Disease is one of the most cited explanations of the resource curse. Dutch disease describes the combined influence of two effects that commonly follow resource booms and makes a country s tradable goods less competitive in world markets. The first effect is that appreciation of the currency caused by the sharp rise in exports could lead to a competitive disadvantage for the other exporting industries and other sectors of the economy suffering because imports become cheaper for all sectors. The other effect is the tendency of a booming resource sector to draw capital and labor away from a country s manufacturing and agricultural sectors and raising their production costs (Ross, 1999). This could lead to unemployment and loss of manufacturing capabilities in the nation. The decrease in other sectors exposed to international competition leads to even greater dependence on the natural resource revenue and leaves the economy vulnerable to price changes in the natural resource. Dutch disease has its name after the discovery of a massive natural gas field in Groningen in The Netherlands sought to tap this resource by exporting the gas for profits. With focus, 22
31 mainly on gas exports, their currency appreciated, and harmed the country s ability to export other products. This in turn led to the Netherlands experiencing a recession (Fardmanesh, 1991). This processes has been witnessed in several resource exporting countries in the world, one of the most visible examples are Venezuela (oil) and Angola (diamonds and oil). Another explanation to the resource curse is that international commodities markets are subject to unusually sharp price fluctuations. These fluctuations are transferred to the states domestic economies making government revenues and foreign exchange supplies unreliable thus making private investments more risky (Nurkse, 1958). It has also been argued that one of the reasons of the curse is economic concentration. Resource industries are not likely to stimulate growth in rest of the economy, but are instead, because of the higher salaries available than elsewhere in the economy, damaging the other sectors by attracting the best talents and the most skilled personnel. Another perspective on the resource curse suggest that natural resources help maintaining government monopoly power because the natural resources provides steady income for the government, and the governments are able to use government spending and low taxes to reduce pressures for democratization (Lam & Wantchekon, 2002). Despotic and authoritarian leaders could keep their positions and avoiding the need for broad economic and social development. The resource incomes also gives the political elites the opportunity to consolidate their power and neglect their people by preventing social and cultural changes such as rising education levels and specialization that facilitate specialization (Ross, 2001). The general assumption is that the political and social elites in resource abundant countries have a high degree of autonomy from domestic social groups because the states are financially independent of them. Because the domestic social groups do not have to fund the state, they also make few demands of it (Rosser, 2006). Economic diversification may also be neglected by the government or delayed in the light of the (temporary) high profitability of the limited natural resources. The abundance of revenue from natural resources discourages longterm investment in infrastructure which could support a more diverse economy. While the resource sectors tend to provide large financial revenues, they often provide few jobs and tend to operate as enclaves with few connections to the rest of the economy (Ross, 1999). 23
32 4.2 The middle-income trap In fact, over the last four decades few countries except for a few, East Asian ones have converged to the income levels of the rich countries. The vast majority of growth spurts tends to run out of gas after a while (Rodrik, 2005, p. 996). Many countries that escape poverty experience periods with high growth, followed by stagnation and even decline, or are stuck at low growth rates. They are caught in the middle Income Trap, where they are unable to compete with high-skill, innovative and advanced economies (Gill & Kharas, 2008). Few countries can sustain high economic growth without changing strategies and even fewer continue to keep high growth rates after they have reached middle-income status. The strategies that helped countries grow during the low-income stage, are the same that prevents them from moving beyond the middle-income stage. Growth in low-income countries can be generated by moving their labor force from low-productivity activities to activities with higher productivity. The movement in China of surplus agricultural labor to the industry is a classic example of how growth happens in low-income settings. This is an export-led strategy, where the strategy for fast growth is aimed at diversifying and building domestic production in most goods and services and focusing on the supply-side of an economy (Kharas & Kohli, 2011). The growth-strategies for middle-income countries differs from this. The growth tends to be more capital- and skill-intensive on the supply side and being more oriented towards services. A significant difference from the low-income growth-strategies is the increased focus on demand. Due to the higher wages and decline in cost competitiveness, exports cannot be as easily expanded as before. Export growth is depending on the introduction of new processes and finding new markets (Kharas & Kohli, 2011). Most Latin American countries, has failed to make the transition from resource-driven growth driven by low-cost labor to productivity-driven growth driven by specialization and innovation and becoming advanced economies. This is in sharp contrast with the so-called East Asian Tigers of South Korea, Taiwan, Singapore and Hong Kong, that were able to move first from low-income to middle-income status, and then from middle-income to highincome status, almost without interruption during the past 50 years (Kharas & Kohli, 2011). In the article What is the Middle-income trap, why do countries fall into it, and how can it be avoided? Kharas and Kohli (2011) discuss the divergent experiences of Latin America, 24
33 especially Brazil and the East Asian tigers. They find that the East Asian tigers managed three critical transitions that Latin America has failed (Kharas & Kohli, 2011, p. 286): 1) From diversification to specialization in production 2) From physical accumulation of factors to productivity-led growth 3) From centralized to decentralized management Specialization and technological focus Specialization was crucial to allow the East Asian countries to benefit from economies of scale and to offset the disadvantages and cost associated with higher wages (Kharas & Kohli, 2011). They developed and supported domestic and international global champions in specific areas. South Koreas government involved actively in the industrial transformation from laborintensive industries into heavy and chemical industries. The economic development of South Korea was heavily based on the emergence of large business conglomerates like Samsung, Hyundai and LG. The emergence of these conglomerates was an efficient response to the institutional voids that often characterize an economy during its underdevelopment phase (Levy & Kuo, 1991). Their mindset to become global also played an important role. Since the South Korean domestic market is very small, the companies had to be outward-focused to survive against domestic competition. Also, development of a good social-safety nets and skill-retraining nets are policy ingredients that could help the managing difficulties associated with the restructuration that accompanies specialization (Kharas & Kohli, 2011). O'Neill (2011) suggests one common variable to be more supportive to future economic growth than any other, technology. New developments in communication is the leader in this new phase of globalization where national economic borders are being eroded and makes it easier to participate in global business and markets Growth based on total factor productivity A focus on total factor-productivity growth requires major changes in education, from primary schooling to tertiary education. The knowledge economy which is proven to be a source of major technological process need a critical mass of high skilled and high-productive professionals (Kharas & Kohli, 2011). To escape the middle-income trap, they need to focus on building institutions for development of human capital. High skilled professionals cannot be created overnight and require long-term investments and planning. Sustainable growth is not possible without focusing on building a good infrastructure for science and technology which is achieved with a strong education system (Mudambi, 2015). The education system 25
34 must be fitted to a knowledge and innovation economy (Kharas & Kohli, 2011). A noteworthy feature is the dramatic differences between Brazil and South Korea in the levels of innovation capacity. The number of patents assigned to South Korean entities were by 2010, while the corresponding figure for Brazil was only If you compare patents per capita, the differences are even more dramatic considering that Brazil have a population of 200 million while South Korea only have a population of 50 million (Dutta, Lanvin, & Wunsch-Vincent, 2014). Innovation must also be accompanied by investment and capital accumulation. If there are few options for financing, incentives are low and barriers are high for developing new technology (Kharas & Kohli, 2011) Decentralization, income distribution and expansion of the middle-class Modern economies tend to be complex and policymakers require large amounts of information as well as the need to address local issues of opportunity and distribution. This is more difficult to achieve with a centralized system. However, local governments could more easily being captured by special interests than a centralized government (Kharas & Kohli, 2011). To increase domestic demand, an expansion of a middle class is also needed. The growth rate will slow down if there is no development of the middle class. Latin American countries has enjoyed several episodes of fast growth, followed by financial crisis which has prevented them from becoming advanced economies. To avoid the middle-income trap, macroeconomic growth must be associated with income distribution (Kharas & Kohli, 2011). Formal economic models show that stagnation of the middle class and growing concentration of income have been negatively affected recovery from the great recession of Exportled growth is vulnerable to slowdowns in the global economy, but a large middle class provides a cushion of domestic demand and some protection against strong negative effects. Brazils recovery from this crisis has partly been attributed to social policies for income distribution and the country s doubling of its middle class since 1978 (Kharas & Kohli, 2011) The importance of political leadership The transitions require strong political leadership as well as long-term focus on economic growth which engages in a sustained process of institutional development as well as high quality-interaction with the private sector. These ingredients were present in each of the East Asian countries that managed to avoid the middle-income trap (Kharas & Kohli, 2011). 26
35 4.2.5 Demographics, investment ratios and inflation When analyzing the correlations of growth slowdowns and the middle-income trap Eichengreen, Park, and Shin (2013, p. 3) found that slowdowns were positively associated with high growth in the earlier period (suggestive of mean reversion), with unfavorable demographics (high old-age dependency ratios in particular), with very high investment ratios (as if growth fueled by brute-force capital formation eventually becomes unsustainable), and with an undervalued exchange rate (as if countries with undervalued currencies have less incentive to move up the technological ladder out of unskilled-laborintensive, low-value-added sectors and thus find it more difficult to sustain rapid growth). These results are considered suggestive, particularly for China. 4.3 Robert Barro s Determinants of Economic Growth Based on empirical findings from a panel of around 100 countries from 1960 to 1990, Robert Barro at Harvard University, found that for a given starting level of real per capita GDP, the economic growth rate was enhanced by higher initial schooling and life expectancy, lower fertility, lower government consumption, better maintenance of the rule of law, lower inflation and improvements in the terms of trade (Barro, 1996). Barros findings also supported that the extent of democracy did not emerge as a critical determinant of economic growth. With low levels of political rights, an expansion of political rights could stimulate economic growth, but once a moderate amount of democracy was attained, further expansion reduced growth. A possible explanation of this effect is that in extreme dictatorships an increase in political rights tends to be followed by an increase in economic growth, because limitations on governmental authority is critical. However, if there already has been achieved some political rights, further democratization may retard growth because of increased focus on income redistribution and social programs. In contrast to the small effect of democracy on growth, there is a strong positive influence of the standard of living on a country s propensity to experience democracy. This relation is known as the Lipset hypothesis (Lipset, 1959). Among the measures of standard of living found to predict democracy include real per capita GDP, life expectancy, and smaller gap between male and female educational attainment (Barro, 1996). 27
36 4.3.1 Growth Environment Score (GES) Higher productivity is critical for sustaining growth. O Neill et al. (2005) suggests that the key to converting potential into reality is to strengthen long-term conditions for growth; macroeconomic stability, political institutional development, trade and investment openness and education. They also introduce the Growth Environment Score (GES), a ranking system which aims to summarize the overall conditions for economic growth. GES is a ranking system to forecast a country s chances of converging onto the developed world s income levels. The measure system drew primarily on the World Bank s World Development Indicators database. The index is ranking are ranking 170 different countries growth environment on a score from 10.0 (best) to 1.0 (worst). GES can be divided into five basic areas (O Neill et al., 2005): Macroeconomic stability, Macroeconomic conditions, Technological capabilities, Human capital and Political stability. The GES index variables has been found to have a significant and relatively robust effect on growth in various crosscountry growth regressions. Their main reference is Robert Barro s influential research (Barro, 1996). No ranking system like this can ever be perfect, but the authors believe it gave a reasonable mean of forecasting a country s chances to reach the income levels of the developed world. However, it is not known exactly what causes productivity to increase and if it were known, economic growth would be predictable, achievable and easy to attain. (O'Neill, 2011, p. 36) 4.4 Inequality Figure 4.1: Per capita income and inequality (Collected from (W. Easterly, 2005, p. 4)) 28
37 The effect of inequality on economic development is hotly debated. Engerman and Sokoloff (2005) suggest that inequality is a determinant of bad institutions, low human capital investment and underdevelopment. There is strong evidence of an association between inequality, measured by the Gini coefficient averaged over the last 3 decades, and the level of per capita income today (W. Easterly, 2005). This effect of inequality hindering economic development is shown to be statistically significant (W. Easterly, 2005, p. 22). However, this causality could also be reversed; that rich countries can afford redistribution. Engerman and Sokoloff (2005) suggested that the elite in Latin America opposed democracy and mass investment in human capital because of the fear that the poor majority would gain power and redistribute income and rents away from the elite towards the majority. Since people with more human capital are more likely to be politically active, the elites wanted to suppress democracy and equal rights to preserve their privileged positions. High inequality makes poor institutions difficult to reform, since the small elite are not served with any change of the rules of the game. Recent research agrees that forces that protect narrow elites and limit the access to opportunities for advancement for the broader population are major obstacles of successful economic development (Todaro & Smith, 2009). Todaro and Smith (2009, pp ) lists several reasons why reduction of poverty and acceleration of growth is not in conflict, and why we should be concerned with inequality above the poverty line. One of the reasons why we should also focus on relative poverty and not only on absolute poverty is that widespread poverty makes large groups of the population unable to finance their children s education and instead have many children as a source of old-age security. These factors together, is a major cause of less per capita growth. The rich in many of today s poor countries are also generally not noted for their frugality or desire to save and invest in the local economy. The rich tend to spend more of their additional income on imported luxury goods or seeking safe havens abroad, so-called capital flight. Instead of increasing a country s productive resources, they instead represent substantial drains. Moreover, raising the income of the poor would likely increase the levels of financial savings and investments like education for their children and improved housing and nutrition for their families who in turn increases local economic activity. With high inequality, the overall rate of saving in the economy tend to be smaller, low- and middle-income individuals spend increased money on investment not on consumption. Rich people save a smaller fraction of their marginal income compared to lower income individuals. Low income and low levels of living for the poor also causes poor health, nutrition and education which in turn could lead to 29
38 lower economic productivity for large groups of the population. Extreme income disparities also undermine the social stability and solidarity. High inequality facilitates rent seeking (corruption) where resources are diverted from productive purposes that could increase economic growth. A reduction in mass poverty is also suggested as a powerful incentive for widespread participation in economic development. Poverty reduction, however is not necessarily followed by and is possible without economic growth. Finally, from an ethical view, extreme inequality is viewed as unfair. Much of the inequality is based on luck or extraneous factors like who your parents and grand-parents where, not on skills and hard work. Nevertheless, some inequality is always needed in a society. If everyone had the same income no matter their efforts, there would be less incentives for hard work or innovation (Todaro & Smith, 2009). 4.5 New Institutional Economics There is never one single cause or explanation for economic development, but one of the key parts to explain it is the quality of (or lack of) institutions (Ostrom, 2008). This is the focus for literature based on New Institutional Economics (NIE). While large natural resources or new technology could explain short-term economic growth, institutions are the fundamental cause of long-run growth and sustainable economic development. Research has shown that missing, weak or perverse institutions are the roots of underdevelopment and poverty (Shirley, 2005). Investments, technological innovations, years of schooling or other explanations for development are not correlated with higher rates of economic growth (W. R. Easterly, 2001). However, large and statistically significant correlations between institutional variables and growth are persistently demonstrated in cross-country regressions. According to North (1990) countries with better institutions, reflected by more secure property rights and better policies will invest more in both physical and human capital, and are more likely to achieve greater level of income. When you compare historical and current states, that differ only in quality of institutions like North and South Korea or West and East Germany, it is obvious that institutions matter. However, it should be noted that the effect could be reversed; that rich countries chose or can afford better institutions (D. Acemoglu, S. Johnson, & J. A. Robinson, 2001). 30
39 4.5.1 What are Institutions? Institutions could be difficult to study because institutions are mostly invisible. There are multiple definitions what an institution is. The definition used by Douglas North is that institutions are the external representation of the belief systems in a society (North, 2008). They are the prevailing rules of the game and includes both formal rules embodied in constitutions, laws, contracts, and market regulations, plus their informal rules which is reflected in norms of behavior and conduct, values, customs, and the generally accepted ways of doing things (Todaro & Smith, 2009). Organizations are the players of the game and are made up of groups of individuals held together by some shared objectives and beliefs. Examples of organizations are economic organizations like; firms, trade unions, cooperatives; political organizations like political parties, legislatures, regulatory bodies and human resource organizations like universities, schools, training centers, hospitals, health centers etc. The short-term objectives for organizations may be profit maximizing (firms) or political power (political parties); but the long-term objective for any organization is survival, because we live in a world with scarcity of limited resources and hence competition. Improving the efficiency compared to its rivals, is the key to survival of the organization (North, 2008). Humans (and organizations) attempt to reduce risk or uncertainty by following path dependence the way which institutions and beliefs derived in the past influence present choices. The institutional framework defines the rules for what is acceptable behavior in a specific context and determines the incentive structure of a society. The organizations that come into existence will reflect the incentive structure of a society: If the highest rate of return in an economy comes from piracy, we can expect that the organizations will invest in skills and knowledge that will make them better pirates (North, 2008, p. 23). If there are high returns from productive activities, we can expect that the organizations will invest their resources into skills and knowledge that improves their productivity. Similarly, if an organization has secure monopoly or little or no competition, they will have less incentive to invest in new knowledge or further improvements, and consequently will not induce major institutional change. The result will be stable institutional structures and little institutional change. The institutional framework provides the incentive structure that dictates the kinds of skills and knowledge perceived to have the maximum payoff (North, 2008). 31
40 4.5.2 What institutions are important for economic growth? Some ways of organizing societies will encourage people to be innovative, to take risks, to save for the future, to find better ways of doing things, to learn and educate themselves, to solve problems of collective action and to provide public goods, while other ways of organizing societies do not. Institutions are one of the key fundamental reasons that makes one country successful in terms of economic development while other countries fails to succeed (Acemoglu, Johnson, & Robinson, 2005). To meet the challenge of development, countries need an institutional framework that supports a market economy. According to Shirley (2005) and Rodrik, Subramanian, and Trebbi (2004), useful institutions can be categorized into three different categories: The first category are Institutions forming units of social behavior, the second category is Institutions that foster efficient economic exchange, the third category is Institutions that Protect Property and Persons. Institutions forming units of social behavior (Rodrik et al., 2004) are for example a religion or a nation, Integrative institutions. A well know example of this is the thesis that the protestant work ethics was an important force behind the emerge of capitalism in Northern Europe (Weber, 1905). Institutions that foster efficient economic exchange (Shirley, 2005) are institutions that lowers transaction costs and encourages trust. Transaction costs are the costs of finding a trading partner, deciding terms of the trade (bargaining and decision cost), making a contract/agreement, as well as the monitoring and enforcing of the contract. Important is commercial rules and norms, shared values, contracts and contract enforcement mechanisms. If the costs of making an exchange are greater than the gains with that exchange would bring, that exchange will not take place (Coase, 1992, p. 197). High transaction costs in a society leads to less trade, less specialization, less investment, and thus, lower productivity. In societies where the institutions increase the certainty that contracts will be honored, individuals and organizations will also be more willing to specialize, investing, as well as undertaking complex transactions and sharing their knowledge (North, 1990, p. 34). The third category of useful institutions are Institutions that Protect Property and Persons (Shirley, 2005), for example constitutions, electoral rules, laws governing speech and education, and norms that motivate people to abide by laws and cooperate in monitoring government. The most developed countries today are those with a state with power to assure stability and peace and protecting property rights, but at the same time have mechanisms that limit state power, such as independent parliaments and judiciaries or federalism. In countries where property rights are insecure and transaction costs are high, resources will more likely 32
41 be channeled into activities with rapid returns, while resources will be siphoned off as bribes or security. In these countries and societies individuals are more likely to engage in nonproductive activities like rent seeking and war lording, than by investing their resources into production, innovation and learning (Shirley, 2005). Much of the world s population, lives in countries where the state is either too weak to prevent theft of property by private actors, or the state is so strong that the state itself threatens private property rights and private independence. In both cases, individuals and organizations face a high risk that they will not be able to realize a return if they invest in specific skills, knowledge or physical assets, so they avoid investing because of the uncertain outcome. Thus, production, innovation and productivity are low and the economy stagnates. An associating problem in such economies is that education will not necessarily provide a way out of this low level trap, because the quality of education is different from economies that provide incentives to invest in the future (Shirley, 2005). In countries where incentives to invest in the future are low, the quality of education will not be monitored by the society, teachers have little pressure or incentives to provide good education for their students. This leads to poor educational quality and associated under-investment in learning combined with brain-drain of high potential individuals (W. R. Easterly, 2001). It is also worth noting, that past economic success is not guarantee for wealth today, the currently underdeveloped economies of former wealthy countries such as Egypt or China is a magnificent example of that (Shirley, 2005) Why have so few countries created and sustained the rules and norms that foster growth and social progress? New Institutional economics (NIE) has made some progress towards answering why so few countries have could create and sustain institutions that foster growth and social progress. Some of the literature on this subject focuses on the colonial past of many underdeveloped countries (Shirley, 2005). During the last 600 years, most of the countries which we call underdeveloped were colonized at some time. However, some of the richest and most developed countries today; United States, Canada, Australia, New Zealand are also former colonies, so a history as a former colony might not always be the full explanation of poor institutions. North (1990) has suggested that the colonial powers created institutions that mirrored their own that did not have roots in and functioned with the local cultures. While Spain brought a centralized government and little functional bureaucracy as well as a system with property rights that favored the nobility, Great Britain brought its decentralized, limited government to their colonies. Nevertheless, this fails to explain why the British heritage has 33
42 not brought prosperity to their former colonies in Africa, the Caribbean or South Asia. Other argue that the institutions the Europeans imposed on their colonies depended on the conditions they found there. In regions such as Latin America, India or Africa that had a large population that could be enslaved or a climate that supported a plantation agriculture or large mineral resources, the colonies were a source for economic rent and they created institutions where political power were concentrated in the hands of a few for systematic exploitation of the rest of the population (Daron Acemoglu, Simon Johnson, & James A Robinson, 2001). While in the Northern US and Canada, which was sparsely populated and less suited for plantations, Europeans settled in large numbers and brought beneficial institutions with wide participation and private property rights. And when the industrialization began in the 19 th century, the countries burdened with extractive colonial institutions lacked secure property rights and provided few opportunities for technological innovation and economic growth, while the former colonies with higher institutional quality industrialized rapidly. D. Acemoglu et al. (2001) suggest a theory of institutional differences among countries colonized by Europeans based on differences in mortality rates among settlers. Different colonization policies created different sets of institutions. Some colonies were mostly set up for extraction of resources to the colonial power. In these colonies, the European powers did not introduce much protection of private property or provide checks and balances against government expropriation. An extreme example of this is the Belgian colonization of what is now the Democratic Republic of the Congo. Better institutions, however, were built were Europeans migrated and settled in large numbers. Here European institutions were replicated with strong emphasis on private property and checks against government power. Examples include United States, Australia, New Zealand and Canada. (D. Acemoglu et al., 2001) argue that the colonization strategies were influenced by the feasibility to establish permanent European settlements. Where the disease environment was not favorable to Europeans, it was more likely of an extractive state. The colonial institutions persisted even after these colonies got their independence. This hypothesis is supported by data on the different colonies mortality rates of soldiers, bishop and sailors stationed between the seventeenth and nineteenth centuries, which show that in colonies where Europeans faced higher mortality rates today are substantially poorer than colonies that were healthier for the Europeans. The article however, argues that mortality rates are not the only or the main cause of variation in institutions, but a source of exogenous variation. It should also be noted that colonial experience does not only mean areas that were directly controlled by Europeans, but also areas that experienced European influence, like sub-saharan Africa that were strongly affected by colonialism in 34
43 centuries before they became European colonies due to the Atlantic slave trade. Also, Government expropriation is not the only institutional feature that matter, expropriation is also related to constraints on government expropriation, independent judiciary, enforcement of property rights as well as institutions providing equal access to education and ensuring civil liberties, which are all important to encourage investment and growth (D. Acemoglu et al., 2001). Other argue that the explanation for poor institutions is not colonialism, but too little conflict of the sort that led the elites in Western Europe to make compromises and build good institutions to win supporters, raise revenues and defeat foreign enemies. (North & Weingast, 1989) focus particularly on England s Glorious Revolution in 1688 were the King was forced to accept a permanent role for the Parliament as well as greater independence for the judiciary and prohibitions against the Crown's arbitrary violation of personal liberties in exchange for funds and fighters needed to fight foreign wars. The absence of this form of wars to establish territorial boundaries as well as part of nation building, is viewed as an explanation for the underdeveloped institutions in many poor countries today. Instead of pre-colonial African states building effective institutions to defend their boundaries, the extensive conflicts were over slaves, mineral wealth or ethnic rivalries. Later, the Europeans made matters worse by doing little to build state institutions and by drawing national borders with opposing ethnic groups, setting the stage for continual civil war (Herbst, 2014). Other studies try to explain variations in quality of institutions by focusing on beliefs, norms and culture. One of the explanations of the emerge of capitalism in Northern Europe (Weber, 1905) is the thesis that the protestant work ethics was an important force behind. Greif (1993) focused on how the cultural beliefs and community ties between the Jewish Maghribi traders were successful in creating trust without written documents, but at the same time limited their trade to their own network while the Christian Genovese traders grew rich through expansion of their trade. Keefer and Knack (2008) however, found that norms that encourage people to cooperate even with people they have no family, business or other relational ties with, have economic payoffs. Knack and Keefer also suggests two factors increasing development-promoting norms: Income equality and education. Studies of East Asian countries suggests that part of the reason why they have experienced more economic growth and produced better social welfare measures than other less developed economies lies in their relatively high levels of education and income equality (Shirley, 2005, p. 624). 35
44 Institutions that protected property and supported strong market economies in Western Europe emerged gradually due to long and disorderly adaption and experimentation spurred by competition and wars. Additional research will be needed on this topic; it could be other circumstances that produced a supportive institutional environment that are missing in many other places. Location is also advantageous for institutional development. Stimulus from the rest of Europe has played a key role in the development of Western European countries (North, 2006). Despite disagreements on the ultimate determinants of institutional development, the different explanations converge on two underlying causes: great equality in combination with enough political competition to limit the rulers from expropriation Which institutions must function effectively if countries are to develop? A host of variables has turned out to be statistically significant. Roll and Talbott (2001 cited by); (Shirley, 2005, p. 626) found nine highly significant variables, holding up in multiple regressions: trade barriers, government expenditures, monetary policy (inflation), property rights, regulation, black market activity, political rights, civil liberties and freedom of press. But the problem with many of them are that they are not specific institutions, but explanatory variables and outcomes of good institutions. The quality of many institutions are also correlated, which makes it difficult to identify which institutions that matter most and which are substitutes for each other in spurring growth (Todaro & Smith, 2009). Some scholars argue that democracy is the most effective way to develop good institutions. A large literature however, only finds an ambiguous relationship between democracy and growth (Shirley, 2005, p. 627) and show that democracies on an average do not outperform autocracies. Almeida and Ferreira (2002) argue that the reason some democracies grow significantly better than autocracies is because of the greater volatility for autocracies caused by the tendency to be outliers, showing much better or much worse growth performance than democracies caused by much better or much worse policy choices. Democracies do better on other measurers than autocracies, but not on economic growth. It is also worth noting that it could be difficult to classify a political system as democratic or autocratic. Informal institutions could also influence the functioning of democracies. Keefer (2007) finds that especially young democracies are prone to clientelism, a system were politicians rather than taking positions on policy issues or provision of public goods, exchange goods and provide services in exchange for political support. Despite poor government performance, they avoid being thrown out of office due to their mutually beneficial relationship with a solid base of 36
45 clients, who at the same time are depended on their patron to be able to keep their privileges. Democracies could also be undermined by a lack of trust in the culture where mistrust hinders the citizen s from cooperating in monitoring the government (Shirley, 2005). India has been highlighted as a fully democratic country where the citizens has not been able to overcome collective action problems and thus, getting a more well-functioning government How can poorer countries attain well-functioning institutions? Institutional reforms are also difficult. According to Douglas North, formal rules may be changed overnight, the informal rules usually change only ever so gradually (North, 2008). Generally, poor institutions have proved to be very resistant to reforms, and this helps clarify why development is so challenging. But development is not impossible. Recent successful stories indicate that development is not inevitable despite poverty traps and numerous failures. (Todaro & Smith, 2009). There are multiple paths to economic development. Every developing country must find its own path to effective economic and social institutions (Rodrik, 2005). There is no unique link between the functions that good institutions perform and which form such an institution should take. The important first order economic principles: Protection of property rights, contract enforcement, market-based competition, appropriate incentives, sound money, debt sustainability, does not map into unique policy packages. These principles need to be packed into institutional design which are sensitive to local constraints and additionally can take advantage of local opportunities. Good institutions are those that deliver these principles in an effective way. Furthermore, countries with success are those that have used this room wisely (Rodrik, 2005). Institutions itself is a strong competitive advantage and nowhere is this point more clear, than in emerging economies where the institutional frameworks differ greatly from those in developed economies (Meyer, Estrin, Bhaumik, & Peng, 2009). Outsiders have changed deeply rooted institutions, usually by revolutions or invasions, sometimes in consort with a local powerful reformer (Shirley, 2005). Well-known examples of this is Napoleons enduring changes to Europe s institutions in a relatively short period of occupation. Nevertheless, force alone cannot explain that the changes occurred, the countries intellectuals were at the same time receptive to Napoleon s innovations. Powerful elites who welcomed foreign ideas also led major institutional changes in a short amount of time, such as Tsar Peter the Great in Russia or Mustafa Kemal Atatürk in Turkey. Shirley (2005) suggests that aid is a poor tool to change the beliefs and norms that underlie many institutions, because 37
46 most institutional changes are well beyond the time frame of most aid projects. Institutional change also requires alterations in beliefs that cannot be easily pushed or purchased by outsiders. Successful institutional adaptions have been engineered by insiders and sometimes work quite contrary to the conventional wisdom of best practice touted by the aid community. Furthermore, aid in the absence of a supportive institutional framework could even hinder reform by creating perverse incentives and help keeping rulers who are opponents, not catalysts of reform, in power. New Institutional Economics have not produced a full answer to those questions asked. Historical analysis has produced several explanations but no single argument is fully satisfactory. The quality of many institutions is correlated and it is disputed which of them that matter most and which are substitutes for each other in spurring growth (Todaro & Smith, 2009). While much is known about the institutional development in Western Europe, more research is needed on the development of institutions in developing countries (Shirley, 2005). Moreover, igniting economic growth and sustaining it are somehow different. Igniting economic growth generally requires a limited range of reforms. Sustaining economic growth however, is in many ways a harder challenge and requires construction of a sound institutional fundament to maintain productive dynamism and to create resilience to shocks (Rodrik, 2005). 38
47 Chapter 5 Data and Methodology The purpose of research is the production of new knowledge about a certain phenomenon using scientific methods. Scientific methods are a system of explicit rules and procedures which the research is based on (Jacobsen, 2005). These rules and procedures provide researchers the opportunity to communicate, to criticize, and to make scientific progress. Without following these rules, the research will have very limited value. The scientific method is the way researchers go about using knowledge and evidence to reach objective conclusions about the real world (Zikmund, Babin, Carr, & Griffin, 2013, p. 6) In this chapter I will explain my foundation of the methods chosen and I will present my research objective. According to Jacobsen (2005), the research process consists of six stages, and I will go through each step in addition to presenting my choice of variables for the data analysis, presenting the case-study and discussing the strengths and weaknesses of the chosen methods. 5.1 The development of the research question The problem definition is according to Jacobsen (2005) three-parted. First one must define the wanted research units, then define how to measure the specific phenomena by chosen variables and at last decide the context and the precise setting. As explained in the introduction, this thesis aims to answer why some countries succeed in achieving sustainable economic growth, while others do not, by focusing on the Emerging Markets. I will try to find what factors and institutions are essential for establishing long-term economic growth. Which factors has helped them grow and which factors would help them achieve sustainable longterm economic growth? I will also look more deeply into three of the major Emerging Markets; China, India and Brazil. Which factors and institutions has helped them grow, what factors and institutions would help them or what will hinder them continue growing into highincome economies? Research Questions 1) Which factors are essential for improving a country s growth environment and for establishing long-term economic growth? 2) What are the main institutions of China, India and Brazil and their main drivers and hindrances for achieving sustainable growth? 39
48 5.2 Research design The research design represents the framework for the study as a guide in collecting and analyzing data. There is no standard or correct research design, but the type of research design should be consistent with the purpose of the research. The fundamental objective of the research can be classified as exploratory, descriptive or causal (Jacobsen, 2005). In an exploratory study the primary aim is to get ideas, insight and understanding of the phenomenon being studied. More precise exploratory design seeks to identify the problem (including research problem), pinpoint the problem and formulate options / hypotheses (Hair, Anderson, Tatham, & Black, 1998). Exploratory design can also contribute to answer research questions or could be an early part of the research process. Exploratory research is well suited with quantitative research methods and include literature search, experience surveys, focus groups, and case studies with analysis of selected cases. I use exploratory research in this thesis to get knowledge of the relevant theories and in the qualitative part when I am studying China, India and Brazil. The flexibility, time and openness made the exploratory design most suitable for this. Descriptive research requires a substantial knowledge on the topic which is studied. The research will also present a clear answer to the research question. Casual research tries to identify relations and cause-effect relations between variables. In social science this is defined as If X occurs, there is a given probability for Y to occur. (Jacobsen, 2005). We can infer causality in four ways; Concomitant variation implies that X and Y occur or vary together in the way predicted by the hypothesis. This is of course not enough to prove the hypothesis. Time order makes causality more likely if the occurrence of a causal factor precedes or at least is simultaneous with the occurrence of the effect. Elimination of other possible factors with control variables or moderating variables, combined with theoretical support also infers causality (Jacobsen, 2005). Causal design is the chosen design for the quantitative research where I want to see which factors that has had a significant impact on the economic growth in the Emerging Markets. 5.3 Methods Research methods are classified as either quantitative or qualitative depending on which data collection methods are used and what the purpose of the research is. The research method 40
49 should be based on the research question and to what extent the method can be used to answer the phenomenon being studied (Yin, 2013). Quantitative research methods explore research objectives through empirical assessments that involve numerical measurements and analysis approaches (Zikmund et al., 2013, p. 134). Quantitative research emphasize amount and use numbers instead of words and is often based on large samples and enables the results to be generalized in much greater extent. However quantitative research methods offer little depth and is considered superficial, less flexible, and there will be much information and nuances which is difficult to visualize. Quantitative research is structured and normally provides categories while qualitative research is more adaptable and has free forms (Jacobsen, 2005) Qualitative research is often meant to describe a situation or phenomenon in depth and is often based on smaller samples. You can visualize information and nuances which you are not able to do with quantitative methods. A major limitation and consequence of the depth and elaboration combined with smaller samples is that it reduces possibilities for generalization. The researcher is also often involved in both data collection and the statistical analysis. A consequence is that the qualitative research is more researcher-dependent and subjective compared to quantitative research (Jacobsen, 2005). Qualitative research can accomplish what quantitative research cannot and the other way around. Therefore, I will analyze cross-country data first, and supplement it with a case study on China, India and Brazil afterwards. 5.4 Data collection Primary data is data collected for a specific research. Given the nature and topic of this thesis, and in addition to cost and time, I will base my research on secondary data. Secondary data is data that are not directly assembled fort the purpose of the given project (Hair et al., 1998). The advantage of secondary data is that it is fast available, given it the fact that it is already gathered. In this thesis I use secondary data from the World Banks data of World Development Indicators (The World Bank, 2016b) and Worldwide Governance Indicators (The World Bank Development Research Group, 2015) as well as educational data collected from Barro and Lee (2013). 5.5 Unit selection For more information regarding unit selection, see chapter 2.2 Identifying the Emerging Markets. 41
50 Emerging Markets are countries that are neither part of the least developed countries, nor of the newly industrialized countries. An emerging market is a market big enough to count in the world economy or global politics, in terms of sizeable populations in combination with sizeable economic activity, but at the same without high enough income-levels to count as a developed market. Emerging Markets are in a transitional phase with rapid GDP growth as well as in a process towards rule of law and towards institutional credibility, but still with economic and political instabilities and weak institutional infrastructure Statistical analyses The statistical analyses are conducted in IBM SPSS 22 and will be conducted as correlational analyses. Covariance and the correlation are the two key measures to discuss associations between two variables (Schuetz, 2011). Covariance is the degree to which variables vary together. Correlation (r 2 ) is a measure of how strongly two variables relate to each other. The most common way to check correlation between variables is Pearson s correlation, often referred to as Pearson s r which measure the linear relationship between the two variables (Field, 2013). The Pearson correlation is calculated as follows (Schuetz, 2011, p. 87): Bivariate correlation shows the variables independent relationships. Values range from -1 (perfect negative correlation) to +1 (perfect correlation), and 0 (no correlation between variables). Pearson s r will never be exactly 0 or 1 and there is no definitive answer on what is a strong correlation, but in social science ±0,2 is considered a weak correlation, ±0,3 to ±0,4 as a moderate correlation and over ±0,5 is considered as a strong correlation (Johannessen, Tufte, & Christoffersen, 2016). When two or more independent predictors are highly correlated with each other, it is known as multicollinearity. Multicollinearity indicates that two variables may be measuring the same ting, rather than being related. Problems with multicollinearity exists if Pearson s r are higher than 0,7. One solution may be to eliminate one of the variables, another solution is to combine them or to use the model only for prediction purposes (Hinton, McMurray, & Brownlow, 2014). Large intercorrelations between independent variables should be noted, since that correlation can substantially affect the results of the analysis. 42
51 In social science analyzes, the most common levels of significance are at 1 percent, 5 percent or 10 per cent. The level of significance determines when we will accept our hypotheses or when we will reject them. The analysis in chapter 6 has a significance level of 5 percent, meaning that we can with 95 percent security prove a relation between the variables included in the analysis. With such a low number of countries analyzed, it can be accepted with a high level of significance. At 10 percent significance level, it could be possible to discuss and see trends, but we cannot reject hypotheses based on this level Variables Dependent variable Economic growth GDP at Purchase Power Parities (PPP) or Market Exchange Rates (MER)? In economic terms, development has been measured as the capacity of a national economy to generate and sustain an annual increase in its Gross Domestic Product (GDP). GDP is the sum of gross value added by all resident producers in the economy plus any product taxes and minus any subsidies not included in the value of the products. It is calculated without making deductions for depreciation of fabricated assets or for depletion and degradation of natural resources. Data are in current U.S. dollars. (The World Bank, 2016a). The economic wellbeing of a country s population, is normally measured in GDP per capita. To take into account a country s ability to expand its output at a faster rate than the growth of its population, economic growth is commonly measured as the increase of its value of inflation - adjusted (real) gross domestic product (GDP) per capita (Todaro & Smith, 2009). When undertaking a multi-country analysis in different currencies, either Purchasing Power Parities (PPP) or Market Exchange Rates (MER) could be used in the analytical framework. Market Exchange Rates balance the demand and supply for international currencies, while Purchasing Power Parity (PPP) exchange rates capture the differences between the cost of a given bundle of goods and services in different countries. According to PWC (2015), GDP at Market Exchange Rates is considered a better measure of the relative size of the economies from a business perspective. MERs is also a more precise measurement, since PPP is a relatively sensitive measure which depends on the required quality on data of the relative cost of local goods, services and inflation rates. Research also indicates that the use of MER or PPP data itself, does not lead to different results or conclusions (PWC, 2015). 43
52 Average Real Growth GDP per capita pro anno %. Definition: Annual percentage growth rate of GDP per capita based on constant local currency. Aggregates are based on constant 2010 U.S. dollars. GDP per capita is gross domestic product divided by midyear population(the World Bank, 2016b). Independent variables The independent variables draw primarily on the World Bank s World Development Indicators database and consists of 23 different variables that has been found to have a significant and relatively robust effect on economic growth in various cross-country growth regressions. Their main reference is Robert Barro s influential research (Barro, 1996). All these variables are also available for most countries and updated on a regular basis. Most of the data are collected from the World Banks data of World Development Indicators (The World Bank, 2016b) and Worldwide Governance Indicators (The World Bank Development Research Group, 2015). Additionally, data on education are collected from Barro and Lee (2013). I will study these relations in a cross-country statistical analysis for the period between This period is chosen because the underlying theory relates to long-term growth and checking for relationships at the annual frequency would be dominated by large variations and measurement error. Terms like trade and inflation, vary over time within countries. Also, some of the variations, like fertility, life expectancy and education are not measured in many countries at shorter periods than 5 or 10 years. This suggests a focus on the determination of growth rates over long intervals. Some instruments are earlier values of the repressors due to the relation between growth rates and prior values to the explanatory variables. Emerging economies have stronger potential growth than today s developed economies on most of these measures, however not all countries may be able to sustain this in the long-run. See appendix for chosen variables. 5.7 Institutional analysis In addition to the data analysis I have also included a comparative case study of China, India and Brazil and their institutions. A case study is a comprehensive and detailed study that focus on one or very few units and are characterized by limited opportunities for (statistical) generalization. In a case study there should not only be presented descriptions; theory application is also very important to carry out a good case study (Jacobsen, 2005). 44
53 5.8 Strengths and weaknesses of chosen methods - Validity and reliability When conducting research, it is important to consider validity and reliability of the findings. Good measures should be both consistent and accurate (Zikmund et al., 2013, p. 303). Validity is synonymous with accuracy or correctness and is the extent to which a measurement is capable of measuring what is intended to measure. Our aim is that differences in scores truly reflect differences among the countries on the characteristics that we seek to measure, instead that they are the result of constant or random errors (Jacobsen, 2005; Saunders, 2011). The literature describes different types of validity: Internal validity is only present if the independent variable is responsible for the observed variance in the dependent variable. External validity is a measure of the extent which we can generalize the findings to apply for the rest of the population (Jacobsen, 2005; Saunders, 2011). Reliability is concerned with consistent findings and the degree that similar results could be found in other studies with independent, but comparable measures of the same object. The reliability increases if similar studies could be conducted and still give the same results. The results should be possible for others to try and verify (Saunders, 2011). Given that I have based my research on publicly available data and economic growth theory, I suggest that my findings are quite reliable. However, given the small sample of countries, and since I only have analyzed data from fast-growing developing countries during the last 25 years, it will be difficult to generalize the findings to other developing countries outside of the sample in the quantitative findings. Other results could have been produced, if I had included countries without significant economic growth during the last 25 years. Many of the independent variables could influence economic growth, even if it they not were statistically significant in this study on which factors that influenced which countries that experienced most economic growth during the last 25 years. Based on my empirical evidence I can only conclude on which factors that have correlated with the economic growth in these countries and why some of them have grown faster than the other countries in the same sample. A significant effect in this sample shows the factors that separates the fastest growing Emerging Markets from the rest. On the quantitative part, given the small sample, the results could be very sensible. Generalization could also be a problem and the results will most likely only be valid for fast-growing economies like the countries in the sample. The data we have collected only covers 25 emerging markets. If we had included countries with zero or negative economic growth, other variables could have shown statistical significance. 45
54 Since economic growth is most likely not only affected by one simple factor, but by multiple factors that interact, it makes the identification of causal relations between variables more difficult to prove. If one variable changes before a growth spurt, it could be one of the causes for the following growth spurt, but if the change happens during or after the growth spurt, it could have been the variable itself that have been affected by the growth spurt. Strong economic growth could for example affect the fertility rates, but also the other way around. Stronger institutions could also be affected by the income-levels since countries with higher income could afford building better and more stable institutions than low-income countries. When searching for information you must be critical concerning the sources used. Most of my qualitative data is based on highly recognized academic sources, and highlights likely reasons for differences in economic growth between Brazil, China and India. The quality of the conclusions in the comparative analysis is dependent on the quality of the analysis of the individual countries. If these analyses are not valid, the similarities and differences that create the foundation for the conclusions will be flawed as well. The analysis is based on qualitative data from a wide range of sources including books, economic journals and documents from independent NGOs. The qualitative data are also supported by statistics. You could however not exclude the possibility, that parts of the analysis could be influenced by biased opinions. 46
55 Chapter 6 Data analyses, results and discussion of findings Research question: Which factors are essential for improving a countries growth environment and for establishing long-term economic growth? 6.1 Descriptive statistics Table 6.1: Mean scores and standard deviations for all variables From the table, we can see that the country with the strongest institutions, South Africa, is the country with the weakest economic growth. While the country with the weakest institutions, Iraq, has experienced considerable economic growth (6% on a yearly average). The country with the strongest economic growth for the past 25 years, China, scores lowest on political rights for their citizens in terms of voice and accountability. 47
56 6.2 Correlation analysis - Pearson correlation: Collinearity If two or more predictor variables in the multiple regression are highly correlated, it will be difficult to separate out what each variable explains (Saunders, 2011). To investigate whether there are problems with multicollinearity, a correlation analysis between the variables is performed. The Pearson correlation coefficient (r) works as a measure of how much the scores of the two variables vary together and then contrasts this with how much they vary on their own. The joint variability is referred to as the sums of products and will be the largest when high values of one variable are matched with high values of the second variable. It will be a negative value when the correlation is negative. If the joint variability matches the individual variation in the scores, then these values will be equal, so one divided by the other will result in r = 1 (or -1 if the sums of products is negative). If there is no joint variability the scores do not correlate at all and r will be zero. This is based on the assumption that the relationship between the variables is linear (Field, 2013). The table on the next page is a correlation matrix of all the variables. Each pair of variables is correlated and the results placed in the table, presents details of the Pearson correlation r value, probability value and number of units in the sample. Problems with multicollinearity exists if Pearson s r is higher than 0,7 (Johannessen et al., 2016). Multicollinearity does not reduce the predictive power or the reliability of the model, but may not give valid result for the independent variables. If some of the variables with multicollinearity turns out the be statistically significant for the dependent variable, some of them should be removed or added together with the other variables in case of a later multiple regression. The analysis shows that some of the variables on institutional quality are highly correlated with each other; Government effectiveness is highly correlated with Regulatory Quality, Rule of Law and Control of Corruption. Regulatory Quality is highly correlated with Rule of Law and Control of Corruption. Rule of Law is highly correlated with Control of Corruption. Other findings include that the 1989 Fertility Rates is highly negatively correlated with the 1989 Life Expectancy and the 1990 population The change in fertility rates are highly negatively correlated with the change in population Years of male schooling are highly negatively correlated with Government Consumption Ratio and the change in the working-age population. The results also indicate that the average inflation rate is highly negatively correlated with the 1989 Fertility Rates, a relationship one can suggest as spurious and reject due to their unlikely relationship. 48


57 Table: 6.2 Pearson correlations 49

58 6.2.2 Correlation with the dependent variable From the table, we can also get an idea of which variables that show a significant correlation with the dependent variable. We can see that in this sample the 1990 levels of per capita GDP is strongly negatively correlated (p < 0.01) with the average economic growth, and that the investment ratio to GDP is strongly positively correlated (p < 0.01) with the average economic growth. We can also see significant negative correlations between Voice and Accountability AVG and the GINI-coefficient (p < 0.05) and the dependent variable. GDP per capita (1990). Figure 6.1: Scatterplot which shows the relation between GDP per capita 1990 (current USD) and average GDP growth The Pearson s r for the correlation between the 1990-levels of GDP per capita and economic growth is -0,527, which means there is a strong negative relation between this variable and the dependent variable. However, we cannot make any other conclusions about this relationship based on this number. Since Pearson s r is negative this means if the independent variable increases in value, the dependent variable decreases in value. Since p < 0.01 it is considered 50

59 strongly statistically significant and shows that a lower starting point in 1990 on GDP per capita is associated with higher economic growth for the last 25 years. Voice and Accountability Figure 6.2: Scatterplot which shows the relation between average voice and accountability and average GDP growth Given that the Pearson s r for the correlation between voice and accountability and economic growth is -0,419, this means if the independent variable increases in value, the dependent variable decreases in value. Since p < 0.05 it is considered statistically significant, the findings indicate that the independent and dependent variable are related to each other. However, we cannot make any other conclusions about this relationship based on this number. 51

60 GINI-coeffcient Figure 6.3: Scatterplot which shows the relation between average GINI-coefficient and average GDP growth Given that the Pearson s r for the correlation between the GINI-coefficient and the economic growth is -0,502, which indicates there is a strong negative correlation between this variable and the dependent variable. Since Pearson s r is negative this means if the independent variable increases in value, the dependent variable decreases in value. Since p < 0.05 it is considered statistically significant, the independent and dependent variable are related to each other. These findings indicate that countries with higher equality (lower GINI-coefficient) have experienced more economic growth during the last 25 years than countries with higher inequality in this sample. 52

61 Investement Ratio to GDP Figure 6.4: Scatterplot which shows the relation between average investment ratio to GDP and the average GDP growth Given that the Pearson s r for the correlation between the investment ratio to GDP and the economic growth and is 0,544. This indicates there is a strong positive correlation between this variable and the dependent variable. Since Pearson s r is positive, this means that if the independent variable increases in value, the dependent variable also increases in value. Since p < 0.01 it is considered strongly statistically significant, the independent and dependent variable are strongly related to each other and shows that countries with higher investment ratio has experienced more economic growth during the last 25 years. Among the countries with the highest investment ratio s in the last 25 years we find China and Iran with over 35% of GDP, while in the other end with the lowest investment ratio s we find Nigeria, Brazil, Pakistan South Africa and Egypt with under 20% of GDP. 53
62 6.3 Discussion of findings In this subchapter, I will compare my findings to both existing theory and previous research. Higher productivity is critical for achieving sustainable economic growth. However, it is not known exactly what causes productivity to increase and if it were, economic growth would be predictable, achievable and easy to attain (O'Neill, 2011, p. 36). As mentioned in the methodology-part, one cannot say exactly what is the cause of economic growth, but it can be made more likely by indicating relations between an independent variable and economic growth. Since economic growth is most likely not only affected by one simple factor, but by multiple factors interacting, it makes the identification of cause and effect relations between variables more difficult to prove. The data analysis in this thesis is not strong enough to conclude on a causal relation. We can however support earlier research which indicates a relation, but more research on that area is needed. The data analysis suggests a strong negative relation between the 1990-levels of GDP per capita and economic growth. This indicate that low starting levels is related to higher economic growth. The later a country enters the demographic transition and begins its modern economic growth, the shorter time they need to double the input per worker, this is supported by the successful development-story of South Korea (see 3.4 Are the living standards converging between developing and developed nations?) and feature of the neoclassical growth models and their convergence hypothesis, which says that the lower a country s starting level of GDP per capita, the higher predicted growth rate. However, earlier findings suggest a tendency of slower economic growth in poorer countries than in richer countries during the last 50 years (Todaro & Smith, 2009, pp ). Our results may have been affected by the small sample of developing economies. The results of the data analysis indicating that low Voice and Accountability is negatively associated with Economic growth, supports earlier findings that democracy has little or no effect on economic growth. China, Iran, Iraq and Vietnam are among the countries in the sample which score lowest on Voice and Accountability, while all except Iran are among the five fastest-growing in this sample. The results of the data analysis also suggest that countries with higher equality (lower GINI-coefficient) has experienced more economic growth during the last 25 years than countries with higher inequality in our sample is consistent with theory on inequality. The fact that BRICs have more billionaires than the rest of Europe combined 54
63 (Forbes, 2016), with less GDP and even less GDP per capita suggest an unhealthy inequality in these countries (The World Bank, 2016b). Much of the growth in the other Emerging Markets has also gone into the pockets of small groups of elites. Historically, rapid economic growth where the elites have benefited most, followed by slowdown or even recession, has led to problems like inflation and political and social unrest (Venezuela, Brazil). To avoid this, central banks need to be in control of inflation and support policies for a broader sharing of the wealth created (O'Neill, 2011). The positive relation between investment ratio to GDP and the economic growth finds support in Barro s model where high investment rates are associated with capital accumulation and growth (Barro, 1996). Many of the variables highlighted by Barro did not have significant effect in this sample. Due to the small sample of countries, I can only conclude on, based on empirical evidence, which factors that have correlated with the economic growth in these countries and why some of them have grown faster than the other countries in the same sample. A significant effect in this sample shows the factors that separates the fastest growing Emerging Markets from the rest. Many of the independent variables could influence economic growth, despite the lack of statistical significance in this study on factors that have influenced which countries that has experienced most economic growth during the last 25 years. 55
64 Chapter 7 China, India and Brazil Accelerating forces and hindrances of sustainable economic growth. Case study and discussion of findings Research question: What are the main institutions of China, India and Brazil and their main drivers and hindrances for achieving sustainable growth? In this chapter I will compare China, India and Brazil on important areas for sustainable economic growth. I will present the three countries on the areas of their economy and economic growth, openness to trade, institutions, demographics and the middle-income trap. In the analysis of their institutions, I will look at the three categories for institutions important for economic growth highlighted by Rodrik et al. (2004); Shirley (2005). The findings are presented separately for each country. Only findings that are viewed as relevant to the research question are presented, compared and discussed in this chapter. 7.1 China, India and Brazil - overview China, India and Brazil are the most interesting Emerging Markets due to their large potential, massive populations and size. What distinguish these countries from other Emerging Markets is their ability to influence the global economy, and also their ability to be influenced by the global economy (O Neill et al., 2005). According to projections by PWC (2015), China, India and Brazil will respectively constitute the largest, second largest and the fifth largest economies in the world in 2050 in terms of GDP. These three countries are already important actors in the global economy and home to about 3 billion people, 40% of the world s population. With these large populations, they will have a decisive impact and are critical for the growth in most of the other Emerging Markets and for the rest of the world. Despite being the three major Emerging Markets there are few similarities and shared characteristics between the three countries. China matters to the two others, but aside from that they do not matter so much to each other (O'Neill, 2011). Brazil is at the highest incomelevel of the three countries in terms of GDP per capita, but has been a middle-income country for decades. China and India, however have gone from being impoverished to experiencing major economic growth after institutional market reforms, just in the last decades. India and Brazil are multi-ethnic democracies, while China is a homogeneous one-party state. Brazil is also rich in natural resources, while India and China lack large reserves of that. 56
65 7.1.1 Avoiding the middle-income trap? The goal for all Emerging Markets should be to achieve growth after the economies mature and avoiding the middle-income trap. A goal for all Emerging Markets that want to evolve into high-income economies should be to follow in in the footsteps of the East Asian tigers; Hong Kong, Singapore, South Korea and Taiwan. O Neill et al. (2005) suggests that the key to converting potential into reality is to strengthen long-term conditions for growth; macroeconomic stability, political institutional development, trade and investment openness and education. They also introduce the Growth Environment Score (GES), a ranking system which aims to summarize the overall conditions for economic growth. A major goal for China, India and Brazil should be to undertake policies to raise their Growth Environment Scores to the levels of the East Asian Tigers. Based on O Neill et al. (2005) and O'Neill (2011) I will additionally compare China, India and Brazil with South Korea, Hong Kong and Singapore on the five areas suggested by O Neill to analyze their long-term conditions for growth. Because of lack of reliable data from The World Bank (2016b), Taiwan is excluded. See appendix for chosen variables and scores. 7.2 China Economy and economic growth From 1978 to 2015, China s economy grew at an average rate of approximately 9% per year (The World Bank, 2016b), an unprecedented achievement for any economy in history. Despite the fact that China is the world s most populous nation, their income per capita in 2015 was 51 times higher than it was in 1978 (The World Bank, 2016b). China is called the greatest success story of our generation and became the second largest economy in the world in Some analysts believe China will become the world s largest economy and surpass the United States in terms of GDP by 2030 (PWC, 2015; Ward, 2012). Despite increased income disparities, during the last decades, China has also experienced the most dramatic reduction in extreme poverty in world history. Per poverty data from the World Bank, the number of poor in China has fallen from 66,6% in 1990 to 1,9% in This means that over 700 million fewer people are living in extreme poverty in a span of just over two decades (The World DataBank, 2016). Despite that estimates both on current average income levels and poverty differs, there is no reason to doubt that China has experienced tremendous economic growth and poverty reduction during the last decades. 57
66 The boom in China was helped by exports and massive growth in investment, but this is unlikely to be repeated in upcoming decades (O'Neill, 2011). China s growth now needs to be led by consumption. Fast-growing domestic consumption is seen as a good predictor of stability and long-term, economic growth (O'Neill, 2011). According to O'Neill (2011), even conservative official Chinese data indicate a rise in personal consumption by $1.5 trillion from 2001 to China is also a major importer, which is the main reason for China s decrease in trade surplus experienced during the last decade (The World Bank, 2016b). The story of China s economic development is no longer just a low-cost labor driven growth; the Chinese people are rising the income ladder and associated increased spending Openness to trade According to data from the Central Intelligence Agency (2016), China is the world s largest exporter with in total 12.8 % of the world s exports. China however, are vulnerable on their exports for economic growth. They have taken advantage of their low-cost labor and attracting multinational companies to their country, and exported cheap consumer goods to the West, particularly the United States has given China the label as the world s factory (Wilson & Purushothaman, 2006). Their exports, together with investments and favorable demographics has been the key to their remarkable rise over the last decades. Back in 2006, their exports as percentage of GDP was 35.6%, At the same time China was exporting 12 percent of its total GDP to the United States (The World Bank, 2016b). This of course, was not sustainable, and China was badly hurt by the following downturn and credit crisis in the United States and the rest of the world. In the last 10 years, much has changed and China s trade surplus has declined sharply. In 2015 it was only 3.5 percent, down from around 9% in 2006 and exports accounted for only 22.4 % of its GDP (The World Bank, 2016b). China is the largest receiver of foreign direct investments among the major Emerging Markets (Bellak et al., 2013) and many large Western multinational companies have made major investments in China, among them Apple, General Motors, Motorola and Volkswagen (Hitt & Xu, 2015). The Chinese government has also encouraged Chinese companies to move into international markets and China has made large investments in other countries, much of these investments are in the energy and mineral sectors. More than 75% of these investment are in other Asian countries and the Chinese government must approve all major outward Foreign Direct Investments (Hitt & Xu, 2015) 58
67 7.2.2 Institutions For centuries China stood as a leading civilization with major innovations in arts and sciences, but by the 19 th and 20 th century, the country was beset by revolutions, famines, military defeats and foreign occupation. After the Chinese civil war, the People s Republic of China was proclaimed in 1949 as a communist autocratic system under leadership by chairman Mao Zedong. Under Mao s rule the government imposed strict controls over all aspects of life and his rule costed tens of millions of people their lives. After Mao s death in 1976, China began institutional market reforms in the late 1970s under the leadership of Deng Xiaoping. Institutions forming units of social behavior China is quite homogenous, with 92% of their population being Han Chinese. Their official language is standard Chinese or Mandarin, despite large varieties within the different Chinese languages/dialects. China is officially an atheist country, but their largest religious group is Buddhists (18.2%) (Central Intelligence Agency, 2016). China s state structure has been labeled as neo-traditionalism (Walder, 1986). China is organized as a one-party state with the Chinese Communist Party controlling decision at all levels, from society-wide to workplace. The Chinese society could be viewed as a totalitarian framework that stresses positive framework for compliance where public loyalty to the party and their ideology is mingled with personal loyalties between party officials and their clients. These arrangements can be described as dependence, deference and particularism. However, these arrangements are not modern and are a mix of the traditional Chinese Confucian model for patriarchy and its complex hierarchy of personal ties, overlaid with the communist model of the unified party-state as the focus of interpersonal connections and prescribed duties (Scott, 2002). As documented by (Hofstede, Hofstede, & Minkov, 1991) on cross-cultural differences, Chinese respondents expected and accepted more inequality in power than Western respondents. Chinese respondents also scored much higher on the collectivist dimension compared to the more individualistic Western respondents. These societal system, beliefs and assumptions about the role of the state, the rights of individuals and the nature of authority relations provide a divergent base for organizing a society compared to the Western society (Scott, 2002, p. 67). The Chinese civilization has survived for thousands of years while they are continuing to adapt to changes in the modern world and emphasizes the concept of harmony and foster credible commitment through institutional arrangements that promote social exchanges (Cao, 2015; Nee & Su, 1996). The Chinese civilizations definitional boundaries can also be extend to the extensive settlements of overseas Chinese (Scott, 2002). 59
68 Institutions that foster efficient economic exchange Formal rules are seldom effective without the backing of informal institutional constraints (Nee & Su, 1996). Transaction costs are lower in institutional settings where trust and cooperation flow from informal norms and established social relationships (Nee & Su, 1996). The market-based structures in China are still in development, requiring business actors to still use more traditional practices derived from Chinese culture, especially as a mean to doing business. A practice known as guanxi is central in Chinese society and can best be described as the relationship individuals cultivate with others. These alliances, built over time with partners, often by exchanging gifts and services with a norm of trust and reciprocity, are almost critical to gaining access to critical resources. In these cases, informal institutions serve as substitutes for formal institutions. Since the Chinese government still have control over most resources, a strong relationship with government leaders at local and national levels has been necessary for successful managers and entrepreneurs. Formulation of policies and interpreting and enforcing regulations and policies is more likely to be beneficial with access to relationships with the key persons in the government (Hitt & Xu, 2015). Furthermore, since the judicial system is not separated from the government, the government entities have a major influence on courts and the enforcement of court rulings. Rule of law in China remains in an early stage of development with inconsistent enforcement, still making informal institutions critical for doing business in China. According to (Batjargal et al., 2013) informal institutions at least partially serve as a substitute for weak or underdeveloped formal institutions in China. An advantage of weaker formal institutions for Chinese businesses is that there exist fewer formal constraints on business activities. They have more easily could have entered other Emerging Markets that also have weaker formal institutions. Mostly in other Asian countries, their ability to build strong personal relationships fits well with the local culture, and these relationships allows them to operate more effectively in these advantages compared to many Western firms. Due to strategic alliances with Western firms and increased Westernization combined with increased mobility and independence for Chinese people, the importance of guanxi has moderately declined because of increased availability of resources. However, firms with stronger political connections still enjoy greater security and political connections in local and regional are especially important in provinces with weaker legal and market institutions (Zhou, 2013). 60
69 Institutions that protect property and persons China consists of 22 provinces (considers Taiwan its 23 rd province), as well as 5 autonomous regions, 4 municipalities and 2 special administrative regions (Hong Kong and Macau). All the provinces are subservient to the central government but have considerable practical power and can be described as federalism with Chinese characteristics (Central Intelligence Agency, 2016). Institutional evolution has also become a major focus of the Chinese government to maintain the economic development. Institutional transitions in political and regulatory systems, legal frameworks, and market structures are intended to help Chinese (and foreign firms) to operate in a more supportive institutional environment (Hitt, Li, & Worthington, 2005). Market reforms were implemented in 1992 and in the late 2000s, Chinese firms began to be encouraged to make investments in foreign countries. To comply with the requirements of the World Trade Organization, new property laws were enacted in the late 1990s and the 2000s. Significantly important was the new laws and regulations for intellectual property protection which provide access to new technologies primarily developed in Western countries also enhances innovation and associated economic growth. Allowing Chinese firms to develop stronger competitive advantages for competing in the global markets. Additionally, changes related to rules of corporate governance, including more insight of the Chinese stock market and the companies participating were implemented (Chen, Newburry, & Park, 2009). The dramatic economic transformation that China has undergone since the early 1980s, has changed China from a centrally planned economy to a market-based economy through marketization, liberalization and privatization (Hitt & Xu, 2015). The role of political institutions in China has changed in the transition from a state socialist redistributive economy to a hybrid market economy (Nee & Su, 1996). In the early years of the reforms, the state controlled both movement of labor and capital. With China s development, they have witnessed the rise of the local corporatism, a loosely coupled coalition involving local government, financial institutions and both collective and state-owned firms. The rise of local corporatism has been accompanied a by a gradual, though partial privatization of collective and, to a lesser extent, state-owned enterprises. However, the Chinese state has opposed largescale formal privatization and still control factor resources. Guanxi-ties with the government agencies are still important securing key supplies, such as iron and steel, electricity and other commodities controlled by the government. The firms also have no autonomy to determine its employment policy. Local governments also provide coordination in helping entrepreneurs finding business partners and helping foreign investors and local firms setting up joint-venture 61
70 projects. Support of local governments are important for most businesses and business deals often cannot be consummated without the backing of local government, owing to pervasive uncertainties stemming from the institutional environment of only partial reform. (Nee & Su, 1996). The market reforms in China after 1978 has resulted in a shift from the central to local government and provided them with incentives to pursue market-oriented growth. Under the decentralized system, local government and firms assumed responsibility for their profits and losses. In the new system, the firms share its profits with local government per prearranged agreements. The profit sharing, the key institutional change that opened the way for informal privatization has endowed firms with greater fiscal autonomy and rights over the distribution of economic surplus. It encourages management to improve incentives for achieving productivity gains for the form. Because local governments depend on industry s profitability as their primary means of increased revenue, they have a strong incentive for achieving gains in relative economic performance of the firms. Under the conditions of competitive markets, they local government also face hard constraints on the extent to which they can expropriate surplus from the local industry (Nee & Su, 1996). Under profit-sharing arrangements, both local governments and firms have greater incentive to pursue productivity gains. Profit sharing provides local government with an interest in improving infrastructure, both in terms of roads, transportation, technology and human capital in terms of health and education. As well as maintaining a stable regulatory environment (Nee & Su, 1996) Demographics China s economic growth has also been partly attributed to its lower fertility rates. China has been the world s most populous country for centuries. But, in the 1980s China adopted a policy of one child per family to achieve their goal of a 1% birth rate during the decade. Economic incentives included priority of one-child families in housing, education and medical care while mothers of two children or more often were denied promotions as well as subject to punishment in terms of fines and lost right to certain privileges. Second births could often only be approved if the woman had remarried or if the first child had serious birth defects (Todaro & Smith, 2009). Due to these policies and a strong cultural reference for boys, China is already experiencing a problem with missing girls with a boy to girl ratio of 118 to 110 on newborns, which is probably a significant measure of the result of sex selection technologies. In 2020 expected that they could have as many as 30 million more men than women in marriageable age and could lead to social instability. However, the full impact of 62
71 China s population policy is still uncertain. Only time will tell if the benefits from reduced population growth will be worth the cost of harsh break with traditional family norms (Todaro & Smith, 2009). China s population policies have been viewed as playing a major role in improving the quality of life for women, having increased opportunities for education and can get better economic opportunities. Reduced fertility rates has also made it possible to invest more resources into the children s future. China s fertility rates of births per woman, has been reduced from 5,7 in 1970, to 3,2 in 1977, to 2,6 in 1988, to 1,5 in 2014, (The World Bank Development Research Group, 2015) which means that the fertility rate now is below replacement level. China s population growth rate has slowed dramatically and the population is not expected to exceed 1.5 billion before it starts to fall. Estimates suggests that upward to 250 million people fewer people have been born in China, due to the one-child policy (Todaro & Smith, 2009). The success of population control in China has led to some flaws as well. By 2050, China is expected to have twice as many above 50 than below 20 years. However, concerns of an ageing population and to high dependence ratio on the working adults have led to the existing law being changed to a two-child policy effective from January 1 st, 2016 (Phillips, 2015). Another key to China s extraordinary growth has been their population shift from rural to urban areas. Since the market reforms took place in the late 1970s, millions have moved from the countryside to the cities, contributing to and benefiting from China s transformation into a global manufacturer. But, having a large population is not enough, you also need the right people. A large working population is the key to increase productivity and achieving persistent stronger economic growth (O'Neill, 2011). China s working population, however, is ageing and they may soon have reached their peak, a similar challenge faced by Japan. The number of young people are falling drastically, in 2013, only 17.1 percent of China s population were under the age of fourteen, around half the number twenty years ago, while percent of their population were over 65, almost double the numbers twenty years ago (Central Intelligence Agency, 2016). However, continuous urbanization could help China that still has a big population reserve in the countryside with an urban population of 50.6% of the total population (Central Intelligence Agency, 2016). 63
72 7.2.4 Are they avoiding the middle-income trap? China ranks well on macroeconomic stability, with inflation rates almost as low as Korea and Hong Kong, but still much behind the levels of Singapore. As China develops, its government probably must allow its currency to fluctuate more and have inflation targeting. China has until now, kept its currency artificially stable by purchasing huge amounts of foreign currency (O'Neill, 2011). China scores well on macroeconomic conditions with higher investment rates than all the East Asian Tigers. A possible interpretation is that China is now building its infrastructure, while the East Asian Tigers already has been through this phase. However, there is reason to doubt some of the Chinese official data, and many believe they are overestimated (O'Neill, 2011). Also, investments should go to the right areas, or else they are worthless. Due to poorly developed financial markets makes, for the new class of affluent Chinese, property is the best of a limited set of investment choices (O'Neill, 2011). This has led to fear of an assets bubble like Japan s experiences in the early 1990s. To prevent a crash, the Chinese government has tried to set restrictions on borrowings and buyers to try to take some of the heat out of the market (O'Neill, 2011). China s rankings on technology adoption are mixed compared to the East Asian Tigers. Especially their internet usage is still quite low with only 50% of their population having used internet during the last 12 months. Cell phone usage is also well behind the developedeconomies level. China s high growth has been followed by dramatic reductions in poverty, and to secure a long-term progress they have made substantial efforts to at least providing minimal education and health care for all its citizens (Todaro & Smith, 2009). But, China still have very much room for improvement on their human capital variables. Only 3.6% of their population aged 25 and above have attained tertiary education. This especially low compared to Singapore (37,0%) and South Korea (39,8%). They are even well behind India (9,1%) and Brazil (11,3%), despite their China s advantage with more secondary education and its much lower levels of no education, which are almost at the levels of the East Asian Tigers. Their life expectancy however, are closing in on the levels of the Asian Tigers. China ranks well on political stability, but much improvement is needed on control of corruption and rule of law, especially if they are going to be on Singapore and Hong Kong s levels. 64
73 7.3 India Economy and economic growth India used to serve as a clear example of development strategies gone wrong (Rodrik & Subramanian, 2004) and has the lowest levels of GDP per capita among the three major Emerging Markets (around 1/5 the levels of China and Brazil) (The World Bank, 2016b). However, since the economic liberalization initiated in 1991 towards a free-market economy, India has enjoyed a steady average growth rate of around 7% for the last two decades (The World Bank, 2016b). India has a fast-growing service sector and the fact that many Indians speak English, put them in great position to benefit from the Internet and the boom in outsourcing services (O'Neill, 2011). In 2014, India became the world s fastest growing major economy, replacing China (The World Bank, 2016b) in addition to topping the World Bank s growth outlook for the first time in 2016 (2016). Long-term projections are positive for India due to young population, investment rates and increasing integration into the world economy (Central Intelligence Agency, 2016). India has the potential to surpass Japan and become the third largest economy in the world by 2050, based on Goldman Sachs Growth Environment Scores (GES), while according to the 2050 scenario presented by (PWC, 2015), India could even surpass the United States and become the second largest economy in the world in terms of GDP at PPP Openness to trade India is not as open to international trade as it should be and this has been a long-standing problem. Despite being the world s 7 th largest economy in terms of nominal GDP (The World Bank, 2016b) India is only the world s 21 st largest exporter, with 1,3 % of world s exports (Central Intelligence Agency, 2016). However, there has been much progress. The economic liberalization initiated in India in 1991 towards a free-market economy has helped India reintegrating into the world economy (O'Neill, 2011). India s trade to GDP-ratio has improved from 15 percent in 1990 to 48 percent in 2014 (The World Bank, 2016b). Moreover, one should recall that Indian exports are rising from a very low base. India can trade much more, and more important especially improve its trade with its neighbors, which counts the Emerging Markets of Pakistan, Bangladesh and China (O'Neill, 2011). Protectionism, especially on agriculture has pushed up prices for Indian customers, without offering much improvement back. If they are to continue their economic liberalization, India needs to further bring down barriers to imports and foreign direct investment. Strict rules and 65
74 bureaucracy for trade scare foreign investors off and short-term thinking where fear of losing Indian jobs to foreign competition hinders future long-term economic growth. Increasing foreign investment would undoubtedly enhance the efficiency and productivity of India s industries (O'Neill, 2011) Institutions While the British often invoked history to justify the choices they made, they frequently misread history (A. Banerjee & Iyer, 2005, p. 1195) The origins of India can be traced back to the Indus Valley civilization, one of the world s oldest civilization during the 3 rd and 2 nd millennia B.C. and extended into northwestern India. The classical Indian culture were created when Aryan tribes infiltrated the Indian subcontinent and merged with the earlier Dravidian inhabitants about 1500 BC. India later experienced the spread of Islam and invasions from Turko-Mongols, Afghans and Persians. The Muslim Mughal Dynasty ruled India for more than the three centuries until Great Britain became the dominant political power on the Indian subcontinent (Central Intelligence Agency, 2016; Ludden, 2013). The driving force behind the expansion of the British empire from the seventeenth to the early nineteenth centuries were profit and India was the place where the big money was made. The ruthless pursuit for profits transformed the East India Company from a commercial enterprise into a political and military power that controlled the areas of the Indian sub-continent. By the 1750s the Company had begun to conquer territory and establish a network of alliances with local rulers either by cooperation or by force, and by 1849, Britain had total mastery of the sub-continent. The British ruled India until 1947, when the Indian Empire was portioned into India and Pakistan making what were former Indian territory into to the modern states of Pakistan and Bangladesh (A. Banerjee & Iyer, 2005). In an analysis on the colonial land revenue institutions set up by the British in India (A. Banerjee & Iyer, 2005), has suggested that differences in historical property rights institutions has affected the current differences in economic outcomes in India s current Federal states. Britain s main source of revenue in India was land revenue or land tax. The different British administrators could conclude very differently on what land revenue system were used. All cultivable land in British India were taxed under one of three alternative systems: 1) a landlord-based system, known as zamindari or malguzari, 2) an individual cultivator based system (raiyatwari), or 3) a village-based system (mahalwari). (A. Banerjee & Iyer, 2005) 66
75 found that areas in which proprietary rights in land were historically given to landlords had significantly lower agricultural investments and productivity in the post-independence period than areas in which these rights were given to the cultivators. These areas also had significantly lower investments in health and education. These differences are not driven by omitted variables or endogeneity problems; they probably arise because differences in historical institutions leading to very different policy choices (A. Banerjee & Iyer, 2005, p. 1190). Despite the fact that the Indian government has been committed to equalizing access to social goods, (Abhijit Banerjee, Iyer, & Somanathan, 2005) found enormous variation in access to public goods within India and much lower levels of public expenditures in areas with a higher proportion of landlord districts. This gap in public investment can be explained by lesser health, education and technology investment. Within the state of Andhra Pradesh, less than 7% of the villages had middle schools, while 55% un Guntur had one, similar variations were also found on access to medical care and infant mortality which were 40 percent lower in non-landlord districts (A. Banerjee & Iyer, 2005). Institutions forming units of social behavior It is suggested that homogeneous societies have an advantage because there is more likely with contact across the population, building understanding, trust and shared interests (Abhijit Banerjee et al., 2005). India has a great linguistic, cultural, religious and ethnic diversity and is home to more than two thousand different ethnic groups (Central Intelligence Agency, 2016). The national Census of India does not recognize racial or ethnic groups within India, but it is common to categorize the ethnic groups into two large linguistic groups, Indo-Aryan (72%) and Dravidian (25%). The Indian society has traditionally been divided into castes, but these categories has no official status since the independence in Despite that the caste system was abolished at their independence in 1947, this system of social stratification is still being practiced with widely discrimination against lower castes and is a powerful social institution that control parts of the Indian social order (Pruthi, 2004). The largest religious groups are Hindus (80.5%) and Muslims (13.4%), but there are also considerable groups of Christians (2.3%) and Sikhs (1.9%). Hindi is the most widely spoken language and first language to 41% of the people, but there are also 14 other official languages. English enjoys the status as the most important language for national, political and commercial communication.(central Intelligence Agency, 2016). The British rule in India were built on the principle of division and solidarity among Indians were discouraged (Abhijit Banerjee et al., 2005). The British ruled India with the help of local 67
76 rulers who accepted the British sovereignty in around 560 big and small native states. The rulers in these native states were clearly interested in keeping the traditional structures of authority which gave greater power to the existing social elites, including the caste system. The British rule led to a concentration of power in the metropolitan areas and contributed to the creation of a new English-educated Indian elite in these areas, cut off from the rural areas where most Indians lived. (Abhijit Banerjee et al., 2005) suggests that caste and religious division created conflict that are still an important part of the Indian political landscape. India today is a democratic federal union divided into 29 states and 7 union territories (Central Intelligence Agency, 2016). India is a representative democracy, but democracies could be undermined by a lack of trust in the culture where mistrust hinders the citizens from cooperating in monitoring the government. Indian society has been called heterogeneous and conflict-ridden (Shirley, 2005, p. 628) and has been highlighted as a fully democratic country where the citizens have not been able to overcome collective action problems to getting a more well-functioning government (Shirley, 2005). India s regions, unlike China are very autonomous and its central government cannot dictate policy. India are also, unlike China, a democratic country with clashing voices and opinions. India also has the caste system, competing faiths and a complicated colonial heritage and has been highlighted as a fully democratic country where the citizens have not been able to overcome collective action problems to getting a more well-functioning government (O'Neill, 2011; Shirley, 2005). Moreover, it cannot be said that China s political system is superior to India s democracy, but simply an observation of the differences in implementing economic policies in the two countries. Institutions that foster efficient economic exchange Until 1990, there were strict regulations that discouraged Indian firms from internationalizing. Prior to 1991, it was common in the private sector with governmental intervention, control and supervision. Foreign firms also faced high barriers for entry by being required to go through a number of procedures before even beginning operations in India (Mohan & Aggarwal, 1990). However, the economic landscape in India were changed through various legal and regulatory reforms starting in 1991, where several sectors were opened and the range of foreign activities which Indian firms could be involved in were widened (Stucchi, Pedersen, & Kumar, 2015). These institutional changes together with greater access for Indian firms to financial markets has supported India s rapid economic growth (Nayyar, 2008). 68
77 However, India is well behind China s on Macroeconomic conditions in terms of investment rates. Still, many international companies find investing in India difficult compared to for example China. They experience resistance from Indian policymakers and difficulties with the sheer number of people it takes to get beyond the system (O'Neill, 2011). For many Indian politicians, foreign investment could be viewed as attempt of foreign exploitation. Furthermore, it is very difficult to get access to India s financial system. Indian households debt to GDP was 10.3 % in 2016, compared to 33.6% in South Africa, 40.7 % in China, 46% in Brazil and 78.4% in the United States and 87.4 % in the United Kingdom (Trading Economics, 2016). This is a clear sign that the Indian economy is functioning mostly on cash and most Indians lacks access to a Western banking system. India s credit market is in their infancy and they need to develop its financial infrastructure for future economic growth. India is also the major Emerging Market with least foreign direct investment (The World Bank, 2016b). Big deals can get done in India, but it takes time. The government makes it difficult even if they, in theory allow it. With a friendlier environment for foreign investment, this rate would grow sharply (O'Neill, 2011). Institutions that protect property and persons After two decades of economic liberalization and democratic decentralization, political and bureaucratically corruption has not disappeared in India. (Ostrom, Schroeder, & Wynne, 1993) has suggested that decentralization could promote cost-effectiveness, improved accountability and reduced corruption and making local politicians and elected councilors more effective and being more accountable to the local community than distant civil servants and auditors. Moreover, empirical studies from India has suggested that resistance within the bureaucracy can hinder and distort effective democratic decentralization (Jayalakshmi, 2000) and that effective decentralization also depends on the strength of the local communities affected (Alsop, Krishna, & Sjoblom, 2001). (Véron, Williams, Corbridge, & Srivastava, 2006) also found that political support in the form of a strong pro-poor government in power at the center, is crucial for reducing risk of capture from elites of decentralized state institutions. The findings of (Véron et al., 2006) on democratic decentralization in Eastern India found extensive use of public office for private gain. The programs of decentralization of government programs were followed by decentralization of corruption and made local councilors virtually unaccountable to the community, political parties or the development administration. Even if politicians and elected officials were up for re-election, they compensated for political uncertainty by building up a capital stake through corruption. Other 69
78 critical studies on Indian institutions revealed fundamental weaknesses of many local community institutions divided along the line of class, gender and ethnicity and that in many cases that rent-seeking increased under the economic liberalization (Dirks, 2011) Demographics Everything is growing faster in China than India, except for the population (Todaro & Smith, 2009, p. 310) India s population reached 1 billion in year 2000, a tripling of their population at their independence as a nation in India is also projected to surpass China as the world s most populous country, and is by 2050 expected to surpass China s population by 200 million people. Even though half a century ago, India had well under two-thirds of China s population (Todaro & Smith, 2009) India implemented a national family-planning program in 1949, as the first country in the world. Despite this, family planning in India very relatively ineffective and by the 1970s, India s extremely high population growth was considered out of control. However, after India during the last decades has experienced rising income levels both for the middle class and improved conditions among their significant fraction of poor, fertility rates have fallen. India s fertility rates have fallen from 5,03 births per woman in 1977, to 4,04 in 1990, down to 2,4 in 2014 (The World Bank, 2016b). Life expectancy at birth has in the same period risen from 52,3 years in 1977 to 68,0 years in With falling fertility rates and the development of a preference for boys over girls, India has, experienced a missing women problem parallel to China s. In the more affluent states of India, per data from National Family Health Survey, the sex ratio at birth is almost 130 boys per 100 girls. Such a dramatic imbalance could likely be a cause of future social stress. Furthermore, it is worth noting that in district with higher poverty levels the female disadvantage in child survival is significantly lower (Todaro & Smith, 2009). The economic growth rates experienced in India since the 1980s has partly been attributed to its moderate decline in fertility (Todaro & Smith, 2009). Lower fertility rates in India, has been followed by increased female literacy and given greater opportunities for women to complete higher education. Improvement of the human capital in the population has in turn led to improved economic conditions. Falling or delayed fertility rates are essential for India s future development and continued economic success (Todaro & Smith, 2009). 70
79 India s demographics are viewed as the most favorable in the world, 46.6% of their population is 24 years and younger, while only 5.8% of their population is 65 years and older (Central Intelligence Agency, 2016). India s population was 1.25 billion in 2013 (The World Bank, 2016b), and it could reach 1.7 billion by 2050 (O'Neill, 2011), 10 to 20 percent more than China and with a much larger group of young people. India could end up with a labor force almost as large as China and the United States combined Are they avoiding the middle-income trap? India scores relatively well on macroeconomic stability in terms of inflation compared to other developing countries but still have around twice the average inflation rates of Hong Kong and Korea and almost four times compared to Singapore. India needs inflation targeting to achieve more inflation stability. India has very poor growth scores on technological capabilities, with only 26% of their population having used internet for the last 12 months and much lower scores on cell phone usage than the other major Emerging Markets and the East Asian Tigers. As mentioned in India lags on their investment ratio. India also has poor growth scores on human capital and especially on education. At the top end of its educational system, India produces large numbers of well trained, English-speaking technical graduates, who have driven the success of its service industries who also are highly computer-literate (O'Neill, 2011, p. 74). However, hundreds of millions of Indians remains uneducated with little or no formal education and limited access to technology. As one can see from the table, 42,3% of India s population over 25 has no schooling at all (Barro & Lee, 2013). There is also a wide gender disparity, with women being behind both on education and literacy where about only half of the female population can read and write. However, there has been a 11,8% growth in female literacy rates between , which means the gender gap appears to be narrowing (UNICEF, 2015). Compared to the East Asian Tigers (and China and Brazil on all levels except tertiary education), India struggles at all levels of education, from primary through tertiary. However, the Indian government has promised to make large investments at every level of education, they are forced to do so simply to meet domestic demand for an educated workforce. India needs investment in education and technology to evolve (O'Neill, 2011). India s life expectancy is 68 years and the lowest among the largest Emerging Markets, over 14 years behind all the East Asian Tigers. Improvements are needed on their health conditions to close in the gap to the other countries. India s institutions score very low on political stability and absence of violence, also compared to Brazil and China. They score relatively better on rule of law compared to the 71
80 two-other major Emerging Markets, but still have much improvement to achieve compared to the East Asian Tigers, especially Hong Kong and China. India also scores low on corruption and have much room for improvement on that area as well (The World Bank Development Research Group, 2015). 7.4 Brazil Economy and economic growth Because of its rich resource base, Brazil s economy grew at around 6 percent each year for decades (Kharas & Kohli, 2011). By 1965, Brazil was one of the wealthiest developing countries in the world and continued to grow until 1978 when it reached 5,500 per capita. Then Brazil entered a stage of stagnation and decline and did not regain its 1978-levels until a brief period in First in 2006 Brazil once again surpassed its 1978 levels and did in other words spend nearly 30 years without economic growth (Kharas & Kohli, 2011). According to statistics from the International Monetary Fund (IMF), Brazil had in 2015 the largest economy in Latin America as well as the ninth largest economy in the world (down from seventh place in 2014). From 2000 up to 2012, Brazil was one of the fastest-growing major economies in the world, with an average annual GDP growth rate of over 5%, with its economy in 2012 temporarily surpassing that of the United Kingdom. The economic growth has however decelerated and Brazil had almost no liquid growth in 2013 and 2014, while the economy shrunk by -3.8 % in According to the IMF, their GDP is expected to shrink by additional -3.5% in 2016 with outlook to no additional growth in Brazil was previously a large importer of oil and imports accounted for more than 70% of the country s oil needs, but after gigantic oil and gas-findings outside their coast, Brazil became self-sufficient in Brazil is now the world s largest offshore market, larger than the Gulf of Mexico and Norway combined, and is estimated to have the 15 th largest oil and gas reserves in the world as of 2014 (2014). Petroleum and oil consisted in total 10 % of Brazil s total exports in 2012 (2013). Brazil has however, as well as the other oil exporting countries, Venezuela and Russia been among the economies in the world with largest negative economic growth since the decline in oil prices in 2014 (International Monetary Fund, 2015c) Openness to trade In contrast to the export-led strategies of the East Asian Tigers, the Brazilian government encouraged domestic firms to serve the local markets through import-substitution policies. 72
81 Due to centuries of colonial history when raw materials served foreign interests, exporting was associated with backwardness. The consequence of this was that the Brazilian government focused on protecting their domestic industry instead of encouraging them to compete in the global market (Moreira, 1995 cited in Mudambi 2015). This is clearly shown by the fact that trade only counts for 25% of Brazil s GDP, while the corresponding number of another major Emerging Market, China is 45% (The World Bank, 2016b). However, it would be meaningless to compare them in to the East Asian Tigers in terms of share as a percentage of GDP, due to the major differences in size of domestic markets. But, there exists a stark difference between the Brazil and the governments of the East Asian Tigers in terms of systematic planning. While for example South Korea maintained a consistent and pro-active policy over five decades where the goal always has been to increase its international competitiveness through technological efforts, the Brazilian government has not implemented any systematic industrial policy. Brazil s policy has mainly been driven by external shocks, and its policy has been emergent and reactive instead of a result of systematic planning (Mudambi, 2015). In contrast to the East Asian mindset to become global, Brazilian companies have generated a comfortable performance solely based on their domestic market and their large domestic market may also have given them a sense of security. A consequence of this is that we observe few global corporate champions in the Brazilian economy (Mudambi, 2015). The policies of the Brazilian government have been aimed at importsubstitution rather than promotion of exports and it also lacked consistency and continuity because it varied from government to government. Brazil s so-called Target Plans have neither been specified in detail nor been accompanied by any significant institutional changes. The actual intervention to support the development of heavy industries in Brazil, with public goods like transportation, energy and education has been very limited (Moreira, 1995 cited in Mudambi 2015) Institutions The Brazilian institutions and its lack of quality has deep roots in the colonization process. Between 1500 and 1822, Brazil was a colony of Portugal and the Portuguese rule was characterized by systematic exploitation of Brazil as a source of economic rent. The quality of the institutions in Brazil is found to vary by the different regions and these differences can be traced back to the colonial days under the Portuguese state when the institutions were built upon either sugar-cane plantations or gold mining (Naritomi, Soares, & Assuncão, 2007; 73
82 Simonsen, 1937 (1977 English version)). These are regarded as the most important extractive activities developed by Portugal and marked the initial occupation of important areas of the country. The sugar production took place mainly along the Northeastern coast (Simonsen, 1937 (1977 English version)). Until the 17 th century, Brazil was the main world producer of sugar and economy of sugar was based on the plantation system which contained three important elements: Latifundo (a large estate of land with a single owner), the monoculture and slave based labor. Sugar production brought the patriarchal and slavery-based society to Brazil (Higman, 2000). The extractive occupation of this part of Brazil had all the elements comprising poor institutional foundations: extreme social inequality, very small economic and political elites with concentrated powers, and establishment of legal and tax systems shaped almost exclusively around extractive goals. (Naritomi et al., 2007). Municipalities with origins back to the gold mining expansion is located in the central part of Brazil (Fausto, 2006). The Portuguese crown tried to keep as much control and scrutiny as possible. This led to an environment of a constant race between individuals and state where the miners tried to avoid the hand of the Portuguese crown, while the state created increasingly oppressive devices to regulate and control production even further. The natural development was the creation of very heavy and ineffective institutions and an extremely hostile environment and a constant struggle between the state and the civil society (Fausto, 2006). The characteristics of ineffective functioning of the government and a culture of detachment between population and state has possibly spread to other regions of Brazil as well (Naritomi et al., 2007). The findings reported by (Naritomi et al., 2007) suggested that that the institutions built during the gold-cycle are characterized by even worse governance practices and less access to justice than institutions built during the sugar-cycle days. The quality of the institutions were measured on four dimensions: distribution of economic power through distribution of endowments, persistence of political power, quality of local government practices and access to the legal system (Naritomi et al., 2007) Institutions forming units of social behavior Brazilians is not a homogeneous group. 48 % of the country s population is white and descend from European immigrants. Pardos (multiracial) comprise 43% of the total population and are a mixture of Europeans, Blacks and Amerindians. 7.5 % of the population is black, and are mainly descended from African slaves that were imported from the late 74
83 1500s to the 1860s when Brazil were consistently the largest destination for African slaves on the American continent. Brazil also has smaller groups of Asian (1%) and Amerindians (0.5%) (Telles, 2014a). The Brazilian society is largely hierarchical and the economic growth in Brazil has not been followed by poverty-reduction at the same scale as witnessed in China (Todaro & Smith, 2009). Despite having a large middle-class, poverty and income inequality levels remain high (Central Intelligence Agency, 2016). Brazil has one of the highest Gini coefficients in the world, 52.9, compared to Norway which has a score of 25.9 (The World Bank, 2016b). The social differences in the country, mostly follows the ethnic groups and non-whites are almost absent in the Brazilian middle class and above (Telles, 2014b). The differences between the socio-economic groups are also shown in education where whites are seven times more likely to complete college, than non-whites (Do Nascimento & Nascimento, 2001). Extremely high economic inequality and social division is viewed as a threat for further progress in Brazil (Todaro & Smith, 2009). Institutions that foster efficient economic exchange Brazil is a market economy, but with a complex formal law and inconsistent legal and regulatory framework (Stone, Levy, & Paredes, 1996). With a number of inconsistent laws regulating otherwise simple business transactions, (Williamson, 1990) describe jeito (the fix) as a way around formal law for achieving simplicity. This can be achieved by private citizens with bribes or other services to a properly motivated government official. The despachante describes a more professional form, which enabled businesses to proceed somewhat logically in an formal environment hostile to efficiency (Stone et al., 1996, p. 101). Even if this institutions are more costly than a more rational formal legal system, (Karst & Rosenn, 1975) suggests that this gives Brazilian businesses stability and predictability. (Harriss, Hunter, & Lewis, 2003) argue that since the non-whites in Brazil mostly has been excluded from higher education and economic opportunities, there has developed a culture among its citizens that undermine the basis for effective cooperation and the general willingness to honor contracts and refrain from corrupt or criminal behavior. Colonialism created racist discrimination and exclusion which has been inherited by those in power (Harriss et al., 2003). 75
84 Institutions that protect property and persons Even if all Brazilian business operate under a handicap of an inefficient system their institutional failures have created fixed entry and other costs that offer advantages to size and reputation. (Stone et al., 1996) suggests a trust between legal institutions and profitable public and private insiders, while limiting the entry and growth of outsiders who lack access to such privileged relationships (Stone et al., 1996, p. 102). A system where influence and contacts with bureaucrats are almost vital to economic success indicates a need for legal and regulatory reform to promote economic development. (Stone et al., 1996) also found the differences between formal law and how it is practiced in Brazil created an inferior environment for business in Brazil when comparing to Chile. They also found that the federal government economic policy imposed a great insecurity on property rights and that defects directly tied to the formal legal system emerged as binding constraints on business. Corruption is a major problem in the Brazilian society. The Brazilians lack trust in its government and per Transparency Internationals global corruption barometer, the Brazilian people views most of its institutions as corrupt (2016). The institutions that are perceived to be most affected by corruption are its political parties which 81% of the population view as corrupt/extremely corrupt as well as their parliament and legislature (72%) followed by the police (70%) (2013) Demographics Brazil has experienced rapid fertility decline since the 1960s and is now below replacementlevel (The World Bank, 2016b). Currently 22,79% of their population is under 15 years while 8,06% of their population is 65 years and over. Brazil, however has not taken full advantage of its large working-age population to develop its human capital and strengthen its social and economic institutions and is now facing an aging population. The current favorable age structure is estimated to begin to shift around 2025 and fast-paced demographic transition will begin with a shrinking labor force and the elderly starting to compose an increasing share of the total population (Central Intelligence Agency, 2016) Are they avoiding the middle-income trap? Brazil is a country of the future and always will be - Brazilian joke (quoted by Todaro & Smith, 2009, p. 28) 76
85 In terms of Macroeconomic stability, inflation is a major problem for Brazil and they have experienced decades of hyper-inflation. But in 1999, a formal target for inflation was introduced under President Fernando Henrique Cardoso (O'Neill, 2011). Since then then Brazils inflation has stabilized and Brazil has experienced an average inflation of 6.6% since 1999 (The World Bank, 2016b). Despite having a little gap behind the East Asian Tigers, this a major improvement compared to earlier decades. In terms of macroeconomic conditions measured by investment rates Brazil scores low, both compared to China and India and the East Asian Tigers. From a Foreign Direct Investment however, Brazil is viewed as the easiest of the major Emerging Markets (O'Neill, 2011). They are more Western and democratic than India and China, in addition to better established domestic capital markets. Brazils scores better on technological capabilities than China and India, but are well behind the levels of the East Asian Tigers, especially on internet usage where only 59% of their population has used internet for the last 12 months. In terms of human capital, Brazil has much improvement needed on educational levels, both on average schooling as well as completed tertiary education, especially compared to South Kore and Singapore (Barro & Lee, 2015). Studies show that non-whites have a lower rate of schooling, a higher likelihood of falling behind in school and at the same time attend schools that offer fewer classroom hours than what is the case with whites (do Valle Silva & Hasenbalg, 1999). Whites are at the same time, seven times more likely to complete college, than non-whites. The reason for that is that there is a racial segregation in Brazil s educational system on the primary and secondary level. While non-white children mostly go to underfinanced public schools, the more economically privileged white children are attending private schools. The public primary and secondary schools mostly fail in preparing their students for entrance examinations for the best universities while the white students have a much better chance of mastering the entrance examinations. This results in elite-universities that are disproportionately attended by white students. This pattern of racial segregation is found in most other parts of Latin America as well (Do Nascimento & Nascimento, 2001). Brazil however, has higher life expectancy than India, but are below China and are more than eight years below the life expectancy in all the East Asian Tigers (The World Bank, 2016b). Brazil is considered the most political stable of the major Emerging Markets. They score better on control of corruption than India and China, but India is better on rule of law (The World Bank Development Research Group, 2015). Brazil has much room for improvement to reach the levels of the East Asian Tigers, especially Hong Kong and Singapore. 77
86 7.5 Discussion of findings In the qualitative part, generalization is not possible, but theoretical contexts could be highlighted. Only historical transactions can be examined with security. What happens in the future is always a cause of uncertainty. Therefore, it is important to have a clear distinction between potential and reality. We cannot say that China and India will become the world s two largest economies in 2050, we can however indicate that this could be achieved in the future base on their potential. There are multiple paths to economic development. Every developing country must find its own path to effective economic and social institutions. Usually it is not enough with a straight forward copy of best-practice institutions and it is difficult to find a unique link between the functions that good institutions perform and which form such an institution take. The important first order economic principles: Protection of property rights, contract enforcement, market-based competition, appropriate incentives, sound money and debt sustainability need to be packed into institutional design which are sensitive to local constraints and additionally can take advantage of local opportunities. Good institutions are those that deliver these principles in an effective way. Furthermore, countries with success are those that have used this room wisely (Rodrik, 2005). China, India and Brazil are very different countries and to find a common way for them for achieving sustainable economic growth and to overcome the middle-income trap is difficult. As highlighted earlier both India and Brazil are multi-ethnic, while China is mostly ethnically homogeneous (Central Intelligence Agency, 2016). In African countries as well as in other parts of the world, ethnic diversity has been associated with slower growth (Todaro & Smith, 2009). Collective institutions are important for achieving prosperity and both India and Brazil lack a basis for cooperation. They are both democratic countries, but democracies could also be undermined by a lack of trust in the culture where mistrust hinders the citizen s from cooperating in monitoring the government (Shirley, 2005). It is also worth noting that India and Brazil has inherited institutions that were promoted by outsiders due to their former status as colonies under Great Britain and Portugal. China is the greatest success story of our generation. Their tremendous transformation during the last 30 years, inspires other emerging markets, partly backed by the fact that China became the second largest economy in the world in 2010 and some analysts believe China will surpass the United States GDP by 2030, and become the world s largest economy (in 78
87 terms of nominal GDP, in terms of PPP China surpassed the United States by 2014). Furthermore, comparisons between China in 2016 and Japan in the early 1990s has been made. Back then, analysists predicted it was only a matter of time before Japan overtook the United States place as the largest economy in the world (O'Neill, 2011). Short time after Japan s so-called Lost decade (also called Lost 20 Years ) began with the collapse in property prices and investments caused by a major asset price bubble which Japan still struggle with consequences from (Funabashi & Kushner, 2015; Hayashi & Prescott, 2002). Japan s low birth rates coupled with almost non-existing immigration led to population stagnation and less people to fuel economic growth. Despite fast-rising asset values in China and talk of China becoming the world s largest economy, a major difference between China today and Japan in the 1990s is that China still have room to grow. Hundreds of millions of people on the Chinese countryside have yet to become part of the economic transformation in the country, China also have a long way to go before they settle for the mature, Western steady-state growth rate of around 2.5 per cent. According to Goldman Sachs (O'Neill, 2011) model for BRIC growth to 2050, China will experience average 5.5 per cent over the period, despite declining to 3.5 per cent average growth in the final decade. Other differences between China and Japan in the 80s is their level of outwardness. Japan is a more formal and closed society than China (O'Neill, 2011). Other languages than Japanese are hardly used in Japan, while many Chinese speak English or are acquiring the skill. China s willingness to let provinces and local governments experiment with different economic rules and competition if the dominance of the communist party went unchallenged has been suggested as a good fit to local institutions. Capitalist incentives have flourished within an at least officially socialist system. China s federal system has been suggested by as a cause of their economic growth due to the experimentation permitted among provinces with incentives that give rise to rapid gains in productivity in a state with unrestrained capacity to intervene and appropriate economic surplus (Weingast, 1993). However, the Chinese market preserving federalism (Shirley, 2005, p. 630) has also had disadvantages because of struggles with corruption and also leaving large parts of the country behind (Shirley, 2005). Chinas federalist framework is unable to specify the institutional constraints that limit government officials rent seeking behavior and their ability to expropriate economic surplus (Nee & Su, 1996). Also, Argentina s travel from a developed country to an underdeveloped today has been partly attributed to its federal system (Shirley, 2005). 79
88 The Chinese civilization has survived for thousands of years while they are continuing to adapt to changes in the modern world and emphasizes the concept of harmony and foster credible commitment through institutional arrangements that promote social exchanges (Cao, 2015; Nee & Su, 1996). China s future, however is also dependent on external factors outside the control of the Chinese communist party. China are vulnerable on their exports for economic growth. However, in the Western world and especially in the United States, China s exports have been blamed for the loss of Western jobs and support for increased protectionism has been popular among supporters of the new President-elect of the United States, Donald J. Trump (Trump, 2016). If the United States one day threatens to ban Chinese goods, Chinas strong economic growth could face difficulties, however due to China s large imports this can go both ways. Indian society has been called heterogeneous and conflict-ridden (Shirley, 2005, p. 628) and has been highlighted as a fully democratic country where the citizens have not been able to overcome collective action problems to getting a more well-functioning government (Shirley, 2005). A clear example is that India prices water and electricity below operating cost causing inadequate resources for maintaining the services or providing access to the poor. Even though everyone loses from frequent disruptions in services the political opposition to reducing these popular but economically disastrous subsidies has been poor (Shirley, 2005). India scores relatively well in terms of rule of law and inflation, but quite poorly in terms of levels of secondary education, technology adoption and openness. India has the lowest growth environment scores among the large Emerging Markets (O'Neill, 2011). Despite a credible legal system, India is dominated by the difficulties of bureaucracy for getting things done and its scale of poverty. Stagnation of the middle class and growing concentration of income has been seen as a source of the middle-income trap (Kharas & Kohli, 2011). Large parts of the Indian population living on the countryside and in slums still lack access to health care, education, banking facilities with minimal future economic prospects (O'Neill, 2011). India has opened up by gradually lowering its very high trade barriers and boosting exports (Goldman Sachs, 2007). Increased competition from imports has made domestic firms more efficient to survive. With more entry of foreign banks and opening of financial sector will also boost economic growth. Improved infrastructure would not happen overnight, but have potential for productivity gains and the effect to the economy is substantial (Goldman Sachs, 2007). India is also going into the great migration period earlier experienced by China and witness rapid urbanization. The implications for productivity growth are significant. 80
89 A government strong enough to protect property rights and enforce contracts is also strong enough to confiscate the wealth of its citizens. (Weingast, 1995). A critical role for political institutions is to provide appropriate foundations for economic policy making and securing economic and property rights (Weingast, 1995). India is a federalist state and a specific form of federalism, called market-preserving federalism is characterized by the limited degree that country s political system could encroach upon its markets. To be successful, federalism requires self-enforcing restrictions who make it in the interest of national political actors to honor them. In a case study of market-preserving federalism (Weingast, 1995) highlighted India together with Argentina and Brazil as a de jure federal system but not a marketpreserving federal system. In India, the political authority of the national government compromised the independence of local authority. (Weingast, 1995) also suggested that limited government appeared to be an important component of economic reform. (Keefer & Knack, 2008) has suggested income equality and education as development promoting norms, which both India and Brazil struggles with. Most Latin American countries, Brazil included, has failed to make the transition from resource-driven growth driven by lowcost labor to productivity-driven growth driven by specialization and innovation. (O'Neill, 2011) suggests one common variable to be more supportive to future economic growth than any other, technology. New developments in communication is the leader in this new phase of globalization where national economic borders are being eroded and makes it easier to participate in global business and markets. (Todaro & Smith, 2009, pp ) Demographic advantage is a condition, but strengthening of key long-term conditions are needed to reach their potential (O Neill et al., 2005). There are also views that they are failing to justify the predictions that they would dominate the 21th century. Brazil has fallen into recession, partly because of their unhealthy dependence on oil exports. China, the principal engine of world growth, has meanwhile seen a sharp contraction in their overall economic activity. Meanwhile, India has experienced relative progress and their government are trying to open to an array of improvement measures that should help the economy achieve sustainable high growth rates. 81
90 Chapter 8 Conclusions The rapid economic growth of the emerging markets is the most important economic development affecting the world s population in the first decade of the 21st century, and it has lifted millions of households out of poverty. The story of the Emerging Markets is still only at the beginning. Some countries will deliver better than projected, while others will fail and New Emergers will also come into prominence. It is likely that countries with favorable demographics has an advantage, nevertheless a great potential for future economic growth is not a guarantee for future economic success, Russia and Brazil are clear examples example. Sustainable economic growth requires investments in infrastructure as well as improving political, economic, legal and social institutions. It also requires a remaining free flow of technology, ideas and talented people who are the real key drives of economic catch up growth (PWC, 2015). A threat to economic development is if open boarders are being closed. (Ward, 2012). A wave of protectionism would hardly benefit any individual economy and certainly not the world. Bad politics is a key risk to future growth predictions as well as wars, both civil and external. An overdependence on natural resources could also be worsening conditions for achieving sustainable long-term growth (Russia, Venezuela, Saudi Arabia, Nigeria), unless they can diversify their economies. The current gap between todays developed economies and the emerging in terms of GDP per capita is too large to fully bridge in the upcoming decades. Many Emerging Markets will also have difficulties to maintain the growth rates they have experienced during the last two decades. The existing developed markets in North America and Europe + Japan will remain very significant players in the global economy and politics. Their average income levels will remain much higher than even the best-performing emerging markets, despite that their growth rates will be relatively low (PWC, 2015). The developed markets offer investors lower risk rates due to their institutional and political strengths compared to developing economies. A major change of today s economic order might seem unthinkable, but such large shifts has been common in history and prosperity today is no guarantee for prosperity tomorrow. Any projections are a subject to many uncertainties and despite their growth potential, the Emerging Markets still suffer from substantial institutional weaknesses. 82
91 8.1 Conclusion of the quantitative research In the quantitative research, the results of the data analysis suggested significant negative relations between the 1990 levels of GDP per capita, Voice and Accountability AVG and the GINI-coefficient and the average economic growth. The results also suggested a significant positive correlation between the investment ratio to GDP and the average economic growth. However, this analysis is not strong enough to generalize or to conclude on a cause and effect relation. We can however support earlier research which indicates a relation, but more research on this area is needed. 8.2 Conclusion of the qualitative research China, India and Brazil all belong to the top half of the growth environment scores for developing countries, but for all the three major Emerging Markets, there are a large distinction between their potential and the reality. China has come a long way in the last three decades. From an economy barely registered in the global rankings to being the second-largest economy in the world, and possibly being the largest one in a few years possibly. However, major institutional development is still needed for further economic development and to reach this goal. China has a good growth environment; stable inflation rate, investment levels, openness to foreign trade. However, falls behind on the use of technology in some areas and corruption. China has the best GES-scores of the three major Emerging Market, but improvement is needed to reach developed countries levels. China could also experience problems with an ageing population, China may get old before it gets rich (Goldman Sachs, 2007). However, they have now eased on one-child policy. Also, the rapid buildup of human capital combined with continued release of surplus labor from agriculture could mitigate the negative influences of an ageing population. China has had remarkable improvement in human capital since the liberalization began but there is still room for much improvement in tertiary education. However, with a large enrollment on secondary education, a solid base for higher education is founded. For India to have any change to reach its remarkable potential, they need to increase its educational standards and opportunities. India s poorest and people in remote areas need access to education and basic technology. Access to technology like internet and mobile phones in combination with education. Only 31.3% of India s total population are urban (Central Intelligence Agency, 2016), and added with continued rapid urbanization, it is easy 83
92 imagine India keeping growth rate above China for the upcoming decades as well. However, failure to continue investing in education and technology combined with protectionism could leave them back before the economic liberalization reforms in 1991 (O'Neill, 2011). Extreme income disparities also undermine social stability and solidarity. High inequality facilitates rent seeking (corruption) where resources are diverted from productive purposes that could increase economic growth. A reduction in mass poverty is also suggested as a powerful incentive for widespread participation in economic development (Todaro & Smith, 2009). India can become an engine for the global economy. Long term projections are of course subject to a great deal of uncertainty and their growth transition will most likely experience some failures. India is viewed as being fifteen to twenty years behind China, especially on areas like infrastructure (O'Neill, 2011). India will remain a low-income country for decades, with per-capita levels well below China and Brazil, but if they fulfill its growth potential they will be a key contributor to the world economy. This is also convenient with the findings and conclusion of (Goldman Sachs, 2007). It is also worth noting that in PWCs predictions, the growth in both India and China will moderate after 2020 as they mature (PWC, 2015). The growth rates experienced during the last years is difficult to maintain (the middle-income trap: See chapter 4). Any such long-term growth predictions are also subject to many uncertainties. Brazil is considered the most political stable of the major Emerging Markets. They also score well on life expectancy and technology adaption; despite that they have some improvement to do before they are on the levels of the East Asian Tigers. On the other hand, Brazil scores low on investment and education levels as well as openness to trade. It is worth noting that trade count for only 25% of their GDP (The World Bank, 2016b), which is remarkably low compared to China (45%) and India (48%). However, it is meaningless to compare their levels of trade with the East Asian Tiger due to their differing sizes of domestic markets. Brazil also have a high percentage of its population in poverty compared to other middleincome countries. Brazil is also of special interest regarding the middle-income trap, because they were richer than the East Asian Tigers back in the 1980s. Brazil has had a larger role for state-owned enterprises, much lower education as well as other investments and much higher inflation compared to the East Asian Tigers. Brazil has extremely high economic inequality and a social division which pose a serious threat to further progress. Brazil has experienced economic growth, but limited social progress (Todaro & Smith, 2009). Their current ongoing recession and political chaos is reaffirming the impression of Brazil as a country that has 84
93 failed to make the transition from resource-driven growth to productivity-driven growth driven by specialization and innovation (Kharas & Kohli, 2011). To meet the challenge of development, countries need an institutional framework that supports a market economy and long-term sustainable economic growth is dependent on a society with a sustainable basis for investment and development. Markets with a dominance of a formal economic structure like prevalence of rule of law, institutions and transparency tend to outperform comparable informal economies in the long run. As supported by the findings, China, India and Brazil all lack efficient formal institutions, but at some degree their informal institutions give them stability and sustainability. Igniting economic growth and sustaining it are somehow different. Igniting economic growth generally requires a limited range of reforms. Sustaining economic growth however, is in many ways a harder challenge and requires construction of a sound institutional fundament to maintain productive dynamism and to create resilience to shocks (Rodrik, 2005). Classification by income does not necessarily reflect development status, the classification is just as important in terms of growth potential. Not all countries at the same income level experience the similar development. The refinement is done generally based on their size and growth, as well as their growth potential. To live up to their potential for China, India and Brazil, institutional reforms are needed. There are still much they can undertake to speed economic and social progress even further, but the transition towards a developed economy is by no means assured for any of them (Gaeta, 2012b). Furthermore, New Institutional Economics have not produced a full answer to the question asked. Historical analysis has produced several explanations, but no single argument is fully satisfactory. The quality of many institutions is correlated and it is disputed which of them that matter most and which that are substitutes for each other in spurring growth (Todaro & Smith, 2009). While much is known about the institutional development in Western Europe, more research is needed on the development of institutions in developing countries (Shirley, 2005). 8.3 Policy recommendations China has already taken the most important step by easing on the one-child policy (Phillips, 2015). Other important steps include making education affordable and flexible and facilitating migration. 85
94 For India, despite its large potential, it is critical for them to have inclusive growth with employment and educational opportunities for all, not increased income inequality. India should also decrease their protectionism. Most importantly, India needs to educate its children and youth (especially women). The demographic advantage may be lost if they fail to educate its people (Goldman Sachs, 2007). For Brazil, there is a problem for their future economic growth that they invest to little. To improve on this area, their government should address this issue in a similar way as the Chinese government. The Brazilian economy should also be more opened to trade. Brazil must also improve the overall quality of education and implement structural reforms to improve their institutions. This is a view that is consistent with (Goldman Sachs, 2007) The goal for all Emerging Markets should be to still achieve growth after the economies mature and avoiding the middle-income trap. Following a transition like the Asian Tigers into developed economies. To evolve further from the middle-income trap and into being innovative economies with a firmer foothold in the major knowledge intensive industries, policy changes are needed: The governments should be determined by increasing the competitiveness of specific industries. They should identify and invest in industries that are suited to their different stages of development and where they could have comparative advantages. Above all this, they need to focus on building institutions for development of human capital. Sustainable growth is not possible without focusing on building a good infrastructure for science and technology which is achieved with a strong education system (Mudambi, 2015). 8.4 Limitations I acknowledge there are some limitations to my study. In this paragraph, I will address some of these and discuss their impact on the results. In the quantitative part, I have not checked for control variables in the data analysis. There could be other variables that were not core in this study, that could potentially influence the independent variable. Also, as mentioned earlier when discussing reliability, given the small sample of countries, and since I only have analyzed data from fast-growing developing countries during the last 25 years, it will be difficult to generalize the findings to other developing countries outside of the samples, in the quantitative findings. Other results could have been produced, if I had included countries without significant economic growth during the last 25 years. Many of the independent variables could influence economic growth, even if 86
95 it they not were statistically significant in this study on which factors that influenced which countries that experienced most economic growth during the last 25 years. Based on my empirical evidence I can only conclude on which factors that have correlated with the economic growth in these countries and why some of them have grown faster than the other countries in the same sample. A significant effect in this sample shows the factors that separates the fastest growing Emerging Markets from the rest. On the quantitative part, given the small sample, the results could be very sensible. Generalization could also be a problem and the results will most likely only be valid for fast-growing economies like the countries in the sample. The data we have collected only covers 25 emerging markets. If we had included countries with zero or negative economic growth, other variables could have shown statistical significance. The research conducted in the data analysis in this thesis is not strong enough to conclude on a cause and effect relation. Due to the nature of this thesis, I have not been able to go deeply into each country in the case-study part on China, India and Brazil. More deep investigations are needed, especially on the institutions to highlight theoretical context. It is difficult to conclude on definite answers to the questions asked. Historical analysis has produced several explanations but no single argument is fully satisfactory. We can however support earlier research which indicates a relation, but more research on this area of economic growth in Emerging Markets is needed. 8.5 Prospects for future research Intensify and extend the study that has been performed in this thesis, with continued focus on China, India and Brazil. In this thesis, I have not been able to go deeply into each country, but only touched the surface. Future research could especially investigate more deeply the institutions that have formed each country and culture. Another field is the effects of income inequality on the different country s economic growth. Seek to generalize and empirically establish more of the suggested relationships between independent variables and economic growth. As mentioned in the methodology-part, the small sample of countries and the fact that it only includes developing countries with fast-growth for the last 25 years makes the results difficult to generalize. A larger and more varied sample of countries could have produced other variables with statistical significance that were easier to generalize. 87
96 References Acemoglu, D., Johnson, S., & Robinson, J. A. (2001). The colonial origins of comparative development: An empirical investigation. American Economic Review, 91(5), doi: /aer Acemoglu, D., Johnson, S., & Robinson, J. A. (2001). Reversal of fortune: Geography and institutions in the making of the modern world income distribution. Retrieved from Acemoglu, D., Johnson, S., & Robinson, J. A. (2005). Institutions as a fundamental cause of long-run growth. Handbook of economic growth, 1, Almeida, H., & Ferreira, D. (2002). Democracy and the variability of economic performance. Economics & Politics, 14(3), Alsop, R., Krishna, A., & Sjoblom, D. (2001). Inclusion and Local Elected Governments: The Panchayat Raj System in India. Social Development Paper, 37. Auty, R. M. (1990). Resource-based industrialization: Sowing the oil in eight developing countries: Oxford University Press, USA. Banerjee, A., & Iyer, L. (2005). History, institutions, and economic performance: The legacy of colonial land tenure systems in India. American Economic Review, 95(4), doi: / Banerjee, A., Iyer, L., & Somanathan, R. (2005). History, social divisions, and public goods in rural India. Journal of the European Economic Association, 3(2-3), Banerjee, A. V., & Duflo, E. (2005). Growth theory through the lens of development economics. Handbook of economic growth, 1, Barro, R. J. (1996). Determinants of economic growth: a cross-country empirical study. Retrieved from Barro, R. J., & Lee, J.-W. (2015). Education matters: global schooling gains from the 19th to the 21st century: Oxford University Press. Barro, R. J., & Lee, J. W. (2001). International data on educational attainment: updates and implications. Oxford economic papers, 53(3), Barro, R. J., & Lee, J. W. (2013). A new data set of educational attainment in the world, Journal of development economics, 104, Batjargal, B., Hitt, M. A., Tsui, A. S., Arregle, J.-L., Webb, J. W., & Miller, T. L. (2013). Institutional polycentrism, entrepreneurs' social networks, and new venture growth. Academy of Management Journal, 56(4), Bellak, C., Mayer, S., De Beule, F., Van Den Bulcke, D., Bitzenis, A. P., Acharya, R. C.,... Gammeltoft, P. (2013). Inward and Outward FDI Country Profiles. Berger, D., Pukthuanthong, K., & Yang, J. J. (2011). International diversification with frontier markets. Journal of Financial Economics, 101(1), Bjork, G. C. (1999). The way it worked and why it won't: structural change and the slowdown of US economic growth: Greenwood Publishing Group. Buiter, W., & Rahbari, E. (2011). Global growth generators: moving beyond emerging markets and BRIC. Global Economics View, 21, 1-9. Cao, S. (2015). Institutional diversity: Why Chinese civilization survives. Time & Society, X Cass, D. (1965). Optimum growth in an aggregative model of capital accumulation. The Review of economic studies, 32(3), Center for International Development at Harvard University. (2013). What did Brazil export in Retrieved from Center for International Development at Harvard University: Central Intelligence Agency. (2016). The World Factbook Retrieved from Chen, D., Newburry, W., & Park, S. H. (2009). Improving sustainability: An international evolutionary framework. Journal of International Management, 15(3),
97 Clark, G. (2001). The secret history of the Industrial Revolution. Manuscript, University of California, Davis. Available at econ. ucdavis. edu/$ gclark. Coase, R. H. (1992). The institutional structure of production. The American economic review, 82(4), Collier, P., & Hoeffler, A. (1998). On economic causes of civil war. Oxford economic papers, 50(4), Collier, P., & Hoeffler, A. (2005). Resource rents, governance, and conflict. Journal of conflict resolution, 49(4), Columbia University. (2016). Emergin Market Global Players. Retrieved from Dirks, N. B. (2011). Castes of mind: Colonialism and the making of modern India: Princeton University Press. Do Nascimento, A., & Nascimento, E. L. (2001). Dance of deception: a reading of race relations in Brazil. Beyond racism: race and inequality in Brazil, South Africa, and the United States, do Valle Silva, N., & Hasenbalg, C. A. (1999). Race and educational opportunity in Brazil. Race in contemporary Brazil: From indifference to inequality, 53. Domar, E. D. (1946). Capital Expansion, Rate of Growth, and Employment. Econometrica, 14(2), doi: / Doyle, M. W., & Sambanis, N. (2000). International peacebuilding: A theoretical and quantitative analysis. American political science review, 94(04), Dutta, S., Lanvin, B., & Wunsch-Vincent, S. (2014). The Global Innovation Index 2014: The Human Factor in innovation. Fontainebleau, Ithaca, and Geneva. Easterly, W. (2005). Inequality does cause underdevelopment. Easterly, W. R. (2001). The elusive quest for growth: economists' adventures and misadventures in the tropics: MIT press. Eichengreen, B., Park, D., & Shin, K. (2013). Growth slowdowns redux: New evidence on the middleincome trap. NBER Working Paper: National bureau of economic research. Engerman, S. L., & Sokoloff, K. L. (2005). Colonialism, inequality, and long-run paths of development: National Bureau of Economic Research. Estevadeordal, A., Frantz, B., & Taylor, A. M. (2002). The rise and fall of world trade, : National Bureau of Economic Research. Fardmanesh, M. (1991). Dutch disease economics and oil syndrome: An empirical study. World Development, 19(6), Fausto, B. (2006). História do Brasil. São Paulo: Edutira Universidade de São Paulo. Field, A. (2013). Discovering statistics using IBM SPSS statistics: Sage. Financial Times Stock Exchange. (2016). FTSE Classification of Markets March Retrieved from Findlay, R., & O'Rourke, K. H. (2003). Commodity market integration, Globalization in historical perspective (pp ): University of Chicago Press. Forbes. (2016). The World's Billionaires. Retrieved from Funabashi, Y., & Kushner, B. (2015). Examining Japan's Lost Decades (Vol. 59): Routledge. Gaeta, G. (2012a). Opportunities in Emerging Markets : Investing in the Economies of Tomorrow (1). Somerset, SG: Wiley. Gaeta, G. (2012b). Opportunities in emerging markets: Investing in the economies of tomorrow: John Wiley & Sons. Galor, O. (2005). From stagnation to growth: unified growth theory. Handbook of economic growth, 1, Gelb, A. H. (1988). Oil windfalls: Blessing or curse? : Oxford University Press. Gill, I., & Kharas, H. (2008). An East Asia renaissance: Ideas for economic growth. Washington DC: World Bank. 89
98 Goldman Sachs. (2007). BRICs and beyond. The Goldman Sachs Group/Global Economics Department, London. Greif, A. (1993). Contract enforceability and economic institutions in early trade: The Maghribi traders' coalition. The American economic review, Gylfason, T., Herbertsson, T. T., & Zoega, G. (1999). A mixed blessing. Macroeconomic dynamics, 3(02), Hair, J. F., Anderson, R. E., Tatham, R. L., & Black, W. C. (1998). Multivariate data analysis, 5th. NY: Prentice Hall International. Harriss, J., Hunter, J., & Lewis, C. (2003). The new institutional economics and third world development: Routledge. Harrod, R. F. (1939). An Essay in Dynamic Theory. The economic journal, 49(193), doi: / Hayashi, F., & Prescott, E. C. (2002). The 1990s in Japan: A lost decade. Review of Economic Dynamics, 5(1), Helljesen, V., & Hotvedt, S. K. (2014, 23.04). Ingen kollaps i norsk Kina-samarbeid. NRK. Retrieved from Herbst, J. (2014). States and power in Africa: Comparative lessons in authority and control: Princeton University Press. Higman, B. W. (2000, February). The Sugar Revolution. Economic History Review, LIII, Hinton, P., McMurray, I., & Brownlow, C. (2014). SPSS Explained: Routledge Ltd. Hitt, M. A., Li, H., & Worthington, W. J. (2005). Emerging markets as learning laboratories: Learning behaviors of local firms and foreign entrants in different institutional contexts. Management and Organization Review, 1(3), Hitt, M. A., & Xu, K. (2015). The Transformation of China: Effects of the Institutional Environment on Business Actions. Long Range Planning. Hofstede, G., Hofstede, G. J., & Minkov, M. (1991). Cultures and organizations: Software of the mind (Vol. 2): Citeseer. International Monetary Fund. (2014). World Economic Outlook October 14 I. M. Fund (Ed.) Retrieved from International Monetary Fund. (2015a). World Economic Outlook October 15. Retrieved from International Monetary Fund. (2015b). World Economic Outlook October Retrieved from International Monetary Fund. (2015c, Tuesday, November 10, 2015). World GDP Ranking 2015 Data and Charts. Retrieved from International Monetary Fund. (2016). World Economic Outlook January Retrieved from Isham, J., Woolcock, M., Pritchett, L., & Busby, G. (2002). The varieties of rentier experience: how natural resource endowments affect the political economy of economic growth. Unpublished mimeo dated January, 8. Jacobsen, D. I. (2005). Hvordan gjennomføre undersøkelser?: innføring i samfunnsvitenskapelig metode (Vol. 2): Høyskoleforlaget Kristiansand. Jayalakshmi, K. (2000). Decentralisation and Local Politics-Readings in Indian Government and Politics (Ed.) SN Jha and PC Mathur. JOURNAL OF RURAL DEVELOPMENT-HYDERABAD-, 19(1), Johannessen, A., Tufte, P. A., & Christoffersen, L. (2016). Introduksjon til samfunnsvitenskapelig metode. Oslo: Abstrakt forlag. Karst, K. L., & Rosenn, K. S. (1975). Law and development in Latin America: a case book (Vol. 28): Univ of California Press. Keefer, P. (2007). Clientelism, credibility, and the policy choices of young democracies. American journal of political science, 51(4),
99 Keefer, P., & Knack, S. (2008). Social capital, social norms and the new institutional economics Handbook of new institutional economics (pp ): Springer. Kharas, H., & Kohli, H. (2011, March). What Is the Middle Income Trap, Why do Countries Fall into It, and How Can It Be Avoided? Global Journal of Emerging Market Economies, Koopmans, T. C. (1965). On the concept of optimal economic growth. Lam, R., & Wantchekon, L. (2002). Political Dutch Disease. Unpublished Paper, 2. Lane, P. R., & Tornell, A. (1996). Power, growth, and the voracity effect. Journal of economic growth, 1(2), Levy, B., & Kuo, W.-J. (1991). The strategic orientations of firms and the performance of Korea and Taiwan in frontier industries: lessons from comparative case studies of keyboard and personal computer assembly. World Development, 19(4), Lipset, S. M. (1959). Some social requisites of democracy: Economic development and political legitimacy. American political science review, 53(01), Ludden, D. (2013). India and South Asia: a short history: Oneworld Publications. Malthus, T. R. (1798). An essay on the principle of population: or, A view of its past and present effects on human happiness: Reeves & Turner. Matthews, R. C. O., Feinstein, C. H., & Odling-Smee, J. (1982). British economic growth : the post-war period in historical perspective: Oxford University Press. Mehlum, H., Moene, K., & Torvik, R. (2006). Institutions and the resource curse*. The economic journal, 116(508), Meyer, K. E., Estrin, S., Bhaumik, S. K., & Peng, M. W. (2009). INSTITUTIONS, RESOURCES, AND ENTRY STRATEGIES IN EMERGING ECONOMIES. Strategic Management Journal, 30(1), doi: /smj.720 Mohan, R., & Aggarwal, V. (1990). Commands and controls: planning for Indian industrial development, Journal of Comparative Economics, 14(4), Moreira, M. M. (1995). Industrialization, trade and market failures: the role of government intervention in Brazil and South Korea: Macmillan. Morgan Stanley Capital International. (2016). MSCI Emerging Markets Index Jun Retrieved from Mudambi, R. (2015). Escaping the middle income trap : the divergent experiences of the Republic of Korea and Brazil (Vol. 46): United Nations Economic and Social Commission for Asia and the Pacific (ESCAP). Naritomi, J., Soares, R. R., & Assuncão, J. J. (2007, Oktober). Rent Seeking and the Unveiling of 'De Facto Institutions: Development and Colonial Heritage within Brazil. NBER Working Paper No , Nayyar, D. (2008). The internationalization of firms from India: Investment, mergers and acquisitions. Oxford Development Studies, 36(1), Nee, V., & Su, S. (1996). Institutions, social ties, and commitment in China s corporatist transformation. Reforming Asian socialism: The growth of market institutions, 111, North, D. C. (1990). Institutions, institutional change and economic performance: Cambridge university press. North, D. C. (2006). Understanding the process of economic change: Academic foundation. North, D. C. (2008). Institutions and the performance of economies over time Handbook of new institutional economics (pp ): Springer. North, D. C., & Weingast, B. R. (1989). Constitutions and commitment: the evolution of institutions governing public choice in seventeenth-century England. The journal of economic history, 49(04), Nurkse, R. (1958). TRADE FLUCTUATIONS AND BUFFER POLICIES OF LOW-INCOME COUNTRIES. Kyklos, 11(2), O'Neill, J. (2011). The Growth Map: Economic opportunity in the BRICs and beyond: Penguin UK. 91
100 O Neill, J., Wilson, D., Purushothaman, R., & Stupnytska, A. (2005). Global Economics Paper No: 134. How solid are the BRICs. Ostrom, E. (2008). Doing Institutional Analysis: Digging Deeper than Markets and Hierarchies. In C. Ménard & M. M. Shirley (Eds.), Handbook of New Institutional Economics (pp ). Berlin, Heidelberg: Springer Berlin Heidelberg. Ostrom, E., Schroeder, L., & Wynne, S. (1993). Institutional incentives and sustainable development: Infrastructure policies in perspective. Phillips, T. (2015, 29 October 2015). China ends one-child policy after 35 years. The Guardian. Retrieved from Pomeranz, K. (2009). The great divergence: China, Europe, and the making of the modern world economy: Princeton University Press. Pruthi, R. (2004). Indian caste system: Discovery Publishing House. PWC. (2015). The World in 2050 Will the shift in global economic continue? Retrieved from Ramsey, F. P. (1928). A mathematical theory of saving. The economic journal, 38(152), Ricardo, D. (1817). The Principles of Trade and Taxation: London: John Murray, Albemarle-Street. Rodrik, D. (2005). Growth Strategies Handbook of economic growth (pp ). Cambridge, Masachussets: Elsevier B.V. Rodrik, D., & Subramanian, A. (2004). From" Hindu growth" to productivity surge: the mystery of the Indian growth transition. Retrieved from Rodrik, D., Subramanian, A., & Trebbi, F. (2004). Institutions rule: the primacy of institutions over geography and integration in economic development. Journal of economic growth, 9(2), Roll, R., & Talbott, J. (2001). Why many developing countries just aren t. University of California at Los Angeles. Ross, M. L. (1999). The political economy of the resource curse. World politics, 51(02), Ross, M. L. (2001). Does oil hinder democracy? World politics, 53(03), Rosser, A. (2006). The political economy of the resource curse: A literature survey. Rostow, W. W. (1960). The Five Stages of Growth-A Summary. In W. W. Rostow (Ed.), The Stages of Economic Growth: A Non-Communist Manifesto (pp. 4-16). Cambridge: Cambridge University Press. Sachs, J. D., & Warner, A. M. (1995). Natural resource abundance and economic growth: National Bureau of Economic Research. Sachs, J. D., & Warner, A. M. (2001). The curse of natural resources. European economic review, 45(4), Saunders, M. N. (2011). Research methods for business students, 5/e: Pearson Education. Schuetz, T. (2011). A concise guide to market research: the process, data and methods using IBM SPSS statistics: MARKET RESEARCH SOC 15 NORTHBURGH ST, LONDON EC1V 0JR, ENGLAND. Scott, W. R. (2002). The changing world of Chinese enterprise: An institutional perspective The management of enterprises in the People s Republic of China (pp ): Springer. Shirley, M. M. (2005). Institutions and Development. In C. Menard & M. M. Shirley (Eds.), Handbook of New Institutional Economics (pp ). Boston, MA: Springer US. Simonsen, R. C. (1937 (1977 English version)). História Econômica do Brasil ( ). São Paulo: Editora Nacional. Solow, R. M. (1956). A contribution to the theory of economic growth. The quarterly journal of economics, Stone, A., Levy, B., & Paredes, R. (1996). Public institutions and private transactions: a comparative analysis of the legal and regulatory environment for business transactions in Brazil and Chile. Empirical studies in institutional change,
101 Stucchi, T., Pedersen, T., & Kumar, V. (2015). The Effect of Institutional Evolution on Indian Firms' Internationalization: Disentangling Inward-and Outward-Oriented Effects. Long Range Planning, 48(5), Swan, T. W. (1956). Economic growth and capital accumulation. Economic record, 32(2), Søhoel, S., Langset, K. G., & Buan, V. (2010, 12.10). Liu Xiaobo får Nobels fredspris. Aftenposten. Retrieved from b.html Telles, E. E. (2014a). Racial classification Race in another America: The significance of skin color in Brazil: Princeton University Press. Telles, E. E. (2014b). Racial inequality and development Race in another America: The significance of skin color in Brazil: Princeton University Press. The World Bank. (2015). World Development Indicators The World Bank (Ed.) GDP growth (annual %) Retrieved from The World Bank. (2016a). World Development Indicators T. W. Bank (Ed.) GDP ranking, Nominal Retrieved from The World Bank. (2016b). World Development Indicators T. W. Bank (Ed.) Retrieved from The World Bank Development Research Group. (2015). Worldwide Governance Indicators The World Bank (Ed.) Retrieved from The World DataBank. (2016). Poverty and Equity Database The World Bank (Ed.) Retrieved from Todaro, M. P., & Smith, S. C. (2009). Economic Development: Pearson Addison Wesley. Trading Economics. (2016). Households debt to GDP. Retrieved from Transparency International. (2013). Global Corruption Barometer Brazil. Retrieved from Transparency International. (2016). Corruption Perception Index Retrieved from Trump, D. J. (2016). Donald J. Trump s vision. Retrieved from UNICEF. (2015). UNICEF Data: Monitoring the situation of Children and Women. Retrieved from US Energy Information Administration. (2014). International Energy Statistics. Retrieved from yid=2010&eyid=2014&unit=bb Véron, R., Williams, G., Corbridge, S., & Srivastava, M. (2006). Decentralized corruption or corrupt decentralization? Community monitoring of poverty-alleviation schemes in Eastern India. World Development, 34(11), Walder, A. G. (1986). Communist Neo-Traditionalism: Work and Authority in Chinese Industry: University of California Press. Ward, K. (2012). The World in 2050: from the top 30 to the top 100: HSBC Global Research. Weber, M. (1905). Die protestantische Ethik und der Geist des Kapitalismus. Tübingen: Mohr. Weingast, B. R. (1993). Constitutions as governance structures: The political foundations of secure markets. Journal of Institutional and Theoretical Economics (JITE)/Zeitschrift für die gesamte Staatswissenschaft, Weingast, B. R. (1995). The economic role of political institutions: Market-preserving federalism and economic development. Journal of Law, Economics, & Organization, Wheeler, D. (1984). Sources of stagnation in sub-saharan Africa. World Development, 12(1), Williamson, O. E. (1990). A comparison of alternative approaches to economic organization. Journal of Institutional and Theoretical Economics (JITE)/Zeitschrift für die gesamte Staatswissenschaft,
102 Wilson, D., & Purushothaman, R. (2006). 1. Dreaming with BRICs: the path to Emerging economies and the transformation of international business: Brazil, Russia, India and China (BRICs), 1. World Trade Organization. (2016). World Trade Statistical Review 2016 Retrieved from Yin, R. K. (2013). Case study research: Design and methods: Sage publications. Zhou, W. (2013). Political connections and entrepreneurial investment: Evidence from China's transition economy. Journal of Business Venturing, 28(2), Zikmund, W. G., Babin, B. J., Carr, J. C., & Griffin, M. (2013). Business research methods: Cengage Learning. 94


103 Appendix 1: Table: The different lists of Emerging Markets 95


104 Appendix 2: Table: Collection of data for the data analysis (The top 5 countries on each variable is market in red) 96


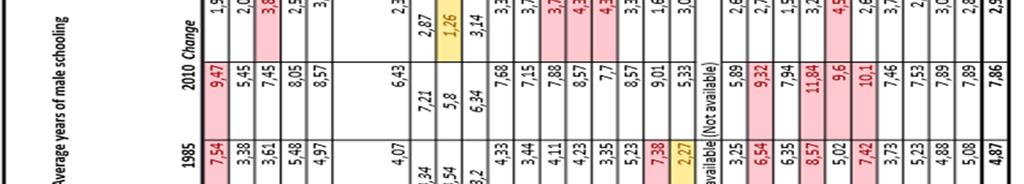

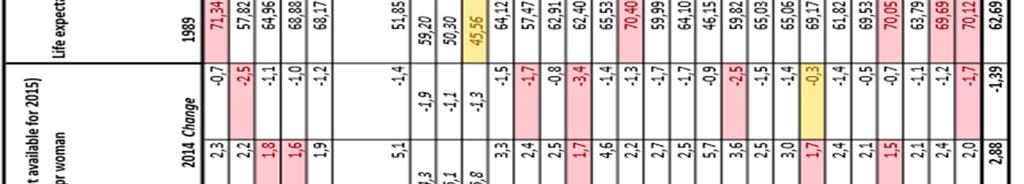

105 97
106 Appendix 3: chosen variables for data analysis: My choice of explanatory variables, based on (Barro, 1996): Initial Level of GDP per capita I. GDP per capita (current US$): GDP per capita is gross domestic product divided by midyear population. Data are in current U.S. dollars. Dollar figures for GDP are converted from domestic currencies using single year official exchange rates. For a few countries where the official exchange rate does not reflect the rate effectively applied to actual foreign exchange transactions, an alternative conversion factor is used. Argentina, Iran, Venezuela lacks numbers for I will instead use 2014 for Argentina and Iran, and 2013 for Venezuela. Initial GDP, Size of Economy in 1990 I. GDP, (current international $) Data are in current U.S. dollars. Dollar figures for GDP are converted from domestic currencies using single year official exchange rates. For a few countries where the official exchange rate does not reflect the rate effectively applied to actual foreign exchange transactions, an alternative conversion factor is used. Argentina, Iran, Venezuela lacks numbers for I will instead use 2014 for Argentina and Iran, and 2013 for Venezuela. The Worldwide Governance Indicators, AVG The World Bank Worldwide Governance Indicators are a research dataset summarizing the views on the quality of governance provided by many enterprise, citizen and expert survey respondents in industrial and developing countries. Data are gathered from several survey institutes, think tanks, non-governmental organizations, international organizations, and private sector firms. The project constructs aggregate indicators of six broad dimensions of governance: The estimates of governance ranges from approximately -2.5 (weak) to 2.5 (strong) governance performance. I will convert this scale into a scale from 0 (weak) to 1 (strong) governance performance. Both methodology and results are not uncontested, but they provide a valuable benchmark to access quality of the regulatory and administrative institutions in the Emerging Markets (Gaeta, 2012b). I. Voice and Accountability The variable reflects perceptions of the extent to which a country's citizens can participate in selecting their government, including freedom of expression, freedom of association, and a free media. II. Political Stability and Absence of Violence/Terrorism Stable political regimes promote confidence, which is linked to higher investment and growth. It is the government that provides the appropriate framework for economic growth and development. The variable measures perceptions of the likelihood of political instability and/or politically-motivated violence, including terrorism. III. Government Effectiveness The variable reflects perceptions of the quality of public services and the civil service and the degree of its independence from political pressures. 98
107 IV. Regulatory Quality The variable reflects perceptions of the ability of the government to formulate and implement sound policies and regulations that permit and promote private sector development. V. Rule of Law The variable reflects perceptions of the extent to which agents have confidence in and abide by the rules of society, and the quality of contract enforcement, property rights, the police, and the courts, as well as the likelihood of crime and violence. VI. Control of Corruption Corruption increased corruption is harmful to economic growth through distorting incentives. The variable reflects perceptions of the extent to which public power is exercised for private gain, including both petty and grand forms of corruption, as well as "capture" of the state by elites and private interests. Average CPI inflation rate, average annual (% year) Measured by the consumer price index reflecting the annual percentage change in the cost to the average consumer of acquiring a basket of goods and services that may be fixed or changed at specified intervals. The Laspeyres formula is generally used. Higher inflation goes along with a lower rate of economic growth. Inflation discourages investment and erodes growth performance. (Barro, 1996) suggests that a greater Central Bank independence leads to lower average rates of money growth and inflation and to greater monetary stability. This increases price stability and is associated with low and stable inflation. Fertility rates (births per woman) 1990 and change between Represents the number of children that would be born to a woman if she were to live to the end of her childbearing years and bear children in accordance with age-specific fertility rates of the specified year. Life expectancy at birth 1990 and change during the period The basic measure of health conditions. Higher life expectancy has been shown to be strongly associated with growth performance. Life expectancy at birth indicates the number of years a newborn infant would live if prevailing patterns of mortality at the time of its birth were to stay the same throughout its life. According to (Barro, 1996), results are similar if the infant mortality rates is used instead as measure of health status Levels of human capital 1985 and change during the period Educational Attainment for Male Population, Education is given big importance in Barros model and a country s ability to adapting to the world s given technology or push the technological frontiers is depending on its levels of education. The focus on average years of schooling for the male population aged 25 and above is not a perfect tool since it does not show the quality of education, but is shown to be well correlated with time spent at school.(ward, 2012). Additional results also indicate that female schooling has importance in relation to reducing fertility and infant mortality and also gives slight evidence that female education spur economic growth. (Barro, 1996) 99
108 Government consumption, ratio to GDP. Average Measure includes all government current expenditures for purchases of goods and services It also includes most expenditures on national defense and security. In Barros original model increased government consumption is negatively associated with economic growth. GINI Index Measures the extent to which the distribution of income among individuals or households within an economy deviates from a perfectly equal distribution. Thus, a Gini index of 0 represents perfect equality, while an index of 100 implies perfect inequality. Converted to scale from 0 to 1 in this relation-testing. Investment to GDP ratio of GDP Consists of outlays on additions to the fixed assets of the economy plus net changes in the level of inventories. High investment rates are associated with capital accumulation and growth. The reason investment spending is used as test variable instead of savings ratio, is that there is no guarantee it will be used in your own country (capital flight). Growth in labour force of working age, rate of working age population (15-59) Ratio of working population in the total population The ratio of people older than 15 or younger than 59, to the working-age population. Data are shown as the proportion of dependents per 100 working-age population. Increase of people in the production line is associated with increase in economic growth. When there are many producers and few dependents who burden the producers like tax payments that go to support the elderly and young. Demographics could explain part of what is likely to be huge differences in economic performance in upcoming years. However, population growth is not itself enough to guarantee growth because without the right economic infrastructure little progress is made despite growth in the working population (Barro, 1996). Variable Description Source GDP growth GDP per capita growth (annual %). World Development Indicators, Average the World Bank Initial Level of GDP per capita GDP per capita (current US$) World Development Indicators, the World Bank Initial GDP, Size of Economy in 1990 GDP (current US$) World Development Indicators, the World Bank Voice and Accountability Average Worldwide Governance Indicators, the World Bank Political Stability and Absence of Violence/Terrorism Average Worldwide Governance Indicators, the World Bank Government Effectiveness Average Worldwide Governance Indicators, the World Bank 100
109 Regulatory Quality Average Worldwide Governance Indicators, the World Bank Rule of Law Average Worldwide Governance Indicators, the World Bank Control of Corruption Average Worldwide Governance Indicators, the World Bank Inflation rate: CPI inflation (% year) Average World Development Indicators, the World Bank Fertility rates 1989 and change between World Development Indicators, the World Bank Life expectancy 1989 and change between World Development Indicators, the World Bank Initial level of Human Average years of male schooling, 1985 (Barro & Lee, 2013) Capital and change in years between Government consumption % of GDP World Development Indicators, the World Bank GINI Index Gini coefficient average World Development Indicators, the World Bank Investment ratio to GDP Average World Development Indicators, the World Bank Labor force of working age, % of total population 1990 and change between World Population Prospects, United Nations Table: Chosen variables for data analysis 101
110 Appendix 4: Determinants of Growth Environment Scores and table with scores GES can be divided into five basic areas (O Neill et al., 2005): Macroeconomic stability Inflation higher inflation goes along with a lower rate of economic growth. Inflation discourages investment and erodes growth performance Macroeconomic conditions Investment spending high investment rates encourage capital accumulation and growth Openness of the economy Economies with high degree of economic openness tend to show higher economic growth than less open comparable economies. However, as large countries tend to be less open because their large internal markets serve as substitutes for international market, this relationship should be adjusted for population and geographical area variables. This also highlights how large countries can produce much more of what they need domestically. Technological capabilities Use of mobile telephones Mobile cellular telephone subscriptions per 100 people. Proxied by mobile phone penetration as part of the technological capabilities group. The use of technology is linked to educational attainment and leads to faster productivity gains. For developing countries mobile phones may be the most significant as mobile phones are having an increasingly important effect on growth. Use of the internet People who have used internet per 100 people in the last 12 months. (The World Bank, 2016b) Human capital (Barro & Lee, 2013); Education Education is perhaps the most important variable in driving the working population to higher productivity. Life expectancy the basic measure of health conditions. Higher life expectancy has been shown to be strongly associated with growth performance. Political stability Political stability - Stability of government stable political regimes promote confidence, which is linked to higher investment and growth. It is the government that provides the appropriate framework for economic growth and development. Rule of law well-defined property rights and generally, well-functioning institutions are believed to be conducive to higher investment and growth. For investors, there still exists a varying degree of uncertainty to invest in an emerging market, even if most emerging markets are regulated on paper. Because these regulations suffer from unpredictability as well as the lack of an organized institutional framework to implement laws and rules that protect their businesses from possible repatriation of funds. A following issue, is that prevailing behavior patterns and some cultural norms at the same time are not aligned with legislation which is often just only seen as a recommendation instead of an objective book of rules. To live up to their potential for many emerging markets, institutional reforms are needed (Gaeta, 2012b) 102

.")
111 Corruption increased corruption is harmful to economic growth through distorting incentives (The World Bank Development Research Group, 2015). Table: Growth Environment Scores (GES) 103
HOW ECONOMIES GROW AND DEVELOP Macroeconomics In Context (Goodwin, et al.)
") Chapter 17 HOW ECONOMIES GROW AND DEVELOP Macroeconomics In Context (Goodwin, et al.) Chapter Overview This chapter presents material on economic growth, such as the theory behind it, how it is calculated,
Chapter 17 HOW ECONOMIES GROW AND DEVELOP Macroeconomics In Context (Goodwin, et al.) Chapter Overview This chapter presents material on economic growth, such as the theory behind it, how it is calculated,
Chapter 18 Development and Globalization
 Chapter 18 Development and Globalization 1. Levels of Development 2. Issues in Development 3. Economies in Transition 4. Challenges of Globalization Do the benefits of economic development outweigh the
New York County Lawyers Association Continuing Legal Education Institute 14 Vesey Street, New York, N.Y (212)
") New York County Lawyers Association Continuing Legal Education Institute 14 Vesey Street, New York, N.Y. 10007 (212) 267-6646 Who is Who in the Global Economy And Why it Matters June 20, 2014; 6:00 PM-6:50
New York County Lawyers Association Continuing Legal Education Institute 14 Vesey Street, New York, N.Y. 10007 (212) 267-6646 Who is Who in the Global Economy And Why it Matters June 20, 2014; 6:00 PM-6:50
Test Bank for Economic Development. 12th Edition by Todaro and Smith
 Test Bank for Economic Development 12th Edition by Todaro and Smith Link download full: https://digitalcontentmarket.org/download/test-bankfor-economic-development-12th-edition-by-todaro Chapter 2 Comparative
Has Globalization Helped or Hindered Economic Development? (EA)
") Has Globalization Helped or Hindered Economic Development? (EA) Most economists believe that globalization contributes to economic development by increasing trade and investment across borders. Economic
Has Globalization Helped or Hindered Economic Development? (EA) Most economists believe that globalization contributes to economic development by increasing trade and investment across borders. Economic
Full file at
 Chapter 2 Comparative Economic Development Key Concepts In the new edition, Chapter 2 serves to further examine the extreme contrasts not only between developed and developing countries, but also between
STATISTICAL REFLECTIONS
 World Population Day, 11 July 217 STATISTICAL REFLECTIONS 18 July 217 Contents Introduction...1 World population trends...1 Rearrangement among continents...2 Change in the age structure, ageing world
WORLD ECONOMIC EXPANSION in the first half of the 1960's has
 Chapter 5 Growth and Balance in the World Economy WORLD ECONOMIC EXPANSION in the first half of the 1960's has been sustained and rapid. The pace has probably been surpassed only during the period of recovery
Emerging Asian economies lead Global Pay Gap rankings
 For immediate release Emerging Asian economies lead Global Pay Gap rankings China, Thailand and Vietnam top global rankings for pay difference between managers and clerical staff Singapore, 7 May 2008
Bangladesh: towards middle-income status
 Bangladesh: towards middle-income status Martin Rama Chief Economist for South Asia, the World Bank * SANEM Annual Economists Conference Dhaka, 2016 * With Miklos Bankuti. Zahid Hussain, and Fan Zhang
Poverty in the Third World
 11. World Poverty Poverty in the Third World Human Poverty Index Poverty and Economic Growth Free Market and the Growth Foreign Aid Millennium Development Goals Poverty in the Third World Subsistence definitions
Latin America in the New Global Order. Vittorio Corbo Governor Central Bank of Chile
 Latin America in the New Global Order Vittorio Corbo Governor Central Bank of Chile Outline 1. Economic and social performance of Latin American economies. 2. The causes of Latin America poor performance:
INCLUSIVE GROWTH AND POLICIES: THE ASIAN EXPERIENCE. Thangavel Palanivel Chief Economist for Asia-Pacific UNDP, New York
 INCLUSIVE GROWTH AND POLICIES: THE ASIAN EXPERIENCE Thangavel Palanivel Chief Economist for Asia-Pacific UNDP, New York Growth is Inclusive When It takes place in sectors in which the poor work (e.g.,
Lecture III South Korean Economy today
 Lecture III South Korean Economy today Lecture 3: South Korean Economy - Current Status and Issues in the future South Korean Economy: Current Status 1 Korean Economy with Numbers GDP (PPP based) S. Korea
Lecture 1 Economic Growth and Income Differences: A Look at the Data
 Lecture 1 Economic Growth and Income Differences: A Look at the Data Rahul Giri Contact Address: Centro de Investigacion Economica, Instituto Tecnologico Autonomo de Mexico (ITAM). E-mail: rahul.giri@itam.mx
BBVA EAGLEs. Emerging And Growth Leading Economies Economic Outlook. Annual Report 2014 Cross-Country Emerging Markets, BBVA Research March 2014
 BBVA EAGLEs Emerging And Growth Leading Economies Economic Outlook Annual Report 2014 Cross-Country Emerging Markets, BBVA Research March 2014 Index Key takeaways in 2013 Rethinking EAGLEs for the next
Trends in inequality worldwide (Gini coefficients)
") Section 2 Impact of trade on income inequality As described above, it has been theoretically and empirically proved that the progress of globalization as represented by trade brings benefits in the form
Section 2 Impact of trade on income inequality As described above, it has been theoretically and empirically proved that the progress of globalization as represented by trade brings benefits in the form
Trademarks FIGURE 8 FIGURE 9. Highlights. Figure 8 Trademark applications worldwide. Figure 9 Trademark application class counts worldwide
 Trademarks Highlights Applications grew by 16.4% in 2016 An estimated 7 million trademark applications were filed worldwide in 2016, 16.4% more than in 2015 (figure 8). This marks the seventh consecutive
A GAtewAy to A Bet ter Life Education aspirations around the World September 2013
 A Gateway to a Better Life Education Aspirations Around the World September 2013 Education Is an Investment in the Future RESOLUTE AGREEMENT AROUND THE WORLD ON THE VALUE OF HIGHER EDUCATION HALF OF ALL
BRAND. Cross-national evidence on the relationship between education and attitudes towards immigrants: Past initiatives and.
 Cross-national evidence on the relationship between education and attitudes towards immigrants: Past initiatives and future OECD directions EMPLOYER BRAND Playbook Promoting Tolerance: Can education do
THE CRACKS IN THE BRICS
 Annals of the University of Petroşani, Economics, 9(4), 2009, 273-282 273 THE CRACKS IN THE BRICS SARIKA TANDON, SWAHA SHOME * ABSTRACT: The emerging economies Brazil, Russia, India and China have been
Chapter 5: Internationalization & Industrialization
 Chapter 5: Internationalization & Industrialization Chapter 5: Internationalization & Industrialization... 1 5.1 THEORY OF INVESTMENT... 4 5.2 AN OPEN ECONOMY: IMPORT-EXPORT-LED GROWTH MODEL... 6 5.3 FOREIGN
Asia-Pacific to comprise two-thirds of global middle class by 2030, Report says
 Strictly embargoed until 14 March 2013, 12:00 PM EDT (New York), 4:00 PM GMT (London) Asia-Pacific to comprise two-thirds of global middle class by 2030, Report says 2013 Human Development Report says
CHAPTER I: SIZE AND GEOGRAPHICAL DISTRIBUTION OF THE POPULATION
 CHAPTER I: SIZE AND GEOGRAPHICAL DISTRIBUTION OF THE POPULATION 1. Trends in the Population of Japan The population of Japan is 127.77 million. It increased by 0.7% over the five-year period, the lowest
BY Amy Mitchell, Katie Simmons, Katerina Eva Matsa and Laura Silver. FOR RELEASE JANUARY 11, 2018 FOR MEDIA OR OTHER INQUIRIES:
 FOR RELEASE JANUARY 11, 2018 BY Amy Mitchell, Katie Simmons, Katerina Eva Matsa and Laura Silver FOR MEDIA OR OTHER INQUIRIES: Amy Mitchell, Director, Journalism Research Katie Simmons, Associate Director,
The Demography of the Labor Force in Emerging Markets
 The Demography of the Labor Force in Emerging Markets David Lam I. Introduction This paper discusses how demographic changes are affecting the labor force in emerging markets. As will be shown below, the
Inclusive global growth: a framework to think about the post-2015 agenda
 Inclusive global growth: a framework to think about the post-215 agenda François Bourguignon Paris School of Economics Angus Maddison Lecture, Oecd, Paris, April 213 1 Outline 1) Inclusion and exclusion
HIGHLIGHTS. There is a clear trend in the OECD area towards. which is reflected in the economic and innovative performance of certain OECD countries.
 HIGHLIGHTS The ability to create, distribute and exploit knowledge is increasingly central to competitive advantage, wealth creation and better standards of living. The STI Scoreboard 2001 presents the
Economic Growth, Foreign Investments and Economic Freedom: A Case of Transition Economy Kaja Lutsoja
 Economic Growth, Foreign Investments and Economic Freedom: A Case of Transition Economy Kaja Lutsoja Tallinn School of Economics and Business Administration of Tallinn University of Technology The main
Business environment analysis of Romania
 MPRA Munich Personal RePEc Archive Business environment analysis of Romania Darius Stan Research Institute of Agricultural Economics and Rural Development - ASAS 20 November 2014 Online at https://mpra.ub.uni-muenchen.de/61761/
Part 1: The Global Gender Gap and its Implications
 the region s top performers on Estimated earned income, and has also closed the gender gap on Professional and technical workers. Botswana is among the best climbers Health and Survival subindex compared
Emerging Market Consumers: A comparative study of Latin America and Asia-Pacific
 Emerging Market Consumers: A comparative study of Latin America and Asia-Pacific Euromonitor International ESOMAR Latin America 2010 Table of Contents Emerging markets and the global recession Demographic
Global Economic Trends in the Coming Decades 簡錦漢. Kamhon Kan 中研院經濟所. Academia Sinica /18
 1/18 Global Economic Trends in the Coming Decades Kamhon Kan Academia Sinica 簡錦漢 中研院經濟所 2017.09.22 2/18 Global Economic Trends in the Coming Decades New top ten & new economic powers Emerging Asia Mediocre
Globalisation and Open Markets
 Wolfgang LEHMACHER Globalisation and Open Markets July 2009 What is Globalisation? Globalisation is a process of increasing global integration, which has had a large number of positive effects for nations
KPMG: 2013 Change Readiness Index Assessing countries' ability to manage change and cultivate opportunity
 KPMG: 2013 Change Readiness Index Assessing countries' ability to manage change and cultivate opportunity Graeme Harrison, Jacqueline Irving and Daniel Miles Oxford Economics The International Consortium
POLICY OPTIONS AND CHALLENGES FOR DEVELOPING ASIA PERSPECTIVES FROM THE IMF AND ASIA APRIL 19-20, 2007 TOKYO
 POLICY OPTIONS AND CHALLENGES FOR DEVELOPING ASIA PERSPECTIVES FROM THE IMF AND ASIA APRIL 19-20, 2007 TOKYO RISING INEQUALITY AND POLARIZATION IN ASIA ERIK LUETH INTERNATIONAL MONETARY FUND Paper presented
Economic Development and Transition
 Economic Development and Transition Developed Nations and Less Developed Countries Developed Nations Developed nations are nations with higher average levels of material well-being. Less Developed Countries
Q SHOPPER INDEX
 Q4.2018 SHOPPER INDEX PREFACE INDEX According to the UN s World Tourism Organization, global tourist arrivals grew by 7% in 2017, to over 1.3 billion 1. Index scores that are above 100 indicate countries
31% - 50% Cameroon, Paraguay, Cambodia, Mexico
 EStimados Doctores: Global Corruption Barometer 2005 Transparency International Poll shows widespread public alarm about corruption Berlin 9 December 2005 -- The 2005 Global Corruption Barometer, based
ECONOMIC GROWTH* Chapt er. Key Concepts
 Chapt er 6 ECONOMIC GROWTH* Key Concepts The Basics of Economic Growth Economic growth is the expansion of production possibilities. The growth rate is the annual percentage change of a variable. The growth
The globalization of inequality
 The globalization of inequality François Bourguignon Paris School of Economics Public lecture, Canberra, May 2013 1 "In a human society in the process of unification inequality between nations acquires
POLI 12D: International Relations Sections 1, 6
 POLI 12D: International Relations Sections 1, 6 Spring 2017 TA: Clara Suong Chapter 10 Development: Causes of the Wealth and Poverty of Nations The realities of contemporary economic development: Billions
Levels and trends in international migration
 Levels and trends in international migration The number of international migrants worldwide has continued to grow rapidly over the past fifteen years reaching million in 1, up from million in 1, 191 million
APPENDIX 1: MEASURES OF CAPITALISM AND POLITICAL FREEDOM
 1 APPENDIX 1: MEASURES OF CAPITALISM AND POLITICAL FREEDOM All indicators shown below were transformed into series with a zero mean and a standard deviation of one before they were combined. The summary
GLOBAL RISKS OF CONCERN TO BUSINESS WEF EXECUTIVE OPINION SURVEY RESULTS SEPTEMBER 2017
 GLOBAL RISKS OF CONCERN TO BUSINESS WEF EXECUTIVE OPINION SURVEY RESULTS SEPTEMBER 2017 GLOBAL RISKS OF CONCERN TO BUSINESS Results from the World Economic Forum Executive Opinion Survey 2017 Survey and
China and India:Convergence and Divergence
 China and India:Convergence and Divergence I. "What China is good at, India is not and vice versa. The countries are inverted mirror of each other».. «very real possibility that China and India will in
How Extensive Is the Brain Drain?
 How Extensive Is the Brain Drain? By William J. Carrington and Enrica Detragiache How extensive is the "brain drain," and which countries and regions are most strongly affected by it? This article estimates
THAILAND SYSTEMATIC COUNTRY DIAGNOSTIC Public Engagement
 THAILAND SYSTEMATIC COUNTRY DIAGNOSTIC Public Engagement March 2016 Contents 1. Objectives of the Engagement 2. Systematic Country Diagnostic (SCD) 3. Country Context 4. Growth Story 5. Poverty Story 6.
GaveKalDragonomics China Insight Economics
 GaveKalDragonomics China Insight 6 September 211 Andrew Batson Research director abatson@gavekal.com Is China heading for the middle-income trap? All fast-growing economies slow down, eventually. Since
C OVER STORY OVERPOPULATION: MYTHS AND REALITY. Text: Olga Irisova
 C OVER STORY OVERPOPULATION: MYTHS AND REALITY Text: Olga Irisova 1/11 W OR LD EC ONOMIC JOURNAL #11 2013 OVER THE PAST 54 YEARS, THE EARTH S POPULATION HAS MORE THAN DOUBLED, AND ACCORDING TO A RECENT
Trends in international higher education
 Trends in international higher education 1 Schedule Student decision-making Drivers of international higher education mobility Demographics Economics Domestic tertiary enrolments International postgraduate
Charting South Korea s Economy, 1H 2017
 Charting South Korea s Economy, 1H 2017 Designed to help executives interpret economic numbers and incorporate them into company s planning. Publication Date: January 3 rd, 2017 Next Issue: To be published
Stuck in Transition? STUCK IN TRANSITION? TRANSITION REPORT Jeromin Zettelmeyer Deputy Chief Economist. Turkey country visit 3-6 December 2013
 TRANSITION REPORT 2013 www.tr.ebrd.com STUCK IN TRANSITION? Stuck in Transition? Turkey country visit 3-6 December 2013 Jeromin Zettelmeyer Deputy Chief Economist Piroska M. Nagy Director for Country Strategy
International Egg Market Annual Review
 07 International Egg Market Annual Review Global and regional development of egg production TABLE 1 2005 COUNTRY PRODUCTION SHARE (1,000 T) (%) 2006 COUNTRY PRODUCTION SHARE (1,000 T) (%) TABLE 2 COUNTRY
WSDC 2010: THE DRAW ROUND ZERO. PROPOSITION versus OPPOSITION NIGERIA CYPRUS CROATIA BULGARIA LEBANON PALESTINE BOSNIA AND HERZEGOVINA RUSSIA
 WSDC 2010: THE DRAW ROUND ZERO IMPROMPTU CYPRUS NIGERIA BULGARIA CROATIA LEBANON PALESTINE BOSNIA AND HERZEGOVINA RUSSIA ROUND ONE THAT WE SHOULD SUPPORT MILITARY INTERVENTION IN SOMALIA INDIA IRELAND
Chapter 11. Trade Policy in Developing Countries
 Chapter 11 Trade Policy in Developing Countries Preview Import-substituting industrialization Trade liberalization since 1985 Trade and growth: Takeoff in Asia Copyright 2015 Pearson Education, Inc. All
UNLOCKING GROWTH AND PROSPERITY. The Global Rule of Law and Business Dashboard 2017
 UNLOCKING GROWTH AND PROSPERITY The Global Rule of Law and Business Dashboard 2017 The U.S. Chamber of Commerce is the world s largest business federation representing the interests of more than 3 million
Charting Indonesia s Economy, 1H 2017
 Charting Indonesia s Economy, 1H 2017 Designed to help executives interpret economic numbers and incorporate them into company s planning. Publication Date: January 3 rd, 2017 Next Issue: To be published
Rising Income Inequality in Asia
 Ryan Lam Economist ryancwlam@hangseng.com Joanne Yim Chief Economist joanneyim@hangseng.com 14 June 2012 Rising Income Inequality in Asia Why inequality matters Recent empirical studies suggest the trade-off
Summary of the Results
 Summary of the Results CHAPTER I: SIZE AND GEOGRAPHICAL DISTRIBUTION OF THE POPULATION 1. Trends in the Population of Japan The population of Japan is 127.77 million. It increased by 0.7% over the five-year
Global Consumer Confidence
 Global Consumer Confidence The Conference Board Global Consumer Confidence Survey is conducted in collaboration with Nielsen 1ST QUARTER 2018 RESULTS CONTENTS Global Highlights Asia-Pacific Africa and
Emerging and Developing Economies Much More Optimistic than Rich Countries about the Future
 Emerging and Developing Economies Much More Optimistic than Rich Countries about the Future October 9, 2014 Education, Hard Work Considered Keys to Success, but Inequality Still a Challenge As they continue
ECON 1000 Contemporary Economic Issues (Spring 2018) Economic Growth
 Economic Growth") ECON 1000 Contemporary Economic Issues (Spring 2018) Economic Growth Relevant Readings from the Required Textbooks: Chapter 7, Gross Domestic Product and Economic Growth Definitions and Concepts: economic
ECON 1000 Contemporary Economic Issues (Spring 2018) Economic Growth Relevant Readings from the Required Textbooks: Chapter 7, Gross Domestic Product and Economic Growth Definitions and Concepts: economic
WORLDWIDE DISTRIBUTION OF PRIVATE FINANCIAL ASSETS
 WORLDWIDE DISTRIBUTION OF PRIVATE FINANCIAL ASSETS Munich, November 2018 Copyright Allianz 11/19/2018 1 MORE DYNAMIC POST FINANCIAL CRISIS Changes in the global wealth middle classes in millions 1,250
Issues in Education and Lifelong Learning: Spending, Learning Recognition, Immigrants and Visible Minorities
 Issues in Education and Lifelong Learning: Spending, Learning Recognition, Immigrants and Visible Minorities Dr. Michael Bloom Executive Director, Strategic Projects, & Director, Education and Learning
Charting Philippines Economy, 1H 2017
 Charting Philippines Economy, 1H 2017 Designed to help executives interpret economic numbers and incorporate them into company s planning. Publication Date: January 3 rd, 2017 Next Issue: To be published
Charting Singapore s Economy, 1H 2017
 Charting Singapore s Economy, 1H 2017 Designed to help executives interpret economic numbers and incorporate them into company s planning. Publication Date: January 3 rd, 2017 Next Issue: To be published
A Global Perspective on Socioeconomic Differences in Learning Outcomes
 2009/ED/EFA/MRT/PI/19 Background paper prepared for the Education for All Global Monitoring Report 2009 Overcoming Inequality: why governance matters A Global Perspective on Socioeconomic Differences in
Rewriting the Rules of the Market Economy to Achieve Shared Prosperity. Joseph E. Stiglitz New York June 2016
 Rewriting the Rules of the Market Economy to Achieve Shared Prosperity Joseph E. Stiglitz New York June 2016 Enormous growth in inequality Especially in US, and countries that have followed US model Multiple
Cambridge International Examinations Cambridge International Advanced Subsidiary and Advanced Level
 Cambridge International Examinations Cambridge International Advanced Subsidiary and Advanced Level *4898249870-I* GEOGRAPHY 9696/31 Paper 3 Advanced Human Options October/November 2015 INSERT 1 hour 30
Population Growth and California s Future. Hans Johnson
 Population Growth and California s Future Hans Johnson Outline California s rapid growth Population diversity Implications for policy 2 California Has a Large and Growing Population 40,000 Population (in
Global Trends in Location Selection Final results for 2005
 Global Business Services Plant Location International Global Trends in Location Selection Final results for 2005 September, 2006 Global Business Services Plant Location International 1. Global Overview
The term developing countries does not have a precise definition, but it is a name given to many low and middle income countries.
 Trade Policy in Developing Countries KOM, Chap 11 Introduction Import substituting industrialization Trade liberalization since 1985 Export oriented industrialization Industrial policies in East Asia The
The Conference Board Total Economy Database Summary Tables November 2016
 The Conference Board Total Economy Database Summary Tables November 2016 About This document contains a number of tables and charts outlining the most important trends from the latest update of the Total
IB Diploma: Economics. Section 4: Development Economics COURSE COMPANION. First Edition (2017)
") IB Diploma: Economics Section 4: Development Economics COURSE COMPANION First Edition (2017) Economic development... 3 Nature of economic growth and economic development... 3 Common Characteristics of
IB Diploma: Economics Section 4: Development Economics COURSE COMPANION First Edition (2017) Economic development... 3 Nature of economic growth and economic development... 3 Common Characteristics of
HSX: GROWTH OF GLOBAL MIDDLE CLASS
 HSX: GROWTH OF GLOBAL MIDDLE CLASS April 2017 CONTEXT: BROAD STROKES! The global middle class is rapidly growing, representing the third major expansion of the global middle class since 1800 (the first
OECD Strategic Education Governance A perspective for Scotland. Claire Shewbridge 25 October 2017 Edinburgh
 OECD Strategic Education Governance A perspective for Scotland Claire Shewbridge 25 October 2017 Edinburgh CERI overview What CERI does Generate forward-looking research analyses and syntheses Identify
ASEAN: THE AEC IS HERE, FINALLY 2030: NOMINAL GDP USD TRILLION US CHINA EURO AREA ASEAN JAPAN UK $20.8 $34.6 IN IN
 14: NOMINAL GDP USD TRILLION US EURO AREA CHINA JAPAN UK $2.9 $4.6 : THE AEC IS HERE, FINALLY $1.4 $13.4 $17.4 3: NOMINAL GDP USD TRILLION US CHINA EURO AREA JAPAN UK $6.8 $6.4 $8.5 $.8 $34.6 $33.6 $2.5
CHAPTER 12: The Problem of Global Inequality
 1. Self-interest is an important motive for countries who express concern that poverty may be linked to a rise in a. religious activity. b. environmental deterioration. c. terrorist events. d. capitalist
Charting Australia s Economy
 Charting Australia s Economy Designed to help executives catch up with the economy and incorporate macro impacts into company s planning. Annual subscription includes 2 semiannual issues published in June
BRICS and the economic decline of the old world,
 BRICS and the economic decline of the old world, 1990-2030 Arne Melchior, NUPI Background note for the ONS Summit 2012: The geopolitics of energy, August 2012. This note is made available at the project
geography Bingo Instructions
 Bingo Instructions Host Instructions: Decide when to start and select your goal(s) Designate a judge to announce events Cross off events from the list below when announced Goals: First to get any line
Charting Cambodia s Economy, 1H 2017
 Charting Cambodia s Economy, 1H 2017 Designed to help executives interpret economic numbers and incorporate them into company s planning. Publication Date: January 3 rd, 2017 HELPING EXECUTIVES AROUND
Chapter 10: Long-run Economic Growth: Sources and Policies
 Chapter 10: Long-run Economic Growth: Sources and Policies Yulei Luo SEF of HKU February 13, 2012 Learning Objectives 1. Define economic growth, calculate economic growth rates, and describe trends in
Income and Population Growth
 Supplementary Appendix to the paper Income and by Markus Brueckner and Hannes Schwandt November 2013 downloadable from: https://sites.google.com/site/markusbrucknerresearch/research-papers Table of Contents
Charting Cambodia s Economy
 Charting Cambodia s Economy Designed to help executives catch up with the economy and incorporate macro impacts into company s planning. Annual subscription includes 2 semiannual issues published in June
FACTOR PRICES AND INCOME DISTRIBUTION IN LESS INDUSTRIALISED ECONOMIES
 Blackwell Publishing AsiaMelbourne, AustraliaAEHRAustralian Economic History Review0004-8992 2006 The Authors; Journal compilation Blackwell Publishing Asia Pty Ltd and the Economic History Society of
Mexico: How to Tap Progress. Remarks by. Manuel Sánchez. Member of the Governing Board of the Bank of Mexico. at the. Federal Reserve Bank of Dallas
 Mexico: How to Tap Progress Remarks by Manuel Sánchez Member of the Governing Board of the Bank of Mexico at the Federal Reserve Bank of Dallas Houston, TX November 1, 2012 I feel privileged to be with
Round 1. This House would ban the use of zero-hour contracts. Proposition v. Opposition
 Round 1 This House would ban the use of zero-hour contracts New Zealand Bermuda Wales Romania Greece Estonia USA Scotland Slovakia Philippines Qatar Ireland Hungary Australia Japan Canada Sri Lanka Sweden
Ghana Lower-middle income Sub-Saharan Africa (developing only) Source: World Development Indicators (WDI) database.
 Source: World Development Indicators (WDI) database.") Knowledge for Development Ghana in Brief October 215 Poverty and Equity Global Practice Overview Poverty Reduction in Ghana Progress and Challenges A tale of success Ghana has posted a strong growth performance
Knowledge for Development Ghana in Brief October 215 Poverty and Equity Global Practice Overview Poverty Reduction in Ghana Progress and Challenges A tale of success Ghana has posted a strong growth performance
The Challenge of Inclusive Growth: Making Growth Work for the Poor
 2015/FDM2/004 Session: 1 The Challenge of Inclusive Growth: Making Growth Work for the Poor Purpose: Information Submitted by: World Bank Group Finance and Central Bank Deputies Meeting Cebu, Philippines
I. LEVELS AND TRENDS IN INTERNATIONAL MIGRANT STOCK
 I. LEVELS AND TRENDS IN INTERNATIONAL MIGRANT STOCK A. INTERNATIONAL MIGRANT STOCK BY DEVELOPMENT GROUP The Population Division estimates that, worldwide, there were 214.2 million international migrants
A Note on International Migrants Savings and Incomes
 September 24, 2014 A Note on International Migrants Savings and Incomes Supriyo De, Dilip Ratha, and Seyed Reza Yousefi 1 Annual savings of international migrants from developing countries are estimated
On the Future of Criminal Offender DNA Databases
 The Impact of DNA Technologies On the Future of Criminal Offender DNA Databases Presented by Tim Schellberg Gordon Thomas Honeywell Governmental Affairs Human Identification Solutions Conference Madrid,
Payments from government to people
 3 PAYMENTS Most people make payments such as for utility bills or domestic remittances. And most receive payments such as wages, other payments for work, or government transfers. The 2017 Global Findex
Demographic Changes and Economic Growth: Empirical Evidence from Asia
 Illinois Wesleyan University Digital Commons @ IWU Honors Projects Economics Department 2013 Demographic Changes and Economic Growth: Empirical Evidence from Asia Sijia Song Illinois Wesleyan University,
Globalisation: International Trade
 UK Globalisation: International Trade Summary Writing Copyright: These materials are photocopiable but we would appreciate it if all logos and web addresses were left on materials. Thank you. COPYRIGHT
Economic Geography Chapter 10 Development
 Economic Geography Chapter 10 Development Development: Key Issues 1. Why Does Development Vary Among Countries? 2. Where Are Inequalities in Development Found? 3. Why Do Countries Face Challenges to Development?
Chapter 11: Long-run Economic Growth: Sources and Policies
 Chapter 11: Long-run Economic Growth: Sources and Policies Yulei Luo SEF of HKU February 25, 2013 Learning Objectives 1. Define economic growth, calculate economic growth rates, and describe trends in
1. Global Disparities Overview
 1. Global Disparities Overview The world is not an equal place, and throughout history there have always been inequalities between people, between countries and between regions. Today the world s population