The Global Religious Landscape
|
|
|
- Pierce Hudson
- 6 years ago
- Views:
Transcription
1 GLOBAL CHRISTIANITY 1 DECEMBER 2012 The Global Religious Landscape A Report on the Size and Distribution of the World s Major Religious Groups as of 2010 pew templeton global religious futures project
2 THIS PAGE INTENTIONALLY BLANK
3 3 GLOBAL RELIGIOUS LANDSCAPE About the Pew Forum on Religion & Public Life This report was produced by the Pew Research Center s Forum on Religion & Public Life. The Pew Research Center is a nonpartisan fact tank that provides information on the issues, attitudes and trends shaping America and the world. The center conducts public opinion polling, demographic studies, content analysis and other empirical social science research. It does not take positions on policy issues. The Pew Forum on Religion & Public Life is a project of the Pew Research Center; it delivers timely, impartial information on the issues at the intersection of religion and public affairs in the U.S. and around the world. The Pew Research Center is an independently operated subsidiary of The Pew Charitable Trusts. The report is a collaborative effort based on the input and analysis of the following individuals: Primary Researchers Conrad Hackett, Demographer Brian J. Grim, Senior Researcher and Director of Cross-National Data Pew Forum Luis Lugo, Director Research Alan Cooperman, Associate Director, Research Juan Carlos Esparza Ochoa, Data Manager Chris Gao, Database Consultant Phillip Connor and Anne Fengyan Shi, Research Associates Noble Kuriakose, Research Analyst Editorial Sandra Stencel, Associate Director, Editorial Diana Yoo, Graphic Designer Tracy Miller, Editor Hilary Ramp, Assistant Editor Communications and Web Publishing Erin O Connell, Associate Director, Communications Stacy Rosenberg, Digital Project Manager Liga Plaveniece and Jemila Woodson, Communications Associates Joseph Liu, Web Producer Collaborating Researchers Marcin Stonawski, Vegard Skirbekk and Michaela Potančoková, Age and Cohort Change Project, International Institute for Applied Systems Analysis (IIASA) Guy Abel, Vienna Institute of Demography, Austrian Academy of Sciences Pew Research Center Andrew Kohut, President Paul Taylor, Executive Vice President Elizabeth Mueller Gross, Vice President Jessica Tennant, Informational Graphics Designer To see the online version of this report, visit Pew Research Center s Forum on Religion & Public Life 1615 L St., NW, Suite 700 Washington, D.C Phone (202) Fax (202) Pew Research Center
4 THIS PAGE INTENTIONALLY BLANK
5 5 GLOBAL RELIGIOUS LANDSCAPE Table of Contents Preface 7 Executive Summary 9 Christians 17 Muslims 21 Religiously Unafiliated 24 Hindus 28 Buddhists 31 Folk Religionists 34 Other Religons 38 Jews 42 Table: Religious Composition by Country 45 Appendix A: Methodology 51 Appendix B: Data Sources by Country 68 PAGE
6 THIS PAGE INTENTIONALLY BLANK
7 7 GLOBAL RELIGIOUS LANDSCAPE Preface Three years ago the Pew Research Center s Forum on Religion & Public Life launched an effort to generate up-to-date and fully sourced estimates of the current size and projected growth of the world s major religious groups. As part of this multi-phase project, the Pew Forum has assembled data on the size and geographic distribution of eight major religious groups including the religiously unafiliated as of These estimates are presented in this report. The estimates are based on a country-by-country analysis of data from more than 2,500 censuses, surveys and oficial population registers that were collected, evaluated and standardized by the staff of the Pew Forum over the past several years. Researchers at the International Institute for Applied Systems Analysis (IIASA) in Laxenburg, Austria, and at the Vienna Institute of Demography in Vienna, Austria, collaborated on the analysis. This effort is part of the Pew-Templeton Global Religious Futures project, which analyzes religious change and its impact on societies around the world. The project is jointly and generously funded by The Pew Charitable Trusts and the John Templeton Foundation. In order to present data that are comparable across countries, this study focuses on groups and individuals who identify themselves in censuses, large-scale surveys and other sources as being members of ive widely recognized world religions Buddhism, Christianity, Hinduism, Islam and Judaism. The study also includes estimates for the size and geographic distribution of three other groups: the religiously unafiliated (those who say they are atheists and agnostics, as well as people who do not identify with any particular religion in surveys); adherents of folk or traditional religions, including members of African traditional religions, Chinese folk religions, Native American religions and Australian aboriginal religions; and adherents of other religions. Some of the faiths that have been consolidated into the other religions category, such as the Baha i faith, Jainism, Sikhism, Shintoism and Taoism, have millions of adherents around the world. However, in the overwhelming majority of countries, these religions are not speciically measured in censuses and large-scale surveys. For example, among the census and survey data we found from recent decades, Sikhs are measured in fewer than 20 countries. In addition to providing estimates on the size and distribution of the world s major religions, this report also includes information on the religious groups median ages, both globally and in particular regions. The age composition of a religious group is one of several factors that inluence population growth, along with such factors as fertility and mortality rates, religious switching and migration. These factors will be explored in future Pew Forum reports. PREFACE
8 8 PEW FORUM ON RELIGION & PUBLIC LIFE The new study on the global religious landscape as of 2010 complements two previous reports by the Pew Forum on the size and distribution of the world s Christian and Muslim populations: Mapping the Global Muslim Population (October 2009) and Global Christianity (December 2011). A third report, The Future of the Global Muslim Population (January 2011), projects the future growth of the world s Muslim population through the year The Pew Forum is now collaborating with IIASA researchers to project the future growth of all major religious groups, including the religiously unafiliated. We expect to publish those projections in The primary researchers for The Global Religious Landscape: A Report on the Size and Distribution of the World s Major Religions as of 2010 are Pew Forum demographer Conrad Hackett and senior researcher Brian J. Grim, the Pew Forum s director of cross-national data. They received valuable research assistance from research analyst Noble Kuriakose and other Pew Forum staffers listed on the masthead of this report. We are also indebted to our colleagues at IIASA, Marcin Stonawski, Vegard Skirbekk and Michaela Potančoková, and to Guy Abel at the Vienna Institute of Demography. While the data collection and analysis were guided by our collaborators, the Pew Forum is solely responsible for the interpretation and reporting of the data. Luis Lugo, Director Alan Cooperman, Associate Director, Research
9 9 GLOBAL RELIGIOUS LANDSCAPE Executive Summary Worldwide, more than eight-in-ten people identify with a religious group. A comprehensive demographic study of more than 230 countries and territories conducted by the Pew Research Center s Forum on Religion & Public Life estimates that there are 5.8 billion religiously afiliated adults and children around the globe, representing 84% of the 2010 world population of 6.9 billion. The demographic study based on analysis of more than 2,500 censuses, surveys and population registers inds 2.2 billion Christians (32% of the world s population), 1.6 billion Muslims (23%), 1 billion Hindus (15%), nearly 500 million Buddhists (7%) and 14 million Jews (0.2%) around the world as of In addition, more than 400 million people (6%) practice various folk or traditional religions, including African traditional religions, Chinese folk religions, Native American religions and Australian aboriginal religions. An estimated 58 million people slightly less than 1% of the global population belong to other religions, including the Baha i faith, Jainism, Sikhism, Shintoism, Taoism, Tenrikyo, Wicca and Zoroastrianism, to mention just a few. 1 At the same time, the new study by the Pew Forum also inds that roughly one-in-six people around the globe (1.1 billion, or 16%) have no religious afiliation. This makes the unafiliated the third-largest religious group worldwide, behind Christians and Muslims, and about equal in size to the world s Catholic population. Surveys indicate that many of the unafiliated hold some religious or spiritual beliefs (such as belief in God or a universal spirit) even though they do not identify with a particular faith. (See page 24.) Size of Major Religious Groups, 2010 Percentage of the global population 31.5% Christians 0.8% Other Religions ** 0.2% Jews 23.2% Muslims *Includes followers of African traditional religions, Chinese folk religions, Native American religions and Australian aboriginal religions. **Includes Bahai s, Jains, Sikhs, Shintoists, Taoists, followers of Tenrikyo, Wiccans, Zoroastrians and many other faiths. Percentages may not add to 100 due to rounding. 5.9% Folk Religionists * 7.1% Buddhists 15.0% Hindus 16.3% Unaffiliated Pew Research Center s Forum on Religion & Public Life Global Religious Landscape, December Although some faiths in the other religions category have millions of adherents around the world, censuses and surveys in many countries do not measure them speciically. Estimates of the global size of these faiths generally come from other sources, such as the religious groups themselves. By far the largest of these groups are Sikhs, who number about 25 million, according to the World Religion Database. For more information, see Spotlight on Other Religions on page 40. EXECUTIVE SUMMARY
10 10 PEW FORUM ON RELIGION & PUBLIC LIFE Geographic Distribution The geographic distribution of religious groups varies considerably. Several religious groups are heavily concentrated in the Asia-Paciic region, including the vast majority of Hindus (99%), Buddhists (99%), adherents of folk or traditional religions (90%) and members of other world religions (89%). Three-quarters of the religiously unafiliated (76%) also live in the massive and populous Asia- Paciic region. Indeed, the number of religiously unafiliated people in China alone (about 700 million) is more than twice the total population of the United States. The Asia-Paciic region also is home to most of the world s Muslims (62%). About 20% of Muslims live in the Middle East and North Africa, and nearly 16% reside in sub-saharan Africa. Of the major religious groups covered in this study, Christians are the most evenly dispersed. Roughly equal numbers of Christians live in Europe (26%), Latin America and the Caribbean (24%) and sub-saharan Africa (24%). Geographic Distribution of Religious Groups Percentage of each group s total population that lives in particular regions Overall global population Asia-Pacific Sub-Saharan Africa Europe North America Latin America Middle East- North Africa 58.8% Hindus Buddhists Folk Religionists * Other Religions ** Unaffiliated Muslims Christians Jews 0.0% 100% More detailed bar charts, with percentages labeled, appear in the chapters on each of the eight religious groups. For example, the chart showing the 12.3% percentage of Christians living in each region appears on page 17. *Includes followers of African traditional religions, Chinese folk religions, Native American religions and Australian aboriginal religions. **Includes Bahai s, Jains, Sikhs, Shintoists, Taoists, followers of Tenrikyo, Wiccans, Zoroastrians and many other faiths. Percentages may not add to 100 due to rounding. Pew Research Center s Forum on Religion & Public Life Global Religious Landscape, December
11 11 GLOBAL RELIGIOUS LANDSCAPE A plurality of Jews (44%) live in North America, while about four-in-ten (41%) live in the Middle East and North Africa almost all of them in Israel. Living as Majorities and Minorities Nearly three-quarters (73%) of the world s people live in countries in which their religious group makes up a majority of the population. Only about a quarter (27%) of all people live as religious minorities. (This igure does not include subgroups of the eight major groups in this study, such as Shia Muslims living in Sunni-majority countries or Catholics living in Protestant-majority countries.) Majority or Minority Percentage of each religious group that lives in countries where its adherents are a majority or a minority LIVING AS MAJORITY Hindus 97% 3% Christians Muslims Unaffiliated Jews Buddhists Folk Religionists* <1 LIVING AS MINORITY >99 Overwhelmingly, Hindus and Christians tend to live in countries where they are in the majority. Fully 97% of all Hindus live in the world s three Hindu-majority countries (India, Mauritius Other religions** and Nepal), and nearly nine-in-ten Christians (87%) are found in the world s 157 Christianmajority countries. (To see the religious composition of each country, see the table on page 45.) *Includes followers of African traditional religions, Chinese folk religions, Native American religions and Australian aboriginal religions. **Includes Bahai s, Jains, Sikhs, Shintoists, Taoists, followers of Tenrikyo, Wiccans, Zoroastrians and many other faiths. Percentages may not add to 100 due to rounding. Pew Research Center s Forum on Religion & Public Life Global Religious Landscape, December 2012 Though by smaller margins, most Muslims (73%) and religiously unafiliated people (71%) also live in countries in which they are the predominant religious group. Muslims are a majority in 49 countries, including 19 of the 20 countries in the Middle East and North Africa. The religiously unafiliated make up a majority of the population in six countries, of which China is by far the largest. (The others are the Czech Republic, Estonia, Hong Kong, Japan and North Korea.) Most members of the other major religious groups live in countries in which they are in the minority. Seven-in-ten Buddhists (72%), for example, live as religious minorities. Just three- EXECUTIVE SUMMARY
12
13 13 GLOBAL RELIGIOUS LANDSCAPE Median Age of Religious Groups, years Global median 28 years Muslims Hindus Christians Other Religions ** Folk Unaffiliated Buddhists Jews Religionists * Religious groups are ordered by median age from youngest to oldest. *Includes followers of African traditional religions, Chinese folk religions, Native American religions and Australian aboriginal religions. **Includes Bahai s, Jains, Sikhs, Shintoists, Taoists, followers of Tenrikyo, Wiccans, Zoroastrians and many other faiths. Pew Research Center s Forum on Religion & Public Life Global Religious Landscape, December 2012 Young and Old Some religions have much younger populations, on average, than others. In part, the age differences relect the geographic distribution of religious groups. Those with a large share of adherents in fast-growing, developing countries tend to have younger populations. Those concentrated in China and in advanced industrial countries, where population growth is slower, tend to be older. The median age of two major groups Muslims (23 years) and Hindus (26) is younger than the median age of the world s overall population (28). 3 All the other groups are older than the global median. Christians have a median age of 30, followed by members of other religions (32), adherents of folk or traditional religions (33), the religiously unafiliated (34) and Buddhists (34). Jews have the highest median age (36), more than a dozen years older than the youngest group, Muslims. 3 The median in a population is the midpoint when the entire population is ordered by some characteristic, such as age or income. If everyone alive in 2010 lined up from youngest to oldest, the person in the middle (the median) would be 28 years old. EXECUTIVE SUMMARY
14 14 PEW FORUM ON RELIGION & PUBLIC LIFE About the Study These are among the key indings of a new study of the global religious landscape conducted by the Pew Forum on Religion & Public Life as part of the Pew-Templeton Global Religious Futures project, which analyzes religious change and its impact on societies around the world. The demographic study explores the size, geographic distribution and median age of eight major religious groups including the unafiliated that together represent 100% of the estimated 2010 global population. The study is based on a country-by-country analysis of data from more than 2,500 national censuses, large-scale surveys and oficial population registers that were collected, evaluated and standardized by the Pew Forum s demographers and other research staff. 4 Many countries have recently conducted a national census or are in the midst of doing so. Therefore, new data are likely to emerge over the next few years. However, a datacollection cut-off had to be made at some point; this report is based on information available as of early For estimates of the religious composition of individual countries, see table on page 45. For details on the methodology used to produce estimates of religious populations in 232 countries and territories, see Appendix A. For a list of data sources by country, see Appendix B. To see each country s and territory s population broken down by number and percentage into the eight major religious groups in the study, see the sortable tables at pewforum.org/grl/population-number.php. There are some minor differences between the estimates presented in this study and previous Pew Forum estimates of Christian and Muslim populations around the world. These differences relect the availability of new data sources, such as recently released censuses in a few countries, and the use of population growth projections to update estimates in countries with older primary sources. (For more details, see page 64 in the Methodology.) 4 A population register is a list of all permanent residents of a country. See the United Nations Statistics Division s description of population registers ( unstats.un.org/unsd/demographic/sources/popreg/popregmethods.htm). 5 For instance, in December 2012, just before the release of this report, new religion data were released from the 2011 Census of England and Wales. The new data suggest a slightly different religious landscape than the estimate made by this study for the broader United Kingdom (England, Wales, Scotland and Northern Ireland), which is based primarily on the 2010 Annual Population Survey carried out by the U.K. s Ofice for National Statistics.
15 15 GLOBAL RELIGIOUS LANDSCAPE Deining the Religious Groups This study is based on self-identiication. It seeks to estimate the number of people around the world who view themselves as belonging to various religious groups. It does not attempt to measure the degree to which members of these groups actively practice their faiths or how religious they are. In order to obtain statistics that are comparable across countries, the study attempts to count groups and individuals who self-identify as members of ive widely recognized world religions Buddhists, Christians, Hindus, Muslims and Jews as well as people associated with three other religious categories that may be less familiar: Folk or Traditional Religions Folk religions are closely tied to a particular people, ethnicity or tribe. In some cases, elements of other world religions are blended with local beliefs and customs. These faiths often have no formal creeds or sacred texts. Examples of folk religions include African traditional religions, Chinese folk religions, Native American religions and Australian aboriginal religions. The Religiously Unafiliated The religiously unafiliated population includes atheists, agnostics and people who do not identify with any particular religion in surveys. However, many of the religiously unafiliated do hold religious or spiritual beliefs. For example, various surveys have found that belief in God or a higher power is shared by 7% of unafiliated Chinese adults, 30% of unafiliated French adults and 68% of unafiliated U.S. adults. 6 Other Religions The other religions category is diverse and comprises groups not classiied elsewhere. This category includes followers of religions that often are not measured separately in censuses and surveys: the Baha i faith, Jainism, Shintoism, Sikhism, Taoism, Tenrikyo, Wicca, Zoroastrianism and many other religions. Because of the lack of data on these faiths in many countries, the Pew Forum has not attempted to estimate the size of individual religions within this category, though some rough estimates are available from other sources. (See Spotlight on Other Religions on page 40.) 6 For more information on the beliefs and practices of religiously unafiliated adults in the United States, see the Pew Forum s October 2012 report Nones on the Rise. The Pew Forum s U.S. surveys typically ask about belief in God or a universal spirit. French results are based on a Pew Forum analysis of 2008 International Social Survey Programme (ISSP) data. The ISSP survey asks about belief in God or a higher power of some kind. Chinese results are based on a Pew Forum analysis of the 2007 Spiritual Life Study of Chinese Residents, conducted by the Chinese polling irm Horizon. In China, the belief in God statistic measures belief in God, gods, spirits, ghosts or Buddha. EXECUTIVE SUMMARY
16 16 PEW FORUM ON RELIGION & PUBLIC LIFE Roadmap to the Report These and other indings are discussed in more detail in the remainder of this report, which is divided into eight sections one for each of the major religious groupings, in order of size: Christians Muslims Religiously Unafiliated Hindus Buddhists Folk Religionists Other Religions Jews To discuss the geographic distribution of religious groups, this report divides the world into six major regions: Asia and the Paciic, Europe, Latin America and the Caribbean, the Middle East and North Africa, North America and sub-saharan Africa. For a list of countries in each region, see the Methodology.
17
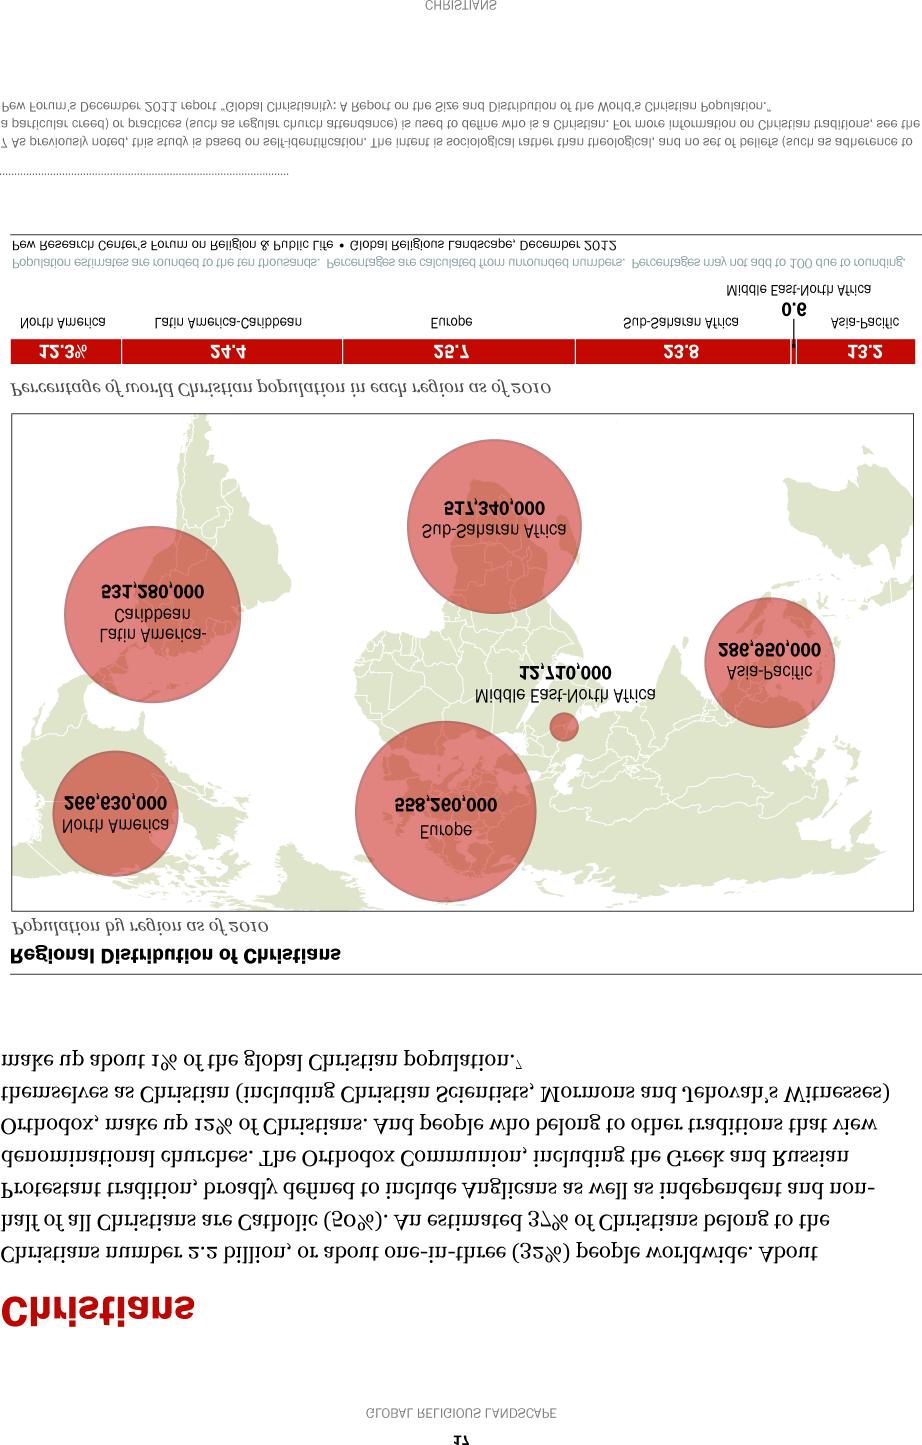
18 18 PEW FORUM ON RELIGION & PUBLIC LIFE Christianity has spread far from its historical origins and is geographically widespread. Indeed, the vast majority of Christians (99%) live outside the Middle East-North Africa region where Christianity began. The greatest share of the global Christian population is in Europe (26%), followed closely by Latin America and the Caribbean (24%) and sub-saharan Africa (24%). Signiicant numbers of Christians also live in Asia and the Paciic (13%) and North America (12%). Less than 1% of the world s Christians are found in the Middle East and North Africa. W orld Christian Population by Region ESTIMA T E D 2010 CHRISTIAN POPULATION ESTIMATED 2010 TOTAL POPULATION AGE OF POPULATION THAT IS CHRISTIAN Europe 558,260, ,550, % Latin America-Caribbean 531,280, ,080, Sub-Saharan Africa 517,340, ,720, Asia-Paciic 286,950,000 4,054,990, North America 266,630, ,530, Middle East-North Africa 12,710, ,020, World Total 2,173,180,000 6,895,890, Population estimates are rounded to the ten thousands. Percentages are calculated from unrounded numbers. Figures may not add exactly due to rounding. Pew Research Center s Forum on Religion & Public Life Global Religious Landscape, December Countries with the Largest Number of Christians ESTIMATED 2010 CHRISTIAN POPULATION AGE OF POPULATION THAT IS CHRISTIAN AGE OF WORLD CHRISTIAN POPULATION United States 243,060, % 11.2 % Brazil 173,300, Mexico 107,910, Russia 104,750, Philippines 86,370, Nigeria 78,050, China 68,410, Democratic Republic of the Congo 63,210, Germany 56,540, Ethiopia 52,070, Subtotal for the 10 Countries 1,033,670, Subtotal for Rest of World 1,139,500, World Total 2,173,180, Population estimates are rounded to the ten thousands. Percentages are calculated from unrounded numbers. Figures may not add exactly due to rounding. Pew Research Center s Forum on Religion & Public Life Global Religious Landscape, December
19 19 GLOBAL RELIGIOUS LANDSCAPE Among the six regions analyzed in this study, four have Christian majorities: Latin America and the Caribbean (90%), North America (77%), Europe (75%) and sub-saharan Africa (63%). Christians live as minorities in the Asia-Paciic region (7%) and the Middle East-North Africa region (4%). The 10 countries with the largest number of Christians account for about half (48%) of the global Christian population. The largest share of all Christians live in the United States (11%), followed by Brazil (8%), Mexico (5%), Russia (5%), the Philippines (4%), Nigeria (4%), China (3%), the Democratic Republic of the Congo (3%), Germany (3%) and Ethiopia (2%). Most Christians (87%) live in countries where Christians are in the majority. Of the 232 countries and territories included in this study, 157 have Christian majorities. However, most of the Christian-majority countries have relatively small populations: about seven-in-ten have fewer Christians than the Christian-minority country of Vietnam (7 million Christians). Median Age As a whole, Christians are older (median age of 30) than the overall global population (median age of 28). Among the six regions analyzed in this study, Christians are youngest in sub- Saharan Africa (median age of 19), followed by Latin America and the Caribbean (27), Asia and the Paciic (28), the Middle East and North Africa (29) and North America (39). Europe has the oldest Christian population (42). Regional Median Ages of Christians Compared with Overall Median Ages, years 40 Christian median age in region Regional median age Christian median age 30 years Sub-Saharan Africa Latin America- Caribbean Asia- Pacific Middle East- North Africa North America Europe Regions are ordered by median age of Christians from youngest to oldest. Median age is not presented when reliable age structure data are unavailable. Pew Research Center s Forum on Religion & Public Life Global Religious Landscape, December 2012 CHRISTIANS
20 20 PEW FORUM ON RELIGION & PUBLIC LIFE Christians are older than the general population in four regions: the Middle East and North Africa (where the Christian median is 29 years and the general population median is 24 years), North America (39 vs. 37), Europe (42 vs. 40), and sub-saharan Africa (19 vs. 18). Christians have the same median age as the general population in Latin America and the Caribbean (27). Christians are younger than the general population in the Asia-Paciic region (28 vs. 29).
21
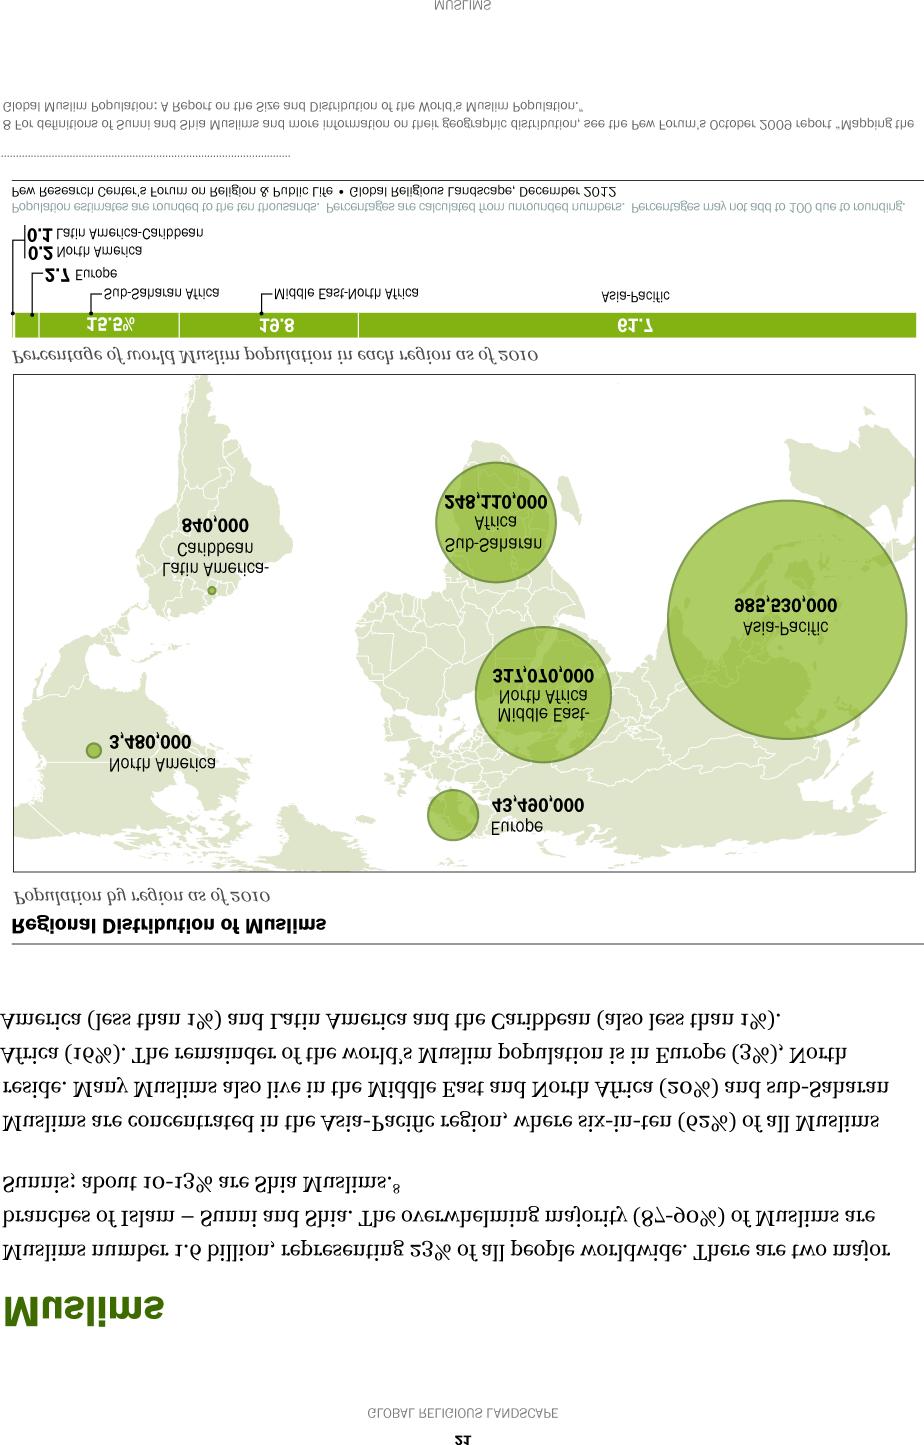
22 22 PEW FORUM ON RELIGION & PUBLIC LIFE Although a majority of the world s Muslims live in Asia and the Paciic, only about one-in-four people (24%) in that region are Muslims. By contrast, the Middle East-North Africa region has an overwhelmingly Muslim population (93%), but they represent only about 20% of the world s Muslims. Muslims also make up about three-in-ten people in sub-saharan Africa, 6% of those who live in Europe, 1% of North Americans, and less than 1% of the population of Latin America and the Caribbean. World Muslim Population by Region ESTIMATED 2010 MUSLIM POPULATION ESTIMATED 2010 TOTAL POPULATION AGE OF POPULATION THAT IS MUSLIM Asia-Paciic 985,530,000 4,054,990, % Middle East-North Africa 317,070, ,020, Sub-Saharan Africa 248,110, ,720, Europe 43,490, ,550, North America 3,480, ,530, Latin America-Caribbean 840, ,080, World Total 1,598,510,000 6,895,890, Population estimates are rounded to the ten thousands. Percentages are calculated from unrounded numbers. Figures may not add exactly due to rounding. Pew Research Center s Forum on Religion & Public Life Global Religious Landscape, December Countries with the Largest Number of Muslims ESTIMATED 2010 MUSLIM POPULATION AGE OF POPULATION THAT IS MUSLIM AGE OF WORLD MUSLIM POPULATION Indonesia 209,120, % 13.1 % India 176,190, Pakistan 167,410, Bangladesh 133,540, Nigeria 77,300, Egypt 76,990, Iran 73,570, Turkey 71,330, Algeria 34,730, Morocco 31,940, Subtotal for the 10 Countries 1,052,120, Subtotal for Rest of World 546,400, World Total 1,598,510, Population estimates are rounded to the ten thousands. Percentages are calculated from unrounded numbers. Figures may not add exactly due to rounding. Pew Research Center s Forum on Religion & Public Life Global Religious Landscape, December
23 23 GLOBAL RELIGIOUS LANDSCAPE The 10 countries with the largest number of Muslims are home to fully two-thirds (66%) of all Muslims. The largest share lives in Indonesia (13%), followed by India (11%), Pakistan (11%), Bangladesh (8%), Nigeria (5%), Egypt (5%), Iran (5%), Turkey (5%), Algeria (2%) and Morocco (2%). 9 Muslims make up a majority of the population in 49 countries. Nearly three-quarters of all Muslims (73%) live in these countries. Although Muslims are a minority in India (14% of the total population), India nonetheless has one of the largest Muslim populations in the world (in raw numbers). Median Age Globally, Muslims are younger (median age of 23) than the overall global population (median age of 28). Among the ive regions for which data are available, Muslims are youngest in sub-saharan Africa (median age of 17), followed by the Middle East and North Africa (23), Asia and the Paciic (24), North America (26) and Europe (32). Muslims are younger than the general population in each of the major regions for which data are available: North America (Muslims 26 years; general population 37 years), Europe (32 vs. 40), Asia and the Pacific (24 vs. 29), sub-saharan Africa (17 vs. 18) and the Middle East and North Africa (23 vs. 24). Regional Median Ages of Muslims Compared with Overall Median Ages, years 40 Muslim median age in region Regional median age Muslim median age 23 years 10 0 Sub-Saharan Africa Middle East- North Africa Asia- Pacific North America Europe Regions are ordered by median age of Muslims from youngest to oldest. Median age is not presented when reliable age structure data are unavailable. Pew Research Center s Forum on Religion & Public Life Global Religious Landscape, December India and Pakistan have Muslim populations of roughly similar size, and it is not entirely clear which is larger. The Pew Forum previously estimated that Pakistan had the world s second-largest Muslim population and India had the third-largest; see the Pew Forum s January 2011 report The Future of the Global Muslim Population and October 2009 report Mapping the Global Muslim Population. The difference between the rankings in this report and the previous reports is primarily due to a downward revision by the United Nations Population Division of its estimate of the size of Pakistan s total population and an upward revision of the U.N. estimate of India s total population. For more details, see the discussion in the Methodology. MUSLIMS
24
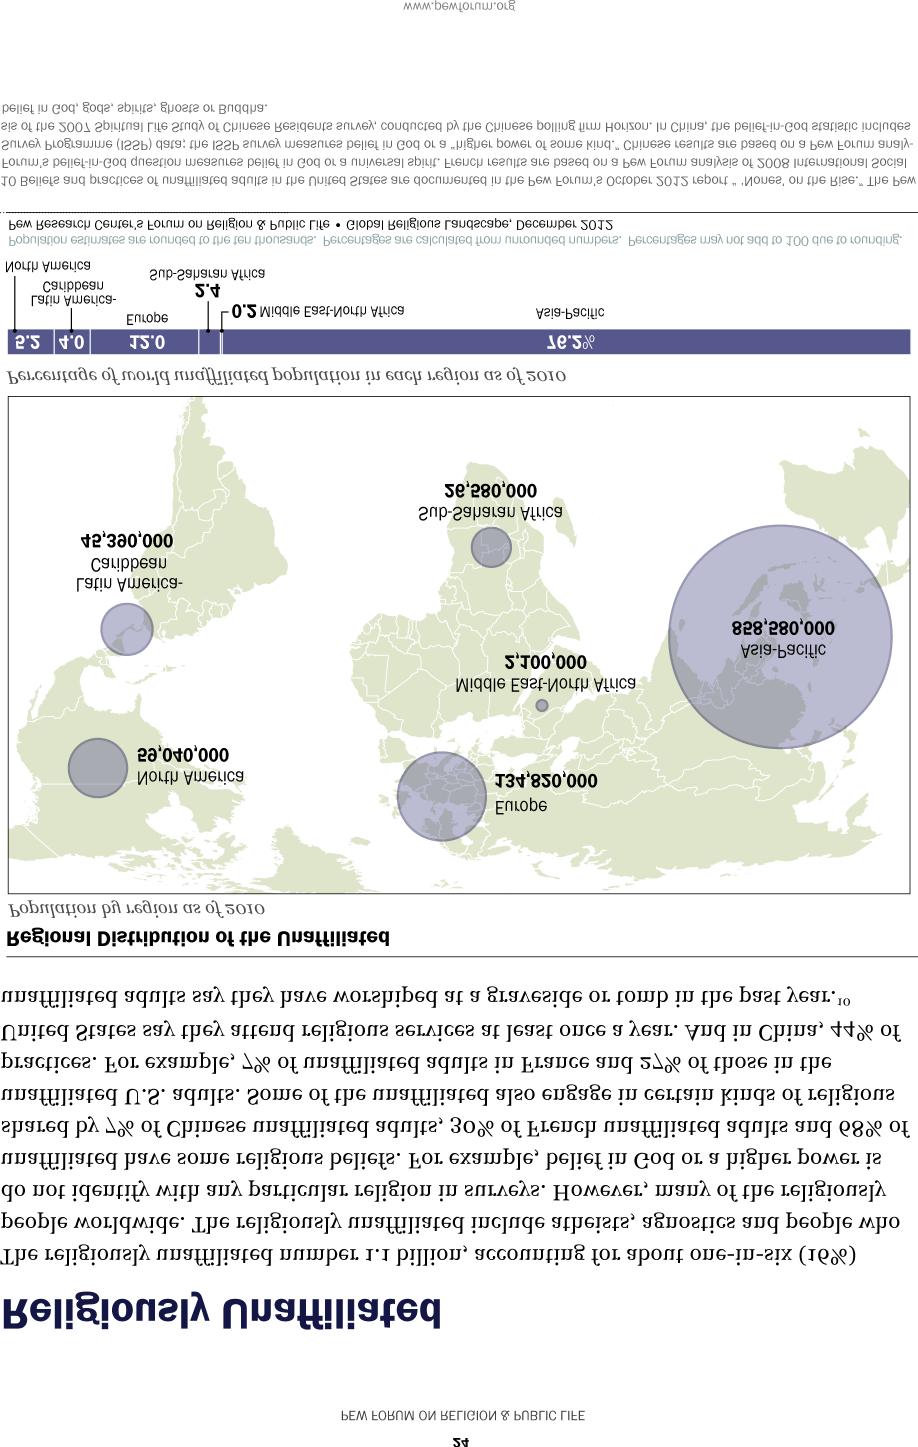
25 25 GLOBAL RELIGIOUS LANDSCAPE The religiously unafiliated are heavily concentrated in Asia and the Paciic, where more than three-quarters (76%) of the world s unafiliated population resides. The remainder is in Europe (12%), North America (5%), Latin America and the Caribbean (4%), sub-saharan Africa (2%) and the Middle East and North Africa (less than 1%). Although a majority of the religiously unafiliated live in Asia and the Paciic, only about onein-ive people (21%) in that region are unafiliated. More than one-in-six people in Europe World Unaffiliated Population by Region ESTIMATED 2010 UNAFFILIATED POPULATION ESTIMATED 2010 TOTAL POPULATION AGE OF POPULATION THAT IS UNAFFILIATED Asia-Paciic 858,580,000 4,054,990, % Europe 134,820, ,550, North America 59,040, ,530, Latin America-Caribbean 45,390, ,080, Sub-Saharan Africa 26,580, ,720, Middle East-North Africa 2,100, ,020, World Total 1,126,500,000 6,895,890, Population estimates are rounded to the ten thousands. Percentages are calculated from unrounded numbers. Figures may not add exactly due to rounding. Pew Research Center s Forum on Religion & Public Life Global Religious Landscape, December Countries with the Largest Number of Unaffiliated ESTIMATED 2010 UNAFFILIATED POPULATION AGE OF POPULATION THAT IS UNAFFILIATED AGE OF WORLD UNAFFILIATED POPULATION China 700,680, % 62.2 % Japan 72,120, United States 50,980, Vietnam 26,040, Russia 23,180, South Korea 22,350, Germany 20,350, France 17,580, North Korea 17,350, Brazil 15,410, Subtotal for the 10 Countries 966,040, Subtotal for Rest of World 160,460, World Total 1,126,500, Population estimates are rounded to the ten thousands. Percentages are calculated from unrounded numbers. Figures may not add exactly due to rounding. Pew Research Center s Forum on Religion & Public Life Global Religious Landscape, December 2012 RELIGIOUSLY UNAFFILIATED
26 26 PEW FORUM ON RELIGION & PUBLIC LIFE (18%) and North America (17%) are religiously unafiliated. The unafiliated make up smaller shares in the remaining regions. For instance, less than 1% of those who live in the Middle East-North Africa region are unafiliated. More than six-in-ten (62%) of all religiously unafiliated people live in one country, China. 11 The largest populations of the religiously unafiliated outside China are in Japan (6% of all unafiliated), the United States (5%), Vietnam (2%) and Russia (2%). There are six countries where the religiously unafiliated make up a majority of the population: the Czech Republic (76% are religiously unafiliated), North Korea (71%), Estonia (60%), Japan (57%), Hong Kong (56%) and China (52%). This report estimates that 16.4% of the total U.S. population (adults and children) was unafiliated as of However, recent Pew Research Center surveys found that, as of 2012, 19.6% of U.S. adults are unafiliated. The different indings relect both an increase in the percentage of U.S. adults who are religiously unafiliated and differences between the portion of adults and the portion of children in the U.S. who are unafiliated. Slightly higher shares of children than adults are estimated to have a religious afiliation. Regional Median Ages of the Unaffiliated Compared with Ov erall Median Ages, years Unaffiliated median age in region Regional median age Unaffiliated median age 34 years Sub-Saharan Africa Latin America- Caribbean North America Asia-Pacific Europe Regions are ordered by median age of the unaffiliated from youngest to oldest. Median age is not presented when reliable age structure data are unavailable. Pew Research Center s Forum on Religion & Public Life Global Religious Landscape, December China, the world s most populous country, also is home to a majority of followers of folk or traditional religions (73%) and Buddhists (62%).
27 27 GLOBAL RELIGIOUS LANDSCAPE Median Age Globally, the religiously unafiliated are older (median age of 34) than the overall global population (median age of 28). Among the ive regions for which data are available, sub- Saharan Africa has the youngest population of religiously unafiliated people (median age of 20), followed by Latin America and the Caribbean (26), North America (31) and Asia and the Paciic (35). Europe has the oldest unafiliated population, with a median age of 37. Median ages of the religiously unafiliated differ from the general population in each of the major regions for which data are available. In two regions, the religiously unafiliated are older than the general population: Asia and the Paciic (where the unafiliated median is 35 years and the general population median is 29 years) and sub-saharan Africa (20 vs. 18). In three regions, the religiously unafiliated are younger than the general population: North America (unafiliated 31 years; general population 37 years), Europe (37 vs. 40) and Latin America and the Caribbean (26 vs. 27). RELIGIOUSLY UNAFFILIATED

28
29 29 GLOBAL RELIGIOUS LANDSCAPE Although most Hindus live in Asia and the Paciic, only about one-in-four people (25%) across that vast and populous region are Hindu. Hindus make up less than 1% of the general population in the ive other major geographic regions. An overwhelming majority of Hindus (94%) live in one country, India. The largest populations of Hindus outside India are in Nepal (2% of all Hindus) and Bangladesh (1%). World Hindu Population by Region ESTIMATED 2010 HINDU POPULATION ESTIMATED 2010 TOTAL POPULATION AGE OF POPULATION THAT IS HINDU Asia-Paciic 1,025,470,000 4,054,990, % North America 2,250, ,530, Middle East-North Africa 1,720, ,020, Sub-Saharan Africa 1,670, ,720, Europe 1,290, ,550, Latin America-Caribbean 660, ,080, World Total 1,033,080,000 6,895,890, Population estimates are rounded to the ten thousands. Percentages are calculated from unrounded numbers. Figures may not add exactly due to rounding. Pew Research Center s Forum on Religion & Public Life Global Religious Landscape, December Countries with the Largest Number of Hindus ESTIMATED 2010 HINDU POPULATION AGE OF POPULATION THAT IS HINDU AGE OF WORLD HINDU POPULATION India 973,750, % 94.3 % Nepal 24,170, Bangladesh 13,520, Indonesia 4,050, Pakistan 3,330, Sri Lanka 2,830, United States 1,790, Malaysia 1,720, Burma (Myanmar) 820, United Kingdom 800, Subtotal for the 10 Countries 1,026,780, Subtotal for Rest of World 6,290, World Total 1,033,080, Population estimates are rounded to the ten thousands. Percentages are calculated from unrounded numbers. Figures may not add exactly due to rounding. Pew Research Center s Forum on Religion & Public Life Global Religious Landscape, December 2012 HINDUS
30 30 PEW FORUM ON RELIGION & PUBLIC LIFE Southern Asia a subregion deined by the U.N. Population Division as consisting of Afghanistan, Bangladesh, Bhutan, India, Iran, Maldives, Nepal, Pakistan and Sri Lanka is home to about 99% of the world s Hindu population. Overall, an estimated 60% of Southern Asia s total population is Hindu. Hindus form a majority in just three countries: Nepal (81%), India (80%) and Mauritius (56%). But 97% of all Hindus live in those countries, making Hindus the most likely of the religious groups in this study to live as a majority. Median Age As a whole, Hindus are younger (median age of 26) than the overall global population (median age of 28). Among the six regions analyzed in this study, the Asia-Paciic region has the youngest Hindu population (median age of 26), followed by sub-saharan Africa (30) and Latin America and the Caribbean (32). In three regions North America, the Middle East and North Africa and Europe Hindus have a median age of 33. Median ages of Hindus differ from the general population in each of the major geographic regions. In three regions, Hindus are older than the general population: sub-saharan Africa (where Hindus have a median age of 30 and the general population has a median age of 18), the Middle East and North Africa (33 vs. 24) and Latin America and the Caribbean (32 vs. 27). In three regions, Hindus are younger than the general population: Europe (Hindus 33, general population 40), North America (33 vs. 37) and Asia and the Paciic (26 vs. 29). Regional Median Ages of Hindus Compared with Overall Median Ages, years Hindu median age in region Regional median age Hindu median age 26 years 10 0 Asia- Pacific Sub-Saharan Africa Latin America- Caribbean North America Middle East- North Africa Europe Regions are ordered by median age of Hindus from youngest to oldest. Median age is not presented when reliable age structure data are unavailable. Pew Research Center s Forum on Religion & Public Life Global Religious Landscape, December
31
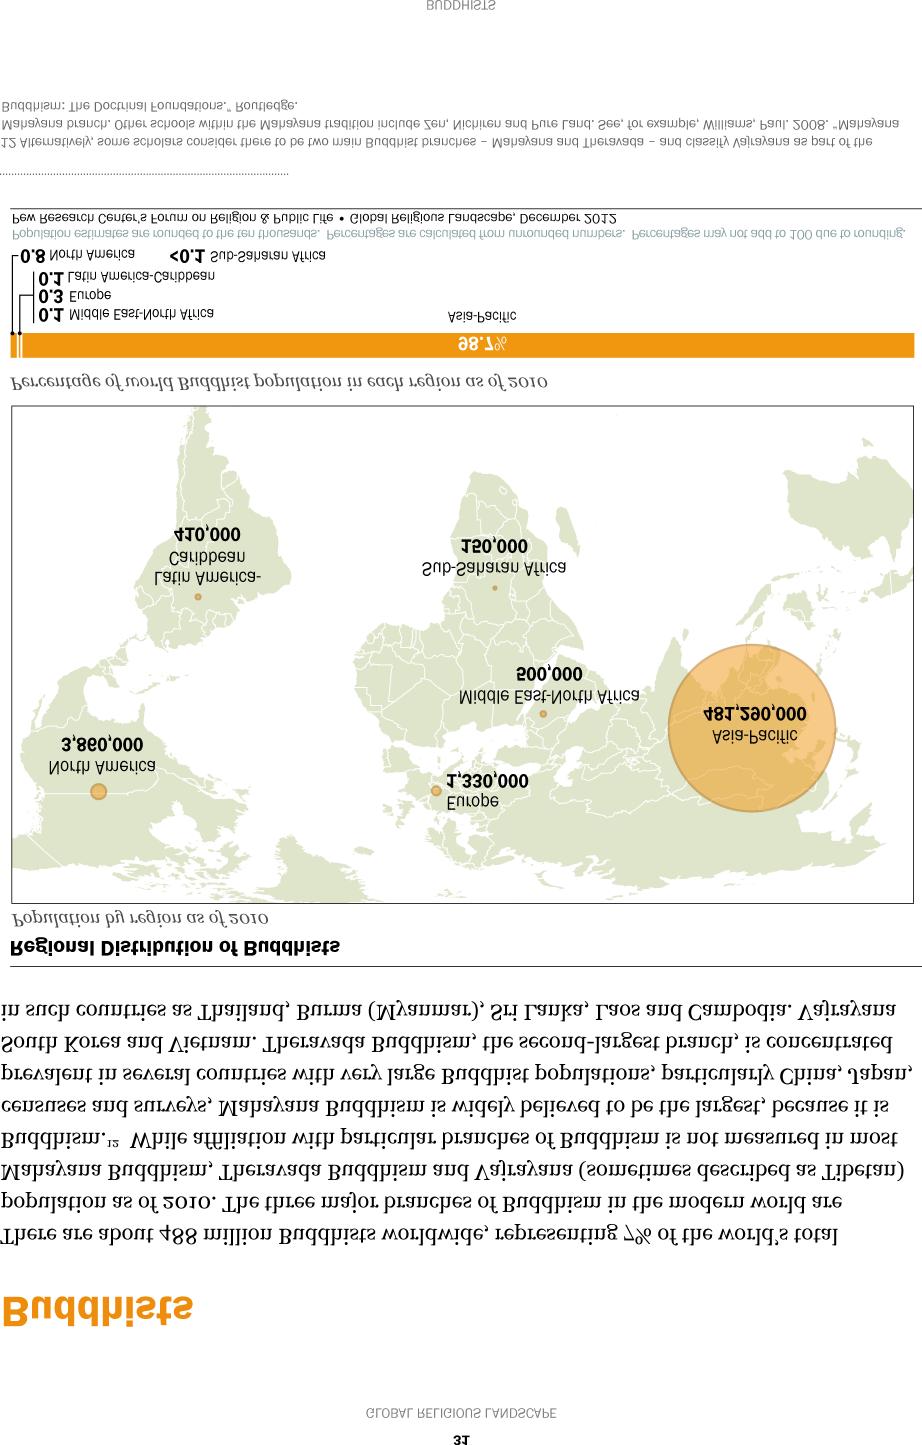
32 32 PEW FORUM ON RELIGION & PUBLIC LIFE Buddhism, the smallest of the three major branches, is concentrated in Tibet, Nepal, Bhutan and Mongolia. The Buddhist population igures in this study also include members of other groups that identify as Buddhist, such as Soka Gakkai and Hoa Hao. Buddhism began in Asia, and the vast majority of all Buddhists (nearly 99%) still live in the Asia- Paciic region. Only two other regions North America (3.9 million) and Europe (1.3 million) have more than 1 million Buddhists. World Buddhist Population by Region ESTIMATED 2010 BUDDHIST POPULATION ESTIMATED 2010 TOTAL POPULATION AGE OF POPULATION THAT IS BUDDHIST Asia-Paciic 481,290,000 4,054,990, % North America 3,860, ,530, Europe 1,330, ,550, Middle East-North Africa 500, ,020, Latin America-Caribbean 410, ,080,000 < 0.1 Sub-Saharan Africa 150, ,720,000 < 0.1 World Total 487,540,000 6,895,890, Population estimates are rounded to the ten thousands. Percentages are calculated from unrounded numbers. Figures may not add exactly due to rounding. Pew Research Center s Forum on Religion & Public Life Global Religious Landscape, December Countries with the Largest Number of Buddhists ESTIMATED 2010 BUDDHIST POPULATION AGE OF POPULATION THAT IS BUDDHIST AGE OF WORLD BUDDHIST POPULATION China 244,130, % 50.1 % Thailand 64,420, Japan 45,820, Burma (Myanmar) 38,410, Sri Lanka 14,450, Vietnam 14,380, Cambodia 13,690, South Korea 11,050, India 9,250, Malaysia 5,010, Subtotal for the 10 Countries 460,620, Subtotal for Rest of World 26,920, World Total 487,540, Population estimates are rounded to the ten thousands. Percentages are calculated from unrounded numbers. Figures may not add exactly due to rounding. Pew Research Center s Forum on Religion & Public Life Global Religious Landscape, December
33 33 GLOBAL RELIGIOUS LANDSCAPE Although the majority of Buddhists live in Asia and the Paciic, only about one-in-eight people (12%) in that region are Buddhists. About 1% of North Americans are Buddhists. In each of the other four regions, Buddhists make up less than 1% of the population. All 10 countries with the largest Buddhist populations are in the Asia-Paciic region, and these countries collectively are home to the lion s share (95%) of all Buddhists. Half (50%) of the world s Buddhists live in one country, China. The largest Buddhist populations outside China are in Thailand (13%), Japan (9%), Burma (Myanmar) (8%), Sri Lanka (3%), Vietnam (3%), Cambodia (3%), South Korea (2%), India (2%) and Malaysia (1%) Seven countries have Buddhist majorities: Cambodia, Thailand, Burma (Myanmar), Bhutan, Sri Lanka, Laos and Mongolia. Median Age Globally, Buddhists are older (median age of 34) than the overall population (median age of 28). Of the three regions for which data are available, sub-saharan Africa has the youngest Buddhist population (median age of 29), followed by North America (33). The Asia-Paciic region has the oldest Buddhist population, with a median age of 34. Buddhists are older than the general population in two of the three major regions for which data are available: sub-saharan Africa (where Buddhists have a median age of 29 and the general population has a median age of 18) and Asia and the Paciic (34 vs. 29). In North America, the median age of Buddhists is 33, four years younger than the general population (37). Regional Median Ages of Buddhists Compared with Overall Median Ages, years Sub-Saharan Africa Buddhist median age in region Regional median age North America Regions are ordered by median age of Buddhists from youngest to oldest. Asia- Pacifc Median age is not presented when reliable age structure data are unavailable Buddhist median age 34 years Pew Research Center s Forum on Religion & Public Life Global Religious Landscape, December BUDDHISTS
34
35 35 GLOBAL RELIGIOUS LANDSCAPE China relies instead on survey questions about worship of gods or spirits associated with Chinese folk religions (see discussion in the Methodology). In addition, the boundaries between folk religions and other religions are blurry in some contexts. For example, anthropologist Tik-sang Liu observes that for ordinary people in Hong Kong and Macau, there is no clear boundary between Buddhism, Daoism and local World Folk Religionist Population by Region ESTIMATED 2010 FOLK RELIGIONIST POPULATION ESTIMATED 2010 TOTAL POPULATION AGE OF POPULATION THAT BELONGS TO FOLK RELIGIONS Asia-Paciic 365,120,000 4,054,990, % Sub-Saharan Africa 26,860, ,720, Latin America-Caribbean 10,040, ,080, Middle East-North Africa 1,060, ,020, North America 1,020, ,530, Europe 1,020, ,550, World Total 405,120,000 6,895,890, Includes followers of African traditional religions, Chinese folk religions, Native American religions and Australian aboriginal religions. Population estimates are rounded to the ten thousands. Percentages are calculated from unrounded numbers. Figures may not add exactly due to rounding. Pew Research Center s Forum on Religion & Public Life Global Religious Landscape, December Countries with the Largest Number of Folk Religionists ESTIMATED 2010 FOLK RELIGIONIST POPULATION AGE OF POPULATION THAT BELONGS TO FOLK RELIGIONS AGE OF WORLD FOLK RELIGION POPULATION China 294,320, % 72.6 % Vietnam 39,750, Taiwan 10,260, India 5,840, Brazil 5,540, South Sudan 3,270, North Korea 3,010, Burma (Myanmar) 2,760, Burkina Faso 2,530, Nigeria 2,290, Subtotal for the 10 Countries 369,570, Subtotal for Rest of World 35,550, World Total 405,120, Includes followers of African traditional religions, Chinese folk religions, Native American religions and Australian aboriginal religions. Population estimates are rounded to the ten thousands. Percentages are calculated from unrounded numbers. Figures may not add exactly due to rounding. Pew Research Center s Forum on Religion & Public Life Global Religious Landscape, December 2012 FOLK RELIGIONISTS
36 36 PEW FORUM ON RELIGION & PUBLIC LIFE [folk] religious practice. 13 On the basis of the limited data available on religion in Macau, the Pew Forum estimates that about 59% of its people practice folk religions and that 17% practice Buddhism (this was the share of Buddhist afiliation measured in the 1991 census, the last census to measure religion in Macau). However, some recent descriptions of religion in Macau contend that 80% of its population practices Buddhism; presumably, this broad measure includes folk religion as part of Buddhism. Due to the uncertain boundary between folk religion and Buddhism in Macau, this study does not claim that Macau has a clear majority of folk religionists. In sub-saharan Africa, many of those who indicate that they are committed to the practice of Christianity and Islam also incorporate elements of African traditional religions into their lives. 14 Moreover, folk and traditional religions are not always offered as response categories in large-scale demographic and health surveys in the region. Folk religionists are most prevalent in the Asia-Paciic region, where nine-in-ten of the world s folk religionists (90%) reside. The remaining folk religion populations are concentrated in sub- Saharan Africa (7%) and Latin America and the Caribbean (between 2% and 3%). Although the majority of folk religionists live in the Asia-Paciic region, less than one-in-ten people in the region (9%) are folk religionists. Folk religionists make up about 3% of the total population of sub-saharan Africa and 2% of the total population of Latin America and the Caribbean. Folk religionists make up less than 1% of the population in the remaining regions. More than seven-in-ten (73%) of the world s folk religionists live in one country, China. The largest populations of folk religionists outside China are in Vietnam (10%), Taiwan (3%), India (1%) and Brazil (1%). Practitioners of folk or traditional religions do not make up a clear majority of the population in any country. Median Age Globally, folk religionists are older (median age of 33) than the overall population (median age of 28). Among the three regions for which data are available, sub-saharan Africa has the youngest folk religionists (median age of 18), followed by Asia and the Paciic (34) and Latin America and the Caribbean (35). The median age of folk religionists in sub-saharan Africa (18) is the same as the median age of the general population in that region (18). However, folk religionists are older than the general 13 Liu, Tik-sang. A Nameless but Active Religion: An Anthropologist s View of Local Religion in Hong Kong and Macau. The China Quarterly, number 174, pages See the Pew Forum s April 2010 report Tolerance and Tension: Islam and Christianity in Sub-Saharan Africa.
37 37 GLOBAL RELIGIOUS LANDSCAPE population in the remaining regions for which data are available: Latin America and the Caribbean (folk religionists 35 years; general population 27 years) and Asia and the Paciic (34 vs. 29). Regional Median Ages of Folk Religionists Compared with Overall Median Ages, years Folk religionist median age in region Regional median age Folk Religionists median age 33 years Sub-Saharan Africa Asia-Pacific Latin America- Caribbean Regions are ordered by median age of folk religionists from youngest to oldest. Median age is not presented when reliable age structure data are unavailable. Pew Research Center s Forum on Religion & Public Life Global Religious Landscape, December 2012 FOLK RELIGIONISTS
38
39 39 GLOBAL RELIGIOUS LANDSCAPE Although the majority of members of other religions live in Asia and the Paciic, only about 1% of the people in the region adhere to these faiths. In the remaining regions, members of other religions make up less than 1% of the population. India has the largest share (47%) of all members of other religions, including millions of Sikhs and Jains. Outside India, the largest shares of people who belong to faiths in the other World Population of Other Religions by Region ESTIMATED 2010 OTHER RELIGIONS POPULATION ESTIMATED 2010 TOTAL POPULATION AGE OF POPULATION THAT BELONGS TO OTHER RELIGIONS Asia-Paciic 51,850,000 4,054,990, % North America 2,200, ,530, Sub-Saharan Africa 1,920, ,720, Latin America-Caribbean 990, ,080, Europe 930, ,550, Middle East-North Africa 230, ,020,000 < 0.1 World Total 58,110,000 6,895,890, Includes Bahai s, Jains, Sikhs, Shintoists, Taoists, followers of Tenrikyo, Wiccans, Zoroastrians and many other faiths. Population estimates are rounded to the ten thousands. Percentages are calculated from unrounded numbers. Figures may not add exactly due to rounding. Pew Research Center s Forum on Religion & Public Life Global Religious Landscape, December Countries with the Largest Number of Adherents of Other Religions ESTIMATED 2010 OTHER RELIGIONS POPULATION AGE OF POPULATION THAT BELONGS TO OTHER RELIGIONS AGE OF WORLD OTHER RELIGIONS POPULATION India 27,560, % 47.4 % China 9,080, Japan 5,890, Taiwan 3,760, North Korea 3,130, United States 1,900, Cameroon 530, Kenya 500, United Kingdom 500, Singapore 490, Subtotal for the 10 Countries 53,350, Subtotal for Rest of World 4,760, World Total 58,110, Includes Bahai s, Jains, Sikhs, Shintoists, Taoists, followers of Tenrikyo, Wiccans, Zoroastrians and many other faiths. Population estimates are rounded to the ten thousands. Percentages are calculated from unrounded numbers. Figures may not add exactly due to rounding. Pew Research Center s Forum on Religion & Public Life Global Religious Landscape, December 2012 OTHER RELIGIONS
40 40 PEW FORUM ON RELIGION & PUBLIC LIFE Spotlight on Other Religions The other religions category is diverse and comprises all groups not classiied elsewhere. It includes followers of religions that are not speciically measured in most censuses and surveys, including but not limited to the faiths listed below. Estimates of population sizes for these groups generally come from sources other than censuses and nationally representative surveys. Baha i Faith The Baha i faith began in Persia (now Iran) in the 19th century. Baha is are widely dispersed across many countries, with signiicant populations in India, the United States, Kenya and elsewhere. The Baha i International Community reports more than 5 million adherents. Jainism Jainism originated in India and dates back to at least the 6th century B.C.E. Today, the vast majority of Jains live in India, though signiicant numbers also are found among Indian immigrant communities in Kenya, the United States, Canada and the United Kingdom. The 2001 Indian census enumerated more than 4 million Jains in India, but some Jains have contended that number is a substantial undercount. According to estimates by the World Religion Database, there are fewer than 250,000 Jains outside India. Shintoism Shintoism is a Japanese faith that has been part of religious life in Japan for many centuries. Although Shinto rituals are widely practiced in Japan, only a minority of the Japanese population identiies with Shintoism in surveys. The World Religion Database estimates there are almost 3 million Shintoists worldwide, with the vast majority concentrated in Japan. Sikhism Sikhism was founded at the turn of the 16th century by Guru Nanak in the Punjab, a region now split between India and Pakistan. More than nine-in-ten Sikhs are in India, but there are also sizable Sikh communities in the United Kingdom, the United States and Canada. The World Religion Database estimates there are a total of about 25 million Sikhs worldwide. Taoism Taoism (also known as Daoism) traditionally is said to have been founded in the 6th century B.C.E. by Chinese philosopher Lao Tzu. Adherents live predominantly in China and Taiwan. The World Religion Database estimates there are more than 8 million Taoists. Tenrikyo Tenrikyo was founded in the 19th century by Nakayama Miki in Japan. The faith is one of many new Japanese religions; others
41 41 GLOBAL RELIGIOUS LANDSCAPE include Shinreikyo, Mahakari, Omoto and PL Kyodan. Reliable estimates of the number of followers of Tenrikyo and other new Japanese religions are not available. Wicca Wicca is a Pagan or neo-pagan religion that gained popularity in the 20th century. It is practiced mostly in the United Kingdom and the United States. Reliable estimates of the number of Wiccans around the world are not available. sometime before the 6th century B.C.E. Adherents live mainly in India and Iran. The World Religion Database estimates there are about 200,000 Zoroastrians worldwide. Others Other faiths in the other religions category include Cao Dai, I-Kuan Tao, Mandaeism, the Rastafari movement, the R tana movement, Scientology and Yazidism, to list just a few. Zoroastrianism Zoroastrianism traditionally is said to have been founded by Zarathustra in Persia religion category are in China (16%), Japan (10%), Taiwan (7%), North Korea (5%) and the United States (3%). Adherents of other religions do not make up a majority of the population in any country. Median Age Globally, members of other religions are older (median age of 32) than the overall global population (median age of 28). Reliable regional data on the median age of followers of other world religions is available only for Asia and the Paciic, where it is 33, four years older than the overall regional median (29). OTHER RELIGIONS
42
The Global Religious Landscape
 GLOBAL CHRISTIANITY 1 DECEMBER 2012 The Global Religious Landscape A Report on the Size and Distribution of the World s Major Religious Groups as of 2010 pew templeton global religious futures project
FOR RELEASE APRIL 2, 2015 The Future of World Religions: Population Growth Projections,
 NUMBERS, FACTS AND TRENDS SHAPING THE WORLD FOR RELEASE APRIL 2, 2015 The Future of World Religions: Population Growth Projections, 2010-2050 Why Muslims Are Rising Fastest and the Unaffiliated Are Shrinking
Levels and trends in international migration
 Levels and trends in international migration The number of international migrants worldwide has continued to grow rapidly over the past fifteen years reaching million in 1, up from million in 1, 191 million
FAQ 7: Why Origins totals and percentages differs from ONS country of birth statistics
 FAQ 7: Why totals and percentages differs from ONS country statistics 7 December 2016 Purpose of Information Note When the numbers and percentages of names by are compared with the numbers and percentages
Isle of Wight 2011 census atlas. Section 2a. Population
 Section 2a Total population 2011 census population by age group and sex On census day (27 March) the Island s total normally resident population was 138,265 persons. 70,841 were females 67,424 were males
BY Amy Mitchell, Katie Simmons, Katerina Eva Matsa and Laura Silver. FOR RELEASE JANUARY 11, 2018 FOR MEDIA OR OTHER INQUIRIES:
 FOR RELEASE JANUARY 11, 2018 BY Amy Mitchell, Katie Simmons, Katerina Eva Matsa and Laura Silver FOR MEDIA OR OTHER INQUIRIES: Amy Mitchell, Director, Journalism Research Katie Simmons, Associate Director,
Economic Activity in London
 CIS2013-10 Economic Activity in London September 2013 copyright Greater London Authority September 2013 Published by Greater London Authority City Hall The Queens Walk London SE1 2AA www.london.gov.uk
Asian Pacific Islander Catholics in the United States: A Preliminary Report 1
 Asian Pacific Islander Catholics in the United States: A Preliminary Report 1 January 14, 2015 Prepared by Jerry Z. Park W. Matthew Henderson Kenneth Vaughan Baylor University 2 Tricia Bruce Maryville
Global Opinions on the U.S.-China Relationship
 Global Opinions on the U.S.-China Relationship Richard Wike Director of Global Attitudes Research Pew Research Center Funded largely by the Pew Charitable Trusts Non-profit, non-partisan fact tank in Washington
FAITH ON THE MOVE 1 MARCH Faith on the Move. The Religious Affiliation of International Migrants. pew templeton. project.
 FAITH ON THE MOVE 1 MARCH 2012 Faith on the Move The Religious Affiliation of International Migrants pew templeton global religious futures project THIS PAGE INTENTIONALLY BLANK 3 FAITH ON THE MOVE About
Asian Pacific Islander Catholics in the United States: A Preliminary Report 1
 Asian Pacific Islander in the United States: A Preliminary Report 1 January 2015 Prepared by Jerry Z. Park W. Matthew Henderson Kenneth Vaughan Baylor University 2 Tricia Bruce Maryville College 3 Stephen
2011 National Household Survey Profile on the Town of Richmond Hill: 1st Release
 2011 National Household Survey Profile on the Town of Richmond Hill: 1st Release Every five years the Government of Canada through Statistics Canada undertakes a nationwide Census. The purpose of the Census
Religious Demography of Emerging Economies
 Religious Demography of Emerging Economies Age structures and fertility in the BRIC countries and the global religious consequences of their economic growth M. Stonawski 1, V. Skirbekk 2, M. Potančoková
AMERICA S GLOBAL IMAGE REMAINS MORE POSITIVE THAN CHINA S BUT MANY SEE CHINA BECOMING WORLD S LEADING POWER
 AMERICA S GLOBAL IMAGE REMAINS MORE POSITIVE THAN CHINA S BUT MANY SEE CHINA BECOMING WORLD S LEADING POWER PEW RESEARCH CENTER Released: July 18, 2013 Overview Publics around the world believe the global
FOR RELEASE NOV. 29, 2017
 FOR RELEASE NOV. 29, 2017 FOR MEDIA OR OTHER INQUIRIES: Alan Cooperman, Director of Religion Research Conrad Hackett, Associate Director of Research Anna Schiller, Communications Manager 202.419.4372 RECOMMENDED
Payments from government to people
 3 PAYMENTS Most people make payments such as for utility bills or domestic remittances. And most receive payments such as wages, other payments for work, or government transfers. The 2017 Global Findex
THE U.S.-CHINA POWER SHIFT
 THE U.S.-CHINA POWER SHIFT Bruce Stokes Director, Global Economic Attitudes Pew Research Center Funded largely by the Pew Charitable Trusts Non-profit, non-partisan fact tank in Washington Research areas
KINGDOM OF CAMBODIA NATION RELIGION KING 3 TOURISM STATISTICS REPORT. September 2010
 KINGDOM OF CAMBODIA NATION RELIGION KING 3 TOURISM STATISTICS REPORT September 2010 MINISTRY OF TOURISM Statistics and Tourism Information Department No. A3, Street 169, Sangkat Veal Vong, Khan 7 Makara,
Exploring relations between Governance, Trust and Well-being
 Exploring relations between Governance, Trust and Well-being Using recent Gallup WorldPoll data Robert Manchin Gallup Europe Asia-Pacific Conference on Measuring Well-Being and Fostering the Progress of
IMAGE OF POPE FRANCIS
 IMAGE OF POPE FRANCIS Gallup International Association opinion poll in 64 countries across the globe September-December 2015 Disclaimer: Gallup International Association or its members are not related
GLOBAL RISKS OF CONCERN TO BUSINESS WEF EXECUTIVE OPINION SURVEY RESULTS SEPTEMBER 2017
 GLOBAL RISKS OF CONCERN TO BUSINESS WEF EXECUTIVE OPINION SURVEY RESULTS SEPTEMBER 2017 GLOBAL RISKS OF CONCERN TO BUSINESS Results from the World Economic Forum Executive Opinion Survey 2017 Survey and
Population Growth and California s Future. Hans Johnson
 Population Growth and California s Future Hans Johnson Outline California s rapid growth Population diversity Implications for policy 2 California Has a Large and Growing Population 40,000 Population (in
KINGDOM OF CAMBODIA NATION RELIGION KING 3 TOURISM STATISTICS REPORT. March 2010
 KINGDOM OF CAMBODIA NATION RELIGION KING 3 TOURISM STATISTICS REPORT March 2010 MINISTRY OF TOURISM Statistics and Tourism Information Department No. A3, Street 169, Sangkat Veal Vong, Khan 7 Makara, Phnom
Global Prevalence of Adult Overweight & Obesity by Region
 Country Year of Data Collection Global Prevalence of Adult Overweight & Obesity by Region National /Regional Survey Size Age Category % BMI 25-29.9 %BMI 30+ % BMI 25- %BMI 30+ 29.9 European Region Albania
HUMAN RESOURCES IN R&D
 HUMAN RESOURCES IN R&D This fact sheet presents the latest UIS S&T data available as of July 2011. Regional density of researchers and their field of employment UIS Fact Sheet, August 2011, No. 13 In the
FOR RELEASE MARCH 20, 2018
 FOR RELEASE MARCH 20, 2018 FOR MEDIA OR OTHER INQUIRIES: Carroll Doherty, Director of Political Research Jocelyn Kiley, Associate Director, Research Olivia O Hea, Communications Assistant 202.419.4372
Pakistan 2.5 Europe 11.5 Bangladesh 2.0 Japan 1.8 Philippines 1.3 Viet Nam 1.2 Thailand 1.0
 173 People Snapshots Asia and the Pacific accounts for nearly 55% of global population and 6 of the world s 10 most populous economies. The region s population is forecast to grow by almost 1 billion by
Study Area Maps. Profile Tables. W Broadway & Cambie St, Vancouver, BC Pitney Bowes 2016 Estimates and Projections. W Broadway & Cambie St
 Powered by PCensus Page 1 Study Area Maps Profile Tables 2016 Demographic Snapshot Population Trends Household Trends Population by Age and Sex Comparison Population by Age and Sex Household Maintainers
Round 1. This House would ban the use of zero-hour contracts. Proposition v. Opposition
 Round 1 This House would ban the use of zero-hour contracts New Zealand Bermuda Wales Romania Greece Estonia USA Scotland Slovakia Philippines Qatar Ireland Hungary Australia Japan Canada Sri Lanka Sweden
AUSTRALIA S REFUGEE RESPONSE NOT THE MOST GENEROUS BUT IN TOP 25
 19 July 2013 AUSTRALIA S REFUGEE RESPONSE NOT THE MOST GENEROUS BUT IN TOP 25 Australia is not the world s most generous country in its response to refugees but is just inside the top 25, according to
Other Their. Stokes. BY Bruce ON THIS REPORT: Leaders
 NUMBERS, FACTS AND TRENDS SHAPING THE WORLD FOR RELEASE SEPTEMBER 2, 2015 How Asia a-pacific Publics See Each Other and Their National Leaders Japan Viewe d Most Favorably, No Leader Enjoy ys Majority
WSDC 2010: THE DRAW ROUND ZERO. PROPOSITION versus OPPOSITION NIGERIA CYPRUS CROATIA BULGARIA LEBANON PALESTINE BOSNIA AND HERZEGOVINA RUSSIA
 WSDC 2010: THE DRAW ROUND ZERO IMPROMPTU CYPRUS NIGERIA BULGARIA CROATIA LEBANON PALESTINE BOSNIA AND HERZEGOVINA RUSSIA ROUND ONE THAT WE SHOULD SUPPORT MILITARY INTERVENTION IN SOMALIA INDIA IRELAND
GLOBALIZATION 4.0 The Human Experience. Presented to the World Economic Forum by SAP + Qualtrics
 + GLOBALIZATION 4.0 The Human Experience Presented to the World Economic Forum by SAP + Qualtrics 1 Survey methodology An original survey research project with more than 10,000 respondents across 29 countries
Human Resources in R&D
 NORTH AMERICA AND WESTERN EUROPE EAST ASIA AND THE PACIFIC CENTRAL AND EASTERN EUROPE SOUTH AND WEST ASIA LATIN AMERICA AND THE CARIBBEAN ARAB STATES SUB-SAHARAN AFRICA CENTRAL ASIA 1.8% 1.9% 1. 1. 0.6%
Charting South Korea s Economy, 1H 2017
 Charting South Korea s Economy, 1H 2017 Designed to help executives interpret economic numbers and incorporate them into company s planning. Publication Date: January 3 rd, 2017 Next Issue: To be published
World Map Title Name. Russia. United States. Japan. Mexico. Philippines Nigeria. Brazil. Indonesia. Germany United Kingdom. Canada
 214 P Gersmehl Teachers may copy for use in their classrooms. Contact pgersmehl@gmail.com regarding permission for any other use. World Map Title Name Canada United States Mexico Colombia Ecuador Haiti
Emerging and Developing Economies Much More Optimistic than Rich Countries about the Future
 Emerging and Developing Economies Much More Optimistic than Rich Countries about the Future October 9, 2014 Education, Hard Work Considered Keys to Success, but Inequality Still a Challenge As they continue
Many Around the World Are Disengaged From Politics
 FOR RELEASE OCTOBER 17, 2018 Many Around the World Are Disengaged From Politics But could be motivated to participate on issues like health care, poverty and education BY Richard Wike and Alexandra Castillo
Concept note. The workshop will take place at United Nations Conference Centre in Bangkok, Thailand, from 31 January to 3 February 2017.
 Regional workshop on strengthening the collection and use of international migration data in the context of the 2030 Agenda for Sustainable Development Introduction Concept note The United Nations Department
MEETING THE NEED FOR PERSONAL MOBILITY. A. World and regional population growth and distribution
 30 II. MEETING THE NEED FOR PERSONAL MOBILITY A. World and regional population growth and distribution The world population grew at an annual rate of 1.4 per cent between 1990 and 2000. This is slightly
2018 Social Progress Index
 2018 Social Progress Index The Social Progress Index Framework asks universally important questions 2 2018 Social Progress Index Framework 3 Our best index yet The Social Progress Index is an aggregate
Rule of Law Index 2019 Insights
 World Justice Project Rule of Law Index 2019 Insights Highlights and data trends from the WJP Rule of Law Index 2019 Trinidad & Tobago Tunisia Turkey Uganda Ukraine United Arab Emirates United Kingdom
Tourism Highlights International Tourist Arrivals, Average Length of Stay, Hotels Occupancy & Tourism Receipts Years
 KINGDOM OF CAMBODIAA NATION RELIGION KING 3 TOURISM STATISTICS REPORT Oct tober 2013 MINISTRY OF TOURISM Statisticss and Tourism Information Department No. A3, Street 169, Sangkat Veal Vong, Khann 7 Makara,
The Demography of the Labor Force in Emerging Markets
 The Demography of the Labor Force in Emerging Markets David Lam I. Introduction This paper discusses how demographic changes are affecting the labor force in emerging markets. As will be shown below, the
Charting Singapore s Economy, 1H 2017
 Charting Singapore s Economy, 1H 2017 Designed to help executives interpret economic numbers and incorporate them into company s planning. Publication Date: January 3 rd, 2017 Next Issue: To be published
Session 2: The importance of institutions and standards for soft connectivity
 ASEM Seminar, Tokyo 12 September 2018 Hae-Won Jun, KNDA Session 2: The importance of institutions and standards for soft connectivity How is digital connectivity important between Asia and Europe and what
Trademarks FIGURE 8 FIGURE 9. Highlights. Figure 8 Trademark applications worldwide. Figure 9 Trademark application class counts worldwide
 Trademarks Highlights Applications grew by 16.4% in 2016 An estimated 7 million trademark applications were filed worldwide in 2016, 16.4% more than in 2015 (figure 8). This marks the seventh consecutive
Social Development in Brazil
 Social Development in Brazil Ministry of Social Development and Fight against Hunger Brasília March, 2013 BRAZIL Population (est. 2010): 190 million people Area: 8.5 million km² Federal Republic: 26 states,
IV. URBANIZATION PATTERNS AND RURAL POPULATION GROWTH AT THE COUNTRY LEVEL
 IV. URBANIZATION PATTERNS AND RURAL POPULATION GROWTH AT THE COUNTRY LEVEL Urbanization patterns at the country level are much more varied than at the regional level. Furthermore, for most countries, the
Chapter 13. Country of Birth of the Foreign-Born Population
 Campbell Gibson American Demographic History Chartbook: 0 to www.demographicchartbook.com Chapter. Country of Birth of the Foreign-Born Population With a few exceptions, data on the foreign-born population
Data access for development: The IPUMS perspective
 Data access for development: The IPUMS perspective United Nations Commission on Population and Development Strengthening the demographic evidence base for the post-2015 development agenda New York 11 April
A GLOBAL PERSPECTIVE ON RESEARCH AND DEVELOPMENT
 UNESCO Institute for Statistics A GLOBAL PERSPECTIVE ON RESEARCH AND DEVELOPMENT The UNESCO Institute for Statistics (UIS) works with governments and diverse organizations to provide global statistics
CHAPTER I: SIZE AND GEOGRAPHICAL DISTRIBUTION OF THE POPULATION
 CHAPTER I: SIZE AND GEOGRAPHICAL DISTRIBUTION OF THE POPULATION 1. Trends in the Population of Japan The population of Japan is 127.77 million. It increased by 0.7% over the five-year period, the lowest
LEGAL ISSUES AFFECTING RELIGIOUS FREEDOM: ASIA AREA JULY 8, 2015
 LEGAL ISSUES AFFECTING RELIGIOUS FREEDOM: ASIA AREA JULY 8, 2015 Asia Area: Background Includes 22 countries/territories Of the 22, the LDS Church has activities or operations in 18 Nothing in Bhutan,
Charting Indonesia s Economy, 1H 2017
 Charting Indonesia s Economy, 1H 2017 Designed to help executives interpret economic numbers and incorporate them into company s planning. Publication Date: January 3 rd, 2017 Next Issue: To be published
FOR RELEASE OCT. 2, 2018
 FOR RELEASE OCT. 2, 2018 FOR MEDIA OR OTHER INQUIRIES: Gregory A. Smith, Associate Director of Research Elizabeth Podrebarac Sciupac, Research Associate Anna Schiller, Communications Manager 202.419.4372
Millennium Profiles Demographic & Social Energy Environment Industry National Accounts Trade. Social indicators. Introduction Statistics
 1 of 5 10/2/2008 10:16 AM UN Home Department of Economic and Social Affairs Economic and Social Development Home UN logo Statistical Division Search Site map About us Contact us Millennium Profiles Demographic
SLOW PACE OF RESETTLEMENT LEAVES WORLD S REFUGEES WITHOUT ANSWERS
 21 June 2016 SLOW PACE OF RESETTLEMENT LEAVES WORLD S REFUGEES WITHOUT ANSWERS Australia and the world s wealthiest nations have failed to deliver on promises to increase resettlement for the world s neediest
REGIONS OF THE WORLD
 REGIONS OF THE WORLD NORTH AMERICA Some countries: 3 Nations: USA, Mexico, Canada Population: Power: Main Languages: English, Spanish, French Religion: Mostly Christian, but many other groups Number of
Generational Change in the World Environment Dr. Jack M. Wilson Distinguished Professor of Higher Education, Emerging Technologies, and Innovation
 Generational Change in the World Environment Dr. Jack M. Wilson Distinguished Professor of Higher Education, Emerging Technologies, and Innovation Introduction The world has changed dramatically during
Charting Australia s Economy
 Charting Australia s Economy Designed to help executives catch up with the economy and incorporate macro impacts into company s planning. Annual subscription includes 2 semiannual issues published in June
RECOMMENDED CITATION: Pew Research Center, September, 2016, The Parties on the Eve of the 2016 Election: Two Coalitions, Moving Further Apart
 NUMBERS, FACTS AND TRENDS SHAPING THE WORLD FOR RELEASE SEPTEMBER 13, 2016 FOR MEDIA OR OTHER INQUIRIES: Carroll Doherty, Director of Political Research Jocelyn Kiley, Associate Director, Research Alec
Charting Singapore s Economy, 1Q 2016 Publication Date: December 8 th, 2015 Number of pages: 58
 Charting Singapore s Economy, 1Q 2016 Publication Date: December 8 th, 2015 Number of pages: 58 Attribution-NonCommercial-NoDerivatives 4.0 International (CC BY-NC-ND 4.0) You are free to: Share copy and
A Note on International Migrants Savings and Incomes
 September 24, 2014 A Note on International Migrants Savings and Incomes Supriyo De, Dilip Ratha, and Seyed Reza Yousefi 1 Annual savings of international migrants from developing countries are estimated
South Africa - A publisher s perspective. STM/PASA conference 11 June, 2012, Cape Town Mayur Amin, SVP Research & Academic Relations
 South Africa - A publisher s perspective STM/PASA conference 11 June, 2012, Cape Town Mayur Amin, SVP Research & Academic Relations 0 As a science information company, we have a unique vantage point on
GLOBAL TURNIGN POINTS for Business and Society. The New Demography. Mauro F. Guillén Emilio Ontiveros
 GLOBAL TURNIGN POINTS for Business and Society The New Demography Mauro F. Guillén Emilio Ontiveros Demography What is demography? Demography is the study of human populations. Why should we care about
Most People Think Their Nation's Foreign Policy Is Morally No Better Than Average: Global Poll
 Most People Think Their Nation's Foreign Policy Is Morally No Better Than Average: Global Poll January 22, 2009 Full Report (PDF) Questionnaire/Methodology (PDF) The world is full of nationalistic people
LIST OF CHINESE EMBASSIES OVERSEAS Extracted from Ministry of Foreign Affairs of the People s Republic of China *
 ANNEX 1 LIST OF CHINESE EMBASSIES OVERSEAS Extracted from Ministry of Foreign Affairs of the People s Republic of China * ASIA Chinese Embassy in Afghanistan Chinese Embassy in Bangladesh Chinese Embassy
People. Population size and growth. Components of population change
 The social report monitors outcomes for the New Zealand population. This section contains background information on the size and characteristics of the population to provide a context for the indicators
Incarceration Data: Selected Comparisons
 Incarceration Data: Selected Comparisons Charles Patton III Race/Ethnicity: Multidisciplinary Global Contexts, Volume 2, Number 1, Autumn 2008, pp. 151-156 (Article) Published by Indiana University Press
Global Support for Principle of Free Expression, but Opposition to Some Forms of Speech
 NUMBERS, FACTS AND TRENDS SHAPING THE WORLD FOR RELEASE NOVEMBER 18, 2015 Global Support for Principle of Free Expression, but Opposition to Some Forms of Speech Americans Especially Likely to Embrace
World Refugee Survey, 2001
 World Refugee Survey, 2001 Refugees in Africa: 3,346,000 "Host" Country Home Country of Refugees Number ALGERIA Western Sahara, Palestinians 85,000 ANGOLA Congo-Kinshasa 12,000 BENIN Togo, Other 4,000
Charting Philippines Economy, 1H 2017
 Charting Philippines Economy, 1H 2017 Designed to help executives interpret economic numbers and incorporate them into company s planning. Publication Date: January 3 rd, 2017 Next Issue: To be published
Japan s Policy to Strengthen Economic Partnership. November 2003
 Japan s Policy to Strengthen Economic Partnership November 2003 1. Basic Structure of Japan s External Economic Policy -Promoting Economic Partnership Agreements with closely related countries and regions
COMMUNITY PROFILE COQUITLAM. Coquitlam Immigrant Demographics I Page 1
 COMMUNITY PROFILE COQUITLAM Coquitlam Demographics I Page 1 COQUITLAM IMMIGRANT DEMOGRAPHICS Your quick and easy look at facts and figures around immigration. Newcomers are an important and growing part
Bangladesh: towards middle-income status
 Bangladesh: towards middle-income status Martin Rama Chief Economist for South Asia, the World Bank * SANEM Annual Economists Conference Dhaka, 2016 * With Miklos Bankuti. Zahid Hussain, and Fan Zhang
America's Image Slips, But Allies Share U.S. Concerns Over Iran, Hamas No Global Warming Alarm in the U.S., China
 Page 1 of 5 06.26.06 Receive notification of releases. Enter your email address: America's Image Slips, But Allies Share U.S. Concerns Over Iran, Hamas No Global Warming Alarm in the U.S., China Released:
Summary of the Results
 Summary of the Results CHAPTER I: SIZE AND GEOGRAPHICAL DISTRIBUTION OF THE POPULATION 1. Trends in the Population of Japan The population of Japan is 127.77 million. It increased by 0.7% over the five-year
2017 Social Progress Index
 2017 Social Progress Index Central Europe Scorecard 2017. For information, contact Deloitte Touche Tohmatsu Limited In this pack: 2017 Social Progress Index rankings Country scorecard(s) Spotlight on indicator
Country Participation
 Country Participation IN ICP 2003 2006 The current round of the International Comparison Program is the most complex statistical effort yet providing comparable data for about 150 countries worldwide.
RIETI BBL Seminar Handout
 Research Institute of Economy, Trade and Industry (RIETI) RIETI BBL Seminar Handout September 24, 2014 Speaker: Mr. Bruce STOKES http://www.rieti.go.jp/jp/index.html Japanese, American, Asian Views on
Higher education global trends and Emerging opportunities to 2020
 0 Get informed. Seize challenges. Engage with the future. The shape of things to come: Higher education global trends and Emerging opportunities to 2020 www.aiec.idp.com 1 0 Research Topic Forecast the
Outline of Presentation
 DEMOGRAPHIC CHANGE AND ITS IMPLICTIONS FOR LABOUR MOBILITY IN ASIA AND THE PACIFIC by Graeme Hugo University Professorial Research Fellow Professor of Geography and Director of the National Centre for
Good Sources of International News on the Internet are: ABC News-
 Directions: AP Human Geography Summer Assignment Ms. Abruzzese Part I- You are required to find, read, and write a description of 5 current events pertaining to a country that demonstrate the IMPORTANCE
Figure 1. International Student Enrolment Numbers by Sector 2002 to 2017
 International Student Enrolments in Australia by Sector in Comparison to Higher Education Professor Emeritus Frank P. Larkins The University of Melbourne Summary The growth in international students enrolling
Social Outlook for Asia and the Pacific: Poorly Protected. Predrag Savic, Social Development Division, ESCAP. Bangkok, November 13, 2018
 Social Outlook for Asia and the Pacific: Poorly Protected Predrag Savic, Social Development Division, ESCAP Bangkok, November 13, 2018 Outline 1. Poverty as a challenge in Asia and the Pacific 2. Lack
IMMIGRATION. Gallup International Association opinion poll in 69 countries across the globe. November-December 2015
 IMMIGRATION Gallup International Association opinion poll in 69 countries across the globe November-December 2015 Disclaimer: Gallup International Association or its members are not related to Gallup Inc.,
Rethinking Australian Migration
 Rethinking Australian Migration Stephen Castles University of Sydney Department of Sociology and Social Policy Challenges to Australian migration model 1. Changes in global and regional migration 2. From
Statistical Yearbook. for Asia and the Pacific
 Statistical Yearbook for Asia and the Pacific 2015 Statistical Yearbook for Asia and the Pacific 2015 Sustainable Development Goal 1 End poverty in all its forms everywhere 1.1 Poverty trends...1 1.2 Data
Population. C.4. Research and development. In the Asian and Pacific region, China and Japan have the largest expenditures on R&D.
 Statistical Yearbook for Asia and the Pacific 2013 C. Education and knowledge C.4. (R&D) is a critical element in the transition towards a knowledgebased economy. It also contributes to increased productivity,
International Education in the Comox Valley: Current and Potential Economic Impacts
 International Education in the Comox Valley: Current and Potential Economic Impacts FINAL REPORT March 2012 Prepared by: Vann Struth Consulting Group Inc. Vancouver, BC www.vannstruth.com Prepared for:
Decision 2018/201 E Elections, nominations, confirmations and appointments to subsidiary and related bodies of the Economic and Social Council
 Decision 2018/201 E Elections, nominations, confirmations and appointments to subsidiary and related bodies of the Economic and Social Council At its 16th plenary meeting, on 4 April 2018, the Economic
ADMISSIONS SURVEY FALL 2017 ENTERING CLASS
 ADMISSIONS SURVEY FALL 2017 ENTERING CLASS Response to Survey: 100% represents 1% or less Gender Male 44% 46% Female 55% 52% Trans - Gender non-conforming - Choose not to answer - 2% Language Most Comfortable
Public Opinion on Global Issues. Chapter 4a: World Opinion on Transnational Threats: Terrorism
 Public Opinion on Global Issues Chapter 4a: World Opinion on Transnational Threats: Terrorism www.cfr.org/public_opinion March 16, 2012 CHAPTER 4A: WORLD OPINION ON COUNTERING TRANSNATIONAL THREATS: TERRORISM
HAPPINESS, HOPE, ECONOMIC OPTIMISM
 HAPPINESS, HOPE, ECONOMIC OPTIMISM Gallup International s 41 st Annual Global End of Year Survey Opinion Poll in 55 Countries Across the Globe October December 2017 Disclaimer: Gallup International Association
The Global Poll Multinational Survey of Opinion Leaders 2002
 The Global Poll Multinational Survey of Opinion Leaders 2002 Full Report May 2003 Prepared by Princeton Survey Research Associates for the World Bank The Global Poll Multinational Survey of Opinion Leaders
2013 (received) 2015 (received) Local Local Local Local currency. currency (millions) currency. (millions)
 2015 (received) Local Local Local Local currency. currency (millions) currency. (millions)") Table 1. UNDP regular resources: contributions received or pledged in - figures are based on contribution amounts already received or officially pledged. (For contributions received, the UN echange rates
Table 1. UNDP regular resources: contributions received or pledged in - figures are based on contribution amounts already received or officially pledged. (For contributions received, the UN echange rates
International Poll Finds Large Majorities in All Countries Favor Equal Rights for Women
 International Poll Finds Large Majorities in All Countries Favor Equal Rights for Women Widespread Support for Government and UN Action to Prevent Discrimination This report presents an updated analysis
New York County Lawyers Association Continuing Legal Education Institute 14 Vesey Street, New York, N.Y (212)
") New York County Lawyers Association Continuing Legal Education Institute 14 Vesey Street, New York, N.Y. 10007 (212) 267-6646 Who is Who in the Global Economy And Why it Matters June 20, 2014; 6:00 PM-6:50
New York County Lawyers Association Continuing Legal Education Institute 14 Vesey Street, New York, N.Y. 10007 (212) 267-6646 Who is Who in the Global Economy And Why it Matters June 20, 2014; 6:00 PM-6:50
Putting the Experience of Chinese Inventors into Context. Richard Miller, Office of Chief Economist May 19, 2015
 Putting the Experience of Chinese Inventors into Context Richard Miller, Office of Chief Economist May 19, 2015 Outline Data and Methods Growth in PTO Filings Focus on foreign co-invention Patent examination