2011 National Household Survey Profile on the Town of Richmond Hill: 1st Release
|
|
|
- Miles Franklin
- 5 years ago
- Views:
Transcription
1 2011 National Household Survey Profile on the Town of Richmond Hill: 1st Release Every five years the Government of Canada through Statistics Canada undertakes a nationwide Census. The purpose of the Census is to collect quantitative statistical information on the country s population, which helps to provide a detailed snapshot of the demographic, social and economic conditions of the country. The Census achieves this by tracking trends related to the population, households, dwellings, families and language. Census data is important because it provides the information necessary to identify the emerging trends that shape Richmond Hill and guide the Town s plans. Prior to 2011, the Census was comprised of a mandatory short form sent to all households, and a mandatory long-form questionnaire sent to a sample of households, in addition to a Census of Agriculture. As of 2011, the Census is made up of a 10-question mandatory form (known as the Census of ), as well as the Census of Agriculture. The information that was previously collected through the long form Census is now collected on a voluntary basis as part of the National Household Survey (NHS). The NHS was sent to approximately 4.5 million households across Canada during the last Census period, which represents slightly less than a third of all Canadian households. The first release of the NHS data is now available, and includes detailed information on citizenship, immigration, place of birth, ethnic origin, visible minorities, language, religion and Aboriginal peoples. The following is a summary of the key findings of the first release of the NHS results for Richmond Hill.
2 Release Schedule Data collected from the 2011 Census of was released in stages between February and October 2012 on the following dates: Census of Canada Release Schedule (2011) Release Date Data Product February 8, 2012 and Dwelling Counts May 29, 2012 Age and Sex September 19, 2012 October 24, 2012 Language Families, Households and Marital Status Structural Types of Dwellings and Collectives Data collected through the 2011 National Household Survey was released in May 2013, with the remaining sets to be released in stages between June and August 2013, on the following dates: National Household Survey Release Schedule (2011) Release Date May 8, 2013 June 26, 2013 August 14, 2013 Data Product Immigration Citizenship Place of birth Language Ethnic origin Visible minorities Religion Aboriginal Peoples Labour Education Place of work Commuting to work Mobility and migration Language of work Income Earnings Housing Shelter costs
3 Citizenship and Generation Status Citizenship According to the 2011 National Household Survey (NHS), 166,605 respondents identified themselves as Canadian citizens, which equates to over 90% of Richmond Hill s population. Of the respondents who identified themselves as Canadian citizens, 127,980 people (76.81%) were over the age of 18. Canadian Citizenship (2011) Total Percentage of Total Canadian citizens aged under 18 38, % Canadian citizens aged 18 and over 127, % Total Canadian Citizens 166, %
4 Generation Status More than half of Richmond Hill s population is made up of first generation Canadians. 103,220 people identified themselves as first generation Canadians, which equates to 55.99% of the population. The next largest group is second generation Canadians, which account for 50,420 people or 27.35% of the population. Only 30,725 people, or 16.67% of the population identified themselves as being third generation Canadians or more.
5 Immigration Immigration Status The greatest proportion of Richmond Hill s population is made up of immigrants. Richmond Hill s immigrant population accounts for 101,170 citizens, or 54.87% of the total population. Whereas, 81,530 people (44.22%) identified themselves as being non-immigrants. The remainder of Richmond Hill s population, which accounts for 0.90% of the population, is made up of nonpermanent residents. Immigration Status (2011) Total Percentage of Total Total population by immigrant status and selected places of birth 184, % Immigrants 101, % Non-immigrants 81, % Non-permanent residents 1, %
6 Period of Immigration Looking at the time periods of immigration, it is clear that the greatest wave of immigration took place between 1991 and 2000, where 34,375 residents of Richmond Hill immigrated to Canada. This is followed by the 2001 and 2011 period, where 29,200 of Richmond Hill s residents immigrated to Canada.

7 Looking at immigration by year cohorts, it is clear that the majority of Richmond Hill s immigrant population immigrated to Canada fairly recently, within the last 20 years. Of Richmond Hill s 101,170 immigrants, 37.16% of the population arrived in Canada prior to 1991, while 62.84% immigrated to Canada after 1991.
8 Periods of Immigration Percentage of the Number of Immigrants Immigrant Before , % 1971 to , % 1981 to , % 1991 to , % 2001 to , % Total Immigrants 101, % Of the immigrants who arrived in Canada during the 2001 to 2011 period, 16,450 people (56.34%) arrived during the 2001 to 2005 period, while 12,750 (43.66%) arrived during the 2006 to 2011 period. Immigration over the last 10 Years ( ) Number of Immigrants Percentage of New Immigrants ( ) Percentage of Total Immigrant % Total Immigrants 101, % 2001 to , % 28.86% 2001 to , % 16.26% 2006 to , % 12.60%
9 Age at Immigration In terms of the age of immigration, the majority of immigrants in Richmond Hill arrived in Canada during their adulthood % of Richmond Hill s immigrant population arrived in Canada between the ages of 25 to 44 years old. The next largest age cohort to arrive in Canada was the 15 to 24 year old group, with 18,505 people, which accounts for 18.29% of Richmond Hill s total immigrant population. This is followed closely by the 5 to 14 year old age group, with 18,055 people, which accounts for 17.85% of Richmond Hill s total immigrant population. The 45 year old and over age cohort accounted for 11,790 immigrants (11.65%). The smallest age cohort is the under 5 age group, which accounted for only 8,795 people (8.69%).
10 Age at Immigration (2011) Percentage of Immigrant Total Immigrants Total immigrant population in by age at immigration 101, % Under 5 years 8, % 5 to 14 years 18, % 15 to 24 years 18, % 25 to 44 years 44, % 45 years and over 11, %
11 Place of Birth Non-immigrant When looking at the non-immigrant population, the vast majority of residents were born in the Province of Ontario. This accounts for 75,850 people, or 93.03% of the non-immigrant population. The other 5,680 people (6.97%) were born outside the province. Non- Immigrant Place of Birth (2011) Total Non-Immigrant Percentage of Non- Immigrant Non-immigrant 81,530 - Born in province of residence 75, % Born outside province of residence 5, %
 that were born in Asia. This is followed by Europe (23.25%), the Americas (5.")
12 Immigrant When looking at the immigrant population in Richmond Hill by continent, the majority of the residents were born in Asia. There are 66,445 Richmond Hill residents (65.68%) that were born in Asia. This is followed by Europe (23.25%), the Americas (5.75%), and Africa (5.22%).
13 When looking more specifically at countries of place of birth for the Town s immigrant population, China is the country that was most often identified. There are 15,055 residents (14.88%) who identified China as their place of birth. This was followed closely by Iran with 14,415 residents (14.25%), Hong Kong with 12,680 residents (12.53%), Italy (4.30%) and Russia (4.25%). Immigrant Place of Birth Top 20 Countries (2011) Total Immigrant Percentage of Immigrant Total Immigrant 101, % China 15, % Iran 14, % Hong Kong Special Administrative Region 12, % Italy 4, % Russian Federation 4, % South Korea 3, % India 3, % Philippines 3, % United Kingdom 2, % Ukraine 2, % Pakistan 1, % Sri Lanka 1, % Romania 1, % Greece 1, % Viet Nam 1, % Egypt 1, % United States 1, % Taiwan 1, % Jamaica 1, % Iraq %
14 Recent Immigrant Recent immigrants are considered immigrants who landed in Canada between January 1, 2006 and May 10, When looking at the recent immigrant population, the greatest proportion of immigrants continue to be born in China (2,945 people or 23.10%), followed closely once again by Iran (2,650 people or 20.78%). The make-up of the top-5 places of birth changes somewhat when looking only at recent immigration. South Korea becomes the third most common place of birth with 850 people (6.67%), followed by the Philippines with 680 people (5.33%), and Russia with 610 people (4.78%). Recent Immigrant Place of Birth Top 20 Countries ( ) Total Immigrant Percentage of Immigrant Total recent immigrant population ( ) 12, % China 2, % Iran 2, % South Korea % Philippines % Russian Federation % India % Ukraine % United States % Hong Kong Special Administrative Region % Pakistan % Iraq % Sri Lanka % Egypt % Israel % Romania % Afghanistan % United Arab Emirates % United Kingdom % Taiwan % Moldova %
15 Ethnic Origins Ethnic Origins by Region Respondents may have identified more than one ethnic origin as their ethnic background, which attributes to the sum of the total ethnic origin population being greater than the total population of Richmond Hill. Asian origins form the greatest proportion of ethnic backgrounds in Richmond Hill. There are 95,980 residents (46.19%) that identified themselves as being from an Asian origin. This is followed by 82,520 residents (39.72%) that identified themselves as having European origins. Asian and European origins form the greatest proportion of ethnic backgrounds in the Town, and account for 85.91% of the ethnic population. The third largest ethnic group was Other North American Origins, with 16,900 residents (8.13%). Other North American Origins includes general responses indicating North American origins (e.g., 'North American' or 'Canadian') as well as more specific responses indicating North American origins that have not been included elsewhere (e.g., 'Maritimer', 'Manitoban', etc.). Ethnic Origins by Ethnic Regions (2011) Percentage of Ethnic Total Ethnic Asian origins 95, % European origins 82, % Other North American origins 16, % African origins 4, % Caribbean origins 3, % Latin; Central and South American origins 2, % North American Aboriginal origins 1, % Oceania origins % Total Ethnic Origins by Region Identified 207, %
16 Ethnic Origins by Sub-Region If the Ethnic Regions are further broken down into Ethnic Sub-Regions, we can see that it is the East and Southeast Asian region, with 56,685 residents (30.75%), that makes up the majority of the Ethnic population. This is followed by Southern European origins, accounting for 32,605 residents (17.68%), British Isles origins accounting for 26,220 residents (14.22%), West Central Asian and Middle Eastern origins accounting for 25,015 residents (13.57%) and Eastern European origins accounting for 22,435 residents (12.17%). Ethnic Origins by Ethnic Sub-Regions (2011) Percentage of Total Total Ethnic Total 184, % East and Southeast Asian origins 56, % Southern European origins 32, % British Isles origins 26, % West Central Asian and Middle Eastern origins 25, % Eastern European origins 22, % Other North American origins 16, % South Asian origins 15, % Western European origins (except French origins) 8, % Other European origins 8, % French origins 4, % North African origins 2, % Northern European origins (except British Isles origins) 1, % Southern and East African origins 1, % Other African origins 1, % North American Aboriginal origins 1, % Central and West African origins % Other Asian origins %
17 Ethnic Origins by Country The most frequently reported ethnic origin in Richmond Hill is Chinese. The Chinese ethnic origin group accounts for 45,230 people, or 24.53% of the population. This is followed by Italians accounting for 21,570 people (11.70%), Iranians accounting for 17,405 people (9.44%), Canadians accounting for 16,175 people (8.77%) and the English (British Isles origins) accounting for 15,525 people (8.42%). Ethnic Origins by Country Top 20 Countries (2011) Percentage of Total Total Ethnic Total 184, % Chinese 45, % Italian 21, % Iranian 17, % Canadian 16, % English (British Isles origins) 15, % East Indian 11, % Scottish 10, % Russian 9, % Irish 9, % Jewish 8, % Polish 6, % German 5, % Korean 5, % Greek 5, % Ukrainian 4, % French 4, % Filipino 4, % Dutch 2, % British Isles origins; n.i.e. 2, % Portuguese 2, %
18 Visible Minorities Visible Minority Visible minorities are defined as 'persons, other than Aboriginal peoples, who are non-caucasian in race or non-white in colour. Today, over half of Richmond Hill s population considers themselves to be a visible minority. There are 97,465 residents (52.87%) of Richmond Hill that identified themselves as forming part a visible minority. Meanwhile, there are 86,905 residents (47.14%) of Richmond Hill who do not categorize themselves as forming part of a visible minority. In contrast, during the 2006 Census period, 73,885 residents (45.69%) considered themselves as being a visible minority, whereas 87,810 residents (54.31%) did not consider themselves a visible minority. Visible Minority ( ) Total (#) Percentage of (%) Total (#) Percentage of (%) Total population by visible minority 161, % 184, % Not a visible minority 87, % 86, % Total visible minority population 73, % 97, %
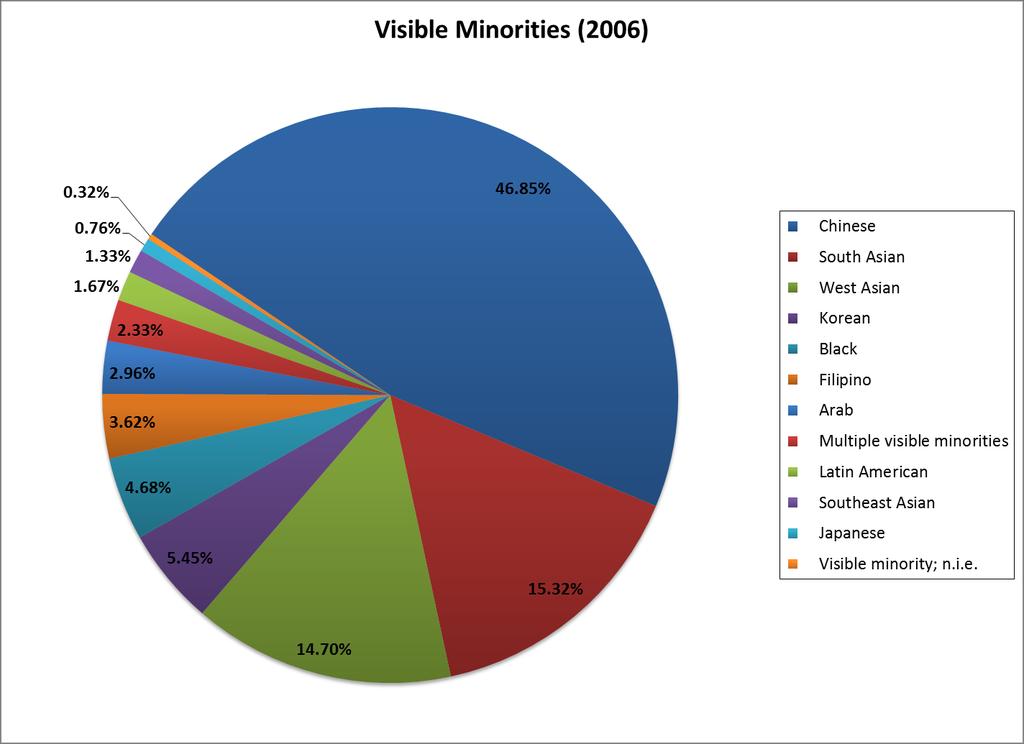
19 Visible Minority Composition In terms of the make-up of the visible minority population, the greatest proportion of the visible minority population identifies themselves as Chinese. The Chinese population makes up 43,530 residents of the Town, and forms 44.66% of the visible minority population. The next largest visible minority groups are West Asians (16.30%), followed closely by South Asians (15.41%), Koreans (5.18%) and Filipinos (4.16%). These trends are very similar to the last Census period. In 2006 the greatest proportion of the visible minority population also identified themselves as Chinese, and comprised 46.85% of the visible minority population. In 2006, the next largest visible minority groups were also South Asians (15.32%), West Asians (14.70%) and Koreans (5.45%), however the Black population (4.68%) was the fifth largest visible minority group at the time. Visible Minority Composition ( ) Total (#) Percentage of (%) Total (#) Percentage of (%) Chinese 34, % 43, % West Asian 10, % 15, % South Asian 11, % 15, % Korean 4, % 5, % Filipino 2, % 4, % Black 3, % 3, % Arab 2, % 3, % Multiple visible minorities 1, % 2, % Latin American 1, % 1, % Southeast Asian % 1, % Japanese % % Visible minority; n.i.e % % Total visible minority population 73, % 97, %
20
21 Language Non-Official Languages The 'Non-official Languages Spoken' category represents the sum of single language responses and multiple language responses in which the respondent can conduct a conversation (other than English or French). Respondents are able to select more than one language, therefore the reported totals may double-count some of the population. There are 119,660 people that identified themselves as having knowledge of a non-official language (excluding Aboriginal languages). The most commonly spoken non-official language was Cantonese, which is spoken by 19,650 people, or 16.42% of the non-official language population. This is followed by Persian, which is spoken by 17,910 people, or 14.97% of the non-official language population. The third most common non-official language spoken is Chinese; n.o.s. (not otherwise specified), which accounts for 12,105 residents, or 10.12% of the population.
22 Knowledge of Non-Official Languages Spoken (Non-Aboriginal) Top 20 Percentage of Total Total Total population by non-official languages spoken 119, % Cantonese 19, % Persian (Farsi) 17, % Chinese; n.o.s. 12, % Mandarin 11, % Russian 11, % Italian 10, % Korean 4, % Arabic 3, % Spanish 3, % Greek 3, % Tagalog (Pilipino;Filipino) 3, % Gujarati 3, % Hindi 2, % Urdu 2, % Hebrew 2, % German 1, % Romanian 1, % Tamil 1, % Ukrainian 1, % Panjabi (Punjabi) 1, %
23 Religion Religion Half of Richmond Hill s population 50.00% - identified themselves as being Christian. Christianity is the biggest religious group identified in the Town, with 92,195 people identifying some form of Christianity as their religion. The next largest group is No Religious Affiliation, which makes up over a quarter of the population 26.54% - with 48,690 responses. The third largest religious group is Muslim, with 21,245 residents, or 11.52% of the population.
24 Religion (2011) Total Percentage of Total Christian 92, % No religious affiliation 48, % Muslim 21, % Jewish 10, % Buddhist 5, % Hindu 4, % Other religions 1, % Sikh % Traditional (Aboriginal) Spirituality % TOTAL 184, %
25 Christianity Of the Christian population, over half (51.02%) are Catholics. This is followed by Other Christian (17.34%) and Christian Orthodox (13.17%).
26 Aboriginal Aboriginal Identity There are 395 people who identified themselves as Aboriginal in Richmond Hill. This accounts for a modest 0.21% of the total population. Aboriginal Identity (2011) Total Percentage of Total Total population by Aboriginal identity 184, % Aboriginal identity % Non-Aboriginal identity 183, % Aboriginal Ancestry A greater proportion of people identified themselves as having Aboriginal ancestry, in comparison to those who identify themselves as Aboriginal. This accounts for 1,140 residents, or 0.62% of the population. Aboriginal Ancestry (2011) Total Percentage of Total Total population by Aboriginal ancestry 184, % Aboriginal ancestry 1, % Non-Aboriginal ancestry 183, %
27 Of the population that identified themselves as having Aboriginal ancestry, over three-quarters of the respondents identified themselves as having First Nations ancestry (78.07%). The remainder of the Aboriginal population is made up of Métis (18.86%) and Inuit (3.07%) ancestry. Aboriginal Ancestry Identity (2011) Total Percentage of Total Aboriginal Ancestry Identity 1, % First Nations (North American Indian) Aboriginal ancestry % Métis ancestry % Inuit ancestry % Registered or Treaty Indian Status There are 185 people who identified themselves as being a Registered or Treaty Indian. This accounts for only 0.10% of Richmond Hill s population.
Study Area Maps. Profile Tables. W Broadway & Cambie St, Vancouver, BC Pitney Bowes 2016 Estimates and Projections. W Broadway & Cambie St
 Powered by PCensus Page 1 Study Area Maps Profile Tables 2016 Demographic Snapshot Population Trends Household Trends Population by Age and Sex Comparison Population by Age and Sex Household Maintainers
North Vancouver, City of A City in Greater Vancouver Regional District
 Global Non-Response Rate: 25.8 Population Total Immigrants Change in Change in Immigrants Population Number Percent Population Number Percent 1991 38,436,8 28.2 1991 to 1996 3,39 2,46 22.7 1996 41,475
Saanich A District Municipality in Capital Regional District
 Produced by Stats for Population Total Immigrants Change in Change in Immigrants Population Number Percent Population Number Percent 1991 95,583 20,285 21.2 1991 to 1996 5,805 755 3.7 1996 101,388 21,040
Strathcona A Regional District in British Columbia
 Produced by Stats for Population Total Immigrants Change in Change in Immigrants Population Number Percent Population Number Percent 1991 - - - 1991 to 1996 - - - 1996 - - - 1996 to 1 - - - 1 - - - 1 to
Nanaimo A City in Nanaimo Regional District
 A City in Regional District Produced by Stats for Population Total Immigrants Change in Change in Immigrants Population Number Percent Population Number Percent 1991 6,129 8,885 14.8 1991 to 1996,1 2,44
Castlegar A City in Central Kootenay Regional District
 Produced by Stats for Population Total Immigrants Change in Change in Immigrants Population Number Percent Population Number Percent 1991 6,579 885 13.5 1991 to 1996 448 45 5.1 1996 7,27 93 13.2 1996 to
Burnaby A City in Greater Vancouver Regional District
 Produced by Stats for Global Non-Response Rate: 23.6 Population Total Change in Change in Population Number Percent Population Number Percent 1991 158,858 49,5 31.2 1991 to 1996,351 24,5 49.1 1996 179,9
View Royal A Town in Capital Regional District
 Produced by Stats for Global NonResponse Rate: 18.4 Population Total Immigrants Change in Change in Immigrants Population Number Percent Population Number Percent 1991 5,996 9 15.6 1991 to 1996 445 315
North Okanagan A Regional District in British Columbia
 Population Total Immigrants Change in Change in Immigrants Population Number Percent Population Number Percent 1991 61,744 7,855 12.7 1991 to 1996 9,863 685 8.7 1996 71,67 8,54 11.9 1996 to 1 1,6-28 -
East Kootenay A Regional District in British Columbia
 Produced by Stats for Global Non-Response Rate: 35.5 Population Total Immigrants Change in Change in Immigrants Population Number Percent Population Number Percent 1991 52,368 5,9 11.3 1991 to 1996 3,998-55
Victoria A City in Capital Regional District
 Produced by Stats for Global Non-Response Rate: 24.6 Population Total Immigrants Change in Change in Immigrants Population Number Percent Population Number Percent 1991 71,228 14,665 20.6 1991 to 1996
Salmon Arm A City in Columbia-Shuswap Regional District
 Produced by Stats for Global NonResponse Rate: 22.8 Population Total Change in Change in Population Number Percent Population Number Percent 1991 12,115 1,365 11.3 1991 to 1996 2,549 25 18.3 1996 14,664
Skeena-Queen Charlotte A Regional District in British Columbia
 Global NonResponse Rate: 34.7 Population Total Immigrants Change in Change in Immigrants Population Number Percent Population Number Percent 1991 24,287 3,125 12.9 1991 to 1996 58 27 8.6 1996 24,795 2,855
Quesnel A City in Cariboo Regional District
 Produced by Stats for Global NonResponse Rate:.4 Population Total Immigrants Change in Change in Immigrants Population Number Percent Population Number Percent 1991 8,8 1,35 16.4 1991 to 1996 26 5.4 1996
IMMIGRANTS AND VISIBLE MINORITIES IN PEEL
 THE SOCIAL PLANNING COUNCIL OF PEEL ISSN #1198-5976 I n f o S h a r e VOLUME 11, NUMBER 1 MAY 2003 IMMIGRANTS AND VISIBLE MINORITIES IN PEEL Information on cultural diversity within a population is important
Visit our Publications and Open Data Catalogue to find our complete inventory of our freely available information products.
 Welcome to Mississauga Data This report and other related documents can be found at www.mississauga.ca/data. Mississauga Data is the official City of Mississauga website that contains urban planning related
CITY OF MISSISSAUGA. Overview 2-1. A. Demographic and Cultural Characteristics
 Portraits of Peel Overview 2-1 A. Demographic and Cultural Characteristics Population: Size, Age and Growth 2-2 Immigrants 2-3 Visible Minorities 2-4 Language 2-5 Religion 2-6 Mobility Status 2-7 B. Household
Lake Country A District Municipality in Central Okanagan Regional District
 Produced by Stats for Population Total Immigrants Change in Change in Immigrants Population Number Percent Population Number Percent 1991 1991 to 1996 1996 9,7 1,275 14.2 1996 to 1 26 7 5.5 1 9,267 1,345
CENSUS RESULTS WARD 10 PROFILE
 2011 CENSUS RESULTS WARD 10 PROFILE Town of Halton Hills City of Brampton Hwy. 407 Finch Ave. Town of Milton Hwy. 407 ETR Ninth Line 10 Derry Rd. Winston Churchill Blvd. 9 Erin Mills Pkwy. Mississauga
Grand Forks A City in Kootenay-Boundary Regional District
 A City in KootenayBoundary Regional District Produced by Stats for Global NonResponse Rate: 45.8 Population Total Immigrants Change in Change in Immigrants Population Number Percent Population Number Percent
CENSUS RESULTS WARD 8 PROFILE
 2011 CENSUS RESULTS WARD 8 PROFILE Town of Halton Hills City of Brampton Hwy. 407 Finch Ave. Town of Milton Hwy. 407 ETR Ninth Line 10 Derry Rd. Winston Churchill Blvd. 9 Erin Mills Pkwy. Mississauga Rd.
Immigration and Ethnocultural Diversity in Quebec
 Immigration and Ethnocultural Diversity in Quebec The National Household Survey (NHS) Regional analysis January 2014 Immigration and Ethnocultural Diversity in Canada was part of the first release of data
Northern Rockies Regional Municipality A Regional Municipality in Northern Rockies Regional District
 Produced by Stats for Global NonResponse Rate: 39.2 Population Total Immigrants Change in Change in Immigrants Population Number Percent Population Number Percent 1991 1991 to 1996 1996 1996 to 21 21 21
Osoyoos A Town in Okanagan-Similkameen Regional District
 A Town in OkanaganSimilkameen Regional District Produced by Stats for Global NonResponse Rate: 38.5 Population Total Immigrants Change in Change in Immigrants Population Number Percent Population Number
ADMISSIONS SURVEY FALL 2017 ENTERING CLASS
 ADMISSIONS SURVEY FALL 2017 ENTERING CLASS Response to Survey: 100% represents 1% or less Gender Male 44% 46% Female 55% 52% Trans - Gender non-conforming - Choose not to answer - 2% Language Most Comfortable
2016 Census: Housing, Immigration and Ethnocultural Diversity, Aboriginal peoples
 October 26, 2017 Backgrounder 2016 Census: Housing, Immigration and Ethnocultural Diversity, Aboriginal peoples The 2016 Census Day was May 10, 2016. On October 25, 2017, Statistics Canada released data
Harrison Hot Springs A Village in Fraser Valley Regional District
 Global NonResponse Rate: 42.4 Population Total Immigrants Change in Change in Immigrants Population Number Percent Population Number Percent 1991 655 17 26. 1991 to 1996 243 3 17.6 1996 898 2 22.3 1996
CENSUS RESULTS WARD 3 PROFILE
 2011 CENSUS RESULTS WARD 3 PROFILE Town of Halton Hills City of Brampton Hwy. 407 Finch Ave. Town of Milton Hwy. 407 ETR Ninth Line 10 Derry Rd. Winston Churchill Blvd. 9 Erin Mills Pkwy. Mississauga Rd.
CENSUS RESULTS WARD 9 PROFILE
 2011 CENSUS RESULTS WARD 9 PROFILE Town of Halton Hills City of Brampton Hwy. 407 Finch Ave. Town of Milton Hwy. 407 ETR Ninth Line 10 Derry Rd. Winston Churchill Blvd. 9 Erin Mills Pkwy. Mississauga Rd.
CENSUS RESULTS WARD 6 PROFILE
 2011 CENSUS RESULTS WARD 6 PROFILE Town of Halton Hills City of Brampton Hwy. 407 Finch Ave. Town of Milton Hwy. 407 ETR Ninth Line 10 Derry Rd. Winston Churchill Blvd. 9 Erin Mills Pkwy. Mississauga Rd.
2011 CENSUS & NATIONAL HOUSEHOLD SURVEY CITY OF BRAMPTON - WARD 3 PROFILE
 2011 CENSUS & NATIONAL HOUSEHOLD SURVEY CITY OF BRAMPTON WARD 3 PROFILE WARD HIGHLIGHTS Population 47,500 2011 Population 50.7% Females 2011 Population by Age Group 13% 18% 014 9.07% of total population
Enderby A City in North Okanagan Regional District
 Produced by Stats for Global NonResponse Rate: 44.3 Population Total Immigrants Change in Change in Immigrants Population Number Percent Population Number Percent 1991 2,128 23.8 1991 to 1996 626 3 13.
North York City of Toronto Community Council Area Profiles 2016 Census
 Bar Chart showing the rate of population growth between the years 2006 and 2016 for the Ward compared to the City of based on the 2006 and data. For more information, please contact Michael Wright at 416-392-7558
Powell River A City in Powell River Regional District
 A City in Regional District Produced by Stats for Population Total Immigrants Change in Change in Immigrants Population Number Percent Population Number Percent 1991 12,991 1,965 15.1 1991 to 1996 14 4
Parksville A City in Nanaimo Regional District
 Produced by Stats for Global NonResponse Rate: 2.3 Population Total Immigrants Change in Change in Immigrants Population Number Percent Population Number Percent 1991 7,381 1,27 17.2 1991 to 1996 2,91
COMMUNITY PROFILE COQUITLAM. Coquitlam Immigrant Demographics I Page 1
 COMMUNITY PROFILE COQUITLAM Coquitlam Demographics I Page 1 COQUITLAM IMMIGRANT DEMOGRAPHICS Your quick and easy look at facts and figures around immigration. Newcomers are an important and growing part
CENSUS RESULTS NATIONAL HOUSEHOLD SURVEY
 2011 CENSUS RESULTS NATIONAL HOUSEHOLD SURVEY INTRODUCTION The inaugural National Household Survey (NHS) was a voluntary survey which replaced the mandatory long-form census questionnaire. The NHS was
Ward 4 Etobicoke Centre City of Toronto Ward Profiles 2016 Census
 Bar Chart showing the rate of population growth between the years 2006 and 2016 for the Ward compared to the City of based on the 2006 and data. For more information, please contact Michael Wright at 416-392-7558
CENSUS RESULTS WARD 7 PROFILE
 2011 CENSUS RESULTS WARD 7 PROFILE Town of Halton Hills City of Brampton Hwy. 407 Finch Ave. Town of Milton Hwy. 407 ETR Ninth Line 10 Derry Rd. Winston Churchill Blvd. 9 Erin Mills Pkwy. Mississauga Rd.
Nelson A City in Central Kootenay Regional District
 Produced by Stats for Global NonResponse Rate: 28.3 Population Total Immigrants Change in Change in Immigrants Population Number Percent Population Number Percent 1991 8,849 1,175 13.3 1991 to 1996 736
COMMUNITY PROFILE BURNABY
 COMMUNITY PROFILE BURNABY Burnaby Demographics I Page 1 BURNABY IMMIGRANT DEMOGRAPHICS Your quick and easy look at facts and figures around immigration. Newcomers are an important and growing part of your
BRAMALEA. Overview A. Demographic and Cultural Characteristics
 The Social Planning Council of Peel Portraits of Peel BRAMALEA Overview 13-1 A. Demographic and Cultural Characteristics Population: Size, Age and Growth 13-2 Immigrants 13-3 Visible Minorities 13-4 Language
people/hectare Ward Toronto
 Bar Chart showing the rate of population growth between the years 2006 and 2016 for the Ward compared to the City of based on the 2006 and data. For more information, please contact Michael Wright at 416-392-7558
2011 CENSUS & NATIONAL HOUSEHOLD SURVEY CITY OF BRAMPTON - WARD 1 PROFILE
 CENSUS & NATIONAL HOUSEHOLD SURVEY CITY OF BRAMPTON WARD 1 PROFILE WARD HIGHLIGHTS Population 53,130 Population 51.0% Females Population by Age Group 9% 20% 014 10.14% of total population 36 Median Age
2011 CENSUS & NATIONAL HOUSEHOLD SURVEY CITY OF BRAMPTON - WARD 4 PROFILE
 2011 CENSUS & NATIONAL HOUSEHOLD SURVEY CITY OF BRAMPTON WARD 4 PROFILE WARD HIGHLIGHTS Population 9.51% of total population 49,850 2011 Population 34 Median Age 50.5% Females 49.5% Males 2011 Population
Dufferin Grove: Neighbourhood Profile
 I. Population and Age Population 21 Neighbourhood Population: 12693 12% of Catchment Area Population: Change in population growth (1996-21): # 145 % 1% same as pop change in the catchment area Population
Measuring Identities, Diversity and Inclusion: Results from the 2016 Census
 Measuring Identities, Diversity and Inclusion: Results from the 2016 Census www.statcan.gc.ca Telling Canada s story in numbers Jane Badets Assistant Chief Statistician Social, Health and Labour Statistics
2011 CENSUS & NATIONAL HOUSEHOLD SURVEY CITY OF BRAMPTON - WARD 10 PROFILE
 2011 CENSUS & NATIONAL HOUSEHOLD SURVEY CITY OF BRAMPTON WARD 10 PROFILE WARD HIGHLIGHTS Population 10.72% of total population 56,185 2011 Population 33 Median Age 50.1% Females 49.9% Males 2011 Population
Ward 17 Davenport City of Toronto Ward Profiles 2016 Census
 Bar Chart showing the rate of population growth between the years 2006 and 2016 for the Ward compared to the City of based on the 2006 and data. For more information, please contact Michael Wright at 416-392-7558
Fort St. James A District Municipality in Bulkley-Nechako Regional District
 A District Municipality in BulkleyNechako Regional District Produced by Stats for Global NonResponse Rate: 36.9 Population Total Immigrants Change in Change in Immigrants Population Number Percent Population
Port McNeill A Town in Mount Waddington Regional District
 Produced by Stats for Global NonResponse Rate: 35.1 Population Total Immigrants Change in Change in Immigrants Population Number Percent Population Number Percent 1991 2,641 225 8.5 1991 to 1996 284 5
Scarborough City of Toronto Community Council Area Profiles 2016 Census
 Bar Chart showing the rate of population growth between the years 2006 and 2016 for the Ward compared to the City of based on the 2006 and data. For more information, please contact Michael Wright at 416-392-7558
Highlands A District Municipality in Capital Regional District
 Produced by Stats for Global NonResponse Rate: 33 Population Total Immigrants Change in Change in Immigrants Population Number Percent Population Number Percent 1991 1,94 1991 to 1996 329 1996 1,423 21
Ward 14 Parkdale-High Park City of Toronto Ward Profiles 2016 Census
 Bar Chart showing the rate of population growth between the years 2006 and 2016 for the Ward compared to the City of based on the 2006 and data. For more information, please contact Michael Wright at 416-392-7558
Lake Cowichan A Town in Cowichan Valley Regional District
 Global NonResponse Rate: 28 Population Total Change in Change in Population Number Percent Population Number Percent 1991 2,241 295 13.2 1991 to 1996 615 15 5.1 1996 2,856 28 9.8 1996 to 21 29 2 7.1 21
Social and Demographic Trends in Burnaby and Neighbouring Communities 1981 to 2006
 Social and Demographic Trends in and Neighbouring Communities 1981 to 2006 October 2009 Table of Contents October 2009 1 Introduction... 2 2 Population... 3 Population Growth... 3 Age Structure... 4 3
Creston A Town in Central Kootenay Regional District
 Produced by Stats for Global NonResponse Rate: 32.4 Population Total Immigrants Change in Change in Immigrants Population Number Percent Population Number Percent 1991 4,27 655 15.6 1991 to 1996 69 175
(Note: These are inititial neighbourhood estimates and are subject to change.) NEI Score. 1,000 Female 52%
 NEI Score. 1,000 Female 52%") 0-4 5-9 10-14 15-19 20-24 25-29 30-34 35-39 40-44 45-49 50-54 55-59 60-64 65-69 70-74 75-79 80-84 85-89 90-94 95-99 100+ 2011 Neighbourhood Demographic Estimates EGLINTON AVE E C P R DON VALLEY PARKWAY
0-4 5-9 10-14 15-19 20-24 25-29 30-34 35-39 40-44 45-49 50-54 55-59 60-64 65-69 70-74 75-79 80-84 85-89 90-94 95-99 100+ 2011 Neighbourhood Demographic Estimates EGLINTON AVE E C P R DON VALLEY PARKWAY
(Note: These are inititial neighbourhood estimates and are subject to change.) SCARBOROUGH SHORELINE. NEI Score. 1,500 Female 53%
 SCARBOROUGH SHORELINE. NEI Score. 1,500 Female 53%") 0-4 5-9 10-14 15-19 20-24 25-29 30-34 35-39 40-44 45-49 50-54 55-59 60-64 65-69 70-74 75-79 80-84 85-89 90-94 95-99 100+ 2011 Neighbourhood Demographic Estimates HIGHLAND CREEK WEST HIGHLAND CREEK KINGSTON
0-4 5-9 10-14 15-19 20-24 25-29 30-34 35-39 40-44 45-49 50-54 55-59 60-64 65-69 70-74 75-79 80-84 85-89 90-94 95-99 100+ 2011 Neighbourhood Demographic Estimates HIGHLAND CREEK WEST HIGHLAND CREEK KINGSTON
Immigrant. coquitlam, B.C Coquitlam Immigrant Demographics I
 Immigrant demographics coquitlam, B.C. - 2018 Immigrant Demographics I Page 1 coquitlam IMMIGRANT DEMOGRAPHICS Your quick and easy look at facts and figures around immigration. Newcomers are an important
Immigration and Ethno-Cultural Diversity
 2016 London Census: Fact Sheet 7 Immigration and Ethno-Cultural Diversity On October 25, 2017 Statistics Canada released the 2016 Census data on Immigration and Ethno-Cultural Diversity. This summary highlights
COMMUNITY PROFILE TOWNSHIP OF LANGLEY. Township of Langley Immigrant Demographics I Page 1
 COMMUNITY PROFILE TOWNSHIP OF LANGLEY Township of Langley Demographics I Page 1 TOWNSHIP OF LANGLEY IMMIGRANT DEMOGRAPHICS Your quick and easy look at facts and figures around immigration. Newcomers are
Cache Creek A Village in Thompson-Nicola Regional District
 A Village in ThompsonNicola Regional District Produced by Stats for Global NonResponse Rate: 39.1 Population Total Immigrants Change in Change in Immigrants Population Number Percent Population Number
CENSUS BULLETIN #5 Immigration and ethnocultural diversity Housing Aboriginal peoples
 CENSUS BULLETIN #5 Immigration and ethnocultural diversity Housing Aboriginal peoples October 25, 217 Bulletin Highlights: 86.1 per cent of the Brampton s 216 surveyed population held a Canadian citizenship
(Note: These are inititial neighbourhood estimates and are subject to change.) 1,000 Female 54%
 1,000 Female 54%") LAWRENCE AVE E 0-4 5-9 10-14 15-19 20-24 25-29 30-34 35-39 40-44 45-49 50-54 55-59 60-64 65-69 70-74 75-79 80-84 85-89 90-94 95-99 100+ 2011 Neighbourhood Demographic Estimates RAILSIDE RD C P R DON RIVER
LAWRENCE AVE E 0-4 5-9 10-14 15-19 20-24 25-29 30-34 35-39 40-44 45-49 50-54 55-59 60-64 65-69 70-74 75-79 80-84 85-89 90-94 95-99 100+ 2011 Neighbourhood Demographic Estimates RAILSIDE RD C P R DON RIVER
Logan Lake A District Municipality in Thompson-Nicola Regional District
 A District Municipality in ThompsonNicola Regional District Produced by Stats for Global NonResponse Rate: 48.9 Population Total Immigrants Change in Change in Immigrants Population Number Percent Population
Changing Faces Profile of Burlington Newcomers. November 2010
 Changing Faces Profile of Burlington Newcomers November 2010 2010 Community Development Halton, all rights reserved. Copies of this document may be reproduced non-commercially for the purpose of community
(Note: These are inititial neighbourhood estimates and are subject to change.) C P R. NEI Score. 600 Female 51%
 C P R. NEI Score. 600 Female 51%") 0-4 5-9 10-14 15-19 20-24 25-29 30-34 35-39 40-44 45-49 50-54 55-59 60-64 65-69 70-74 75-79 80-84 85-89 90-94 95-99 100+ 2011 Neighbourhood Demographic Estimates STEELES AVE W FENMAR DR C P R GARYRAY DR
0-4 5-9 10-14 15-19 20-24 25-29 30-34 35-39 40-44 45-49 50-54 55-59 60-64 65-69 70-74 75-79 80-84 85-89 90-94 95-99 100+ 2011 Neighbourhood Demographic Estimates STEELES AVE W FENMAR DR C P R GARYRAY DR
Immigrant Seniors in British Columbia
 Immigrant Seniors in British Columbia December 2010 Immigrant Seniors in British Columbia Most people who immigrate as seniors come to B.C. to reunite with their families. In fact, 86.2% of the 5,733 new
(Note: These are inititial neighbourhood estimates and are subject to change.) C P R. NEI Score. Female 52%
 C P R. NEI Score. Female 52%") 0-4 5-9 10-14 15-19 20-24 25-29 30-34 JANE ST 35-39 40-44 45-49 50-54 55-59 60-64 65-69 70-74 75-79 80-84 85-89 90-94 95-99 100+ 2011 Neighbourhood Demographic Estimates EGLINTON AVE W JANE ST WESTON RD
0-4 5-9 10-14 15-19 20-24 25-29 30-34 JANE ST 35-39 40-44 45-49 50-54 55-59 60-64 65-69 70-74 75-79 80-84 85-89 90-94 95-99 100+ 2011 Neighbourhood Demographic Estimates EGLINTON AVE W JANE ST WESTON RD
Keelesdale-Eglinton West
 BLACK CREEK DR 0-4 5-9 10-14 15-19 20-24 25-29 30-34 KEELE ST 35-39 40-44 45-49 50-54 -59 KANE AVE 60-64 65-69 70-74 75-79 80-84 85-89 90-94 95-99 100+ 2011 Neighbourhood Demographic Estimates EGLINTON
Economic Activity in London
 CIS2013-10 Economic Activity in London September 2013 copyright Greater London Authority September 2013 Published by Greater London Authority City Hall The Queens Walk London SE1 2AA www.london.gov.uk
(Note: These are inititial neighbourhood estimates and are subject to change.) C N R. NEI Score. Female 54%
 C N R. NEI Score. Female 54%") 0-4 5-9 10-14 15-19 20-24 25-29 30-34 35-39 40-44 45-49 50-54 55-59 60-64 65-69 70-74 75-79 80-84 85-89 90-94 95-99 100+ 2011 Neighbourhood Demographic Estimates STANSBURY CRES MIDLAND AVE CITADEL DR WEST
0-4 5-9 10-14 15-19 20-24 25-29 30-34 35-39 40-44 45-49 50-54 55-59 60-64 65-69 70-74 75-79 80-84 85-89 90-94 95-99 100+ 2011 Neighbourhood Demographic Estimates STANSBURY CRES MIDLAND AVE CITADEL DR WEST
TABLE OF CONTENTS. Settlement in the City of Whitehorse by Migration Stream - July to June
 TABLE OF CONTENTS City of Whitehorse Department of Immigration and Citizenship Settlement Database Settlement in the City of Whitehorse by Migration Stream - July 1 2002 to June 30 2007 Settlement by Country
Spallumcheen A District Municipality in North Okanagan Regional District
 Produced by Stats for Global NonResponse Rate: 45.4 Population Total Immigrants Change in Change in Immigrants Population Number Percent Population Number Percent 1991 4,717 66 14. 1991 to 1996 65 155
new westminster, B.C New Westminster Immigrant Demographics I
 Immigrant demographics new westminster, B.C. - 2018 Immigrant Demographics I Page 1 new westminster IMMIGRANT DEMOGRAPHICS Your quick and easy look at facts and figures around immigration. Newcomers are
TABLE OF CONTENTS PAGE I. DEMOGRAPHIC TRENDS...1 II. CRIME TRENDS...17 III. YOUTH CRIME...51 IV. VICTIMISATION...71 V. TRAFFIC...
 26 ENVIRONMENTAL SCAN UPDATE AUGUST 26 PREFATORY NOTE: Due to the long-term nature of many trends outlined in the Environmental Scan, and to align with the Service's Business Planning process, a complete
DIVERSITY IN SASKATCHEWAN
 DIVERSITY IN SASKATCHEWAN Prepared for the: Saskatchewan Cooperative Association January 2016 Doug Elliott Sask Trends Monitor 444 19th Avenue Regina, Saskatchewan S4N 1H1 306-522-5515 sasktrends@sasktel.net
Culturally and Linguistically Diverse People Living in NSW: Selected characteristics
 Culturally and Linguistically Diverse People Living in NSW: Selected characteristics Contents Introduction 3 Countries people were born in 4 Most common ethnic groups 6 Trends in the number of arrivals
Immigrant PORT COQUITLAM, B.C Port Coquitlam Immigrant Demographics I
 Immigrant demographics PORT COQUITLAM, B.C. - 2018 Immigrant Demographics I Page 1 PORT COQUITLAM IMMIGRANT DEMOGRAPHICS Your quick and easy look at facts and figures around immigration. Newcomers are
Canada at 150 and the road ahead A view from Census 2016
 Canada at 150 and the road ahead A view from Census 2016 Dr. Doug Norris Senior Vice President and Chief Demographer 2017 Environics Analytics User Conference November 8, 2017 Canada continues to lead
The Planning & Development Department recommends that Council receive this report for information.
 CORPORATE REPORT NO: R237 COUNCIL DATE: November 19, 2018 REGULAR COUNCIL TO: Mayor & Council DATE: November 15, 2018 FROM: General Manager, Planning & Development FILE: 6600-01 SUBJECT: Surrey Community
AVERAGE HOUSEHOLD INCOME $97,637 ($93,586) RENTERS 22% (29%) UNEMPLOYMENT RATE 7% (7%) TAKE TRANSIT TO WORK 15% (15%)
 RENTERS 22% (29%) UNEMPLOYMENT RATE 7% (7%) TAKE TRANSIT TO WORK 15% (15%)") CITY OF COMMUNITY PROFILES 2016 Census Data City of Surrey Statistics WHALLEY CITY CENTRE GUILDFORD NEWTON CLOVERDALE AREA 1,809 ha (32,621 ha) AVERAGE HOUSEHOLD INCOME $97,637 ($93,586) SOUTH POPULATION
CITY OF COMMUNITY PROFILES 2016 Census Data City of Surrey Statistics WHALLEY CITY CENTRE GUILDFORD NEWTON CLOVERDALE AREA 1,809 ha (32,621 ha) AVERAGE HOUSEHOLD INCOME $97,637 ($93,586) SOUTH POPULATION
2016 Census: Release 5 Immigration and ethnocultural diversity, Housing and the Aboriginal population
 2016 Census: Release 5 Immigration and ethnocultural diversity, Housing and the Aboriginal population Dr. Doug Norris Senior Vice President and Chief Demographer November 2, 2017 Today s presenter Dr.
Verdun borough HIGHLIGHTS. In 1996, the Verdun borough had a population of 59,714. LOCATION
 Socio-economic profile borough February 2002 HIGHLIGHTS In 1996, the borough had a population of 59,714. LOCATION Between 1991 and 1996, the population of the borough declined by 2.6%. One-person households
TOWNSHIP OF LANGLEY, B.C Township of Langley Immigrant Demographics I
 Immigrant demographics TOWNSHIP OF LANGLEY, B.C. - 2018 Township of Langley Immigrant Demographics I Page 1 TOWNSHIP OF LANGLEY IMMIGRANT DEMOGRAPHICS Your quick and easy look at facts and figures around
Kaslo A Village in Central Kootenay Regional District
 Produced by Stats for Global NonResponse Rate: 46.8 Population Total Immigrants Change in Change in Immigrants Population Number Percent Population Number Percent 1991 863 15 17.4 1991 to 1996 2 15 1.
FAQ 7: Why Origins totals and percentages differs from ONS country of birth statistics
 FAQ 7: Why totals and percentages differs from ONS country statistics 7 December 2016 Purpose of Information Note When the numbers and percentages of names by are compared with the numbers and percentages
$58,761 ($93,586) 57% (29%) 8% (7%) 36% (15%)
 57% (29%) 8% (7%) 36% (15%)") CITY OF COMMUNITY PROFILES 2016 Census Data City of Surrey Statistics CITY WHALLEY GUILDFORD FLEETWOOD NEWTON CLOVERDALE AREA 548 ha (32,621 ha) AVERAGE HOUSEHOLD INCOME $58,761 ($93,586) SOUTH POPULATION
CITY OF COMMUNITY PROFILES 2016 Census Data City of Surrey Statistics CITY WHALLEY GUILDFORD FLEETWOOD NEWTON CLOVERDALE AREA 548 ha (32,621 ha) AVERAGE HOUSEHOLD INCOME $58,761 ($93,586) SOUTH POPULATION
AVERAGE HOUSEHOLD INCOME $103,177 ($93,586) RENTERS 21% (29%) UNEMPLOYMENT RATE 5% (7%) TAKE TRANSIT TO WORK 6% (15%)
 RENTERS 21% (29%) UNEMPLOYMENT RATE 5% (7%) TAKE TRANSIT TO WORK 6% (15%)") CITY OF COMMUNITY PROFILES 2016 Census Data City of Surrey Statistics WHALLEY CITY CENTRE GUILDFORD FLEETWOOD NEWTON AREA 4,917 ha (32,621 ha) AVERAGE HOUSEHOLD INCOME $103,177 ($93,586) SOUTH POPULATION
CITY OF COMMUNITY PROFILES 2016 Census Data City of Surrey Statistics WHALLEY CITY CENTRE GUILDFORD FLEETWOOD NEWTON AREA 4,917 ha (32,621 ha) AVERAGE HOUSEHOLD INCOME $103,177 ($93,586) SOUTH POPULATION
Catholic School Board Services Association
 Catholic School Board Services Association The Demographic Landscape Thursday, March 5, 2015 Jack Ammendolia Director, Education Division The Baby Boom Post WWII in Canada, the population and especially
Immigrant DELTA, B.C Delta Immigrant Demographics I
 Immigrant demographics DELTA, B.C. - 2018 Immigrant Demographics I Page 1 DELTA IMMIGRANT DEMOGRAPHICS Your quick and easy look at facts and figures around immigration. Newcomers are an important and growing
The Future of North West Sydney
 The Future of North West Sydney AUGUST 2018 2 Contents Demographic & Education Trends in Sydney s North West 5 Methodology 7 Sydney s North West 8 Population growth 8 Age profile 9 Student enrolments 12
AVERAGE HOUSEHOLD INCOME $83,026 ($93,586) RENTERS 37% (29%) UNEMPLOYMENT RATE 7% (7%) TAKE TRANSIT TO WORK 20% (15%)
 RENTERS 37% (29%) UNEMPLOYMENT RATE 7% (7%) TAKE TRANSIT TO WORK 20% (15%)") CITY OF COMMUNITY PROFILES 2016 Census Data City of Surrey Statistics CITY CENTRE GUILDFORD FLEETWOOD NEWTON CLOVERDALE AREA 3,131 ha (32,621 ha) AVERAGE HOUSEHOLD INCOME $83,026 ($93,586) SOUTH POPULATION
CITY OF COMMUNITY PROFILES 2016 Census Data City of Surrey Statistics CITY CENTRE GUILDFORD FLEETWOOD NEWTON CLOVERDALE AREA 3,131 ha (32,621 ha) AVERAGE HOUSEHOLD INCOME $83,026 ($93,586) SOUTH POPULATION
TABLE OF CONTENTS. Department of Immigration and Citizenship Settlement Database
 TABLE OF CONTENTS Eastern Region Department of Immigration and Citizenship Settlement Database Settlement in the Eastern Region by Migration Stream - July 1 2002 to June 30 2007 Settlement in the Eastern
Corporate. Report COUNCIL DATE: April 28, 2008 NO: R071 REGULAR COUNCIL. TO: Mayor & Council DATE: April 28, 2008
 Corporate NO: R071 Report COUNCIL DATE: April 28, 2008 REGULAR COUNCIL TO: Mayor & Council DATE: April 28, 2008 FROM: General Manager, Planning and Development FILE: 6600-01 SUBJECT: 2006 Census Information
Tracking Trends in Kingston
 Tracking Trends in Photo: 22, Courtesy of City Hall Total Population: 152,358 Population Changes for CMAs, 21 to 26 25 19.2 2 15 1 11.6 9.2 8.9 8.2 6.6 59 5.9 55 5.5 54 5.4 51 5.1 51 5.1 5 5. 46 4.6 3.8
Planning Study Area 1 Burnaby Heights
 Neighbourhood Profiles 2006 Census Planning Study Area 1 Heights is bounded by Burrard Inlet to the north, Willingdon Avenue to the east, Hastings Street to the south and Boundary Road to the west. PLANNING
2016 Census Bulletin: Immigration & Ethnic Diversity
 2016 Census Bulletin: Immigration & Ethnic Diversity Kingston, Ontario Census Metropolitan Area (CMA) The 2016 Census Day was May 10, 2016. On October 25, 2017, Statistics Canada released its sixth data
2001 Census: analysis series
 Catalogue no. 96F0030XIE2001008 2001 Census: analysis series Canada s ethnocultural portrait: The changing mosaic This document provides detailed analysis of the 2001 Census of Population data released