Why disaggregate data on U.S. children by immigrant status? Some lessons from the diversitydatakids.org project
|
|
|
- Alvin Eaton
- 5 years ago
- Views:
Transcription
1 Why disaggregate data on U.S. children by immigrant status? Some lessons from the diversitydatakids.org project Dolores Acevedo-Garcia, PhD, MPA-URP Samuel F. and Rose B. Gingold Professor of Human Development and Social Policy Director Institute for Child, Youth and Family Policy (ICYFP) Heller School for Social Policy and Management, Brandeis University June 29, 2017 With funding from the W.K. Kellogg Foundation and the Robert Wood Johnson Foundation
2 Outline Introduction: diversitydatakids.org project Increasing demographic importance of children in immigrant families Children of immigrants show unique patterns of resilience and vulnerability Healthy start: birth outcomes Family environment: linguistic isolation Neighborhood environment: Child Opportunity Index Role of social policies in addressing the needs of immigrant families: family and medical leave
3
4 Increasing racial/ethnic diversity of the child population coupled by increasing importance of children of immigrants
5 Racial/ethnic composition of the population under age 18: % 4% 5% 6% 7% 5% 8% 5% 6% 7% 8% 80% 14% 14% 13% 13% 13% 60% 25% 26% 27% 30% 32% 40% 20% 52% 50% 47% 42% 39% 0% White Hispanic Black Asian Multi-race Amer. Ind. Note: Racial groups exclude Hispanic members. Hispanics may be of any race. Source: U.S. Census Bureau National Population Estimates (2015 Vintage) and Projections (Release Dec )
6 Diversity will migrate to older age groups in coming years: Year when no single racial/ethnic group is the majority population by age group < 1 < < All ages Source: diversitydatakids.org calculations of U.S. Census Bureau, 2014 National Population Estimates and 2014 National Population Projections.
7 30% 25% 20% Children of immigrants as a share of U.S. children Born in US % 15% 10% 5% 6.1 Foreign-born 3.3% 0% / /14 Sources: 1970, 1980, 1990, and 2000 Census Integrated Public Use Microdata Samples (IPUMS); Urban Institute Tabulations from 2005 CPS, March Demographic and Economic Supplement and 2009/10, 2013/14 American Community Survey IPUMS data. Note: Children of Immigrants include foreign-born children and those who have at least one foreign-born parent.
8 The second generation makes up dramatically larger shares of both Hispanic and Asian children 100% Hispanic Asian 20% 20% 80% 57% 43% 60% 39% 40% 64% 20% 30% 51% 41% 0% 13% 16% 6% / /14 1st generation 2nd generation 3rd generation Notes: Children defined as under 18. First generation defined as being foreign born. Second generation defined as having at least one resident parent foreign-born. Third generation defined as having all resident parents native-born. Generation not determined for children in households with no resident parent. Parents include step or adopted parents. Sources: Diversitydatakids.org analysis of 1980 Decennial Census, 5% PUMS: Urban Institute analysis of 2013/14 American Community Survey IPUMS data.
9 Social determinants of child health & development Policy areas: Housing assistance Parental working conditions Family Housing and neighborhood Child Healthcare School Policy areas: Early childhood education Health insurance Life course outcomes: health, education, earnings
10 Newborn health Immigrants and their children tend to have better health than the US-born
11 Low birthweight rates are lower among babies of immigrant mothers (Low birthweight rates by race/ethnicity, nativity, maternal education: 2009/10) 16% 14% Mother s Education Level Low Moderate High 12% 10% 8% 6% 4% 2% 0% Native-born Foreign-born Native-born Foreign-born Native-born Foreign-born White Black Hispanic Notes: Low birthweight defined as weighing less than 2.5kg. Excludes plural births and births to mothers under age 25. Hispanics may be of any race. The three educational attainment summary categories, low, moderate, high are defined in one of two ways depending on the birth certificate version (1989 or 2003) used to record the birth in a specific location. For states using the 1989 birth certificate, "low education" refers to having 4 years of high school or less; "moderate education" refers to having some college, but less than 4 years; and "high education" refers to having 4 years of college or more. For states using the 2003 birth certificate, "low education" refers to having a high school diploma or GED or less; "moderate education" refers to having at least some college or an Associate degree, but not a Bachelor's degree; and "high education" refers to having Bachelor's degree or higher. Source: diversitydatakids.org tabulations of National Center for Health Statistics (NCHS), 2009 and 2010 Natality (All County file) as compiled by NCHS from data provided by the 57 vital statistics jurisdictions through the Vital Statistics Cooperative Program.
12 Low birthweight rates for Hispanic national-origin subgroups, by nativity and maternal education: 2009/10 10% 9% Mother s Education Level Low Moderate High 8% 7% 6% 5% 4% 3% 2% 1% 0% Native-born Foreign-born Native-born Foreign-born Native-born Foreign-born Native-born Foreign-born Mexican Puerto Rican Cuban Central/South American Notes: Low birthweight defined as weighing less than 2.5kg. Excludes plural births and births to mothers under age 25. Hispanics may be of any race. The three educational attainment summary categories, low, moderate, high are defined in one of two ways depending on the birth certificate version (1989 or 2003) used to record the birth in a specific location. For states using the 1989 birth certificate, "low education" refers to having 4 years of high school or less; "moderate education" refers to having some college, but less than 4 years; and "high education" refers to having 4 years of college or more. For states using the 2003 birth certificate, "low education" refers to having a high school diploma or GED or less; "moderate education" refers to having at least some college or an Associate degree, but not a Bachelor's degree; and "high education" refers to having Bachelor's degree or higher. Source: diversitydatakids.org tabulations of National Center for Health Statistics (NCHS), 2009 and 2010 Natality (All County file) as compiled by NCHS from data provided by the 57 vital statistics jurisdictions through the Vital Statistics Cooperative Program.
13 Linguistic isolation Immigrants also face unique sources of vulnerability, for example, linguistic isolation.
14 Percent of children in linguistically isolated households, by state 14% 12% 10% 8% 6% 4% 2% 0% Notes: The share of children ages 5 to 17 living in a linguistically isolated household. A linguistically isolated household is a home where no person aged 14 or older speaks only English, and no person aged 14 or older who speaks a language other than English speaks English very well. All household members are considered linguistically isolated, regardless of individual language status. Some states suppressed because of small sample size. Source: U.S. Census Bureau, American Community Survey.
15 35% Percent of children in linguistically isolated households for children with Spanish home language 30% 25% 20% 15% 10% 5% 0% Notes: The share of children ages 5 to 17 living in a linguistically isolated household. A linguistically isolated household is a home where no person aged 14 or older speaks only English, and no person aged 14 or older who speaks a language other than English speaks English very well. All household members are considered linguistically isolated, regardless of individual language status. Home language represents the non-english language the child speaks most often at home. Some states suppressed because of small sample size. Source: U.S. Census Bureau, American Community Survey.
16 45% Percent of children in linguistically isolated households for children with Asian home language 40% 35% 30% 25% 20% 15% 10% 5% 0% Notes: The share of children ages 5 to 17 living in a linguistically isolated household. A linguistically isolated household is a home where no person aged 14 or older speaks only English, and no person aged 14 or older who speaks a language other than English speaks English very well. All household members are considered linguistically isolated, regardless of individual language status. Home language represents the non-english language the child speaks most often at home. Some states suppressed because of small sample size. Source: U.S. Census Bureau, American Community Survey.
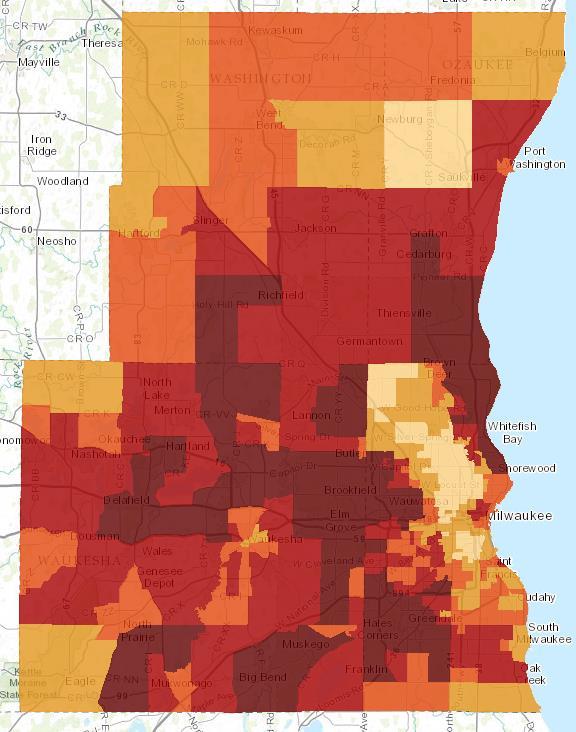
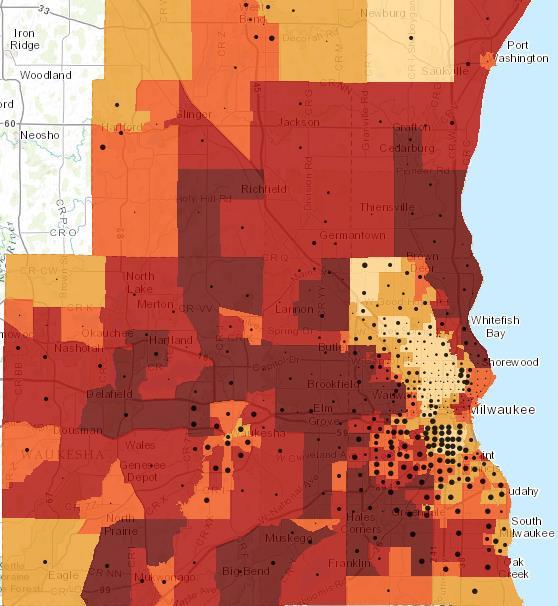
17 Neighborhood environment Great variation by race/ethnicity, national origin and geography in exposure to low-opportunity neighborhoods
18 The Child Opportunity Index An index of child neighborhood opportunity (19 indicators), defined as neighborhood conditions and resources important for healthy child development; Available for all neighborhoods in the 100 largest metropolitan areas
19
20
21
22
23 Percent of Children Percent of children in each neighborhood opportunity category by race/ethnicity (100 largest metropolitan areas) Very-Low Low Moderate High Very-High White (Non-Hispanic) Asian/Pac. Isl. (Non-Hispanic) Children have unequal access to opportunity for healthy development
24 Percent of Children Percent of Children Percent of children in each neighborhood opportunity category by race/ethnicity (100 largest metropolitan areas) Very-Low Low Moderate High Very-High White (Non-Hispanic) Asian/Pac. Isl. (Non-Hispanic) 0 Very-Low Low Moderate High Very-High Hispanic Black (Non-Hispanic) Children have unequal access to opportunity for healthy development
25 35% Percent of Mexican-origin population in each Neighborhood Opportunity category 30% 25% 20% 32% 74% 73% 27% 56% 58% 75% 72% 70% 66% 15% 19% 10% 5% 13% 9% 0% Very Low Low Moderate High Very High Neighborhood Opportunity Category Note: Neighborhood Opportunity Category based on Child Opportunity Index. Source: diversitydatakids.org-kirwan Institute Child Opportunity Index and 2010 Decennial Census, SF1 file.
26 Percent of Mexican and Cuban-origin populations in each Neighborhood Opportunity Category 35% 30% 25% 20% 32% 74% Mexican 73% 27% 19% 56% 58% Cuban 75% 72% 70% 66% 25% 23% 21% 19% 15% 10% 13% 12% 9% 5% 0% Very Low Low Moderate High Very High Very Low Low Moderate High Very High Neighborhood Opportunity Category Note: Neighborhood Opportunity Category based on Child Opportunity Index. Source: diversitydatakids.org-kirwan Institute Child Opportunity Index and 2010 Decennial Census, SF1 file.
27 Percent of Taiwanese and Hmong-origin populations in each Neighborhood Opportunity Category 60% Taiwanese Hmong 50% 40% 74% 73% 56% 58% 50% 50% 75% 72% 70% 66% 30% 20% 10% 0% 25% 18% 15% 15% 12% 8% 2% 5% Very Low Low Moderate High Very High Very Low Low Moderate High Very High Neighborhood Opportunity Category Note: Neighborhood Opportunity Category based on Child Opportunity Index. Source: diversitydatakids.org-kirwan Institute Child Opportunity Index and 2010 Decennial Census, SF1 file.
28 Family and medical leave Immigrant parents are less likely to be eligible for and to be able to afford leave than other parents
29 National Family and Medical Leave Act eligibility and affordability Estimated share of working parents who are eligible for FMLA unpaid leave vs. those who are eligible for and can potentially afford it 100% 80% 60% 40% 49% 39% 20% 0% Eligible Eligible & Can Afford
30 National racial/ethnic patterns of FMLA eligibility Estimated share of working parents who are eligible for FMLA unpaid leave 100% 80% 60% 40% 49% 43% 50% 54% 54% 20% 0% Total Hispanic White (Non- Hispanic) Asian or Pacific Islander (Non- Hispanic) Black (Non- Hispanic)
31 National racial/ethnic patterns of FMLA eligibility AND affordability Estimated share of working parents who are eligible for FMLA unpaid leave compared to those who are eligible for and can potentially afford it, by race/ethnicity 100% 80% 60% 40% 49% 39% 43% 25% 50% 54% 54% 43% 46% 35% 20% 0% Total Hispanic White (Non- Hispanic) Asian or Pacific Islander (Non- Hispanic) Black (Non- Hispanic) Eligible Eligible & Can Afford
32 National FMLA patterns for Hispanic parents: differences by nativity Estimated share of Hispanic working parents who are eligible for FMLA unpaid leave vs. those who are eligible for and can potentially afford it, by nativity 100% 80% 60% 40% 20% 43% 37% 52% 25% 18% 35% 0% Eligible Eligible & Can Afford Total Foreign-Born/U.S. Territories U.S.-Born
33 Thank You 33
Towards a Policy Actionable Analysis of Geographic and Racial Health Disparities
 Towards a Policy Actionable Analysis of Geographic and Racial Health Disparities Institute of Medicine July 30, 2007 Dolores Acevedo-Garcia, PhD, MPA-URP Associate Professor With funding from W. K. Kellogg
Job Quality among Minority and Immigrant Working Parents Alison Earle, Ph.D., Pam Joshi, Ph.D., Kim Geronimo, and Dolores Acevedo-Garcia, Ph.D.
 Job Quality among Minority and Immigrant Working Parents Alison Earle, Ph.D., Pam Joshi, Ph.D., Kim Geronimo, and Dolores Acevedo-Garcia, Ph.D. June 15, 2012 A project of: diversitydata-kids Using data
Hispanics, Immigration and the Nation s Changing Demographics
 Hispanics, Immigration and the Nation s Changing Demographics Ana Gonzalez-Barrera Senior Researcher Immigration and Demographics U.S. Immigrant Population Reached 45 million in 2015; Projected to be 78.2
SECTION 1. Demographic and Economic Profiles of California s Population
 SECTION 1 Demographic and Economic Profiles of s Population s population has special characteristics compared to the United States as a whole. Section 1 presents data on the size of the populations of
Demographic, Economic, and Social Transformations in Brooklyn Community District 4: Bushwick,
 Demographic, Economic, and Social Transformations in Brooklyn Community District 4: Bushwick, 1990-2007 Astrid S. Rodríguez Ph.D. Candidate, Educational Psychology Center for Latin American, Caribbean
Transitions to Work for Racial, Ethnic, and Immigrant Groups
 Transitions to Work for Racial, Ethnic, and Immigrant Groups Deborah Reed Christopher Jepsen Laura E. Hill Public Policy Institute of California Preliminary draft, comments welcome Draft date: March 1,
An Equity Profile of. Jackson
 An Equity Profile of Jackson An Equity Profile of Jackson PolicyLink and PERE 2 Acknowledgments PolicyLink and the Program for Environmental and Regional Equity (PERE) at the University of Southern California
LATINO DATA PROJECT. Astrid S. Rodríguez Ph.D. Candidate, Educational Psychology. Center for Latin American, Caribbean, and Latino Studies
 LATINO DATA PROJECT Demographic, Economic, and Social Transformations in the South Bronx: Changes in the NYC Community Districts Comprising Mott Haven, Port Morris, Melrose, Longwood, and Hunts Point,
Community College Research Center
 Community College Research Center Fact Sheet: Access and Achievement of Hispanics and Hispanic Immigrants in the Colleges of the City University of New York Derived from: Access and Achievement of Hispanics
Demographic, Social, and Economic Trends for Young Children in California
 Occasional Papers Demographic, Social, and Economic Trends for Young Children in California Deborah Reed Sonya M. Tafoya Prepared for presentation to the California Children and Families Commission October
Understanding the Immigrant Experience Lessons and themes for economic opportunity. Owen J. Furuseth and Laura Simmons UNC Charlotte Urban Institute
 Understanding the Immigrant Experience Lessons and themes for economic opportunity Owen J. Furuseth and Laura Simmons UNC Charlotte Urban Institute Charlotte-Mecklenburg Opportunity Task Force March 10,
Race, Ethnicity, and Economic Outcomes in New Mexico
 Race, Ethnicity, and Economic Outcomes in New Mexico Race, Ethnicity, and Economic Outcomes in New Mexico New Mexico Fiscal Policy Project A program of New Mexico Voices for Children May 2011 The New Mexico
An Equity Profile of the. City of Detroit. Supported by:
 An Equity Profile of the City of Detroit Supported by: An Equity Profile of the City of Detroit PolicyLink and PERE 2 Acknowledgments PolicyLink and the Program for Environmental and Regional Equity (PERE)
Astrid S. Rodríguez Fellow, Center for Latin American, Caribbean & Latino Studies. Center for Latin American, Caribbean & Latino Studies
 Demographic, Economic, and Social Transformations in Bronx Community District 9: Parkchester, Unionport, Soundview, Castle Hill, and Clason Point, 1990-2006 Center for Latin American, Caribbean & Latino
Labor Force Characteristics by Race and Ethnicity, 2015
 Cornell University ILR School DigitalCommons@ILR Federal Publications Key Workplace Documents 9-2016 Labor Force Characteristics by Race and Ethnicity, 2015 Bureau of Labor Statistics Follow this and additional
CLACLS. Demographic, Economic, and Social Transformations in Bronx Community District 5:
 CLACLS Center for Latin American, Caribbean & Latino Stud- Demographic, Economic, and Social Transformations in Bronx Community District 5: Fordham, University Heights, Morris Heights and Mount Hope, 1990
An Equity Profile of. Albuquerque
 An Equity Profile of Albuquerque An Equity Profile of Albuquerque PolicyLink and PERE 2 Acknowledgments PolicyLink and the Program for Environmental and Regional Equity (PERE) at the University of Southern
info Poverty in the San Diego Region SANDAG December 2013
 info December 2013 SANDAG Poverty in the San Diego Region Table of Contents Overview... 3 Background... 3 Federal Poverty Measurements... 4 Poverty Status for Individuals in the San Diego Region... 6 Demographic
Demographic, Economic and Social Transformations in Bronx Community District 4: High Bridge, Concourse and Mount Eden,
 Center for Latin American, Caribbean & Latino Studies Graduate Center City University of New York 365 Fifth Avenue Room 5419 New York, New York 10016 Demographic, Economic and Social Transformations in
Advancing Equity and Inclusive Growth in San Joaquin Valley: Data for an Equity Policy Agenda
 Advancing Equity and Inclusive Growth in San Joaquin Valley: Data for an Equity Policy Agenda Equity is the Superior Growth Model Image source: Flickr. Regional indicators database Coverage: 150 largest
Our Shared Future: U N D E R S T A N D I N G B O S T O N. #SharedFuture. Charting a Path for Immigrant Advancement in a New Political Landscape
 U N D E R S T A N D I N G B O S T O N Our Shared Future: Charting a Path for Immigrant Advancement in a New Political Landscape Wednesday, April 19 th, 2017 8:30-10:30 a.m. #SharedFuture U N D E R S T
An Equity Profile of. Grand Rapids. Supported by: Insert Map
 An Equity Profile of Grand Rapids Supported by: Insert Map An Equity Profile of Grand Rapids Table of contents PolicyLink and PERE 2 3 8 14 24 59 74 85 91 94 Summary Introduction Demographics Economic
California s Congressional District 37 Demographic Sketch
 4.02.12 California s Congressional District 37 Demographic Sketch MANUEL PASTOR JUSTIN SCOGGINS JARED SANCHEZ Purpose Demographic Sketch Understand the Congressional District s population and its unique
DATA PROFILES OF IMMIGRANTS IN THE DISTRICT OF COLUMBIA
 DATA PROFILES OF IMMIGRANTS IN THE DISTRICT OF COLUMBIA LATINO IMMIGRANTS Demographics Economic Opportunity Education Health Housing This is part of a data series on immigrants in the District of Columbia
Extrapolated Versus Actual Rates of Violent Crime, California and the United States, from a 1992 Vantage Point
 Figure 2.1 Extrapolated Versus Actual Rates of Violent Crime, California and the United States, from a 1992 Vantage Point Incidence per 100,000 Population 1,800 1,600 1,400 1,200 1,000 800 600 400 200
Share of Children of Immigrants Ages Five to Seventeen, by State, Share of Children of Immigrants Ages Five to Seventeen, by State, 2008
 Figure 1.1. Share of Children of Immigrants Ages Five to Seventeen, by State, 1990 and 2008 Share of Children of Immigrants Ages Five to Seventeen, by State, 1990 Less than 10 percent 10 to 19 percent
DEMOGRAPHIC AND SOCIOECONOMIC CHARACTERISTICS OF CUBAN-AMERICANS: A FIRST LOOK FROM THE U.S POPULATION CENSUS
 DEMOGRAPHIC AND SOCIOECONOMIC CHARACTERISTICS OF CUBAN-AMERICANS: A FIRST LOOK FROM THE U.S. 2000 POPULATION CENSUS Daniel J. Perez-Lopez 1 The 2000 U.S. Population Census, conducted between January and
Inside the 2012 Latino Electorate
 June 3, 2013 Mark Hugo Lopez, Associate Director Ana Gonzalez-Barrera, Research Associate FOR FURTHER INFORMATION CONTACT: Pew Hispanic Center 1615 L St, N.W., Suite 700 Washington, D.C. 20036 Tel(202)
December 12, City of Oxnard Consideration of By-District Elections
 December 12, 2017 City of Oxnard Consideration of By-District Elections Project Timeline 2 Date December 12 January 3 January 5 No later than January 10 January 17 January 29 February 7 February 20 February
Cook County Health Strategic Planning Landscape
 Cook County Health Strategic Planning Landscape Terry Mason, MD COO Cook County Department of Public Health December 21, 2018 1 Cook County Population Change 2000-2010* U.S. Census 2000 population 2010
The Changing Racial and Ethnic Makeup of New York City Neighborhoods
 The Changing Racial and Ethnic Makeup of New York City Neighborhoods State of the New York City s Property Tax New York City has an extraordinarily diverse population. It is one of the few cities in the
Racial Disparities in the Direct Care Workforce: Spotlight on Hispanic/Latino Workers
 FEBRUARY 2018 RESEARCH BRIEF Racial Disparities in the Direct Care Workforce: Spotlight on Hispanic/Latino Workers BY STEPHEN CAMPBELL The second in a three-part series focusing on racial and ethnic disparities
December 12, City of Oxnard Consideration of By-District Elections
 December 12, 2017 City of Oxnard Consideration of By-District Elections Project Timeline 2 Date December 12 January 3 January 5 No later than January 10 January 17 January 29 February 7 February 20 February
An Equity Profile of. New Orleans. Supported by:
 An Equity Profile of New Orleans Supported by: An Equity Profile of New Orleans PolicyLink and PERE 2 Acknowledgments PolicyLink and the Program for Environmental and Regional Equity (PERE) at the University
BY Rakesh Kochhar FOR RELEASE MARCH 07, 2019 FOR MEDIA OR OTHER INQUIRIES:
 FOR RELEASE MARCH 07, 2019 BY Rakesh Kochhar FOR MEDIA OR OTHER INQUIRIES: Rakesh Kochhar, Senior Researcher Jessica Pumphrey, Communications Associate 202.419.4372 RECOMMENDED CITATION Pew Research Center,
Chapter 1: The Demographics of McLennan County
 Chapter 1: The Demographics of McLennan County General Population Since 2000, the Texas population has grown by more than 2.7 million residents (approximately 15%), bringing the total population of the
Explaining differences in access to home computers and the Internet: A comparison of Latino groups to other ethnic and racial groups
 Electron Commerce Res (2007) 7: 265 291 DOI 10.1007/s10660-007-9006-5 Explaining differences in access to home computers and the Internet: A comparison of Latino groups to other ethnic and racial groups
The Latino Population of New York City, 2008
 The Latino Population of New York City, 2008 Center for Latin American, Caribbean & Latino Studies Graduate Center City University of New York 365 Fifth Avenue Room 5419 New York, New York 10016 Laird
Peruvians in the United States
 Peruvians in the United States 1980 2008 Center for Latin American, Caribbean & Latino Studies Graduate Center City University of New York 365 Fifth Avenue Room 5419 New York, New York 10016 212-817-8438
CLACLS. A Profile of Latino Citizenship in the United States: Demographic, Educational and Economic Trends between 1990 and 2013
 CLACLS Center for Latin American, Caribbean & Latino Studies A Profile of Latino Citizenship in the United States: Demographic, Educational and Economic Trends between 1990 and 2013 Karen Okigbo Sociology
Demographic, Economic, and Social Transformations in Queens Community District 3: East Elmhurst, Jackson Heights, and North Corona,
 Demographic, Economic, and Social Transformations in Queens Community District 3: East Elmhurst, Jackson Heights, and North Corona, 1990-2006 Astrid S. Rodríguez Fellow, Center for Latin American, Caribbean
Characteristics of People. The Latino population has more people under the age of 18 and fewer elderly people than the non-hispanic White population.
 The Population in the United States Population Characteristics March 1998 Issued December 1999 P20-525 Introduction This report describes the characteristics of people of or Latino origin in the United
City of Placentia By-District Elections Briefing. February 6, 2018
 www.drawplacentia.org City of Placentia By-District Elections Briefing Tentative Project Timeline 2 Date February 6 February 20 March 11 No later than March 13 March 20 Event 1 st hearing: gather public
Racial Inequities in Montgomery County
 W A S H I N G T O N A R E A R E S E A R C H I N I T I A T I V E Racial Inequities in Montgomery County Leah Hendey and Lily Posey December 2017 Montgomery County, Maryland, faces a challenge in overcoming
Cultural Frames: An Analytical Model
 Figure 1.1 Cultural Frames: An Analytical Model Hyper-Selectivity/ Hypo-Selectivity Ethnic Capital Tangible and Intangible Resources Host Society Public Institutional Resources The Stereotype Promise/Threat
Evaluating the Role of Immigration in U.S. Population Projections
 Evaluating the Role of Immigration in U.S. Population Projections Stephen Tordella, Decision Demographics Steven Camarota, Center for Immigration Studies Tom Godfrey, Decision Demographics Nancy Wemmerus
Racial Inequities in Fairfax County
 W A S H I N G T O N A R E A R E S E A R C H I N I T I A T I V E Racial Inequities in Fairfax County Leah Hendey and Lily Posey December 2017 Fairfax County, Virginia, is an affluent jurisdiction, with
The Latino Electorate in 2010: More Voters, More Non-Voters
 April 26, 2011 The Latino Electorate in 2010: More Voters, More Non-Voters Mark Hugo Lopez, Associate Director FOR FURTHER INFORMATION CONTACT: Pew Hispanic Center 1615 L St, N.W., Suite 700 Washington,
Births to Hispanic Women Living in Minnesota: Overview of Expanded Hispanic Subgroups, 2016
 Volume 13, Issue 02 April 2018 Births to Hispanic Women Living in Minnesota: Overview of Expanded Hispanic Subgroups, 2016 Introduction This issue of VitalSigns provides an overview of an expanded set
Gopal K. Singh 1 and Sue C. Lin Introduction
 BioMed Research International Volume 2013, Article ID 627412, 17 pages http://dx.doi.org/10.1155/2013/627412 Research Article Marked Ethnic, Nativity, and Socioeconomic Disparities in Disability and Health
The EEO Tabulation: Measuring Diversity in the Workplace ACS Data Users Conference May 29, 2014
 The EEO Tabulation: Measuring Diversity in the Workplace ACS Data Users Conference May 29, 2014 Ana J. Montalvo Industry and Occupation Statistics Branch Social, Economic, and Housing Statistics Division
Mexicans in New York City, : A Visual Data Base
 Mexicans in New York City, 1990 2009: A Visual Data Base Center for Latin American, Caribbean & Latino Studies Graduate Center City University of New York 365 Fifth Avenue Room 5419 New York, New York
Omaha-Council Bluffs Region
 EMBARGOED UNITL DECEMBER 2, 2014 Equitable Growth Profile of the Omaha-Council Bluffs Region 2 Summary Communities of color are driving the Omaha-Council Bluffs region s population growth, and their ability
About the California Policy Seminar and Funding for This Project
 About the California Policy Seminar and Funding for This Project The California Policy Seminar is a University of California program that applies the extensive research expertise of the UC system to the
Hispanic Employment in Construction
 Hispanic Employment in Construction Published by the CPWR Data Center The recent economic downturn affected the entire U.S. construction industry. To better understand how Hispanic construction workers
An Equity Profile of. Las Cruces
 An Equity Profile of Las Cruces An Equity Profile of Las Cruces PolicyLink and PERE 2 Acknowledgments PolicyLink and the Program for Environmental and Regional Equity (PERE) at the University of Southern
Promise or Peril: Immigrants, LEP Students and the No Child Left Behind Act
 Immigrants, LEP Students and the No Child Left Behind Act Randy Capps, Michael Fix, Julie Murray, Jason Ost, Shinta Herwantoro, Wendy Zimmermann, Jeffrey Passel Immigration Studies Program, The Urban Institute
Population Estimates in the United States
 Population Estimates in the United States Victoria Velkoff U.S. Census Bureau Seminar on New Directions in Social Statistics February 22, 2008 Outline What estimates we produce and why Basic methodology
Understanding Racial Inequity in Alachua County
 Understanding Racial Inequity in Alachua County (January, 2018) Hector H. Sandoval (BEBR) Department of Economics College of Liberal Arts and Sciences University of Florida Understanding Racial Inequity
Latinos in Massachusetts Selected Areas: Framingham
 University of Massachusetts Boston ScholarWorks at UMass Boston Gastón Institute Publications Gastón Institute for Latino Community Development and Public Policy Publications 9-17-2010 Latinos in Massachusetts
Needs and Challenges for. Race/Ethnicity Data
 Disaggregation of Data: Needs and Challenges for Collecting and Reporting Race/Ethnicity Data Suhaila Khan, MD PhD Marguerite Ro, DrPH August 20, 2009 Webinar Topics covered in webinar What is disaggregation
May 9, City of South San Francisco 2018 Districting Initial Hearings
 City of South San Francisco 2018 Districting Initial Hearings South SF is not alone facing CVRA 2 Switched (or in the process of switching) as a result of CVRA: At least 165 school districts 28 Community
Institute for Public Policy and Economic Analysis
 Institute for Public Policy and Economic Analysis The Institute for Public Policy and Economic Analysis at Eastern Washington University will convey university expertise and sponsor research in social,
Pulling Open the Sticky Door
 Pulling Open the Sticky Door Social Mobility among Latinos in Nebraska Lissette Aliaga-Linares Social Demographer Office of Latino/Latin American Studies (OLLAS) University of Nebraska at Omaha Overview
Part 1: Focus on Income. Inequality. EMBARGOED until 5/28/14. indicator definitions and Rankings
 Part 1: Focus on Income indicator definitions and Rankings Inequality STATE OF NEW YORK CITY S HOUSING & NEIGHBORHOODS IN 2013 7 Focus on Income Inequality New York City has seen rising levels of income
Profile of New York City s Chinese Americans: 2013 Edition
 Profile of New York City s Chinese Americans: 2013 Edition Asian American Federation Census Information Center Introduction Using data from the Census Bureau s 2006-2008 and 2009-2011 American Community
Ecuadorians in the United States
 Center for Latin American, Caribbean & Latino Studies Graduate Center City University of New York 365 Fifth Avenue Room 5419 New York, New York 10016 Ecuadorians in the United States 1980 2008 212-817-8438
Texas Community Development Block Grant Program. Survey Methodology Manual. Texas Department of Agriculture Office of Rural Affairs
 Texas Community Development Block Grant Program Survey Methodology Manual Texas Department of Agriculture Office of Rural Affairs November 2014 Introduction Each proposed activity included in an application
Trends in Poverty Rates Among Latinos in New York City and the United States,
 City University of New York (CUNY) CUNY Academic Works Center for Latin American, Caribbean, and Latino Studies Centers & Institutes 11-2013 Trends in Poverty Rates Among Latinos in New York City and the
Ohio s Immigrants. Toledo and Dayton December 10-11, George Gund Foundation Migration Policy Institute
 Ohio s Immigrants George Gund Foundation Toledo and Dayton December 10-11, 2015 Acknowledgments Ariel Ruiz at MPI analyzed the data and wrote the slides for this presentation. Colin Hammar and James Bachmeier
Brazilians. imagine all the people. Brazilians in Boston
 Brazilians imagine all the people Brazilians in Boston imagine all the people is a series of publications produced by the Boston Redevelopment Authority for the Mayor s Office of Immigrant Advancement.
City of Rancho Cucamonga Presentation of Draft Maps
 City of Rancho Cucamonga Presentation of Draft Maps Douglas Johnson, President Justin Levitt, Vice President Proposed Transition Timeline 2 Date Event March 16 March 25 April 4 Council Hearing. Council
October 17, Lompoc 2017 Districting Initial Hearings
 Lompoc 2017 Districting Initial Hearings Lompoc is not alone facing CVRA 2 Switched (or in the process of switching) as a result of CVRA: At least 157 school districts 28 Community College Districts More
Equitable Growth Profile of the. Piedmont Triad Region
 Equitable Growth Profile of the Piedmont Triad Region 2 Summary Communities of color are driving the Piedmont Triad s population growth, and their ability to participate in the economy and thrive is central
The Brookings Institution Metropolitan Policy Program Bruce Katz, Director
 The Brookings Institution Metropolitan Policy Program Bruce Katz, Director State of the World s Cities: The American Experience Delivering Sustainable Communities Summit February 1st, 2005 State of the
Children of Immigrants
 L O W - I N C O M E W O R K I N G F A M I L I E S I N I T I A T I V E Children of Immigrants 2013 State Trends Update Tyler Woods, Devlin Hanson, Shane Saxton, and Margaret Simms February 2016 This brief
Sweetwater Union High School District Demographic and Districting Introduction
 Sweetwater Union High School District Demographic and Districting Introduction Douglas Johnson, President National Demographics Corporation (NDC) 2 District General Demographics 2008 2012 American Community
2016 Appointed Boards and Commissions Diversity Survey Report
 2016 Appointed Boards and Commissions Diversity Survey Report November 28, 2016 Neighborhood and Community Relations Department 612-673-3737 www.minneapolismn.gov/ncr Table of Contents Introduction...
Great Lakes Prosperity: The Promise of Investing in People
 Great Lakes Prosperity: The Promise of Investing in People Rolf Pendall, Ph.D. Codirector, M etropolitan H ousing & Communities Center Presentation at 2017 Policy Summit on H ousing, H uman Capital, and
Brockton and Abington
 s in Massachusetts Selected Areas Brockton and Abington by Phillip Granberry, PhD and Sarah Rustan September 17, 2010 INTRODUCTION This report provides a descriptive snapshot of selected economic, social,
VOLUME 31, ARTICLE 20, PAGES PUBLISHED 3 SEPTEMBER DOI: /DemRes
 DEMOGRAPHIC RESEARCH VOLUME 31, ARTICLE 20, PAGES 593 624 PUBLISHED 3 SEPTEMBER 2014 http://www.demographic-research.org/volumes/vol31/20/ DOI: 10.4054/DemRes.2014.31.20 Research Article The residential
HEALTH CARE EXPERIENCES
 S U R V E Y B R I E F HEALTH CARE EXPERIENCES March 004 ABOUT THE 00 NATIONAL SURVEY OF LATINOS In the 000 Census, some,06,000 people living in the United States identifi ed themselves as Hispanic/Latino.
Redefining America: Findings from the 2006 Latino National Survey
 Redefining America: Findings from the 2006 Latino National Survey Luis R. Fraga Stanford University University of Washington John A. Garcia University of Arizona Rodney E. Hero University of Notre Dame
2017/2022 Esri Diversity Index
 2017/2022 Esri Diversity Index By Kyle Reese Cassal Demographer, Data Development Team An Esri White Paper June 2017 Copyright 2017 Esri All rights reserved. Printed in the United States of America. The
JULY Esri Diversity Index
 JULY 2018 Esri Diversity Index Copyright 2018 Esri All rights reserved. Printed in the United States of America. The information contained in this document is the exclusive property of Esri. This work
The Brookings Institution Metropolitan Policy Program Amy Liu, Deputy Director
 The Brookings Institution Metropolitan Policy Program Amy Liu, Deputy Director Mind the Gap: Reducing Disparities to Improve Regional Competitiveness in the Twin Cities Forum on the Business Response to
ESTIMATES OF INTERGENERATIONAL LANGUAGE SHIFT: SURVEYS, MEASURES, AND DOMAINS
 ESTIMATES OF INTERGENERATIONAL LANGUAGE SHIFT: SURVEYS, MEASURES, AND DOMAINS Jennifer M. Ortman Department of Sociology University of Illinois at Urbana-Champaign Presented at the Annual Meeting of the
Youth at High Risk of Disconnection
 Youth at High Risk of Disconnection A data update of Michael Wald and Tia Martinez s Connected by 25: Improving the Life Chances of the Country s Most Vulnerable 14-24 Year Olds Prepared by Jacob Rosch,
Race, Ethnicity, and Citizenship
 OVERLOOKED & UNDERCOUNTED 2018 BRIEF 3 Race, Ethnicity, and Citizenship The Impact on Making Ends Meet in New York City Prepared for Women s Center for Education and Career Advancement & United Way of
Rural Child Poverty across Immigrant Generations in New Destination States
 Rural Child Poverty across Immigrant Generations in New Destination States Brian Thiede, The Pennsylvania State University Leif Jensen, The Pennsylvania State University March 22, 2018 Rural Poverty Fifty
Emerging and Established Hispanic Communities: Implications of Changing Hispanic Demographics
 Emerging and Established Hispanic Communities: Implications of Changing Hispanic Demographics October 1, 2015 @NRCHispanic Co-Chairs Michael López, Ph.D. Abt Associates Michelle Blocklin, Ph.D. Abt Associates
City of Hammond Indiana DRAFT Fair Housing Assessment 07. Disparities in Access to Opportunity
 ANALYSIS EDUCATIONAL OPPORTUNITIES i. Describe any disparities in access to proficient schools based on race/ethnicity, national origin, and family status. ii. iii. Describe the relationship between the
Demographic Changes, Health Disparities, and Tuberculosis
 Demographic Changes, Health Disparities, and Tuberculosis Joan M. Mangan, PhD, MST October 22, 2015 Delivering Culturally Competent Patient Education and Care to Tuberculosis Program Clients Austin, TX
California Counts. New Trends in Newborns Fertility Rates and Patterns in California. Summary. Public Policy Institute of California
 POPULATION TRENDS AND PROFILES Hans P. Johnson, editor Volume 3 Number 1 August 2001 Fertility s and Patterns in California By Hans P. Johnson, Laura Hill, and Mary Heim Over 80 percent of California s
Socio-Economic Mobility Among Foreign-Born Latin American and Caribbean Nationalities in New York City,
 Socio-Economic Mobility Among Foreign-Born Latin American and Caribbean Nationalities in New York City, 2000-2006 Center for Latin American, Caribbean & Latino Studies Graduate Center City University of
An Equity Profile of the Southeast Florida Region. Summary. Foreword
 An Equity Profile of the Southeast Florida Region PolicyLink and PERE An Equity Profile of the Southeast Florida Region Summary Communities of color are driving Southeast Florida s population growth, and
Regional Data Snapshot
 Regional Data Snapshot Population, Economy & Education Features SET Civic Forum Glacial Lakes Region, South Dakota Table of Contents 01 Overview 03 Human Capital 02 Demography 04 Labor Force 01 overview
The Brookings Institution Metropolitan Policy Program Robert Puentes, Fellow
 The Brookings Institution Metropolitan Policy Program Robert Puentes, Fellow A Review of New Urban Demographics and Impacts on Housing National Multi Housing Council Research Forum March 26, 2007 St. Louis,
An Equity Profile of the. Southeast Florida Region
 An Equity Profile of the Southeast Florida Region An Equity Profile of the Southeast Florida Region Table of contents PolicyLink and PERE 2 6 7 8 14 27 55 64 79 83 Foreword Summary Introduction Demographics
1615 L Street, NW, Suite 700 Washington, DC (main) (fax)
 (fax)") 1615 L Street, NW, Suite 700 Washington, DC 20036-5631 202-419-3600(main) 202-419-3608(fax) www.pewresearch.org A Fact Tank The Pew Research Center is a nonpartisan organization that provides information
1615 L Street, NW, Suite 700 Washington, DC 20036-5631 202-419-3600(main) 202-419-3608(fax) www.pewresearch.org A Fact Tank The Pew Research Center is a nonpartisan organization that provides information