Brazilians. imagine all the people. Brazilians in Boston
|
|
|
- Bethanie Hancock
- 5 years ago
- Views:
Transcription


1 Brazilians imagine all the people Brazilians in Boston imagine all the people is a series of publications produced by the Boston Redevelopment Authority for the Mayor s Office of Immigrant Advancement. The series provides a comprehensive profile of Boston s diverse immigrant communities and their numerous contributions to the city s social, cultural and economic landscape. It is part of an ongoing effort to celebrate immigrants and gain insight into how they shape our city. Brazilian Festival Boston photos courtesy of Brazilian Women s Group CITY OF BOSTON Martin J. Walsh Mayor 2016

2 Large-scale migration from Brazil is a relatively recent phenomenon. Brazil has historically been a host country for immigrants from many nations. From the early 19th century to the mid 20th century, Germans, Swiss, Italians, Spaniards, Poles, Czechs, Russians, Japanese and others joined the Portuguese in searching for new opportunities in Brazil. 1 After the military coup of 1964, thousands of Brazilians went into exile. Although most of these exiles returned to Brazil after the amnesty of 1979, the number of economic emigrants grew in the 1980s. According to Brazilian demographer, José Alberto Magno de Carvalho, there were up to 2.5 million Brazilians living outside Brazil by During the early years, immigrants from Minas Gerais dominated the immigration flow to the United States. Now, Goiás, Paraná and Santa Catarina have also become major immigrant exporting regions. The United States, Japan, Portugal, Spain, and China are the main destinations for Brazilian immigrants. 3 According to the 2014 American Community Survey (ACS), there are close to 331,000 foreign-born Brazilians living in the United States, representing 0.8 percent of the country's foreign-born population of 42.2 million. 4 Massachusetts has the second largest share of foreign-born Brazilians living in the United States (17 percent) behind Florida (20 percent). 5 Other states with large concentrations of Brazilians include California (10 percent), New Jersey (9 percent), and New York (7 percent). Combined, these five states constitute 63 percent of the Brazilian foreign-born population in the United States. Share of Foreign-Born Brazilian Population by State U.S. Census Bureau, 2014 American Community Survey, PUMS, BRA Research Division Analysis 2

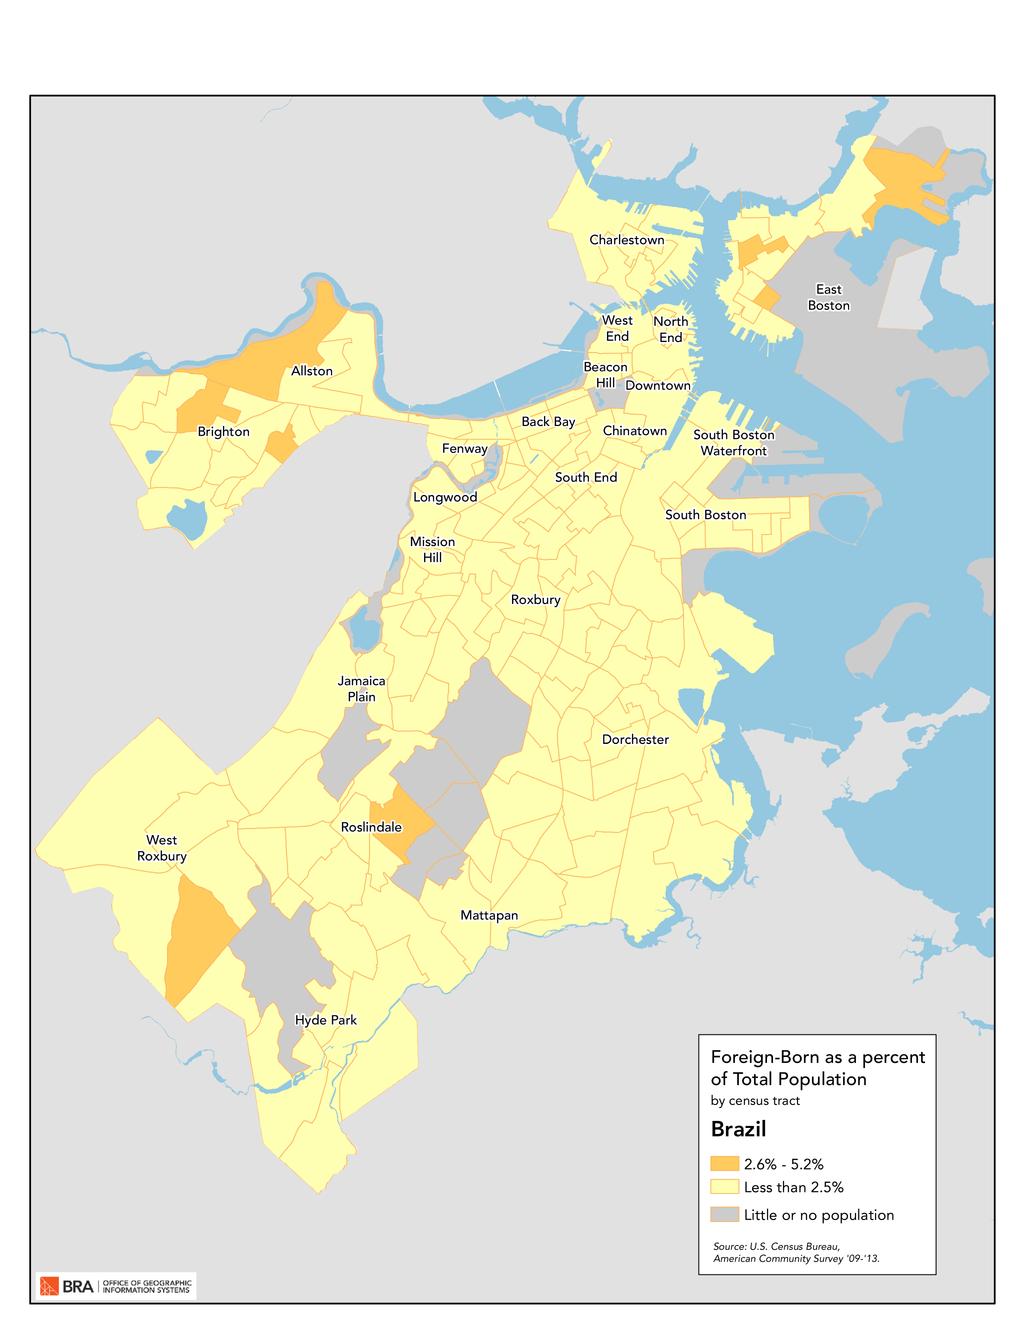
3 Brazilian Population in Boston The Brazilian population in Metropolitan Boston increased rapidly during the 1990s and peaked before the recession of Foreign-born Brazilians are now less likely to reside in the city of Boston. In 1990, 22 percent of foreign-born Brazilians in Massachusetts lived in Boston. However, by 2000 the percentage dropped to 12, and by 2014, only 5 percent lived in Boston. Of the close to 57,000 7 foreign-born Brazilian residing in Massachusetts, approximately 2,900 8 reside in Boston. Brazil is the 14 th largest country of origin for Boston s foreign-born population in Overall, foreign-born Brazilians in Boston constitute 2 percent of the city s total foreign-born residents. Boston s foreign-born Brazilians, though scattered throughout the city, live mostly in the neighborhoods of East Boston (29 percent), Brighton (20 percent), West Roxbury (8 percent), and Dorchester (7 percent). 9 The U.S. Census Bureau s ACS Public Use Microdata Sample (PUMS) allows for the detailed socio-economic analysis of specific populations. However, for smaller populations like foreign-born Brazilians in Boston, a 5-year sample is required to limit variation due to sampling error. The analysis that follows uses ACS PUMS data. Unlike other foreign born populations in Boston, Brazilians have more males, and 53 percent of foreign-born Brazilians are male compared to 48 percent of all foreign born. More than 47 percent of foreign-born Brazilians are married and 14 percent are widowed, separated, or divorced. Approximately 52 percent of all foreign-born Brazilians are between the ages of 35 and 64, and the median age of the population is 38 years. A greater share of foreign-born Brazilians have arrived in the United States after 2000 (58 percent) compared to all foreign born (43 percent). As a result of this more recent migration, the majority of foreign-born Brazilians (84 percent) are not naturalized U.S. citizens. Boston is home to 5% of the state s Brazilians down from 22% in


4 Similar to other foreign-born populations in Boston, 21 percent of foreign-born Brazilians age 25 or older lack a high school education and 34 percent have completed high school as their highest level of educational attainment. Approximately 45 percent of foreign-born Brazilians have attended college, with nearly 30 percent having completed at least a bachelor s degree, compared with 29 percent of the entire foreign-born population and 52 percent of the native born. Only 9 percent of Brazilians living in Boston hold a graduate or professional degree, compared with 14 percent of all foreign-born residents and 22 percent of the native born. Educational Attainment for the Population 25 Years and Older Brazilians in Boston have a high labor force participation rate 86%. U.S. Census Bureau, American Community Survey, PUMS, BRA Research Division Analysis The labor force participation rate 10 of Brazilians is 86 percent compared with 68 percent for all foreign born and 69 percent for the native-born population. Most foreign-born Brazilians living in Boston are employed in service related occupations. They are over-represented in these occupation when compared to all foreign born (53 percent). Of the 63 percent who work in this broad services category, 42 percent work in food preparation and serving occupations and 34 percent work in building and grounds cleaning and maintenance occupations. Brazilians are under-represented in white collar occupations compared to both the native born and all foreign born. A greater share of foreign-born Brazilians work in blue-collar occupations compared to the native born, but a smaller share compared to all foreign born. 4
 work for a private for profit company, and 12")
; a rate approximately three times that of the foreignand native-born populations.")
5 Occupations by Nativity U.S. Census Bureau, American Community Survey, PUMS, BRA Research Division Analysis The majority of foreign-born Brazilians in Boston (67 percent) work for a private for profit company, and 12 percent are equally divided between private not for profit organization and the public sector. More than 20 percent of foreign-born Brazilians are self-employed (excluding unpaid family workers); a rate approximately three times that of the foreignand native-born populations. Such a high self-employment rate may be explained by high rates of financial capital among Brazilians as well as the fact that they emigrated from a country that also has a high selfemployment rate. 11 Employment by Type of Employer U.S. Census Bureau, American Community Survey, PUMS, BRA Research Division Analysis 5


6 Imagine all the people: Brazilians Age Gender Marital Status Source: U.S. Census Bureau, American Community Survey, PUMS, BRA Research Division Analysis 6


7 Housing Tenure* Housing Costs* Medical Uninsurance *Housing data are based on the householder s nativity. 7
8 8

9 Standard of Living Approximately 38 percent of foreign-born Brazilians have achieved a middle class standard of living, compared with 45 percent of Boston s native-born population, and 29 percent of all foreign-born. A family income four times the poverty line is used as a proxy for a middle-class standard of living. The actual income needed to achieve this standard depends on the size and composition of the family. For a two-person family in 2014, a middle class income would be at least $62,920. Low educational attainment and lack of English proficiency do not appear to be hindering foreign-born Brazilians standard of living. 12 About 40 percent of foreign-born Brazilians lack either a high school diploma or English proficiency. Only 16 percent of Boston s adult foreign-born Brazilian population lack a high school diploma and have limited English proficiency compared to 18 percent for all foreign born. 38% of foreignborn Brazilians have achieved a middle class standard of living. Educational Attainment and English Proficiency Population 25 Years or Older U.S. Census Bureau, American Community Survey, PUMS, BRA Research Division Analysis 9
 that calculated the value of goods and services consumed on each dollar spent.")
10 Economic Impact Foreign-born Brazilians contribute to the local economy through their labor and consumer spending. The total value of their economic contributions were estimated using a Regional Economic Model (REMI) that calculated the value of goods and services consumed on each dollar spent. Foreign-born Brazilians in Boston generated total expenditures of $54.6 million in These annual expenditures contributed $32.7 million to the regional product and generated $1.8 million in state and local taxes. 14 In total, these expenditures supported 237 jobs in the Massachusetts economy. 15 Campaigning for rights of domestic workers Brazilian Women s Group Conclusion The Brazilian foreign-born population has been declining in Boston since the recession of Even though foreign-born Brazilians have similar levels of English proficiency to all foreign born, they have higher rates of high school graduation and a higher standard of living compared to other foreign-born populations in Boston. They appear to be earning this standard of living through high rates of self employment. 10
11 1 Amaral, E.F. and Fusco, W., Shaping Brazil: The Role of International Migration, Migration Policy Institute, The Brazilian Geography and Statistics Institute registered the statistical "absence" of 1,379,928 Brazilians between the ages of 20 and 44 from the 1991 Brazilian Census, a fact that can only be explained by emigration. Brazilian Geography and Statistics Institute (IBGE) (2000). 3 UNICEF Migration Profiles, The "foreign-born" population includes all people who are born outside the U.S., naturalized citizens, and non-u.s. citizens. The "native-born" population includes all people born in the United States, Puerto Rico, or the U.S. Island Areas and persons born abroad by American parents. Boston Redevelopment Authority (BRA) Research Division. (2016). 5 UNICEF Migration Profiles, Marcelli, E., et al. (In)Visible (Im)Migrants The Health and Socioeconomic Integration of Brazilians in Metropolitan Boston, Center for Behavioral and Community Health Studies, American Factfinder website Table B05006 reports 55,628 Brazilians in Massachusetts with a margin of error of +/- 6,125 in The 52,727 estimate reported here was tabulated from 2014 U.S. Census Public Use Microdata Sample data. Both estimates contain a margin of error due to sampling methodology. For more information on American Fact Finder please see: 8 American Factfinder website Table B05006 reports 3,368 Brazilians in Boston with a margin of error of +/- 1,233 in Lower survey response rates due to language or documentation issues may result in an undercount of the population. The 2,890 estimate reported here was tabulated from 2014 U.S. Census Public Use Microdata Sample data for Boston American Community Survey, American Factfinder, BRA Research Analysis. 10 Defined as the share of the working-age population that is either currently employed or seeking work. U.S. Department of Labor, Bureau of Labor Statistics. (2016). 11 There is no agreement among researchers regarding the reasons for variations in the selfemployment rates among different immigrant groups. Reasons cited include human and financial capital of individual foreign born, high rates of solidarity and social capital in some immigrant communities, as well as the opportunity structure encountered by immigrant entrepreneurs. 12 The Limited English Proficient includes immigrant adults who do not speak English at all or who do not speak it well. 13 BRA Research Division Analysis, 2014, Regional Economic Model, Inc., REMI calculations. Note: these calculations reflect revisions made to this analysis in March BRA Research Division Analysis, 2014, Regional Economic Model, Inc., REMI calculations. 15 BRA Research Division Analysis, 2014, Regional Economic Model, Inc., REMI calculations. 11


12 Brian P. Golden, Director Produced by the BRA Research Division Alvaro Lima Director of Research Jonathan Lee Deputy Director Christina Kim Research Manager Phillip Granberry Senior Researcher/Demographer Matthew Resseger Senior Researcher/Economist Kevin Kang Research Associate Kevin Wandrei Research Assistant Interns: Jingwan Wang Michael Bratsis Cyan O Garro Map by BRA Digital Cartography & GIS Alla Ziskin 12
13 13
Cape Verdeans. all the people. Cape Verdeans in Boston
 imagine Cape Verdeans all the people Cape Verdeans in Boston imagine all the people is a series of publications produced by the Boston Redevelopment Authority for the Mayor s Office of Immigrant Advancement.
Salvadorans. imagine all the people. Salvadorans in Boston
 Salvadorans imagine all the people Salvadorans in Boston imagine all the people is a series of publications produced by the Boston Redevelopment Authority for the Mayor s Office of Immigrant Advancement.
Chinese. imagine all the people. Chinese in Boston Photos by Renato Castello & Jeremiah Robinson
 Chinese imagine all the people Chinese in Boston imagine all the people is a series of publications produced by the Boston Redevelopment Authority for the Mayor s Office of Immigrant Advancement. The series
Irish. imagine all the people. Irish in Boston
 Irish in Boston imagine all the people is a series of publica ons produced by the Boston Redevelopment Authority for the Mayor s Office of Immigrant Advancement. The series provides a comprehensive profile
Brazilians. in Boston
 Brazilians in Boston The Dewey Square mural (2012), by the Brazilian artist duo Os Gémeos (twins Otávio and Gustavo Pandolfo), spray painted on a 25-metre wide wall on the occasion of their exhibition
Salvadorans. in Boston
 Salvadorans in Boston Banda El Salvador at the 2013 Rose Parade in Pasadena, California. Photo by Prayitno Photography, retrieved from flickr.com/ photos/prayitnophotography (Creative Commons Attribution
Haitians. imagine all the people. Haitians in Boston
 Haitians in Boston imagine all the people is a series of publica ons produced by the Boston Redevelopment Authority for the Mayor s Office of Immigrant Advancement. The series provides a comprehensive profile
Our Shared Future: U N D E R S T A N D I N G B O S T O N. #SharedFuture. Charting a Path for Immigrant Advancement in a New Political Landscape
 U N D E R S T A N D I N G B O S T O N Our Shared Future: Charting a Path for Immigrant Advancement in a New Political Landscape Wednesday, April 19 th, 2017 8:30-10:30 a.m. #SharedFuture U N D E R S T
Latinos in Massachusetts Selected Areas: Framingham
 University of Massachusetts Boston ScholarWorks at UMass Boston Gastón Institute Publications Gastón Institute for Latino Community Development and Public Policy Publications 9-17-2010 Latinos in Massachusetts
Brockton and Abington
 s in Massachusetts Selected Areas Brockton and Abington by Phillip Granberry, PhD and Sarah Rustan September 17, 2010 INTRODUCTION This report provides a descriptive snapshot of selected economic, social,
Racial Inequities in Montgomery County
 W A S H I N G T O N A R E A R E S E A R C H I N I T I A T I V E Racial Inequities in Montgomery County Leah Hendey and Lily Posey December 2017 Montgomery County, Maryland, faces a challenge in overcoming
 Page 1 of 5 DP02 SELECTED SOCIAL CHARACTERISTICS IN THE UNITED STATES 2013 American Community Survey 1-Year Estimates Although the American Community Survey (ACS) produces population, demographic and housing
Racial Inequities in Fairfax County
 W A S H I N G T O N A R E A R E S E A R C H I N I T I A T I V E Racial Inequities in Fairfax County Leah Hendey and Lily Posey December 2017 Fairfax County, Virginia, is an affluent jurisdiction, with
Overview of Boston s Population. Boston Redevelopment Authority Research Division Alvaro Lima, Director of Research September
 Overview of Boston s Population Boston Redevelopment Authority Research Division Alvaro Lima, Director of Research September - 2011 Historic Trends Boston s Population Boston reached its population peak
Tell us what you think. Provide feedback to help make American Community Survey data more useful for you.
 DP02 SELECTED SOCIAL CHARACTERISTICS IN THE UNITED STATES 2016 American Community Survey 1-Year Estimates Supporting documentation on code lists, subject definitions, data accuracy, and statistical testing
Cultural Frames: An Analytical Model
 Figure 1.1 Cultural Frames: An Analytical Model Hyper-Selectivity/ Hypo-Selectivity Ethnic Capital Tangible and Intangible Resources Host Society Public Institutional Resources The Stereotype Promise/Threat
The foreign born are more geographically concentrated than the native population.
 The Foreign-Born Population in the United States Population Characteristics March 1999 Issued August 2000 P20-519 This report describes the foreign-born population in the United States in 1999. It provides
DATA PROFILES OF IMMIGRANTS IN THE DISTRICT OF COLUMBIA
 DATA PROFILES OF IMMIGRANTS IN THE DISTRICT OF COLUMBIA LATINO IMMIGRANTS Demographics Economic Opportunity Education Health Housing This is part of a data series on immigrants in the District of Columbia
SECTION 1. Demographic and Economic Profiles of California s Population
 SECTION 1 Demographic and Economic Profiles of s Population s population has special characteristics compared to the United States as a whole. Section 1 presents data on the size of the populations of
Far From the Commonwealth: A Report on Low- Income Asian Americans in Massachusetts
 University of Massachusetts Boston ScholarWorks at UMass Boston Institute for Asian American Studies Publications Institute for Asian American Studies 1-1-2007 Far From the Commonwealth: A Report on Low-
Migration Information Source - Chinese Immigrants in the United States
 Pagina 1 di 8 Chinese Immigrants in the United States By Aaron Terrazas, Jeanne Batalova Migration Policy Institute May 6, 2010 The United States is home to about 1.6 million Chinese immigrants (including
Institute for Public Policy and Economic Analysis
 Institute for Public Policy and Economic Analysis The Institute for Public Policy and Economic Analysis at Eastern Washington University will convey university expertise and sponsor research in social,
Nebraska s Foreign-Born and Hispanic/Latino Population
 January 2011 Nebraska s Foreign-Born and Hispanic/Latino Population Socio-Economic Trends, 2009 OLLAS Office of Latino/Latin American Studies (OLLAS) University of Nebraska - Omaha Off i c e o f La t i
A Profile of Latina Women in New York City, 2007
 City University of New York (CUNY) CUNY Academic Works Publications and Research Center for Latin American, Caribbean & Latino Studies 11-2009 A Profile of Latina Women in New York City, 2007 Laura Limonic
CLACLS. Demographic, Economic, and Social Transformations in Bronx Community District 5:
 CLACLS Center for Latin American, Caribbean & Latino Stud- Demographic, Economic, and Social Transformations in Bronx Community District 5: Fordham, University Heights, Morris Heights and Mount Hope, 1990
Brazilians in the United States: A Look at Migrants and Transnationalism
 Brazilians in the United States: A Look at Migrants and Transnationalism Alvaro Lima, Eugenia Garcia Zanello, and Manuel Orozco 1 Introduction As globalization has intensified the integration of developing
Racial Inequities in the Washington, DC, Region
 W A S H I N G T O N A R E A R E S E A R C H I N I T I A T V E Racial Inequities in the Washington, DC, Region 2011 15 Leah Hendey December 2017 The Washington, DC, region is increasingly diverse and prosperous,
Peruvians in the United States
 Peruvians in the United States 1980 2008 Center for Latin American, Caribbean & Latino Studies Graduate Center City University of New York 365 Fifth Avenue Room 5419 New York, New York 10016 212-817-8438
Foreign Migration to the Cleveland-Akron-Lorain Metropolitan Area From 1995 to 2000
 EngagedScholarship@CSU Urban Publications Maxine Goodman Levin College of Urban Affairs 12-22-2005 Foreign Migration to the Cleveland-Akron-Lorain Metropolitan Area From 1995 to 2000 Mark Salling, m.salling@csuohio.edu
Pulling Open the Sticky Door
 Pulling Open the Sticky Door Social Mobility among Latinos in Nebraska Lissette Aliaga-Linares Social Demographer Office of Latino/Latin American Studies (OLLAS) University of Nebraska at Omaha Overview
Why disaggregate data on U.S. children by immigrant status? Some lessons from the diversitydatakids.org project
 Why disaggregate data on U.S. children by immigrant status? Some lessons from the diversitydatakids.org project Dolores Acevedo-Garcia, PhD, MPA-URP Samuel F. and Rose B. Gingold Professor of Human Development
Profile of New York City s Chinese Americans: 2013 Edition
 Profile of New York City s Chinese Americans: 2013 Edition Asian American Federation Census Information Center Introduction Using data from the Census Bureau s 2006-2008 and 2009-2011 American Community
Characteristics of People. The Latino population has more people under the age of 18 and fewer elderly people than the non-hispanic White population.
 The Population in the United States Population Characteristics March 1998 Issued December 1999 P20-525 Introduction This report describes the characteristics of people of or Latino origin in the United
Old Places, New Places: Geographic Mobility of Dominicans in the U.S.
 City University of New York (CUNY) CUNY Academic Works Publications and Research CUNY Dominican Studies Institute 2015 Old Places, New Places: Geographic Mobility of Dominicans in the U.S. Ramona Hernández
LATINO DATA PROJECT. Astrid S. Rodríguez Ph.D. Candidate, Educational Psychology. Center for Latin American, Caribbean, and Latino Studies
 LATINO DATA PROJECT Demographic, Economic, and Social Transformations in the South Bronx: Changes in the NYC Community Districts Comprising Mott Haven, Port Morris, Melrose, Longwood, and Hunts Point,
The Latino Population of New York City, 2008
 The Latino Population of New York City, 2008 Center for Latin American, Caribbean & Latino Studies Graduate Center City University of New York 365 Fifth Avenue Room 5419 New York, New York 10016 Laird
DEMOGRAPHIC AND SOCIOECONOMIC CHARACTERISTICS OF CUBAN-AMERICANS: A FIRST LOOK FROM THE U.S POPULATION CENSUS
 DEMOGRAPHIC AND SOCIOECONOMIC CHARACTERISTICS OF CUBAN-AMERICANS: A FIRST LOOK FROM THE U.S. 2000 POPULATION CENSUS Daniel J. Perez-Lopez 1 The 2000 U.S. Population Census, conducted between January and
Nebraska s Foreign Born and Hispanic/Latino Population
 Nebraska s Foreign Born and Hispanic/ Demographic Trends, 1990 2008 January 15, 2010 Office of /Latin American Studies (OLLAS) University of Nebraska Omaha University of Nebraska Omaha Office of /Latin
Immigrants and the Direct Care Workforce
 JUNE 2017 RESEARCH BRIEF Immigrants and the Direct Care Workforce BY ROBERT ESPINOZA Immigrants are a significant part of the U.S. economy and the direct care workforce, providing hands-on care to older
Demographic, Economic, and Social Transformations in Brooklyn Community District 4: Bushwick,
 Demographic, Economic, and Social Transformations in Brooklyn Community District 4: Bushwick, 1990-2007 Astrid S. Rodríguez Ph.D. Candidate, Educational Psychology Center for Latin American, Caribbean
Geographic Mobility of New Jersey Residents. Migration affects the number and characteristics of our resident population
 Geographic Mobility of New Jersey Residents Migration affects the number and characteristics of our resident population Geographic Mobility of New Jersey Residents More than 4.1 million (or 47.4%) New
Demographic Data. Comprehensive Plan
 Comprehensive Plan 2010-2030 4 Demographic Data Population and demographics have changed over the past several decades in the City of Elwood. It is important to incorporate these shifts into the planning
Dominicans in New York City
 Center for Latin American, Caribbean & Latino Studies Graduate Center City University of New York 365 Fifth Avenue Room 5419 New York, New York 10016 212-817-8438 clacls@gc.cuny.edu http://web.gc.cuny.edu/lastudies
Remittances and the Dominican Republic Survey of Recipients in the Dominican Republic Survey of Senders in the United States
 Remittances and the Dominican Republic Survey of Recipients in the Dominican Republic Survey of Senders in the United States Columbia University New York City November 23, 2004 I. The U.S. Sample National
Briefing Book- Labor Market Trends in Metro Boston
 Briefing Book- Labor Market Two other briefing books focus on the importance of formal education and ESOL courses to Boston s foreign-born residents. While there are a number of reasons why improving immigrant
Demographic, Economic and Social Transformations in Bronx Community District 4: High Bridge, Concourse and Mount Eden,
 Center for Latin American, Caribbean & Latino Studies Graduate Center City University of New York 365 Fifth Avenue Room 5419 New York, New York 10016 Demographic, Economic and Social Transformations in
A Demographic Profile of Mexican Immigrants in the United States
 A Demographic Profile of Mexican Immigrants in the United States Ariel G Ruiz Soto Associate Policy Analyst, U.S. Programs Migration Policy Institute Mexico Institute, Wilson Center November 5, 2018 Number
Labor Force Characteristics by Race and Ethnicity, 2015
 Cornell University ILR School DigitalCommons@ILR Federal Publications Key Workplace Documents 9-2016 Labor Force Characteristics by Race and Ethnicity, 2015 Bureau of Labor Statistics Follow this and additional
Geographic Mobility Central Pennsylvania
 Geographic Mobility Central Pennsylvania Centre, Clinton, Columbia, Lycoming, Mifflin, Montour, Northumberland, Snyder, and Union Counties Central Pennsylvania Workforce Development Corporation (CPWDC)
The Foreign-Born Population of Southeastern Pennsylvania. By Randy Capps
 The Foreign-Born Population of Southeastern Pennsylvania By Randy Capps Philadelphia June 15 th, 2016 Acknowledgments Ariel Ruiz at MPI analyzed the data and wrote the slides for this presentation. James
A PATHWAY TO THE MIDDLE CLASS: MIGRATION AND DEMOGRAPHIC CHANGE IN PRINCE GEORGE S COUNTY
 A PATHWAY TO THE MIDDLE CLASS: MIGRATION AND DEMOGRAPHIC CHANGE IN PRINCE GEORGE S COUNTY Brooke DeRenzis and Alice M. Rivlin The Brookings Greater Washington Research Program April 2007 ACKNOWLEDGEMENTS
Profile of New York City s Bangladeshi Americans
 Profile of New York City s Bangladeshi Americans Introduction Using data from 2006-2010 and 2011-2015 American Community Survey (ACS) Selected Population Tables and the 2010 U.S. census, this profile outlines
Demographic Change How the US is Coping with Aging, Immigration, and Other Challenges William H. Frey
 Demographic Change How the US is Coping with Aging, Immigration, and Other Challenges William H. Frey Brookings Institution University of Michigan www.frey-demographer.org US: Total and Age 65+ Growth,
Ecuadorians in the United States
 Center for Latin American, Caribbean & Latino Studies Graduate Center City University of New York 365 Fifth Avenue Room 5419 New York, New York 10016 Ecuadorians in the United States 1980 2008 212-817-8438
CLACLS. A Profile of Latino Citizenship in the United States: Demographic, Educational and Economic Trends between 1990 and 2013
 CLACLS Center for Latin American, Caribbean & Latino Studies A Profile of Latino Citizenship in the United States: Demographic, Educational and Economic Trends between 1990 and 2013 Karen Okigbo Sociology
Introduction. Background
 Millennial Migration: How has the Great Recession affected the migration of a generation as it came of age? Megan J. Benetsky and Alison Fields Journey to Work and Migration Statistics Branch Social, Economic,
Backgrounder. This report finds that immigrants have been hit somewhat harder by the current recession than have nativeborn
 Backgrounder Center for Immigration Studies May 2009 Trends in Immigrant and Native Employment By Steven A. Camarota and Karen Jensenius This report finds that immigrants have been hit somewhat harder
Extrapolated Versus Actual Rates of Violent Crime, California and the United States, from a 1992 Vantage Point
 Figure 2.1 Extrapolated Versus Actual Rates of Violent Crime, California and the United States, from a 1992 Vantage Point Incidence per 100,000 Population 1,800 1,600 1,400 1,200 1,000 800 600 400 200
Characteristics of Poverty in Minnesota
 Characteristics of Poverty in Minnesota by Dennis A. Ahlburg P overty and rising inequality have often been seen as the necessary price of increased economic efficiency. In this view, a certain amount
info Poverty in the San Diego Region SANDAG December 2013
 info December 2013 SANDAG Poverty in the San Diego Region Table of Contents Overview... 3 Background... 3 Federal Poverty Measurements... 4 Poverty Status for Individuals in the San Diego Region... 6 Demographic
Census 2016 Summary Results Part 1
 Census 2016 Summary Results Part 1 Press conference, Government Buildings 6 th April 2017 Reminder Census Day : Sunday April 24 th 2016 Just over 2 million dwellings visited by 5,000 staff Preliminary
Demographic, Economic, and Social Transformations in Queens Community District 3: East Elmhurst, Jackson Heights, and North Corona,
 Demographic, Economic, and Social Transformations in Queens Community District 3: East Elmhurst, Jackson Heights, and North Corona, 1990-2006 Astrid S. Rodríguez Fellow, Center for Latin American, Caribbean
The EEO Tabulation: Measuring Diversity in the Workplace ACS Data Users Conference May 29, 2014
 The EEO Tabulation: Measuring Diversity in the Workplace ACS Data Users Conference May 29, 2014 Ana J. Montalvo Industry and Occupation Statistics Branch Social, Economic, and Housing Statistics Division
The Latino Population of the New York Metropolitan Area,
 The Latino Population of the New York Metropolitan Area, 2000 2008 Center for Latin American, Caribbean & Latino Studies Graduate Center City University of New York 365 Fifth Avenue Room 5419 New York,
Corporate. Report COUNCIL DATE: April 28, 2008 NO: R071 REGULAR COUNCIL. TO: Mayor & Council DATE: April 28, 2008
 Corporate NO: R071 Report COUNCIL DATE: April 28, 2008 REGULAR COUNCIL TO: Mayor & Council DATE: April 28, 2008 FROM: General Manager, Planning and Development FILE: 6600-01 SUBJECT: 2006 Census Information
Astrid S. Rodríguez Fellow, Center for Latin American, Caribbean & Latino Studies. Center for Latin American, Caribbean & Latino Studies
 Demographic, Economic, and Social Transformations in Bronx Community District 9: Parkchester, Unionport, Soundview, Castle Hill, and Clason Point, 1990-2006 Center for Latin American, Caribbean & Latino
Environmental Justice Demographic Profile
 CENTRAL PUGET SOUND REGION Environmental Justice Demographic Profile January 2016 Contents INTRODUCTION... 3 OBJECTIVES... 4 DEFINITIONS... 4 Minority Populations... 4 Low-Income Population... 4 Other
BY Rakesh Kochhar FOR RELEASE MARCH 07, 2019 FOR MEDIA OR OTHER INQUIRIES:
 FOR RELEASE MARCH 07, 2019 BY Rakesh Kochhar FOR MEDIA OR OTHER INQUIRIES: Rakesh Kochhar, Senior Researcher Jessica Pumphrey, Communications Associate 202.419.4372 RECOMMENDED CITATION Pew Research Center,
Integrating Latino Immigrants in New Rural Destinations. Movement to Rural Areas
 ISSUE BRIEF T I M E L Y I N F O R M A T I O N F R O M M A T H E M A T I C A Mathematica strives to improve public well-being by bringing the highest standards of quality, objectivity, and excellence to
Mexicans in New York City, : A Visual Data Base
 Mexicans in New York City, 1990 2009: A Visual Data Base Center for Latin American, Caribbean & Latino Studies Graduate Center City University of New York 365 Fifth Avenue Room 5419 New York, New York
Chapter 1: The Demographics of McLennan County
 Chapter 1: The Demographics of McLennan County General Population Since 2000, the Texas population has grown by more than 2.7 million residents (approximately 15%), bringing the total population of the
THE EMPLOYABILITY AND WELFARE OF FEMALE LABOR MIGRANTS IN INDONESIAN CITIES
 SHASTA PRATOMO D., Regional Science Inquiry, Vol. IX, (2), 2017, pp. 109-117 109 THE EMPLOYABILITY AND WELFARE OF FEMALE LABOR MIGRANTS IN INDONESIAN CITIES Devanto SHASTA PRATOMO Senior Lecturer, Brawijaya
BIG PICTURE: CHANGING POVERTY AND EMPLOYMENT OUTCOMES IN SEATTLE
 BIG PICTURE: CHANGING POVERTY AND EMPLOYMENT OUTCOMES IN SEATTLE January 218 Author: Bryce Jones Seattle Jobs Initiative TABLE OF CONTENTS Introduction 1 Executive Summary 2 Changes in Poverty and Deep
Report Finds that Worcester s Foreign-Born Are Major Economic Contributors
 September 28, 2015 FOR IMMEDIATE RELEASE Report Finds that Worcester s Foreign-Born Are Major Economic Contributors UMass report finds local immigrants play a large and critical role in the local economy
Population Estimates
 Population Estimates AUGUST 200 Estimates of the Unauthorized Immigrant Population Residing in the United States: January MICHAEL HOEFER, NANCY RYTINA, AND CHRISTOPHER CAMPBELL Estimating the size of the
CITY OF MISSISSAUGA. Overview 2-1. A. Demographic and Cultural Characteristics
 Portraits of Peel Overview 2-1 A. Demographic and Cultural Characteristics Population: Size, Age and Growth 2-2 Immigrants 2-3 Visible Minorities 2-4 Language 2-5 Religion 2-6 Mobility Status 2-7 B. Household
Louisville: Immigration Rebirth Matt Ruther, Department of Urban and Public Affairs, University of Louisville
 Louisville: Immigration Rebirth Matt Ruther, Department of Urban and Public Affairs, University of Louisville Germantown. Schnitzelburg. Irish Hill. The names of neighborhoods within Louisville s urban
Abstract. Acknowledgments
 Profile of Hired Farmworkers, 1998 Annual Averages. By Jack L. Runyan. Food and Rural Economics Division, Economic Research Service, U.S. Department of Agriculture. Agricultural Economic Report No. 790.
Headship Rates and Housing Demand
 Headship Rates and Housing Demand Michael Carliner The strength of housing demand in recent years is related to an increase in the rate of net household formations. From March 1990 to March 1996, the average
Socio-Economic Mobility Among Foreign-Born Latin American and Caribbean Nationalities in New York City,
 Socio-Economic Mobility Among Foreign-Born Latin American and Caribbean Nationalities in New York City, 2000-2006 Center for Latin American, Caribbean & Latino Studies Graduate Center City University of
THE STATE OF THE UNIONS IN 2009: A PROFILE OF UNION MEMBERSHIP IN LOS ANGELES, CALIFORNIA AND THE NATION 1
 THE STATE OF THE UNIONS IN 2009: A PROFILE OF UNION MEMBERSHIP IN LOS ANGELES, CALIFORNIA AND THE NATION 1 Lauren D. Appelbaum UCLA Institute for Research on Labor and Employment Ben Zipperer University
OFFICE OF THE CONTROLLER. City Services Auditor 2005 Taxi Commission Survey Report
 OFFICE OF THE CONTROLLER City Services Auditor 2005 Taxi Commission Survey Report February 7, 2006 TABLE OF CONTENTS INTRODUCTION 3 SURVEY DATA ANALYSIS 5 I. The Survey Respondents 5 II. The Reasonableness
EMBARGOED UNTIL THURSDAY 9/5 AT 12:01 AM
 EMBARGOED UNTIL THURSDAY 9/5 AT 12:01 AM Poverty matters No. 1 It s now 50/50: chicago region poverty growth is A suburban story Nationwide, the number of people in poverty in the suburbs has now surpassed
Inequality in the Labor Market for Native American Women and the Great Recession
 Inequality in the Labor Market for Native American Women and the Great Recession Jeffrey D. Burnette Assistant Professor of Economics, Department of Sociology and Anthropology Co-Director, Native American
Understanding the Immigrant Experience Lessons and themes for economic opportunity. Owen J. Furuseth and Laura Simmons UNC Charlotte Urban Institute
 Understanding the Immigrant Experience Lessons and themes for economic opportunity Owen J. Furuseth and Laura Simmons UNC Charlotte Urban Institute Charlotte-Mecklenburg Opportunity Task Force March 10,
THE LITERACY PROFICIENCIES OF THE WORKING-AGE RESIDENTS OF PHILADELPHIA CITY
 THE LITERACY PROFICIENCIES OF THE WORKING-AGE RESIDENTS OF PHILADELPHIA CITY Prepared by: Paul E. Harrington Neeta P. Fogg Alison H. Dickson Center for Labor Market Studies Northeastern University Boston,
North York City of Toronto Community Council Area Profiles 2016 Census
 Bar Chart showing the rate of population growth between the years 2006 and 2016 for the Ward compared to the City of based on the 2006 and data. For more information, please contact Michael Wright at 416-392-7558
Rural Child Poverty across Immigrant Generations in New Destination States
 Rural Child Poverty across Immigrant Generations in New Destination States Brian Thiede, The Pennsylvania State University Leif Jensen, The Pennsylvania State University March 22, 2018 Rural Poverty Fifty
Le Sueur County Demographic & Economic Profile Prepared on 7/12/2018
 Le Sueur County Demographic & Economic Profile Prepared on 7/12/2018 Prepared by: Mark Schultz Regional Labor Market Analyst Southeast and South Central Minnesota Minnesota Department of Employment and
Ward 4 Etobicoke Centre City of Toronto Ward Profiles 2016 Census
 Bar Chart showing the rate of population growth between the years 2006 and 2016 for the Ward compared to the City of based on the 2006 and data. For more information, please contact Michael Wright at 416-392-7558
1615 L Street, NW, Suite 700 Washington, DC (main) (fax)
 (fax)") 1615 L Street, NW, Suite 700 Washington, DC 20036-5631 202-419-3600(main) 202-419-3608(fax) www.pewresearch.org A Fact Tank The Pew Research Center is a nonpartisan organization that provides information
1615 L Street, NW, Suite 700 Washington, DC 20036-5631 202-419-3600(main) 202-419-3608(fax) www.pewresearch.org A Fact Tank The Pew Research Center is a nonpartisan organization that provides information
Older Immigrants in the United States By Aaron Terrazas Migration Policy Institute
 Older Immigrants in the United States By Aaron Terrazas Migration Policy Institute May 2009 After declining steadily between 1960 and 1990, the number of older immigrants (those age 65 and over) in the
Transitions to Work for Racial, Ethnic, and Immigrant Groups
 Transitions to Work for Racial, Ethnic, and Immigrant Groups Deborah Reed Christopher Jepsen Laura E. Hill Public Policy Institute of California Preliminary draft, comments welcome Draft date: March 1,
An Equity Assessment of the. St. Louis Region
 An Equity Assessment of the A Snapshot of the Greater St. Louis 15 counties 2.8 million population 19th largest metropolitan region 1.1 million households 1.4 million workforce $132.07 billion economy
Ohio s Immigrants. Toledo and Dayton December 10-11, George Gund Foundation Migration Policy Institute
 Ohio s Immigrants George Gund Foundation Toledo and Dayton December 10-11, 2015 Acknowledgments Ariel Ruiz at MPI analyzed the data and wrote the slides for this presentation. Colin Hammar and James Bachmeier
Advancing Equity and Inclusive Growth in San Joaquin Valley: Data for an Equity Policy Agenda
 Advancing Equity and Inclusive Growth in San Joaquin Valley: Data for an Equity Policy Agenda Equity is the Superior Growth Model Image source: Flickr. Regional indicators database Coverage: 150 largest
Hispanic Employment in Construction
 Hispanic Employment in Construction Published by the CPWR Data Center The recent economic downturn affected the entire U.S. construction industry. To better understand how Hispanic construction workers
Remittances from Japan to Latin America
 Remittances from Japan to Latin America Bendixen & Associates April 6, 2005 Inter-American Development Bank Inter-American Development Bank Annual Meeting Of the Board of Governors Remittances From Japan
Asian Pacific American Heritage Month: May 2004
 CB04-FF.06 April 19, 2004 Asian Pacific American Heritage Month: May 2004 In 1978, a joint congressional resolution established Asian Pacific American Heritage Week. The first 10 days of May were chosen
Prophetic City: Houston on the Cusp of a Changing America.
 Prophetic City: Houston on the Cusp of a Changing America. Tracking Responses to the Economic and Demographic Transformations through 36 Years of Houston Surveys Dr. Stephen L. Klineberg TACA 63rd Annual