Quality of Life in the Gauteng City-Region: 2011 findings
|
|
|
- Shauna Lawrence
- 5 years ago
- Views:
Transcription


1 Quality of Life in the Gauteng City-Region: 2011 findings Slides prepared by GCRO team unless otherwise stated Results from the Quality of Life sample survey of residents of the Gauteng city-region

2 Quick introduction to the GCRO Behind the motivation for setting up the GCRO is a vision for a fast growing and dynamic Gauteng City-Region (GCR) that through better planning and management, and in particular improved co-operative government relations between all spheres of government, will become more functionally integrated, spatially coherent, globally competitive, economically productive, environmentally sustainable and socially inclusive.. GCRO is an institutional collaboration between the: University of Johannesburg (UJ), University of the Witwatersrand (Wits), Gauteng Provincial Government (GPG) Funded with a core grant from the Gauteng Premier s Office and inkind support from the universities GCRO Board comprises academics from each university, and reps from provincial and local government Launched September 2008 Fully staffed July
3 Quick Introduction to the GCRO Some illustrative projects Some of our recent projects include: 1. Facilitating the OECD Territorial Review of the GCR 2. A survey of surveys conducted by all governments in the GCR 3. A project on non-racialism with the Ahmed Kathrada Foundation (now published in Politikon, foreword by Kathy) 4. A 3-survey 2-year tracking study of the impact of FIFA 2010 on microtraders, results presented at the Sport and the City conference 5. An interactive mapping tool allowing users to manipulate the 50 priority Ward data and generate their own maps 6. The first of three books analysing Johannesburg (others to look at other areas in GCR) from spatial perspectives 7. On-going work on: risk and vulnerability; ecosystem costing and valuation; metabolic flows; poverty & inequality; conceptualising the GCR (including early history from 1920s onwards); trade flows within and beyond the GCR; a study of peripheral towns in the GCR; visualisation of the GCR through photographs; the urban space economy; regular Data Briefs, Vignettes, newsletters and other outputs, as well as books, journal articles, and so on 8. Commissioned work from academic partners at UJ, UP and elsewhere
4 Quality of life sampling methodology and verification External sampling experts used to ensure robust sample; multi-stage PPS sampling approach used, based on combination of up-to-date data sources - Lightstone 2010 DemprokeyX data (so different sample frame because Census 2001 simply not possible any longer). Fieldwork by DataWorld, Field Focus and Concept Evaluations wards used as primary sampling unit 507 (out of a possible 508) wards sampled in Gauteng (access in one Midvaal ward completely impossible) Stratification was by local municipality with a minimum of 600 interviews targeted in each municipality; priority townships were oversampled with a minimum of 100 interviews in each township; thereafter PPS used to allocate remaining interviews successful interviews conducted between 15 August and 15 December site visits required to realise this sample Random starting point ID within ward, every 5 th stand selected for interview, birthday rule for ID respondent 18+, dice roll for multiple households per stand
5 II Surveys conducted with digital pen tech and GPS point captured for each interview Quality control: Field managers quality check on every questionnaire External agency personnel surprise field visits & call backs on +-5% of questionnaires GIS verification surveys in the correct ward, 1008 within the correct municipality Final dataset weighting: surveys weighted at ward level and 1008 at municipal level; total sample size Error bar: 0.7%
6 Overview of QoL 2011 survey Graph below shows number of respondents per ward. We want to get to a wardrepresentative QoL survey over time. In general, representivity requires at least 20 to 30 respondents per ward. In 2011, 47% of wards (237 of 507 wards), had 30 respondents or more. 80% (408 of 507) had 20 respondents or more. Only 14 wards had fewer than 10 respondents Very close, but full representivity at ward level will depend on municipalities co-investing in an even larger sample in
7 Fieldwork Many parts of Gauteng are no go zones to researchers Gated communities in particular demand a wide range of ID/letters/etc., all fieldworkers had badges and bibs and official signage (on cars etc.), but in many instances were refused entry This was worst in Midvaal at one location on the Vaal, (white) fieldworkers were escorted out of a gated community at gun-point this after over 40 attempts to negotiate access Mines and similar compound areas also refused entry Research cannot proceed where local individuals or structures or security companies decide to make their own laws and regulate entry as they see fit this is why we have a democratic constitution. This behaviour is reprehensible in every way.

8 Land cover in Gauteng (GTI data)

9 Sample: respondents, error bar: 0,7% For 2011, sample was restricted to Gauteng only (Soweto inset shows distribution)
10 Some of the main development challenges
11 % of households in type of dwelling 100.0% 90.0% 9.3% 4.8% 10.1% 8.8% 17.3% 6.1% 15.7% 10.5% 9.4% 9.9% 80.0% 70.0% 31.0% 60.0% 50.0% 40.0% 88.3% 91.0% 87.3% 87.6% 80.1% 89.5% 80.9% 86.8% 88.7% 87.5% 30.0% 60.2% 20.0% 10.0% 0.0% Formal Informal Other
12 Biggest problems facing the community: 2009 vs 2011 Housing as the single biggest perceived problem decreased from 2009 to 2011 among the sample respondents: Percent Tshwane 14 Lesedi Ekurhuleni Midvaal 4 Johannesburg Emfuleni Mogale City Merafong City Randfontein Westonaria * For evaluation purposes the 2011 municipal boundaries are used (2009 data for Kungwini and Nokeng is thus combined with that of Tshwane); : 0 percent position
13 Percentage with piped water in dwelling or on site, 2009 vs % 90% 80% 94% 95% 97% 96% 93% 93% 91% 92% 94% 92% 93% 91% 92% 86% 87% 86% 83% 84% 81% 80% 70% 60% 64% 62% 50% 40% 30% % 10% 0%


14 For those without piped water on site or in dwelling, is water source more than 200m away?
15 Proportion of respondents with refuse NOT collected by municipality, 2009 vs 2011 E.g. Placed on communal refuse dump, own refuse dump, burnt in pit, buried 35% 33% 30% 25% 20% 23% 21% 22% 19% 15% 10% 5% 7% 6% 9% 7% 2% 5% 4% 14% 16% 13% 15% 14% 12% 12% 12% 9% 7% %


16 Do people recycle? And if not, why not?
17 Proportion of households recycling by municipality Yes No 100% 90% 6% 11% 13% 17% 17% 18% 18% 20% 24% 25% 18% 80% 70% 60% 50% 40% 94% 89% 87% 83% 83% 82% 82% 80% 76% 75% 82% 30% 20% 10% 0% Overall, majority of the respondents in all municipalities do not recycle

18 Numbers of households sharing a toilet, 2011 Of the sample, 19% of households still share a toilet with at least one other household, which highlights concerns for not only privacy, but also health and safety though concentrated in apartments, hostels and backyard shacks Percentage households in Gauteng sharing a toilet no sharing

19 Numbers of households sharing a toilet, by municipality 100% 90% 80% 70% 60% 50% 40% 30% 20% 10% 0% 3% 3% 3% 4% 3% 3% 2% 4% 4% 5% 4% 4% 6% 10% 5% 5% 7% 6% 7% 5% 6% 6% % 91% 91% 89% 84% 5 82% 81% 80% 80% 78% 80% % of the respondents in Johannesburg are sharing toilet with more than one other households Midvaal and Merafong has the least proportion of respondents sharing toilet with more than one person (8% and 9% respectively) Occurs primarily in inner-city apartments and hostels
20 Satisfaction with dwelling
21 Satisfaction with water
22 Satisfaction with sanitation
23 Satisfaction with waste removal
24 Satisfaction with energy sources
25 Satisfaction with roads
26 Satisfaction with cost of municipal services
27 Satisfaction with billing of services
28 Satisfaction with amenities: results from the 2011 QoL survey by race There remains under-utilisation of key assets, reflecting 2009 finding that main recreation areas were malls (80%) and restaurants/clubs (45%) 100% N/A Dissatisfied/very dissatisfied Neutral Satisfied/very satisfied 90% 80% 70% % % 40% 30% % % % Museums/Art Galleries Libraries Sports facilities/events World Heritage Sites Bot. gardens/parks
29 Transport and mobility questions Christo Venter, University of Pretoria and GCRO
30 Main trip purpose Work Look for work Education Shop Serve children Social/leisure Other 1516 Only about half of the trips people regard as their most frequent trips are to work. Many other trips, including for shopping, school, and looking for work, are also important (yet frequently undervalued by transport providers and planners) the second largest category comprises people looking for work.
31 Mode used for main trip purpose Other 9% 33% 50% 2% 3% Shopping/leisure 9% 28% 57% 2% 3% Education 13% 32% 44% 5% 6% Look for work 6% 9% 73% 2% 9% Work 6% 42% 42% 3% 5% 0% 10% 20% 30% 40% 50% 60% 70% 80% 90% 100% Walk Bicycle Car/Mbike Taxi Bus/BRT Train Other Most work trips are made by car and taxi. Taxi is a very important mode for workseekers. Taxis are also used for a variety of other purposes such as going to education and shopping/leisure activities. Notes: This refers to main mode, i.e. mode used for the longest distance of each trip. It does not necessarily correlate to the overall percentage of people using a particular mode. It is likely walk trips are undercounted, as many people don t think of it as transport, or use it for more infrequent trips.
32 Mode to work, by municipality GAUTENG (n=5955) 6% 42% 42% Westonaria (n=96) 11% 29% 51% Tshwane (n=1399) 4% 46% 40% Randfontein (n=76) 5% 47% 41% Mogale (n=216) 8% 44% 44% Midvaal (n=49) 10% 59% 29% Merafong (n=143) 9% 36% 39% Lesedi (n=44) 5% 34% 57% Johannesburg (n=2217) 7% 42% 42% Emfuleni (n=450) 3% 37% 50% Ekurhuleni (n=1265) 8% 41% 42% 0% 10% 20% 30% 40% 50% 60% 70% 80% 90% 100% Walk Bicycle Car/Mbike Taxi Bus/BRT Train Other Overall, cars and taxis carry equal numbers of people to work in Gauteng. However, mode use varies across municipalities: cars dominate in the higherincome municipalities of Midvaal, Tshwane, Johannesburg and Mogale City, while taxis dominate elsewhere. Notes: This refers to main mode, i.e. mode used for the longest distance of each trip. Caution is needed when interpreting data from small sample sizes.
33 School travel Bus time to school bell Walk time to school bell 50% 50% 40% 30% 20% 10% 0% 50% 40% 30% <15 min min min min Taxi time to school bell >60 min Taxi 15% Bus/BRT 11% Car/Mbike 19% Train 1% Other 1% Walk 51% 40% 30% 20% 10% 0% 50% 40% 30% <15 min min min min >60 min Car time to school bell 20% 20% 10% 0% <15 min min min min >60 min Bicycle 2% 10% 0% <15 min min min min >60 min About half of trips to school are made on foot, with car, taxi and bus/brt of decreasing importance. Transport conditions require many children to leave home very early: more than 40% of children using taxis and buses leave home more than an hour before the bell. Notes: The question captures the time between when children leave the home and when school starts, so reflects not only travel time but some additional time spent at the school.
34 Access to public transport 100% 4% 4% 5% 12% 5% 11% 8% 5% 5% 6% 5% 80% 21% 30% 20% 26% 26% 37% 30% 21% 25% 30% 23% 60% 40% 20% 75% 66% 75% 63% 68% 53% 62% 74% 70% 64% 72% 0% Within 10 minutes minutes More than 30 minutes Public transport (PT) access in Gauteng is reasonably good: overall, almost three-quarters of households live within 10 minutes walk of a public transport service, and 95% live within a 30-minute walk (about 2 kilometers). PT access is worst in Lesedi, Midvaal and Mogale City. Notes: These are based on walk times to the nearest taxi, bus or train, estimated by the respondent and not verified.
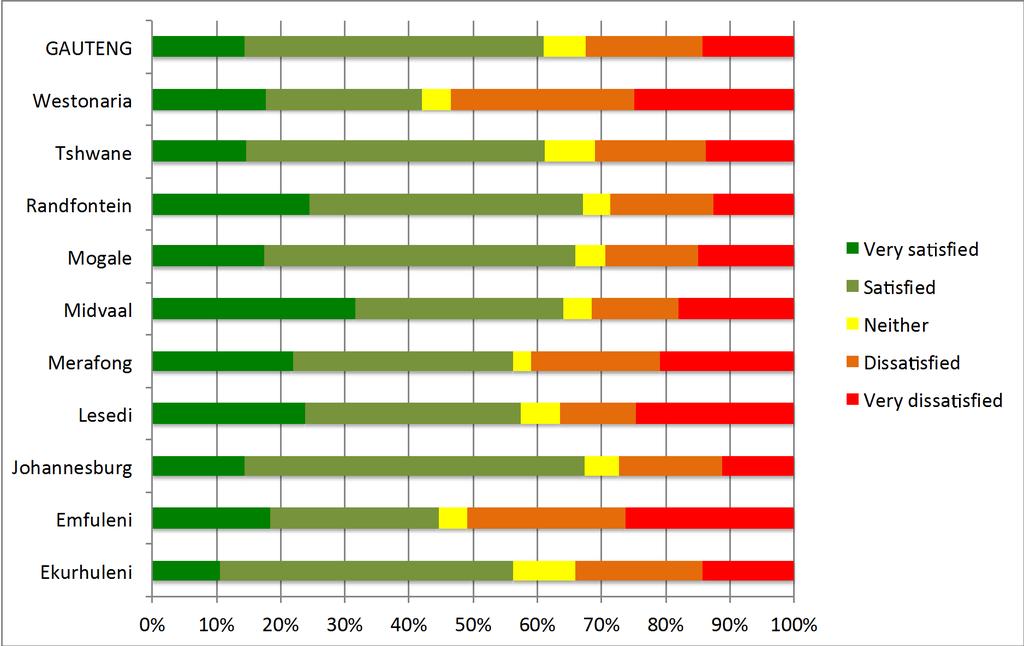
35 Satisfaction with transport Westonaria 33% 48% 9% 9% 2% Tshwane 17% 65% 8% 7% 4% Randfontein 21% 62% 8% 8% 1% Mogale 18% 60% 6% 14% 3% Midvaal 31% 55% 6% 6% 2% Merafong 20% 66% 6% 7% 1% Lesedi 32% 50% 8% 3% 7% Johannesburg 14% 61% 10% 11% 3% Emfuleni 26% 49% 11% 11% 3% Ekurhuleni 13% 54% 12% 16% 5% 0% 10% 20% 30% 40% 50% 60% 70% 80% 90% 100% Very satisfied Satisfied Neither Dissatisfied Very dissatisfied Satisfaction with transport, in general, is highest in Midvaal, Merafong, Lesedi, and Randfontein municipalities, despite having below average public transport coverage and travel times. Satisfaction is lowest in Ekurhuleni, Johannesburg, and Mogale City. Expectations might be different in metro and non-metro areas.
36 All trips to look for work in GP
37 All trips to study in GP (scholars and students)
38 All shopping trips in GP

39 From Alex to work

40 Going to work from Diepsloot

41 From Soweto to work.
42 Main problems with public transport % of public transport users reporting problem Unreliability Unroadworthy vehicles Crime / security Reckless driving Lack of comfort Insufficient service at night Insufficient service on weekend Long walk to nearest stop / station METRO Ekurhuleni 13% 14% 3% 12% 11% 6% 15% 1% 1% 3% 4% Johannesburg 13% 11% 3% 12% 14% 9% 14% 2% 1% 2% 4% Tshwane 16% 9% 3% 14% 12% 9% 16% 2% 1% 3% 4% Long wait at stop / station Rude drivers and / or passengers Expensive NON- METRO Emfuleni 12% 14% 3% 15% 15% 9% 13% 2% 0% 1% 5% Lesedi 10% 5% 3% 18% 12% 14% 14% 3% 1% 2% 8% Merafong 13% 22% 3% 9% 6% 7% 12% 3% 0% 5% 7% Midvaal 9% 13% 0% 11% 4% 4% 12% 3% 3% 5% 21% Mogale 11% 11% 3% 11% 12% 8% 9% 4% 2% 4% 10% Randfontein 12% 14% 3% 12% 9% 9% 9% 3% 1% 3% 9% Westonaria 13% 11% 3% 13% 13% 7% 10% 6% 1% 3% 8% When public transport users were asked for the main problems they experience, people in the metros were more concerned with the high cost of transport, rude drivers/passengers, and unreliable service. In non-metro areas, problems with unroadworthy vehicles, reckless driving, and rudeness dominate, consistent with high taxi use. Most people do not consider crime and security as a major problem.
43 Economy
44 Employment status by municipality Total Midvaal Westonaria Johannesburg Mogale City Merafong Tshwane Emfuleni Randfontein Ekurhuleni Lesedi % 10% 20% 30% 40% 50% 60% 70% 80% 90% 100% Employed formal Employed informal Unemployed Other
45 Rates of change in the proportion of employed Rate of change in proportion of employed Lesedi Merafong City Mogale City Ekurhuleni Tshwane Johannesburg 3.1 Midvaal 10.8 Randfontein 13.4 Emfuleni 29.1 Westonaria - Minimal change in proportion of employed in Johannesburg and Tshwane , change in proportion of employed increased was highest in Westonaria (but from low base) - For all municipalities with a negative rate, the proportion of the employed has actually fallen and magnitude of the fall was greatest in Lesedi
46 Income by race 2009/ White 2009 White 2011 Indian 2009 Indian 2011 Coloured 2009 Coloured 2011 African 2009 African 2011

47 Monthly household income and level of education % Very high household income levels are still associated with post-matric education. None Primary only Some secondary Matric More 5 0
48 Inequality scenarios: GCR Inc. high income category & no income Excl. high income category but incl. no income Inc. high Y but excl. no income
49 Hunger/poverty Total sample comparing 2009/ % of respondents in 2009 and 20% in 2011 had to skip a meal in past 12 months due to lack of money to buy food 13% of respondents in 2009 and 18% in 2011 had no money to feed the children in the household (in 12 months prior to interview) 5%(2009) or 6% (2011) of respondents eat 1 meal per day; 26% (now 31%) eat two meals, 62% (now down to 55%) eat three meals a day.

50 Unable to feed children in 12 months prior to interview Respondents who had children and were unable to feed them at any point during preceding 12 months
51 Migration & migrants

52 Migration to Gauteng

53 Origins of internal migrants to GP (all origin points)
54 Migration and belonging Where do you consider to be home 19% 5% 75% Gauteng Another province Another country 62% of respondents had been born in Gauteng, 38% were migrants. The 38% include 26% who came from another province; 6% from another country; the remainder did not answer. Evidence of impact of apartheid restrictions on movement into & within SA: significant cross border movement into GP since 1994: 10% in or before % % % Almost half of all migrants consider Gauteng to be home (43% another province & 11% another country)
55 A province of migrants? 100% 90% 80% 70% 60% 50% 40% 30% 20% 10% 0% 1% 3% 2% 4% 8% 3% 0.2% 23% 23% 29% 29% 28% 33% 39% 31% 76% 74% 69% 67% 64% 64% 61% 60% 9% 15% 9% 35% 45% 50% 46% Cross border migrant Internal migrant Born in Gauteng
56 Origins of internal & cross border migrants Provinces of origin of internal migrants (%) 35% 30% 29% Region of origin of cross border migrants (%) 80% 70% 76% 25% 60% 20% 19% 50% 40% 15% 13% 12% 12% 30% 10% 5% 0% 9% 3% 3% 20% 10% 0% 12% 7% 3% 1% 1% 0.30%
57 Attitudes to cross border migrants & migration Attitudes to migration policy 47% 21% 32% Send foreigners home Let foreigners stay Only allow legal foreigners Attitudes to migrants 2.3 % identified foreigners as the biggest/second biggest problem facing their community (0.5% 1 st mention, 1.8% 2 nd mention) Compares to 2.7% in th in importance for 1 st mention and 14 th in importance for 2 nd mention Attitudes to policy consistent across all groups BUT when asked to name biggest problem in community the most educated, whites, Indians, and those living in informal housing were most likely to name foreigners
58 Community
59 What is the main problem facing your community? 09/
60 In your opinion, can a man beat a woman if she NO YES burns the food refuses to have sex with him...goes out...argues with without telling him him...doesn t look after the children...is unfaithful 5% extrapolated to the Gauteng population is some half a million people. It is worth noting that of the 21 GBV shelters which exist for women in Gauteng, 19 are managed by civil society
61 Attitudes to GBV at local level Ekurhulen i Emfuleni CoJ Lesedi Merafong Midvaal Mogale Randfontei n Tshwane Westonaria Total goes out without telling him not look after kids argues with him refuses sex burns the food is unfaithful


62 Attitudes to abortion % On request, 17 Never, 55 Under specific circ.s (e.g. incest(, 28

63 Sense of safety 90 Very safe and fairly safe combined Victim of crime? Feel safe - day? Feel safe - walking at night? Feel safe at home?
64 What is the main health problem facing your community? HIV/AIDS Alcohol Drugs High BP TB Diabetes Teen preg
65 Participation in various fora (2009 & 2011) 45% 40% 35% 30% 25% 20% 15% 10% 5% 0% 41.0% 37.8% 37% 35.2% 24.2% 21% 18% 18.8% 13% 10.6% 9% 6.8%
66 Participation in the past year in CSOs 2009 & 2011 Cultural Civic Ratepayers Political party Youth Social/recreational Neighbourhood watch Street/block cttee Mens/Womens Sport Burial Religious
67 How residents normally find out what municipality is doing (multimention) Pamphlet/leaflet 29 Newspaper/magazine 22 Radio None of above In person munic. Officials Ward meeting Word of mouth Don't care/don't want to hear 8 Internet SMS/mobile phone app Municipal call centre/office Community centre
68 How residents would prefer to hear what municipality is doing (%) Pamphlet/leaflet Newspaper/magazine Radio None of above In person munic. Officials Ward meeting Word of mouth Don't care/don't want to hear Internet SMS/mobile app Municipal call centre/office Community centre
69 Household access to communications Total Ekurhuleni 100.0% 80.0% Emfuleni Westonari a 60.0% 40.0% 20.0% Johannesb urg Tshwane Randfontei n Mogale 0.0% Midvaal Merafong Lesedi Cellphone Television Radio/music system PC/laptop Landline Internet
70 Values & attitudes
71 Blacks and whites will never really trust each other 100% 90% 80% 70% 60% Disagree Neutral Agree 50% % 30% 20% 10% 0% African 2009 African Coloured 2009 Coloured 2011 Indian 2009 Indian White 2009 White 2011 We are failing to build nonracialism in Gauteng

72 Blacks and whites will never really trust each other Agree Neutral Disagree
73 Indians do not deserve to benefit from affirmative action African Indian Coloured White Disagree Neutral Agree Note how African and white respondents least likely to disagree, most likely to agree or sit in the neutral category
74 Coloureds are helping to build the new South Africa 100% 90% 80% Disagree Neutral Agree 70% 60% 50% 40% 30% 20% 10% 0% African Indian Coloured White When the question is about coloureds, Indians and Africans are hostile while whites support as playing a positive role in SA
75 No-one cares about people like me (Alienation by race, don t know /neutral not shown, strongly agree only) Agree Agree ' African Coloured Indian White Total

76 Corruption is main threat to our democracy Strongly agree Agree Neutral Disagree Strongly disagree Total African Coloured Indian White
 with government 09/11 60 57 Satisfied 09 50 40 39 37 50 44 40 40 48 Satisfied '11 Neither 09 Neither '11")
77 Satisfaction (or not!) with government 09/ Satisfied Satisfied '11 Neither 09 Neither '11 Dissatsfied Dissatisfied ' National Provincial Local govt
78 Batho Pele & Corruption Batho Pele Only 19% believe public servants act according to Batho Pele principles (explained to respondent) down from 27% in 2009 Only 16% of residents in informal settlements & Asian/Indian respondents believe public servants act according to Batho Pele principles 51% do not think public servants act according to Batho Pele (57% in 2009) remainder do not interact Corruption 10% had ever been asked to pay a bribe by a public servant 8% of Africans, 16% of Asian/Indians and 18% of whites had been asked for a bribe Women were least likely to have been asked for a bribe (7%) compared to 13% of men Migrants were not more likely to have been asked to pay a bribe than nonmigrants
79 Quality of Life
80 QoL dimensions means (2009/2011) Work Socio-political Security Global Connectivity Community Family Dwelling Infrastructure Health
81 Overall Quality of Life index The GCR was in the midst of the global economic crisis in 2009 but has weathered the storm well, with overall (average) QoL rising from 6.24 to 6.25


82 2009 mean: mean: 6.25
83 QoL means by municipality Westonaria Ekurhuleni Emfuleni Mogale City Merafong City Lesedi Johannesburg Tshwane Midvaal Randfontein
84 Tentative conclusions o This is a first analysis of the data, and far deeper analysis is required and will be forthcoming o Mood is very low. This is natural between elections, as part of national (and provincial and local) mood cycles, but equally clearly, there is a substantial loss of faith in politicians and a belief that corruption is the biggest threat facing democracy in Gauteng o Delivery looks very positive, if uneven across municipalities. Delivery of services can always be improved; but despite the rash of protests does not seem to be a major problem for GPG. o What we seem to be missing is the ghost in the machine, the energy or spirit or vision that holds together our varied and cosmopolitan population behind and in support of GPG. The domains pulling down quality of life are work (or lack of ), family, socio-political sense and global that all-round sense that the world is well, my world is well, and things will get better that hope and optimism is what the survey has battled to find, and in its place we find deep hostility to politics, dissatisfaction with government (all spheres), and a replacement of faith in the judiciary (which took a hit in 2009) o Clearly, we face challenges but they are of the more intangible, less easy to resolve, type. Delivery alone may not be the answer.
85 Thank you
5. Neighbourhood GAUTENG CITY-REGION OBSERVATORY QUALITY OF LIFE SURVEY 2015 LANDSCAPES IN TRANSITION
 . Neighbourhood Dr Richard Ballard, richard.ballard@gcro.ac.za, 717 7197 Samy Katumba, samy.katumba@gcro.ac.za, 717 7199 Dr Aidan Mosselson, aidan.mosselson@gcro.ac.za, 717 7696 Mncedisi Siteleki, mncendisi.siteleki@gcro.ac.za,
QUALITY OF LIFE SURVEY IV:
 GCRO DATA BRIEF # NO.7 QUALITY OF LIFE SURVEY IV: CRIME AND PERCEPTIONS OF SAFETY IN GAUTENG SEPTEMBER 2017 Authors: Mncedisi Siteleki, Richard Ballard, Aidan Mosselson A PARTNERSHIP OF QUALITY OF LIFE
Informal entrepreneurship and Gauteng
 Informal entrepreneurship and Gauteng ELLA Summit on Informality and Inclusive Growth Sally Peberdy (PhD) Gauteng City-Region Observatory (GCRO) sally.peberdy@gcro.ac.za Overview of QoL 2015 Overview of
QUALITY OF LIFE SURVEY IV:
 GCRO DATA BRIEF # NO.8 QUALITY OF LIFE SURVEY IV: SOCIAL COHESION FEBRUARY 2018 Authors: Richard Ballard, Christian Hamann A PARTNERSHIP OF QUALITY OF LIFE IV: SOCIAL COHESION February 2018 ISBN: 978-0-6399114-6-5
GCRO DATA BRIEF: NO. 5 Gauteng: a province of migrants
 DATA BRIEF GCRO DATA BRIEF: NO. 5 Produced by the Gauteng City-Region Observatory (GCRO) A partnership of the University of Johannesburg (UJ), University of the Witwatersrand, Johannesburg (Wits), the
Internal Migration to the Gauteng Province
 Internal Migration to the Gauteng Province DPRU Policy Brief Series Development Policy Research Unit University of Cape Town Upper Campus February 2005 ISBN 1-920055-06-1 Copyright University of Cape Town
PUBLIC SURVEY 2015 Report Presentation
 PUBLIC SURVEY 2015 Report Presentation Public Survey on the Ottawa Police Service Presentation, September 28, 2015 Objectives and Methodology Objectives and Methodology Context and Objectives The Ottawa
Annex B Local cohesion mapping exercise
 Cohesion Delivery Framework 27 Annex B Local cohesion mapping exercise This annex suggests how local areas might be able to gather data on the influences on cohesion identified by our research. It is important
Non Financial Census of Municipalities
 Non Financial Census of Municipalities Pali Lehohla Statistician-General Statistics South Africa Cape Town 22 October 2014 1 Outline of Presentation Oversight Role of the Portfolio Committee Using Stats
CDE EXECUTIVE SUMMARY
 CDE EXECUTIVE SUMMARY March 2014 CITIES OF HOPE Cities have never been more important for human well-being and economic prosperity. Half of the world s population lives in urban areas, while about 80 per
Acknowledgements. Gauteng City-Region Observatory: the city-region review 2011 GCRO
 Gauteng City-Region Observatory the city-region review 2011 Acknowledgements Gauteng City-Region Observatory: the city-region review 2011 GCRO The GCRO is a partnership of the University of Johannesburg,
Done by: Thandokuhle Manzi
 Done by: Thandokuhle Manzi The Study Area Cato Manor is a working class area located seven kilometers from Durban's city center. It is characterized by an array of housing settings which range from proper
ANNUAL SURVEY REPORT: REGIONAL OVERVIEW
 ANNUAL SURVEY REPORT: REGIONAL OVERVIEW 2nd Wave (Spring 2017) OPEN Neighbourhood Communicating for a stronger partnership: connecting with citizens across the Eastern Neighbourhood June 2017 TABLE OF
Telephone Survey. Contents *
 Telephone Survey Contents * Tables... 2 Figures... 2 Introduction... 4 Survey Questionnaire... 4 Sampling Methods... 5 Study Population... 5 Sample Size... 6 Survey Procedures... 6 Data Analysis Method...
ANNUAL SURVEY REPORT: ARMENIA
 ANNUAL SURVEY REPORT: ARMENIA 2 nd Wave (Spring 2017) OPEN Neighbourhood Communicating for a stronger partnership: connecting with citizens across the Eastern Neighbourhood June 2017 ANNUAL SURVEY REPORT,
This report is formatted for double-sided printing.
 Public Opinion Survey on the November 9, 2009 By-elections FINAL REPORT Prepared for Elections Canada February 2010 Phoenix SPI is a Gold Seal Certified Corporate Member of the MRIA 1678 Bank Street, Suite
SEJA BASELINE SURVEY REPORT
 SEJA BASELINE SURVEY REPORT Foundation for Human Rights 2018 Table of Contents Glossary of terms... 4 Introduction... 1 Methodology... 2 Questionnaire design... 2 Language... 2 Computer-assisted personal
INTRODUCTION TO THE 2001 MIGRATION STUDY PROJECT IN THE WESTERN CAPE PROVINCE
 INTRODUCTION TO THE 2001 MIGRATION STUDY PROJECT IN THE WESTERN CAPE PROVINCE The reasons behind the Migration Study in the Western Cape The principle of cooperative government established by the 1996
THE UNIVERSITY OF HONG KONG LIBRARIES. Hong Kong Collection. gift from Hong Kong (China). Central Policy Unit
. Central Policy Unit") THE UNIVERSITY OF HONG KONG LIBRARIES Hong Kong Collection gift from Hong Kong (China). Central Policy Unit MDR Quality, Dedication & Expertise Preparedfor Central Policy Unit Household Survey on 24-hour
THE UNIVERSITY OF HONG KONG LIBRARIES Hong Kong Collection gift from Hong Kong (China). Central Policy Unit MDR Quality, Dedication & Expertise Preparedfor Central Policy Unit Household Survey on 24-hour
Vancouver Police Community Policing Assessment Report Residential Survey Results NRG Research Group
 Vancouver Police Community Policing Assessment Report Residential Survey Results 2017 NRG Research Group www.nrgresearchgroup.com April 2, 2018 1 Page 2 TABLE OF CONTENTS A. EXECUTIVE SUMMARY 3 B. SURVEY
City of Bellingham Residential Survey 2013
 APPENDICES City of Bellingham Residential Survey 2013 January 2014 Pamela Jull, PhD Rachel Williams, MA Joyce Prigot, PhD Carol Lavoie P.O. Box 1193 1116 Key Street Suite 203 Bellingham, Washington 98227
Denver, CO Community Livability Report
 Denver, CO Community Livability Report 2016 2955 Valmont Road Suite 300 777 North Capitol Street NE Suite 500 Boulder, Colorado 80301 Washington, DC 20002 n-r-c.com 303-444-7863 icma.org 800-745-8780 Contents
City of Janesville Police Department 2015 Community Survey
 City of Janesville Police Department 2015 Community Survey Presentation and Data Analysis Conducted by: UW-Whitewater Center for Political Science & Public Policy Research Susan M. Johnson, Ph.D. and Jolly
Employment Guarantee in South Africa: a case study of the CWP in Munsieville, Johannesburg
 Employment Guarantee in South Africa: a case study of the CWP in Munsieville, Johannesburg Dr. Khayaat Fakier ThembaMasondo Society, Work and Development Institute (SWOP) University of the Witwatersrand,
Spain PROMISE (GA693221)
") Spain Population 46.443.959 Population aged 15-29 years old 14,7% Population aged 65 years old and above 19,2% Birth Rate 9,0 International migrant stock as a percentage of the 12,7% total population PROMISE
Spain Population 46.443.959 Population aged 15-29 years old 14,7% Population aged 65 years old and above 19,2% Birth Rate 9,0 International migrant stock as a percentage of the 12,7% total population PROMISE
Denver, CO Community Livability Report
 Denver, CO Community Livability Report 2015 2955 Valmont Road Suite 300 777 North Capitol Street NE Suite 500 Boulder, Colorado 80301 Washington, DC 20002 n-r-c.com 303-444-7863 icma.org 800-745-8780 Contents
Denver, CO Community Livability Report
 Denver, CO Community Livability Report 2017 2955 Valmont Road Suite 300 777 North Capitol Street NE Suite 500 Boulder, Colorado 80301 Washington, DC 20002 n-r-c.com 303-444-7863 icma.org 800-745-8780 Contents
Chile s average level of current well-being: Comparative strengths and weaknesses
 How s Life in Chile? November 2017 Relative to other OECD countries, Chile has a mixed performance across the different well-being dimensions. Although performing well in terms of housing affordability
Background. Response Rate and Age Profile of Respondents. Community Facilities and Amenities. Transport Issues. Employment and Employment Land Issues
 Background Response Rate and Age Profile of Respondents Community Facilities and Amenities Transport Issues Employment and Employment Land Issues Housing and Housing Land Issues Telecommunications Tourism
ANNUAL SURVEY REPORT: BELARUS
 ANNUAL SURVEY REPORT: BELARUS 2 nd Wave (Spring 2017) OPEN Neighbourhood Communicating for a stronger partnership: connecting with citizens across the Eastern Neighbourhood June 2017 1/44 TABLE OF CONTENTS
EXECUTIVE SUMMARY EXECUTIVE SUMMARY 1
 EXECUTIVE SUMMARY Afghanistan in 2018: A Survey of the Afghan People is The Asia Foundation s fourteenth annual public opinion survey in Afghanistan. The longest-running barometer of Afghan perception
ANNUAL SURVEY REPORT: GEORGIA
 ANNUAL SURVEY REPORT: GEORGIA 2 nd Wave (Spring 2017) OPEN Neighbourhood Communicating for a stronger partnership: connecting with citizens across the Eastern Neighbourhood June 2017 TABLE OF CONTENTS
Lawyers for Human Rights presentation to the Committee
 Lawyers for Human Rights presentation to the Committee Lawyers for Human Rights Lawyers for Human Rights ( LHR ) is an independent human rights organisation with a 37-year track record of human rights
CSIR Policy Note 3. Using Election Registration Data to measure Migration Trends in South Africa. Introduction the need for additional data
 CSIR Policy Note 3 Using Election Registration Data to measure Migration Trends in South Africa Introduction the need for additional data Demography is not static, and population figures, distribution
Cities, Development & Armed Violence
 Cities, Development & Armed Violence Eldred de Klerk AFRICA Analysis Cape Town, South Africa Getting around Cape Town can get you killed!? Be that as it may, you still have to get around, no? Public Transport
Item No Halifax Regional Council July 19, 2016
 P.O. Box 1749 Halifax, Nova Scotia B3J 3A5 Canada Item No. 14.4.1 Halifax Regional Council July 19, 2016 TO: SUBMITTED BY: Mayor Savage and Members of Halifax Regional Council Original Signed Councillor
How s Life in Iceland?
 How s Life in Iceland? November 2017 In general, Iceland performs well across the different well-being dimensions relative to other OECD countries. 86% of the Icelandic population aged 15-64 was in employment
City of Surrey. Labour Force Fact Sheet. Preface
 City of Preface Every five years, Statistics Canada conducts a Census of Population in order to develop a statistical portrait of Canada and its people. The most recent Census was conducted in May 2011.
MIGRATION INTO GAUTENG PROVINCE
 Development Policy Research Unit University of Cape Town Private Bag Rondebosch 7701 Southern African Migration Project Post Net Box 321a Private Bag X30500 Johannesburg 2041 MIGRATION INTO GAUTENG PROVINCE
How s Life in New Zealand?
 How s Life in New Zealand? November 2017 On average, New Zealand performs well across the different well-being indicators and dimensions relative to other OECD countries. It has higher employment and lower
ANNUAL SURVEY REPORT: AZERBAIJAN
 ANNUAL SURVEY REPORT: AZERBAIJAN 2 nd Wave (Spring 2017) OPEN Neighbourhood Communicating for a stronger partnership: connecting with citizens across the Eastern Neighbourhood June 2017 TABLE OF CONTENTS
CITY USER PROFILE 15 ADELAIDE CITY COUNCIL RESEARCH REPORT
 CITY USER PROFILE 15 ADELAIDE CITY COUNCIL RESEARCH REPORT CONTENTS What is the City User Profile and why do we do it? p. 03 How is CUP data collected? p. 03 What are some of the key findings from CUP
How s Life in the United Kingdom?
 How s Life in the United Kingdom? November 2017 On average, the United Kingdom performs well across a number of well-being indicators relative to other OECD countries. At 74% in 2016, the employment rate
GALLUP DAILY TRACKING
 GALLUP DAILY TRACKING TOPICS AND METHODOLOGY The subsequent pages list the topics covered in Gallup Daily tracking an unprecedented survey of 1,000 U.S. adults each day, 350 days per year. Gallup Daily
How s Life in Ireland?
 How s Life in Ireland? November 2017 Relative to other OECD countries, Ireland s performance across the different well-being dimensions is mixed. While Ireland s average household net adjusted disposable
NOVEMBER visioning survey results
 NOVEMBER 2016 visioning survey results 2 Denveright SECTION 1 SURVEY INTRODUCTION OVERVIEW Our community is undertaking an effort that builds upon our successes and proud traditions to design the future
POVERTY AND INEQUALITY
 GCRO RESEARCH REPORT # NO. 09 POVERTY AND INEQUALITY IN THE GAUTENG CITY-REGION JUNE 2018 Researched and written by Darlington Mushongera, David Tseng, Prudence Kwenda, Miracle Benhura, Precious Zikhali
How s Life in Belgium?
 How s Life in Belgium? November 2017 Relative to other countries, Belgium performs above or close to the OECD average across the different wellbeing dimensions. Household net adjusted disposable income
UTS:IPPG Project Team. Project Director: Associate Professor Roberta Ryan, Director IPPG. Project Manager: Catherine Hastings, Research Officer
 IPPG Project Team Project Director: Associate Professor Roberta Ryan, Director IPPG Project Manager: Catherine Hastings, Research Officer Research Assistance: Theresa Alvarez, Research Assistant Acknowledgements
Governance and Anti-Corruption Diagnostic Study: Methodology and Findings
 Governance and Anti-Corruption Diagnostic Study: Methodology and Findings CMDA with the collaboration of the World Bank Institute October 28, 2003 http://www.worldbank.org/wbi/governance Objectives of
Vancouver Police Community Policing Assessment Report
 Vancouver Police Community Policing Assessment Report Residential Survey Results FINAL DRAFT NRG Research Group Adam Di Paula & Richard Elias www.nrgresearchgroup.com 3/17/2009 VPD Community Policing Report
City of Surrey. Preface. Labour Force Fact Sheet
 City of Labour Force Fact Sheet Preface Statistics Canada conducts its Census of Population every five years with the most recent census having occurred in 2006. The Census provides information on the
2. The study offers unique contributions to understanding social capital in Singapore.
 A STUDY ON SOCIAL CAPITAL IN SINGAPORE By the Institute of Policy Studies, National University of Singapore Supported by the Ministry of Culture, Community and Youth Research by Associate Professor Vincent
How s Life in Slovenia?
 How s Life in Slovenia? November 2017 Slovenia s average performance across the different well-being dimensions is mixed when assessed relative to other OECD countries. The average household net adjusted
Korea s average level of current well-being: Comparative strengths and weaknesses
 How s Life in Korea? November 2017 Relative to other OECD countries, Korea s average performance across the different well-being dimensions is mixed. Although income and wealth stand below the OECD average,
South Africa s Electoral
 GIS and its role at the Electoral Commission by Clare van Zwieten, EE Publishers GIS plays an important role in enabling the Electoral Commission to fulfil its mandate to impartially manage free and fair
Rural Pulse 2016 RURAL PULSE RESEARCH. Rural/Urban Findings June 2016
 Rural Pulse 2016 RURAL PULSE RESEARCH Rural/Urban Findings June 2016 Contents Executive Summary Project Goals and Objectives 9 Methodology 10 Demographics 12 Research Findings 17 Appendix Prepared by Russell
How s Life in Portugal?
 How s Life in Portugal? November 2017 Relative to other OECD countries, Portugal has a mixed performance across the different well-being dimensions. For example, it is in the bottom third of the OECD in
How s Life in Canada?
 How s Life in Canada? November 2017 Canada typically performs above the OECD average level across most of the different well-indicators shown below. It falls within the top tier of OECD countries on household
How s Life in Germany?
 How s Life in Germany? November 2017 Relative to other OECD countries, Germany performs well across most well-being dimensions. Household net adjusted disposable income is above the OECD average, but household
How s Life in France?
 How s Life in France? November 2017 Relative to other OECD countries, France s average performance across the different well-being dimensions is mixed. While household net adjusted disposable income stands
Statistics Update For County Cavan
 Social Inclusion Unit November 2013 Key Figures for Cavan Population 73,183 Population change 14.3% Statistics Update For County Cavan Census 2011 Shows How Cavan is Changing Population living in 70% rural
Italy s average level of current well-being: Comparative strengths and weaknesses
 How s Life in Italy? November 2017 Relative to other OECD countries, Italy s average performance across the different well-being dimensions is mixed. The employment rate, about 57% in 2016, was among the
Afrobarometer Briefing Paper No by Jerry Lavery. May 2012
 Afrobarometer Briefing Paper No. 102 PROTEST AND POLITICAL Afrobarometer PARTICIPATION Briefing IN SOUTH Paper AFRICA: TIME TRENDS AND CHARACTERISTICS OF PROTESTERS March 2012 by Jerry Lavery May 2012
How s Life in the Slovak Republic?
 How s Life in the Slovak Republic? November 2017 Relative to other OECD countries, the average performance of the Slovak Republic across the different well-being dimensions is very mixed. Material conditions,
CENSUS RESULTS NATIONAL HOUSEHOLD SURVEY
 2011 CENSUS RESULTS NATIONAL HOUSEHOLD SURVEY INTRODUCTION The inaugural National Household Survey (NHS) was a voluntary survey which replaced the mandatory long-form census questionnaire. The NHS was
In South Africa, progress in the built environment is usually measured in physical terms, such as the number of new houses built and the number of
 In South Africa, progress in the built environment is usually measured in physical terms, such as the number of new houses built and the number of households provided with clean water, sanitation and electricity
How s Life in Mexico?
 How s Life in Mexico? November 2017 Relative to other OECD countries, Mexico has a mixed performance across the different well-being dimensions. At 61% in 2016, Mexico s employment rate was below the OECD
How s Life in Switzerland?
 How s Life in Switzerland? November 2017 On average, Switzerland performs well across the OECD s headline well-being indicators relative to other OECD countries. Average household net adjusted disposable
How s Life in Hungary?
 How s Life in Hungary? November 2017 Relative to other OECD countries, Hungary has a mixed performance across the different well-being dimensions. It has one of the lowest levels of household net adjusted
Safety first? Security, policing and justice in Tanzania. 1. Introduction
 Sauti za Wananchi Brief No. 42 July, 2017 1. Introduction Safety first? Security, policing and justice in Tanzania It is often said that the first responsibility of government is to keep people safe. The
How s Life in Estonia?
 How s Life in Estonia? November 2017 Relative to other OECD countries, Estonia s average performance across the different well-being dimensions is mixed. While it falls in the bottom tier of OECD countries
Edmonton Police Service 2011 Citizen Survey
 Edmonton Police Service 2011 Citizen Survey May 2012 2012 Edmonton Police Service First Published 2012 Edmonton Police Service 9620 103A Avenue Edmonton, Alberta T5H 0H7 CANADA Phone (780) 421-3333 Fax
Did you sleep here last night? The impact of the household definition in sample surveys: a Tanzanian case study.
 Did you sleep here last night? The impact of the household definition in sample surveys: a Tanzanian case study. Tiziana Leone, LSE Ernestina Coast, LSE Sara Randall, UCL Abstract Household sample surveys
BAROMETER OF PUBLIC OPINION FOR THE CANARY ISLANDS 2010 (2nd wave) Executive Report
 Executive Report") BAROMETER OF PUBLIC OPINION FOR THE CANARY ISLANDS 2010 (2nd wave) Executive Report BAROMETER OF PUBLIC OPINION FOR THE CANARY ISLANDS. 2 nd WAVE 2010 The purpose of the Social and Economic Council of
BAROMETER OF PUBLIC OPINION FOR THE CANARY ISLANDS 2010 (2nd wave) Executive Report BAROMETER OF PUBLIC OPINION FOR THE CANARY ISLANDS. 2 nd WAVE 2010 The purpose of the Social and Economic Council of
The Sudan Consortium African and International Civil Society Action for Sudan. Sudan Public Opinion Poll Khartoum State
 The Sudan Consortium African and International Civil Society Action for Sudan Sudan Public Opinion Poll Khartoum State April 2015 1 Table of Contents 1. Introduction... 3 1.1 Background... 3 1.2 Sample
InGRID2 Expert Workshop Integration of Migrants and Refugees in Household Panel Surveys
 InGRID2 Expert Workshop Integration of Migrants and Refugees in Household Panel Surveys Methodological Challenges and first results of the IAB-BAMF-SOEP Sample of Refugees in Germany Maria Metzing & Jürgen
How s Life in Norway?
 How s Life in Norway? November 2017 Relative to other OECD countries, Norway performs very well across the OECD s different well-being indicators and dimensions. Job strain and long-term unemployment are
MALAYSIAN PUBLIC PERSPECTIVES ON THE ROLE OF THE MEDIA IN REPORTING CORRUPTION 2009
 MALAYSIAN PUBLIC PERSPECTIVES ON THE ROLE OF THE MEDIA IN REPORTING CORRUPTION 2009 EXECUTIVE SUMMARY The incidence of corruption and the extent to which it afflicts society is an indicator of governance
How s Life in Sweden?
 How s Life in Sweden? November 2017 On average, Sweden performs very well across the different well-being dimensions relative to other OECD countries. In 2016, the employment rate was one of the highest
2001 Visitor Survey. December 2001 (November 30 December 13, 2001) Cincinnatus Minneapolis, Minnesota
 Cincinnatus Minneapolis, Minnesota") December 2001 (November 30 December 13, 2001) Cincinnatus Minneapolis, Minnesota 612-331-9007 MINNEAPOLIS INSTITUTE OF ARTS Table of Contents MAJOR FINDINGS... 1 HOW THIS RESEARCH WAS CONDUCTED... 8 VISITOR
December 2001 (November 30 December 13, 2001) Cincinnatus Minneapolis, Minnesota 612-331-9007 MINNEAPOLIS INSTITUTE OF ARTS Table of Contents MAJOR FINDINGS... 1 HOW THIS RESEARCH WAS CONDUCTED... 8 VISITOR
Introduction to data on ethnicity
 Introduction to data on ethnicity Deborah Wiltshire, UK Data Service Alita Nandi, Institute for Social and Economic Research 19 November 2015 Can you hear us?? 1 Can you hear us? If Not: Check your volume,
Motivations and Barriers: Exploring Voting Behaviour in British Columbia
 Motivations and Barriers: Exploring Voting Behaviour in British Columbia January 2010 BC STATS Page i Revised April 21st, 2010 Executive Summary Building on the Post-Election Voter/Non-Voter Satisfaction
HOUSEHOLD SURVEY FOR THE AFRICAN MIGRANT PROJECT: KENYA. Manual for Interviewers and Supervisors. October 2009
 0 HOUSEHOLD SURVEY FOR THE AFRICAN MIGRANT PROJECT: KENYA Manual for Interviewers and Supervisors October 2009 1 1. BACKGROUND AND OBJECTIVES This is a field work guide for the household survey. The goal
QUALITY OF LIFE IN TALLINN AND IN THE CAPITALS OF OTHER EUROPEAN UNION MEMBER STATES
 QUALITY OF LIFE IN TALLINN AND IN THE CAPITALS OF OTHER EUROPEAN UNION MEMBER STATES Marika Kivilaid, Mihkel Servinski Statistics Estonia The article gives an overview of the results of the perception
LOUISVILLE METRO POLICE DEPARTMENT
 LOUISVILLE METRO POLICE DEPARTMENT CITIZENS ATTITUDE SURVEY Deborah G. Keeling, Ph.D. Kristin M. Swartz, Ph.D. Department of Justice Administration University of Louisville April 2014 INTRODUCTION It is
Survey of US Voters Issues and Attitudes June 2014
 Survey of US Voters Issues and Attitudes June 2014 Methodology Three surveys of U.S. voters conducted in late 2013 Two online surveys of voters, respondents reached using recruit-only online panel of adults
Thoko Sipungu 7/1/2016 A BRIEF REVIEW OF THE PERFORMANCE OF THE EASTERN CAPE IN TERMS OF THE STATISTICS SOUTH AFRICA COMMUNITY SURVEY 2016
 1 7/1/2016 A BRIEF REVIEW OF THE PERFORMANCE OF THE EASTERN CAPE IN TERMS OF THE STATISTICS SOUTH AFRICA COMMUNITY SURVEY 2016 Thoko Sipungu MONITORING AND ADVOCACY PROGRAMME PUBLIC SERVICE ACCOUNTABILITY
Population and Dwelling Counts
 Release 1 Population and Dwelling Counts Population Counts Quick Facts In 2016, Conception Bay South had a population of 26,199, representing a percentage change of 5.4% from 2011. This compares to the
How s Life in Turkey?
 How s Life in Turkey? November 2017 Relative to other OECD countries, Turkey has a mixed performance across the different well-being dimensions. At 51% in 2016, the employment rate in Turkey is the lowest
How s Life in the Netherlands?
 How s Life in the Netherlands? November 2017 In general, the Netherlands performs well across the OECD s headline well-being indicators relative to the other OECD countries. Household net wealth was about
For whom the city? Housing and locational preferences in New Zealand
 Chapter 2 For whom the city? Housing and locational preferences in New Zealand Nick Preval, Ralph Chapman & Philippa Howden-Chapman New Zealand was once famously described as the quarter-acre pavlova paradise,
How s Life in Greece?
 How s Life in Greece? November 2017 Relative to other OECD countries, Greece has a mixed performance across the different well-being dimensions. Material conditions in Greece are generally below the OECD
Japan s average level of current well-being: Comparative strengths and weaknesses
 How s Life in Japan? November 2017 Relative to other OECD countries, Japan s average performance across the different well-being dimensions is mixed. At 74%, the employment rate is well above the OECD
THE WORKMEN S CIRCLE SURVEY OF AMERICAN JEWS. Jews, Economic Justice & the Vote in Steven M. Cohen and Samuel Abrams
 THE WORKMEN S CIRCLE SURVEY OF AMERICAN JEWS Jews, Economic Justice & the Vote in 2012 Steven M. Cohen and Samuel Abrams 1/4/2013 2 Overview Economic justice concerns were the critical consideration dividing
THE STATE OF TRANSPORT OPINION POLL SOUTH AFRICA: A FOUR-YEAR REVIEW ( )
") THE STATE OF TRANSPORT OPINION POLL SOUTH AFRICA: A FOUR-YEAR REVIEW (2012-2015) G Heyns and R Luke* University of Johannesburg, PO Box 524, Johannesburg, 2006 Tel: 011 5594952; Email: gjheyns@uj.ac.za
THE STATE OF TRANSPORT OPINION POLL SOUTH AFRICA: A FOUR-YEAR REVIEW (2012-2015) G Heyns and R Luke* University of Johannesburg, PO Box 524, Johannesburg, 2006 Tel: 011 5594952; Email: gjheyns@uj.ac.za
The Informal Economy: Statistical Data and Research Findings. Country case study: South Africa
 The Informal Economy: Statistical Data and Research Findings Country case study: South Africa Contents 1. Introduction 2. The Informal Economy, National Economy, and Gender 2.1 Description of data sources
Release of 2006 Census results Labour Force, Education, Place of Work and Mode of Transportation
 Backgrounder Release of 2006 Census results Labour Force, Education, Place of Work and Mode of Transportation On March 4, 2008 Statistics Canada released further results from the 2006 census focusing on
How s Life in the Czech Republic?
 How s Life in the Czech Republic? November 2017 Relative to other OECD countries, the Czech Republic has mixed outcomes across the different well-being dimensions. Average earnings are in the bottom tier
Future Jersey
 Future Jersey 2017-2037 Comments by Sir Mark Boleat on States of Jersey Consultation Document, August 2017 6 August 2017 Contact: mark.boleat@btinternet.com, 07803 377343 Summary The consultation paper