Informal entrepreneurship and Gauteng
|
|
|
- Rosanna Ramsey
- 5 years ago
- Views:
Transcription
 Gauteng City-Region Observatory (GCRO) sally.peberdy@gcro.")
1 Informal entrepreneurship and Gauteng ELLA Summit on Informality and Inclusive Growth Sally Peberdy (PhD) Gauteng City-Region Observatory (GCRO)

2 Overview of QoL 2015
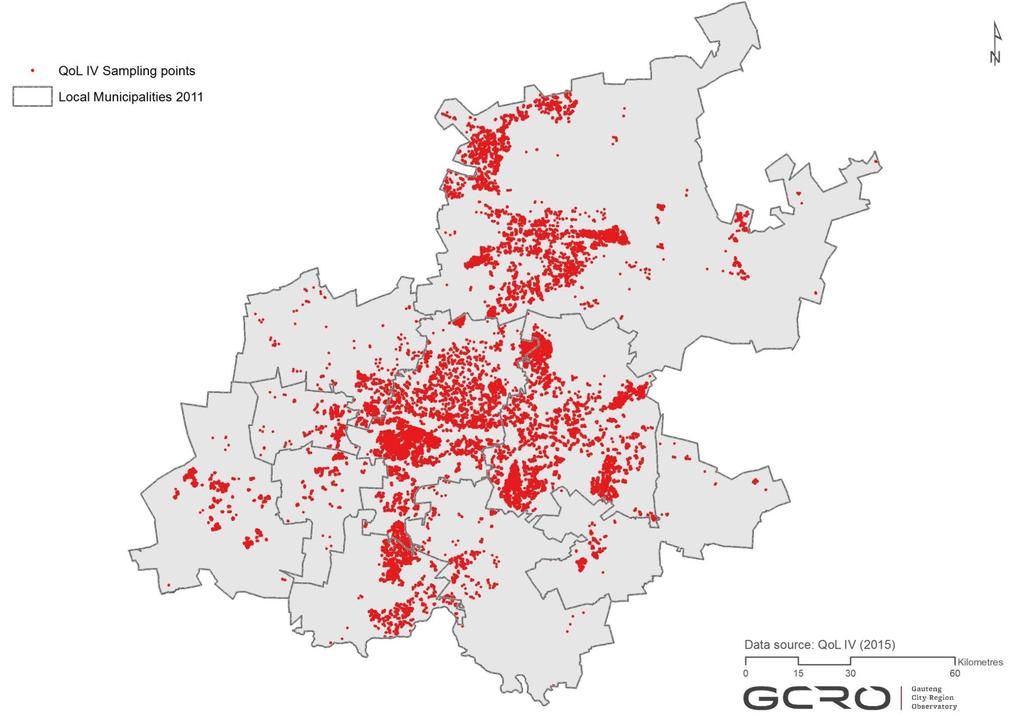
3 Overview of QoL 2015 Overview This is the 4 th Quality of Life Survey conducted by GCRO 2009: respondents in Gauteng / total of across wider GCR 2011: : : In addition to GCRO funds, the three metropolitan municipalities and the Gauteng Department of Health each contributed significant finances to the 2015 survey, allowing us to realize the largest sample to date, broadly representative to ward level across Gauteng
4
5 Overview of QoL 2015 What s in the 2015 survey? About 60% of the questionnaire remains the same as in previous years. Good coverage of: 1. Demographic variables (education, age, income) 2. Dwelling and service access 3. Satisfaction with services 4. Satisfaction with government 5. Migration 6. Headspace, social attitudes 7. Transport 8. Poverty, wealth, debt, food insecurity, etc. Enhanced sections/questions on: 1. Health 2. Economy and employment, with specific focus on township economy 3. Smart city 4. Neighbourhood (e.g. where would respondent like to live) 5. Gauteng DNA questions about identity, affiliations, breaking rules, etc.

6 Economic conditions C.Culwick
7 Economic conditions Inequality: gini coefficient 2009, 2011, 2013,
8 Economic conditions Inequality: Income distribution % R0 - R400 R401 - R800 R801 - R1 600 R R3 200 R R6 400 R R R R R R R R R R R R R R R R R R R R
9 Economic conditions Employment from Labour Force Survey Employed Unemployment rate % Q Q Q Q Q Q Q Q Q Q Q Q Q Q Q Q Q Q Q Q Q Q Q Q Q Q Q Q Q Q Q Q
10 Economic conditions What brings income into your household? % Formal emp. Informal emp. Gvt. Grants/pens Savings/retur ns Family/remit Rental Friends
11 Entrepreneurship Are you currently the owner of a business: % yes 100% 90% 80% 70% 60% 50% 40% 30% 20% 10% 0% currently the owner of a business currently the owner of a business
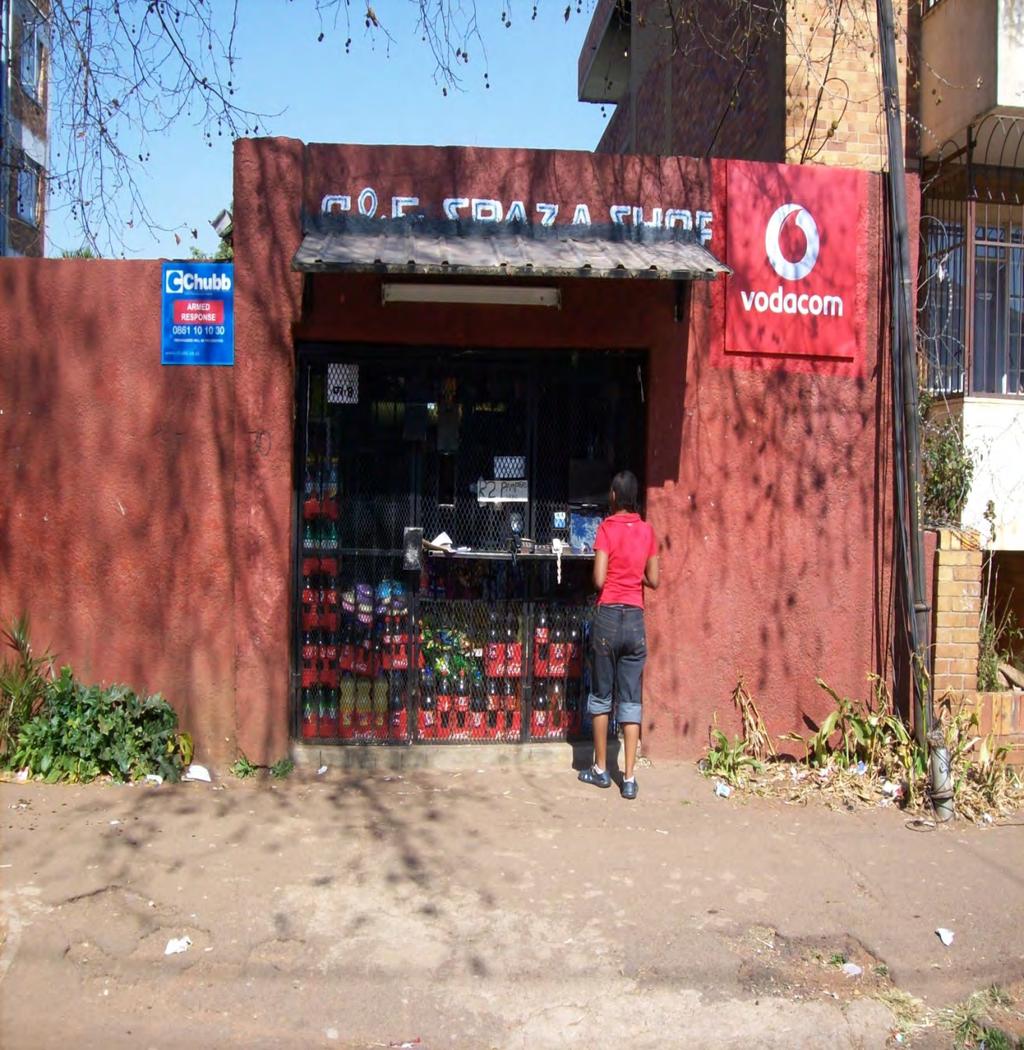
12 Informal Entrepreneurship and Gauteng
13 Entrepreneurship Have you ever started a business / failure rates 100% 90% 80% 70% 64 60% 50% 40% Have tried to start a business 30% Business failed 20% 10% 0%
14 Own a business (% all respondents) Business is in the informal sector (% of business owners) Primary source of start-up capital: Personal savings (1st named) (% business owners) Primary source of start-up capital: Bank loan (% business owners) Number of employees: Sole employee (% business owners) Number of employees: 1-5 employees (% business owners) Sex Male Female Race Black African Coloured Indian White Migrant status Gauteng born Internal migrant International migrant TOTAL GAUTENG
15 Primary source of start-up capital Source: QoL 2015) Personal savings Bank loan Loan from informal financial institution s Profit from other business Loan from a microfinance institution Usurers/ mashonis a Loan from relatives Loan from nonrelatives Business credit Loan from governme nt agency Other source Informal sector Formal sector
16 Type of business (Using Standard Industrial Classification of all Economic Activities (SIC) 7 th ed., 2012 : Formal and informal sector - (%) Formal sector Informal sector Wholesale & retail trade; repair of motor vehicles and motorcycles Construction 11 5 Accommodation and food service activities 9 13 Professional, scientific and technical activities 8 2 Transportation & storage 7 4 Manufacturing 6 7 Education 5 3 Other service activities 5 9 Information & communication 4 1 Administrative and support activities 3 2 Real estate activities 3 1 Arts, entertainment & recreation 3 1 Human health activities 2 1 Agriculture, forestry and fishing 1 2 Financial and insurance activities 1 1> Mining and quarrying 1> 1> Water supply; sewerage, waste management and remediation activities 1> 1> Not specified 6 3
17 Economic conditions Informal vs formal business: age % Informal sector Formal sector 5 0
18 Economic conditions Primary constraints on business: formal and informal (%) Informal sector Formal sector
19 Access to the internet? Do you access the internet (e.g. a web site, , Facebook, WhatsApp, WeChat or other app)? No Yes, nearly every day Yes, but not often Household assets: Personal computer, laptop or tablet Informal sector Formal sector
20 From where do you access the internet? (multiple response question) On my cell phone/ tablet Home Work Anywhere on my laptop Wi-fi hotspot/ free or public Wi-fi Internet café Taxi Wi-fi University, college or school Library Informal sector Formal sector
21 Economic conditions Support from government departments for businesses 80% 70% 60% 50% 72 40% 35% % 30% 20% 10% 0% No 28 Yes 30% 25% 20% 15% 10% 16 Do you know of government service to support small businesses? 5% 0% Have you ever approached a government department that supports Has any government department approached you to assist Satisfied with support provided
22 Economic conditions Have you ever approached a govt. department or agency that supports SMMEs?: 2013; No Yes % 10% 20% 30% 40% 50% 60% 70% 80% 90% 100%
23 Economic conditions Access to services within easy walking distance Supermarkets 70% Hardware / building supplies Transport 60% 50% 40% 30% 20% 10% 0% Liquor store Bars and clubs Banks Restaurants Internet services Business services
24 GCRO surveys of informal sector entrepreneurs (2014) GCRO survey of 1,567 cross border and South African migrant informal sector entrepreneurs in Gauteng (2014). GCRO survey of 1,270 informal sector cross border traders in Gauteng (people from other countries who travel to South Africa to buy goods for their businesses in their home countries some also bring goods to sell in South Africa). There is more relevant data available from each of the surveys just ask and visit the GCRO website: and

25 43
26 Sector GCRO Informal sector entrepreneurs survey Not all informal sector entrepreneurs own spaza shops or operate in the retail sector Sectors of enterprise show different levels of start-up capital Cross border migrant South African migrant Sectors of enterprise show different levels of profit/income Services sector used lower levels of startup capital and showed lower levels of profit Retail sector used higher levels of start-up capital and showed higher levels of profit
27 South African and cross border migrant entrepreneurs Start-up capital (GCRO Informal sector entrepreneurs survey 2014) Amount of start-up capital used South African Cross border migrant Less than R2, R2,501 R5, R5,001 R10, R10,001-R20, over R20, Sources of start-up capital (multiple response question) South African Cross border migrant Personal savings Loan from relatives Loan from non-relatives 7 8 Loan from informal financial institutions 10 4 (stokvels) Bank loan 4 1 Usurers/mashonisa 3 3 Business credit (goods on terms) 0 1 Start-up capital: Amount needed affected by type of business (& vice versa) services used least Amount used affected by sources available South Africans more likely to start businesses with less than R5,000 - R10,000 (82% started with R10,000 or less vs.68% of cross border migrants) Cross border migrants more likely to use R20,001 or more Personal savings are the major source for all entrepreneurs South Africans are more likely to get loans from formal & informal financial institutions (interest rates) Cross border migrants are more likely to borrow from relatives & non-relatives (social capital)
28 Relationships with formal sector (%) GCRO Informal sector entrepreneurs survey 2014 (multiple mention question) Cross border migrants are more likely to use wholesalers and factories for supplies South African Cross border migrant South Africans are more likely to use supermarkets and small shops & retailers for supplies likely to be more expensive The same proportion of South Africans & cross border migrants (38%) bought supplies for their businesses in bulk with other business owners The formal sector is the main source of goods for all nationalities HOWEVER competition from large stores was a problem experienced: South African Cross border migrant Often Sometimes Never 24 32
29 Incomes (GCRO Informal entrepreneurs survey 2014 & Census 2011) Average monthly income after business expenses (%) South African informal sector (2014) Cross border migrant informal sector (2014) Census 2011 black African individual monthly income R1-3, South Africans more likely to make profits of less than R3,201pm Cross border migrants more likely to make profits of over R6,401pm Incomes compare favourably with black African incomes in Gauteng (Census data is for people with an income) R3, R6,400 R6, R12,800 R12, R25,600 R25,
30 Employment (GCRO Informal sector entrepreneurs survey 2014) Employment of others in business (including family members) 37% of cross border migrants (43% in Johannesburg) 32% of South Africans (36% in Johannesburg) South African (N=202) Cross border migrant (N=343) Family members Home province/ country (not family members) South Africans (not from home province if South African) Other countries
31 Employment (GCRO Informal sector entrepreneurs survey 2014) Ratio of South African employers to employees 1:3.5 Ratio of South African employers to non-family employees 1:2.7 Ratio of South African interviewees to employees 1:1.1 Ratio of South African interviewees to non-family employees 1:0.86 Ratio of cross border migrant employers to employees 1:5.5 Ratio of cross border migrant employers to nonfamily employees 1:4.3 Ratio of cross border migrant interviewees to employees 1: 2.0 Ratio of cross border migrant interviewees to nonfamily employees 1:1.6
32
33 Business related problems (GCRO Informal sector entrepreneurs survey 2014) Too many competitors around here Competition from supermarkets/large stores Suppliers charge too much Often Sometimes Never South African Cross border migrant South African Cross border migrant South African Cross border migrant Lack of access to credit South African Cross border migrant Lack of training in accounting, marketing, other business skills South African Cross border migrant
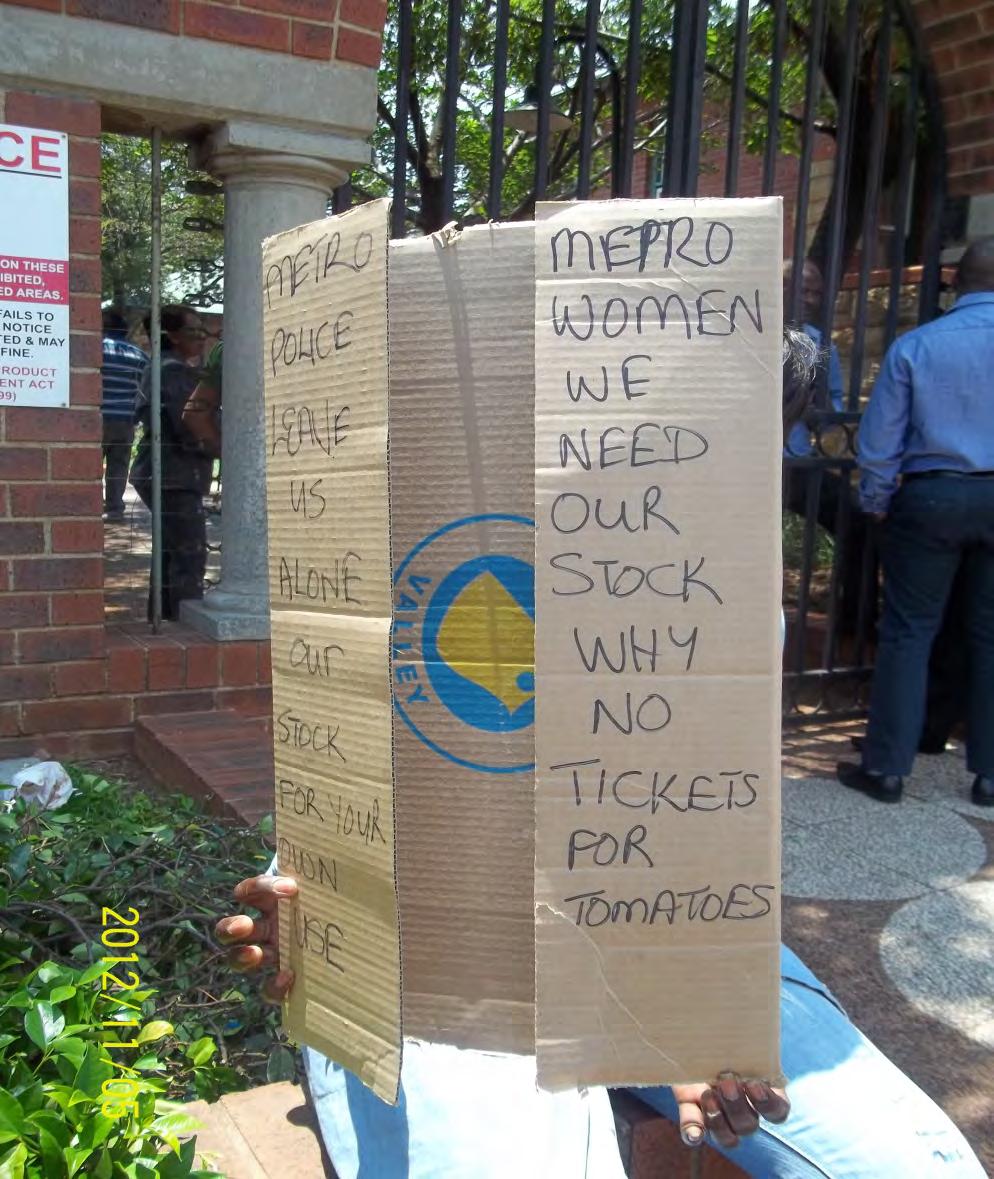
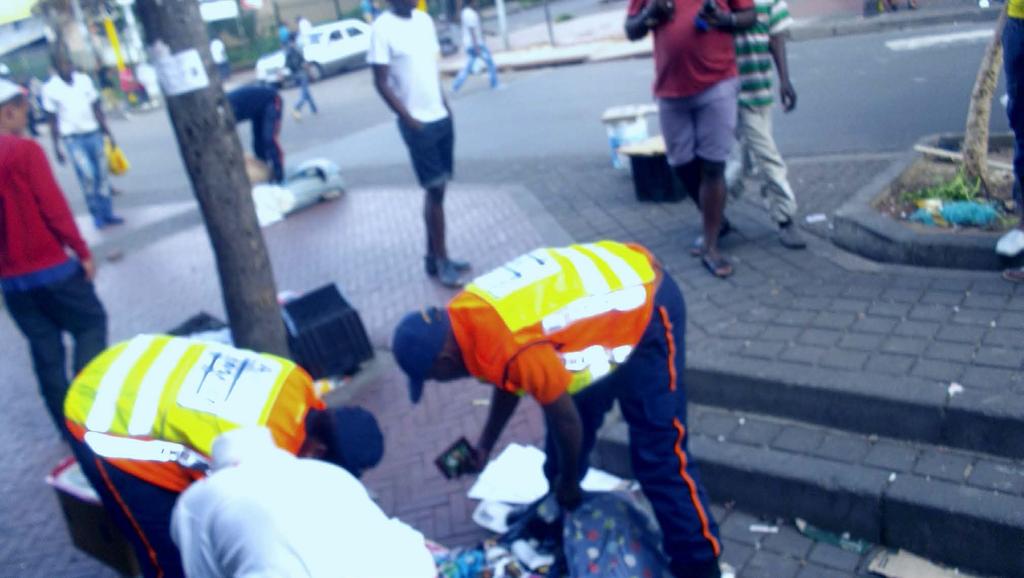
34 State related problems (GCRO Informal sector entrepreneurs survey 2014) Often Sometimes Never Harassment/Demands for bribes by police South African Cross border migrant Confiscation of goods South African Cross border migrant Arrest/detention of yourself/employees South African Cross border migrant Physical attacks/ assaults by police South African Cross border migrant
35 People related problems (GCRO Informal sector entrepreneurs survey 2014) Conflict with other entrepreneurs Often Sometimes Never South African Cross border migrant Crime/theft South African Cross border migrant Verbal insults against your business Physical attacks/ assaults by South Africans South African Cross border migrant South African Cross border migrant
36 Symbiosis? (GCRO Informal sector entrepreneurs survey 2014) I get goods for my business from immigrant business people/businesses Agree Disagree I have learned from immigrant businesses I rent business premises to an immigrant business I have good relationships with the immigrant business people near me South Africans cannot compete with immigrant businesses Immigrant business people work harder than South Africans South African and immigrant business people can work alongside each other Agree Disagree Don't know
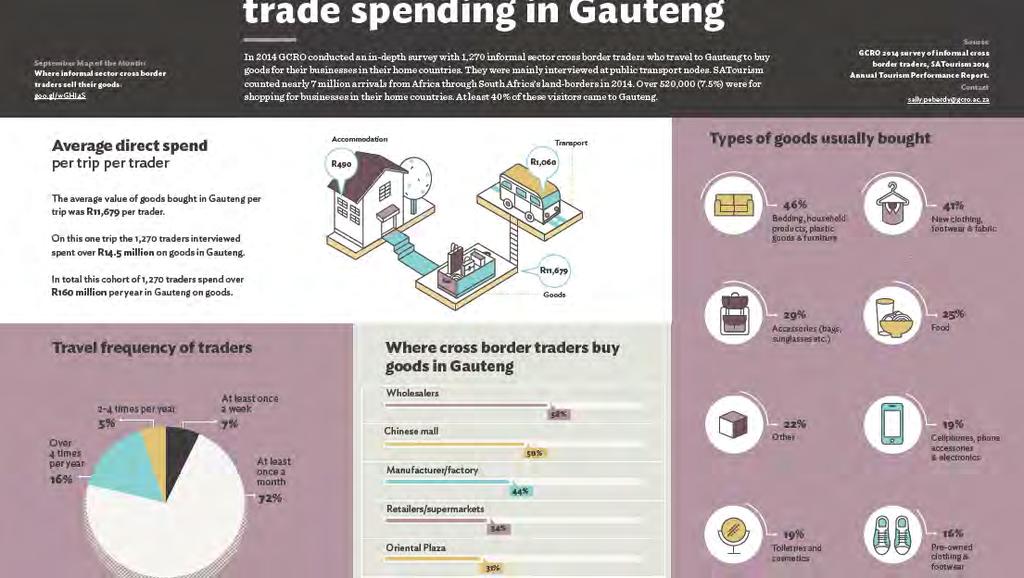
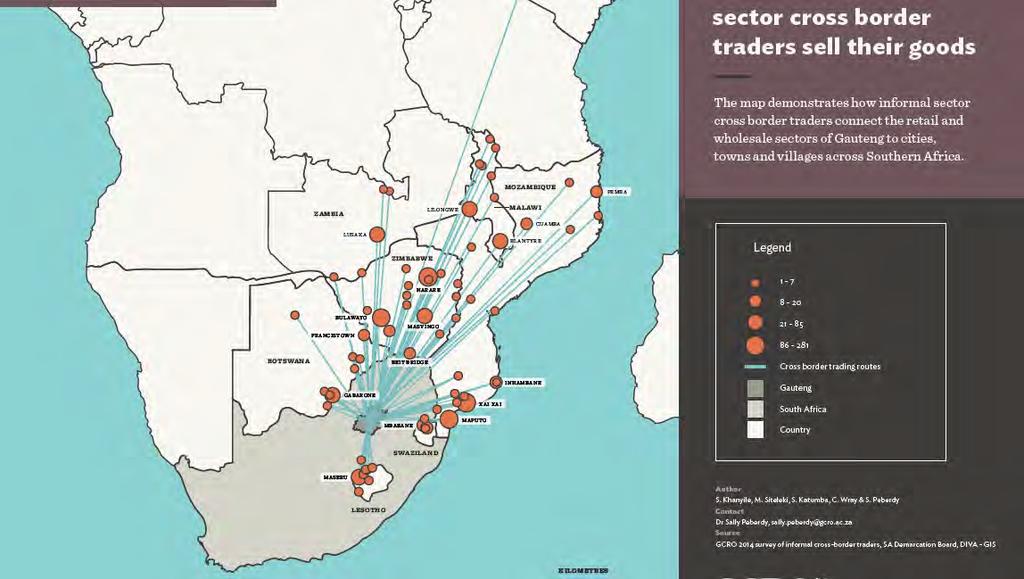
37 Informal sector/small scale cross border trade and Gauteng Informal sector or small scale cross border traders are people who: - Travel to another country to buy goods for their business in their home country - Travel to another country to sell goods and buy goods for their business in their home country - Travel to two or more countries buying and selling as they go - Travel by land and air and to a lesser extent and only Mozambicans by train In 2014 SATourism counted nearly 7 million land border arrivals from Africa Over 520,000 arrivals (7.5%) were for shopping for business At least 40% of these cross border traders came to Gauteng SATourism estimates direct spend of people traveling through land borders is R17,000 per visit GCRO survey found average direct spend R11,679 per trader 2014 direct spend of cross border traders using average spend in GCRO survey = over R2.4 billion 2014 direct spend of cross border traders using average spend in SATour survey = over R3.5 billion
38
39

40 Thank You Dr Sally Peberdy GCRO ADDRESS 4th Floor University Corner 11 Jorissen Street (Cnr Jorissen and Jan Smuts) Braamfontein Johannesburg Gauteng South Africa POSTAL ADDRESS GCRO Private Bag 3 Wits 2050
GCRO DATA BRIEF: NO. 5 Gauteng: a province of migrants
 DATA BRIEF GCRO DATA BRIEF: NO. 5 Produced by the Gauteng City-Region Observatory (GCRO) A partnership of the University of Johannesburg (UJ), University of the Witwatersrand, Johannesburg (Wits), the
Labour Force Structure. Employment. Unemployment. Outside Labour Force Population and Economic Dependency Ratio
 210 Statistical Yearbook of Abu Dhabi 2016 Labour Force. 5 Labour Force Structure Employment Unemployment Outside Labour Force Population and Economic Dependency Ratio Statistical Yearbook of Abu Dhabi
Population and Dwelling Counts
 Release 1 Population and Dwelling Counts Population Counts Quick Facts In 2016, Conception Bay South had a population of 26,199, representing a percentage change of 5.4% from 2011. This compares to the
The Informal Economy: Statistical Data and Research Findings. Country case study: South Africa
 The Informal Economy: Statistical Data and Research Findings Country case study: South Africa Contents 1. Introduction 2. The Informal Economy, National Economy, and Gender 2.1 Description of data sources
CENSUS RESULTS NATIONAL HOUSEHOLD SURVEY
 2011 CENSUS RESULTS NATIONAL HOUSEHOLD SURVEY INTRODUCTION The inaugural National Household Survey (NHS) was a voluntary survey which replaced the mandatory long-form census questionnaire. The NHS was
The Informal Economy of Township Spaza Shops
 The Informal Economy of Township Spaza Shops The informal economy of township spaza shops Introduction > The Sustainable Livelihoods Foundation s Formalising Informal Micro- Enterprises (FIME) project
5. Neighbourhood GAUTENG CITY-REGION OBSERVATORY QUALITY OF LIFE SURVEY 2015 LANDSCAPES IN TRANSITION
 . Neighbourhood Dr Richard Ballard, richard.ballard@gcro.ac.za, 717 7197 Samy Katumba, samy.katumba@gcro.ac.za, 717 7199 Dr Aidan Mosselson, aidan.mosselson@gcro.ac.za, 717 7696 Mncedisi Siteleki, mncendisi.siteleki@gcro.ac.za,
QUALITY OF LIFE SURVEY IV:
 GCRO DATA BRIEF # NO.7 QUALITY OF LIFE SURVEY IV: CRIME AND PERCEPTIONS OF SAFETY IN GAUTENG SEPTEMBER 2017 Authors: Mncedisi Siteleki, Richard Ballard, Aidan Mosselson A PARTNERSHIP OF QUALITY OF LIFE
Public consultation on the EU s labour migration policies and the EU Blue Card
 Case Id: a330ed35-9a71-4fbb-aafa-8330edd15c0e Date: 08/07/2015 15:21:57 Public consultation on the EU s labour migration policies and the EU Blue Card Fields marked with * are mandatory. 1 Your Contact
TIEDI Labour Force Update September 2012
 The Toronto Immigrant Employment Data Initiative (TIEDI) s Labour Force Update aims to provide upto-date labour market data on immigrants. This monthly report relies on data from the Labour Force Survey
L 216/10 Official Journal of the European Union
 L 216/10 Official Journal of the European Union 21.8.2007 COMMISSION REGULATION (EC) No 973/2007 of 20 August 2007 amending certain EC Regulations on specific statistical domains implementing the statistical
Setting the Scene: The South African Informal Sector. Caroline Skinner Urban Informality and Migrant Entrepreneurship
 Setting the Scene: The South African Informal Sector Caroline Skinner Urban Informality and Migrant Entrepreneurship International Statistics South African Context Labour Market Policy Context Size and
Alberta Immigrant Highlights. Labour Force Statistics. Highest unemployment rate for landed immigrants 9.8% New immigrants
 2016 Labour Force Profiles in the Labour Force Immigrant Highlights Population Statistics Labour Force Statistics Third highest percentage of landed immigrants in the working age population 1. 34. ON 2.
COMMUNITY PROFILE TOWNSHIP OF LANGLEY. Township of Langley Immigrant Demographics I Page 1
 COMMUNITY PROFILE TOWNSHIP OF LANGLEY Township of Langley Demographics I Page 1 TOWNSHIP OF LANGLEY IMMIGRANT DEMOGRAPHICS Your quick and easy look at facts and figures around immigration. Newcomers are
TIEDI Labour Force Update December 2012
 The Toronto Immigrant Employment Data Initiative (TIEDI) s Labour Force Update aims to provide upto-date labour market data on immigrants. This monthly report relies on data from the Labour Force Survey
Introduction... i. Population Family Structure Education Mobility Status... 7
 Table of Contents Introduction... i Population... 2 Family Structure... 5 Education... 6 Mobility Status... 7 ward two Ethnicity, Language, Immigrants and Visible Minority... 9 Labour Force Characteristics...13
Release of 2006 Census results Labour Force, Education, Place of Work and Mode of Transportation
 Backgrounder Release of 2006 Census results Labour Force, Education, Place of Work and Mode of Transportation On March 4, 2008 Statistics Canada released further results from the 2006 census focusing on
Immigrants strengthen Colorado s economy, generating $42 billion of activity in 2011
 Immigrants strengthen Colorado s economy, generating $42 billion of activity in 2011 February 14, 2013 By Christopher Stiffler Economist Executive Summary The foreign-born population is a growing presence
MIGRANTS IN THE CITY OF JOHANNESBURG A Report for the City of Johannesburg
 MIGRANTS IN THE CITY OF JOHANNESBURG A Report for the City of Johannesburg by Dr Sally Peberdy Professor Jonathan Crush and Ntombikayise Msibi Southern African Migration Project PostNet Box 321a Private
TIEDI Labour Force Update January 2013
 The Toronto Immigrant Employment Data Initiative (TIEDI) s Labour Force Update aims to provide upto-date labour market data on immigrants. This monthly report relies on data from the Labour Force Survey
2011 CENSUS & NATIONAL HOUSEHOLD SURVEY CITY OF BRAMPTON - WARD 1 PROFILE
 CENSUS & NATIONAL HOUSEHOLD SURVEY CITY OF BRAMPTON WARD 1 PROFILE WARD HIGHLIGHTS Population 53,130 Population 51.0% Females Population by Age Group 9% 20% 014 10.14% of total population 36 Median Age
2011 CENSUS & NATIONAL HOUSEHOLD SURVEY CITY OF BRAMPTON - WARD 3 PROFILE
 2011 CENSUS & NATIONAL HOUSEHOLD SURVEY CITY OF BRAMPTON WARD 3 PROFILE WARD HIGHLIGHTS Population 47,500 2011 Population 50.7% Females 2011 Population by Age Group 13% 18% 014 9.07% of total population
2011 CENSUS & NATIONAL HOUSEHOLD SURVEY CITY OF BRAMPTON - WARD 4 PROFILE
 2011 CENSUS & NATIONAL HOUSEHOLD SURVEY CITY OF BRAMPTON WARD 4 PROFILE WARD HIGHLIGHTS Population 9.51% of total population 49,850 2011 Population 34 Median Age 50.5% Females 49.5% Males 2011 Population
2011 CENSUS & NATIONAL HOUSEHOLD SURVEY CITY OF BRAMPTON - WARD 10 PROFILE
 2011 CENSUS & NATIONAL HOUSEHOLD SURVEY CITY OF BRAMPTON WARD 10 PROFILE WARD HIGHLIGHTS Population 10.72% of total population 56,185 2011 Population 33 Median Age 50.1% Females 49.9% Males 2011 Population
Dobwalls and Trewidland Neighbourhood Development Plan: section 3. Evidence Base document - fourth draft September 2018
 Dobwalls and Trewidland Neighbourhood Development Plan: section 3 Economy and Jobs Evidence Base document - fourth draft September 2018 Contents Introduction Purpose of this Evidence Base report Themes
COUNTRY FACTSHEET: Finland 2015
 COUNTRY FACTSHEET: Finland 2015 EUROPEAN MIGRATION NETWORK 1. Introduction This EMN Country Factsheet provides a factual overview of the main policy developments in migration and international protection
SPECIAL RELEASE. EMPLOYMENT SITUATION IN NATIONAL CAPITAL REGION January 2012 Final Results
 Republic of the Philippines NATIONAL STATISTICS OFFICE National Capital Region Number: 2013-07 SPECIAL RELEASE EMPLOYMENT SITUATION IN NATIONAL CAPITAL REGION January 2012 Final Results The Labor Force
TIEDI Labour Force Update May 2011
 The Toronto Immigrant Employment Data Initiative (TIEDI) s Labour Force Update aims to provide upto-date labour market data on immigrants. This monthly report relies on data from the Labour Force Survey
Non Financial Census of Municipalities
 Non Financial Census of Municipalities Pali Lehohla Statistician-General Statistics South Africa Cape Town 22 October 2014 1 Outline of Presentation Oversight Role of the Portfolio Committee Using Stats
Syrian Refugee Unit Work Permit Progress Report January 2018
 Syrian Refugee Unit Work Permit Progress Report January 2018 Timeframe Report includes data gathered through January 31, 2018 Report compiled by Syrian Refugee Unit at the Ministry of Labour Date submitted
Introduction... i. Population Family Structure Education Mobility Status... 7
 ward ten Table of Contents Introduction... i Population... 2 Family Structure... 5 Education... 6 Mobility Status... 7 ward ten Ethnicity, Language, Immigrants and Visible Minority... 9 Labour Force Characteristics...13
Appendix A: Economic Development and Culture Trends in Toronto Data Analysis
 Appendix A: Economic Development and Culture Trends in Toronto Data Analysis Introduction The proposed lenses presented in the EDC Divisional Strategy Conversation Guide are based in part on a data review.
COMMUNITY PROFILE COQUITLAM. Coquitlam Immigrant Demographics I Page 1
 COMMUNITY PROFILE COQUITLAM Coquitlam Demographics I Page 1 COQUITLAM IMMIGRANT DEMOGRAPHICS Your quick and easy look at facts and figures around immigration. Newcomers are an important and growing part
o n e c i t y d i v e r s e p l a c e s
 City of Swan our Swan 2030 discussion paper our vibrant economy o n e c i t y d i v e r s e p l a c e s 2 our Swan 2030 our vibrant economy Contents 1. Background 4 2. Trends 5 3. Key Considerations 6
The Gender Wage Gap in Urban Areas of Bangladesh:
 The Gender Wage Gap in Urban Areas of Bangladesh: Using Blinder-Oaxaca Decomposition and Quantile Regression Approaches Muhammad Shahadat Hossain Siddiquee PhD Researcher, Global Development Institute
Introduction... i. Population Family Structure Education Mobility Status... 7
 Table of Contents Introduction... i Population... 2 Family Structure... 5 Education... 6 Mobility Status... 7 Ethnicity, Language, Immigrants and Visible Minority... 9 ward three Labour Force Characteristics...13
COMMUNITY PROFILE BURNABY
 COMMUNITY PROFILE BURNABY Burnaby Demographics I Page 1 BURNABY IMMIGRANT DEMOGRAPHICS Your quick and easy look at facts and figures around immigration. Newcomers are an important and growing part of your
Internal Migration to the Gauteng Province
 Internal Migration to the Gauteng Province DPRU Policy Brief Series Development Policy Research Unit University of Cape Town Upper Campus February 2005 ISBN 1-920055-06-1 Copyright University of Cape Town
Ward 16 River. City of Ottawa Ward Profiles 2011 Census and National Household Survey POPULATION* 45, ,390. Total City of Ottawa Population
 POPULATION* Total Ward Population 45,795 +2.0% 2006-2011 Total City of Ottawa Population 883,390 +8.8% 2006-2011 Population by Age Group Ward 16 City of Ottawa 2006 2011 06-11 2006 2011 06-11 Age Group
1. Where is your company located? Please check all that apply.
 Appendix F: Surveys of employers 1. Where is your company located? Please check all that apply. Vancouver British Columbia (outside of Vancouver) Alberta Yukon Northwest Territories Nunavut Saskatchewan
Hessisches Statistisches Landesamt. Hesse in figures
 Hessisches Statistisches Landesamt Hesse in figures Edition 2013 Population and Area Population (31.12.) 2011 2012 TOTAL 5 993 771 6 016 481 100 Male 2 928 449 2 943 855 48.9 Female 3 065 322 3 072 626
West of England Local Enterprise Partnership Economic Overview. 1. Introduction
 West of England Local Enterprise Partnership Economic Overview 1. Introduction 1.1 This data report provides evidence for a number of key economic indicators in relation to social inclusion and diversity.
Leveraging local content policies for broader economic development
 Göran Hultin, CEO Caden Corporation and Vice- Chair, World Economic Forum s Global Agenda Council on Migration Local Content and Diasporas Side Event IDM 2013 : DIASPORA MINISTERIAL CONFERENCE International
BENCHMARKING REPORT - VANCOUVER
 BENCHMARKING REPORT - VANCOUVER I. INTRODUCTION We conducted an international benchmarking analysis for the members of the Consider Canada City Alliance Inc., consisting of 11 (C11) large Canadian cities
Syrian Refugee Unit Work Permit Progress ReportOctober2018
 Syrian Refugee Unit Work Permit Progress ReportOctober2018 Timeframe Report includes data gathered through Oct31, 2018 Report compiled by Syrian Refugee Unit at the Ministry of Labour Date submitted 7/11/2018
Syrian Refugee Unit Work Permit Progress Report December 2018
 Syrian Refugee Unit Work Permit Progress Report December 2018 Timeframe Report includes data gathered through Dec 31, 2018 Report compiled by Syrian Refugee Unit at the Ministry of Labour Date submitted
QUALITY OF LIFE SURVEY IV:
 GCRO DATA BRIEF # NO.8 QUALITY OF LIFE SURVEY IV: SOCIAL COHESION FEBRUARY 2018 Authors: Richard Ballard, Christian Hamann A PARTNERSHIP OF QUALITY OF LIFE IV: SOCIAL COHESION February 2018 ISBN: 978-0-6399114-6-5
Immigrant Employment by Field of Study. In Waterloo Region
 Immigrant Employment by Field of Study In Waterloo Region Table of Contents Executive Summary..........................................................1 Waterloo Region - Part 1 Immigrant Educational Attainment
Dimensions of rural urban migration
 CHAPTER-6 Dimensions of rural urban migration In the preceding chapter, trends in various streams of migration have been discussed. This chapter examines the various socio-economic and demographic aspects
The case for an inwork progression service
 The case for an inwork progression service 1 Contents 1. Introduction 2. Underemployment in the UK 3. Individual characteristics 4. Industry 5. Recommendations 2 Summary of findings Scale of underemployment:
Syrian Refugee Unit Work Permit Progress Report June 2018
 Syrian Refugee Unit Work Permit Progress Report June 2018 Timeframe Report includes data gathered through June 30, 2018 Report compiled by Syrian Refugee Unit at the Ministry of Labour Date submitted 8/7/2018
POPULATION STUDIES RESEARCH BRIEF ISSUE Number
 POPULATION STUDIES RESEARCH BRIEF ISSUE Number 2008021 School for Social and Policy Research 2008 Population Studies Group School for Social and Policy Research Charles Darwin University Northern Territory
Briefing Book- Labor Market Trends in Metro Boston
 Briefing Book- Labor Market Two other briefing books focus on the importance of formal education and ESOL courses to Boston s foreign-born residents. While there are a number of reasons why improving immigrant
Determinants of International Migration in Egypt: Results of the 2013 Egypt-HIMS
 Determinants of International Migration in Egypt: Results of the 2013 Egypt-HIMS Rawia El-Batrawy Egypt-HIMS Executive Manager, CAPMAS, Egypt Samir Farid MED-HIMS Chief Technical Advisor ECE Work Session
Introduction... i. Population Family Structure Education Mobility Status... 7
 Table of Contents Introduction... i Population... 2 Family Structure... 5 Education... 6 Mobility Status... 7 Ethnicity, Language, Immigrants and Visible Minority... 9 Labour Force Characteristics...13
Engenderment of Labour Force Surveys: Indian Experience. Prepared by. Dr. Swaraj Kumar Nath Director-General, Central Statistical Organisation INDIA
 GLOBAL FORUM ON GENDER STATISTICS ESA/STAT/AC.140/5.4 10-12 December 2007 English only Rome, Italy Engenderment of Labour Force Surveys: Indian Experience Prepared by Dr. Swaraj Kumar Nath Director-General,
Regina City Priority Population Study Study #1 - Aboriginal People. August 2011 EXECUTIVE SUMMARY
 Regina City Priority Population Study Study #1 - Aboriginal People August 2011 EXECUTIVE SUMMARY Executive Summary The City of Regina has commissioned four background studies to help inform the development
Social and Demographic Trends in Burnaby and Neighbouring Communities 1981 to 2006
 Social and Demographic Trends in and Neighbouring Communities 1981 to 2006 October 2009 Table of Contents October 2009 1 Introduction... 2 2 Population... 3 Population Growth... 3 Age Structure... 4 3
Nebraska s Foreign-Born and Hispanic/Latino Population
 January 2011 Nebraska s Foreign-Born and Hispanic/Latino Population Socio-Economic Trends, 2009 OLLAS Office of Latino/Latin American Studies (OLLAS) University of Nebraska - Omaha Off i c e o f La t i
Post-Secondary Education, Training and Labour September Profile of the New Brunswick Labour Force
 Post-Secondary Education, Training and Labour September 2018 Profile of the New Brunswick Labour Force Contents Population Trends... 2 Key Labour Force Statistics... 5 New Brunswick Overview... 5 Sub-Regional
How Employers Recruit Their Workers into Politics And Why Political Scientists Should Care
 How Employers Recruit Their Workers into Politics And Why Political Scientists Should Care Alexander Hertel-Fernandez Harvard University ahertel@fas.harvard.edu www.hertelfernandez.com Supplementary Materials
REVISITING THE YOUTH EMPLOYMENT CHALLENGE IN DEVELOPING COUNTRIES
 REVISITING THE YOUTH EMPLOYMENT CHALLENGE IN DEVELOPING COUNTRIES Expert meeting on national strategies and global responses for youth well-being Alexandre Kolev OECD Development Centre Paris, 17 October
MIGRATION INTO GAUTENG PROVINCE
 Development Policy Research Unit University of Cape Town Private Bag Rondebosch 7701 Southern African Migration Project Post Net Box 321a Private Bag X30500 Johannesburg 2041 MIGRATION INTO GAUTENG PROVINCE
An Integrated Analysis of Migration and Remittances: Modeling Migration as a Mechanism for Selection 1
 An Integrated Analysis of Migration and Remittances: Modeling Migration as a Mechanism for Selection 1 Filiz Garip Harvard University February, 2009 1 This research was supported by grants from the National
CHAPTER 4 ECONOMIC ACTIVITY OF CHILD AND YOUTH
 CHAPTER 4 ECONOMIC ACTIVITY OF CHILD AND YOUTH 4.1 DEFINITION OF CHILD AND YOUTH LABOUR Child labour is recognized as an issue to be eliminated in the world. Children s labour participation reduces their
The State of Working Wisconsin Laura Dresser Joel Rogers Julie Whittaker Center on Wisconsin Strategy
 The State of Working Wisconsin Laura Dresser Joel Rogers Julie Whittaker Center on Wisconsin Strategy The Center on Wisconsin Strategy Authors Laura Dresser Joel Rogers Julie Whittaker Acknowledgments
Characteristics of the Ethnographic Sample of First- and Second-Generation Latin American Immigrants in the New York to Philadelphia Urban Corridor
 Table 2.1 Characteristics of the Ethnographic Sample of First- and Second-Generation Latin American Immigrants in the New York to Philadelphia Urban Corridor Characteristic Females Males Total Region of
The Status of Women in Ventura and Santa Barbara Counties
 The Status of Women in Ventura and Santa Barbara Counties March 3, 2010 Foreword March, 2010 One hundred and fifty-three years ago, thousands of women garment workers marched to change their poverty level
The widening income dispersion in Hong Kong :
 Lingnan University Digital Commons @ Lingnan University Staff Publications Lingnan Staff Publication 3-14-2008 The widening income dispersion in Hong Kong : 1986-2006 Hon Kwong LUI Lingnan University,
UTS:IPPG Project Team. Project Director: Associate Professor Roberta Ryan, Director IPPG. Project Manager: Catherine Hastings, Research Officer
 IPPG Project Team Project Director: Associate Professor Roberta Ryan, Director IPPG Project Manager: Catherine Hastings, Research Officer Research Assistance: Theresa Alvarez, Research Assistant Acknowledgements
Statistics Update For County Cavan
 Social Inclusion Unit November 2013 Key Figures for Cavan Population 73,183 Population change 14.3% Statistics Update For County Cavan Census 2011 Shows How Cavan is Changing Population living in 70% rural
Severe exploitation of foreign workers - the SELEX-project
 Severe exploitation of foreign workers - the SELEX-project International Round Table on Human Trafficking Turning Suspicion into Evidence Vienna, 20 November 2015 In many sectors of the economy foreign
3 Labour Force and Employment
 3 Labour Force and Employment 3.1 Key Indicators The MODL is home to a labour force that is over 22,764 persons strong. As illustrated in Table 11, the region s labour participation rate and employment
Competition or Co-operation? South African and Migrant Entrepreneurs in Johannesburg
 Competition or Co-operation? South African and Migrant Entrepreneurs in Johannesburg SAMP MIGRATION POLICY SERIES 75 Competition or Co-operation? South African and Migrant Entrepreneurs in Johannesburg
Queensland s Labour Market Progress: A 2006 Census of Population and Housing Profile
 Queensland s Labour Market Progress: A 2006 Census of Population and Housing Profile Issue No. 9 People in Queensland Labour Market Research Unit August 2008 Key Points Queensland s Labour Market Progress:
North York City of Toronto Community Council Area Profiles 2016 Census
 Bar Chart showing the rate of population growth between the years 2006 and 2016 for the Ward compared to the City of based on the 2006 and data. For more information, please contact Michael Wright at 416-392-7558
A Profile of CANADiAN WoMeN. NorTHerN CoMMuNiTieS
 A Profile of CANADiAN WoMeN in rural, remote AND NorTHerN CoMMuNiTieS DeMogrAPHiC Profile in 2006, the last census year for which data are currently available, approximately 2.8 million women resided in
Women s Economic Empowerment: a Crucial Step towards Sustainable Economic Development
 Briefing note National Assembly s Secretariat General Women s Economic Empowerment: a Crucial Step towards Sustainable Economic Development Researcher In charge : Ms. KEM Keothyda July 2016 Parliamentary
The state of informal workers organisations in South Africa Sarah Mosoetsa October 2012
 The state of informal workers organisations in South Africa Sarah Mosoetsa October 2012 1. Overview of informal economy in South Africa (select sectors) South Africa s informal workers in all sectors,
Latino Small Business Owners in the United States
 Data release June 2012 Small Business Owners in the United States A Fiscal Policy Institute Data Release in connection with: Immigrant Small Business Owners: A Significant and Growing Part of the Economy
people/hectare Ward Toronto
 Bar Chart showing the rate of population growth between the years 2006 and 2016 for the Ward compared to the City of based on the 2006 and data. For more information, please contact Michael Wright at 416-392-7558
Occupational Fatalities Involving Hispanic Workers in the Construction Industry
 Open Journal of Safety Science and Technology, 2013, 3, 1-7 http://dx.doi.org/10.4236/ojsst.2013.31001 Published Online March 2013 (http://www.scirp.org/journal/ojsst) Occupational Fatalities Involving
Quality of Life in the Gauteng City-Region: 2011 findings
 Quality of Life in the Gauteng City-Region: 2011 findings Slides prepared by GCRO team unless otherwise stated Results from the Quality of Life sample survey of residents of the Gauteng city-region Quick
Pacific Economic Trends and Snapshot
 Pacific Economic Trends and Snapshot September 213 Report to Ministry of Business, Innovation, and Employment Contents 1. Key points... 3 2. Demographic trends... 5 3. Qualifications and skills... 7 4.
Characteristics of the underemployed in New Zealand
 Characteristics of the underemployed in New Zealand focuses on the proportion of underemployment for part-time workers. It brings in underemployment rates and levels to provide context. We explore personal,
EVERYDAY LEGAL PROBLEMS AND THE COST OF JUSTICE IN CANADA GENDER
 1 EVERYDAY LEGAL PROBLEMS AND THE COST OF JUSTICE IN CANADA GENDER The Right Honourable Beverley McLachlin, P.C., Chief Justice of Canada (2011) This research...by the Canadian Forum on Civil Justice will
CARE COLLABORATION FOR APPLIED RESEARCH IN ECONOMICS LABOUR MOBILITY IN THE MINING, OIL, AND GAS EXTRACTION INDUSTRY IN NEWFOUNDLAND AND LABRADOR
 DRAFT January 2016 CARE COLLABORATION FOR APPLIED RESEARCH IN ECONOMICS LABOUR MOBILITY IN THE MINING, OIL, AND GAS EXTRACTION INDUSTRY IN NEWFOUNDLAND AND LABRADOR Yue Xing +, Brian Murphy + and Doug
The Government of the Republic of the Union of Myanmar Ministry of Labour, Immigration and Population Department of Labour.
 The Government of the Republic of the Union of Myanmar Ministry of Labour, Immigration and Population Department of Labour Annual Labour Force Survey-2017 Quarterly Report (1 st Quarter, January-March
New Americans in Long Beach POPULATION GROWTH 3.3% 14.3 % Total population 481, % Immigrant population 128, % 26.1% 47.
 New Americans in Long Beach A Snapshot of the Demographic and Economic Contributions of Immigrants in the Long Beach Area 1 POPULATION GROWTH 7+7R 6.6% Immigrant share of the population, 016 Between 011
Labor Supply Factors and Labor Availability for the Geneva (Fillmore County) Labor Area
 Labor Area") Labor Supply Factors and Labor Availability for the Geneva (Fillmore County) Labor Area June 2015 Prepared by: Kenneth M. Lemke, Ph.D. Economist Nebraska Public Power District 1414 15 th Street - P.O.
Labor Supply Factors and Labor Availability for the Geneva (Fillmore County) Labor Area June 2015 Prepared by: Kenneth M. Lemke, Ph.D. Economist Nebraska Public Power District 1414 15 th Street - P.O.
Facts & Figures in this issue: income employment growth trends baby boomers millennials immigration
 Facts & Figures in this issue: income employment growth trends baby boomers millennials immigration 2017 Baby Boomers The term baby boomer refers to individuals born in the United States between 1946 and
Verdun borough HIGHLIGHTS. In 1996, the Verdun borough had a population of 59,714. LOCATION
 Socio-economic profile borough February 2002 HIGHLIGHTS In 1996, the borough had a population of 59,714. LOCATION Between 1991 and 1996, the population of the borough declined by 2.6%. One-person households
Foreign Migration to the Cleveland-Akron-Lorain Metropolitan Area From 1995 to 2000
 EngagedScholarship@CSU Urban Publications Maxine Goodman Levin College of Urban Affairs 12-22-2005 Foreign Migration to the Cleveland-Akron-Lorain Metropolitan Area From 1995 to 2000 Mark Salling, m.salling@csuohio.edu
Ethical Dilemma Economic Status of Indigenous Australians
 www.graduateskills.edu.au 1 Ethical Dilemma Economic Status of Australians Description The Economic Status of Australians: an exercise addressing sustainability and ethical issues Task Type In class activity,
LONGITUDINAL SURVEY OF IMMIGRANTS TO CANADA
 LONGITUDINAL SURVEY OF IMMIGRANTS TO CANADA Background and Overview of the Questionnaire Content for Wave 1 Background The (LSIC) is designed to study how recent immigrants adjust to living in Canada.
This report examines the factors behind the
 Steven Gordon, Ph.D. * This report examines the factors behind the growth of six University Cities into prosperous, high-amenity urban centers. The findings presented here provide evidence that University
Ward 4 Etobicoke Centre City of Toronto Ward Profiles 2016 Census
 Bar Chart showing the rate of population growth between the years 2006 and 2016 for the Ward compared to the City of based on the 2006 and data. For more information, please contact Michael Wright at 416-392-7558
NCERT Solutions for Class 9 Social Science Geography : Chapter 6 Population
 NCERT Solutions for Class 9 Social Science Geography : Chapter 6 Population Question 1. Choose the right answer from the four alternatives given below (i) Migrations change the number, distribution and
INTERNATIONAL MIGRANTS IN JOHANNESBURG S INFORMAL ECONOMY
 INTERNATIONAL MIGRANTS IN JOHANNESBURG S INFORMAL ECONOMY Sally Peberdy Peberdy, Sally. (2016). International Migrants in Johannesburg s Informal Economy. SAMP Migration Policy Series No. 71. SAMP: Waterloo
Migration, Poverty & Place in the Context of the Return Migration to the US South
 Migration, Poverty & Place in the Context of the Return Migration to the US South Katherine Curtis Department of Rural Sociology Research assistance from Jack DeWaard and financial support from the UW