Non Financial Census of Municipalities
|
|
|
- David Stone
- 6 years ago
- Views:
Transcription


1 Non Financial Census of Municipalities Pali Lehohla Statistician-General Statistics South Africa Cape Town 22 October
2 Outline of Presentation Oversight Role of the Portfolio Committee Using Stats SA data for Monitoring and Evaluation Situation Analysis. What is the current position? Integrated Data Analysis Maputo Corridor Analysis Infrastructure development Causes of Death My Ward My Councilor Stats SA Services 2
3 The four dimensions of poverty Health Education Deprivation cut-offs Living standards Economic activity Child mortality (death of child under 5) Years of schooling (completed 5 years of schooling) School attendance (school-aged child out of school) Lighting (no electricity) Heating (no electricity) Cooking (no electricity) Water (no piped water) Sanitation Dwelling Assets (no flush toilet) (informal/traditional/caravan/tent) (no radio/tv/phone/car) Unemployment (adults unemployed) 3

4 INDIGENTS 4
: From 20 6kl free")


5 Free Basic Service Policy (Rebates): From 20 6kl free per household per month 50kwh free per household per month R50 average for Sewerage and sanitation Target group = indigent households R50 average for Solid waste management 5


6 Number of indigent households registered with municipalities per province: ,4 million indigent households GP
7 Water services 7


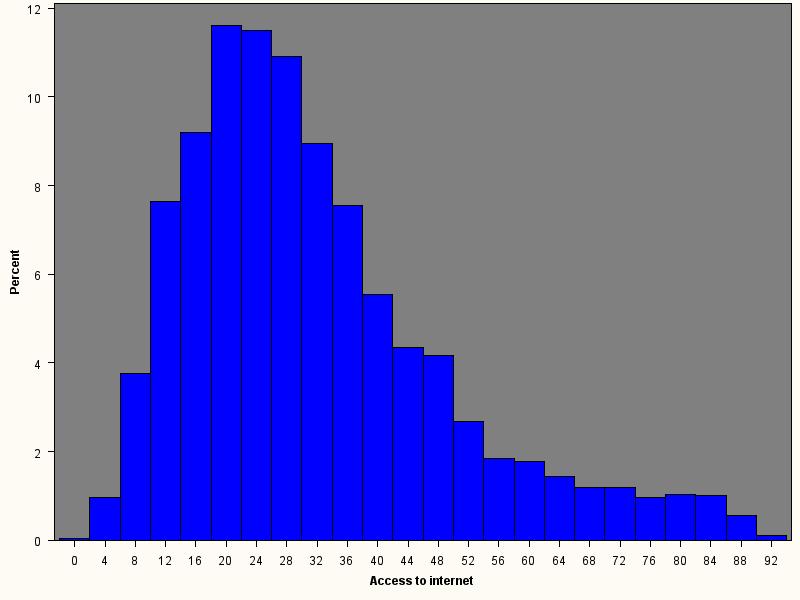
8 Consumer units with access to water South Africa: consumer units receiving water service 2009: 9,7 million 2013: 11,8 million 88% of consumer units that had access to water in 2009 received water within RDP standard Consumer units with access to water inside the yard 2009: 6,7 million 2013: 7,9 million Access increased to 90% in

9 6kl free per household per month Number of consumer units receiving basic water and free basic water NC GP NW FS LP MP KZN Basic water Free basic water 2013 financial year WC EC ,8 million consumer units 9
")

10 Poverty headcount by municipality (SAMPI) Mapping the poverty headcount by Municipality Eastern Cape (SAMPI) 10

11 Poverty headcount by municipality (SAMPI) 11

12 Poverty headcount by municipality (SAMPI) 12
13 Percentage of households that have no toilet facility by improved sanitation per province 13
")
14 Mapping the poverty headcount by municipality 2011 (SAMPI) 14


15 Measuring poverty 100% R321 R620 Upper-bound poverty line R443 Lower-bound poverty line Food poverty line 80% 60% 40% 20% 8% 0% 0% 20% 40% 60% 80% 100% 33% 15


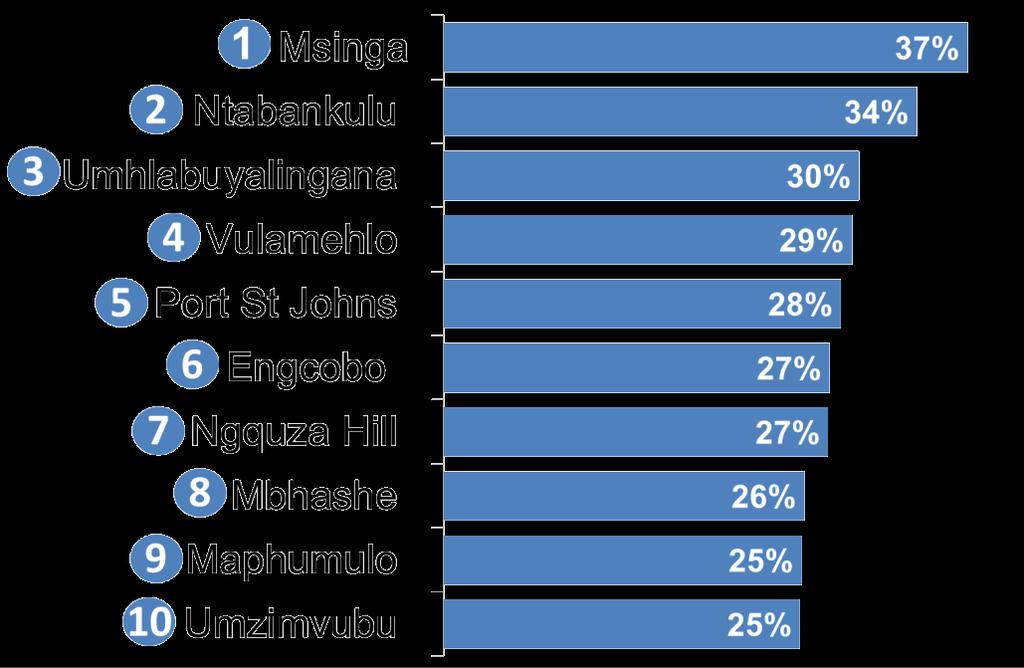
16 Headcount KZN EC 8 5 Where are the poorest municipalities located? Census
17 Mapping the poverty headcount by ward

18 Mapping the poverty headcount by ward


19 Economic activity Living standard Education Health Poverty drivers in South Africa Unemployment Assets Dwelling Sanitation Water Cooking Heating Lighting School attendance Years of schooling Child mortality Men Women Total Unemployment rate Unemployment is now the major driver of poverty in the country THE SOUTH AFRICA I KNOW, THE HOME I UNDERSTAND 19 19
20 20


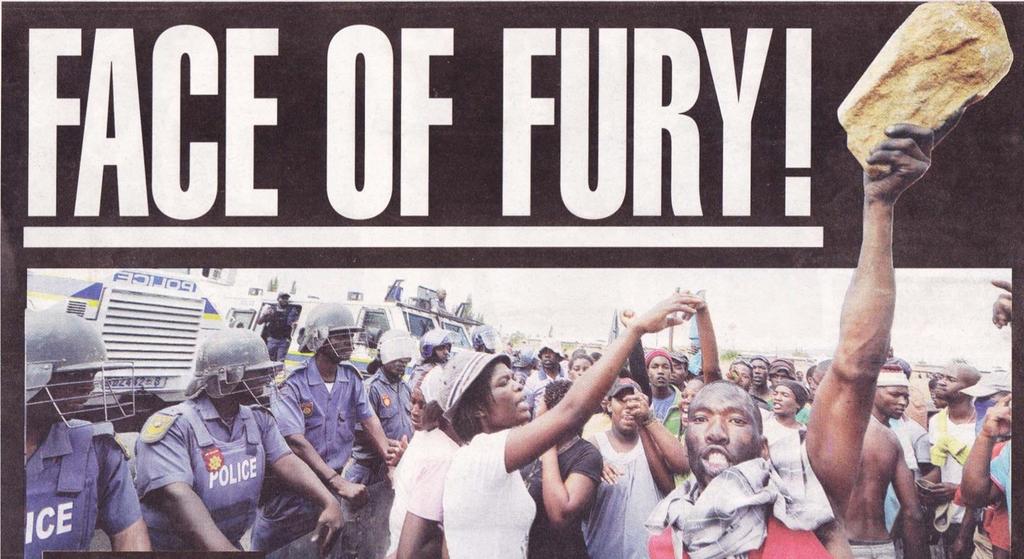
21 Major service delivery protests, by year ( ) 21


22 Major service delivery protests, 2012, by province 22

23 Hotspots for service delivery protests in SA Police crowd control data Map of protests in South Africa 01/01/ /11/
24 The Maputo Development Corridor Problem Statement According to Spatial Development Initiatives (1999), some of the objectives of the MDC include: 1. rehabilitating the primary infrastructure network along the corridor 2. maximising investment in both the inherent corridor area and in the added opportunities 3. maximising social development, employment opportunities and increase the participation of historically disadvantaged people 24

25 The scope of the research 25


26 Reported positive impacts of the MDC on local communities 26


27 Reported negative impacts of the MDC on local communities 27
28 Selected indicators Description Variable(s) Demographic characteristics 1. Total population 2. Population aged as a proxy for the labour force group: 1996, 2001, 2007 and 2011 Educational characteristics Educational level for the population aged 15-64: 1996, 2001 and 2007 and 2011 Categories 1. Less than primary education (used as a proxy for unskilled labour) 2. Achieved high school education and above (used as a proxy for skilled labour) Employment Percentage of the labour force employed (all sector employment): 1996, 2001, 2007 and 2011 Grouped employment sector Agriculture and mining Infrastructure related Wholesale, Migration in vs out Number of persons aged who reported that they moved from other places to others between 2001 and 2011: census 2011 Provision of basic services to households Percentage of households with piped water in dwelling or yard: 1996, 2001, 2007 and
29 Percentage Percentage of population 70 aged employed Year MDC region Mpumalanga Province South Africa 29
30 Year Percentage of persons aged employed by employment sector Wholesale, retail and services Infrastructure related Agriculture and mining Wholesale, retail and services Infrastructure related Agriculture and mining SOUTH AFRICA MPUMALANGA MDC REGION Wholesale, retail and services Infrastructure related Agriculture and mining Percentage employed 30
31 Number of persons aged Number of persons aged Numbers of in and out migrants: In migrants into MDC municipalities Out migrants from MDC municipalities Year moved Year moved Victor Khanye Emalahleni Steve Tshwete Victor Khanye Emalahleni Steve Tshwete Emakhazeni Mbombela Nkomazi Emakhazeni Mbombela Nkomazi 31


32 Building plans passed 32
33 Value of building plans passed by province, 2013 GP R35,3bn 41% / LP R2,3bn 3% South Africa R86,1bn NW R3,8bn 4% MP R4,1bn 5% NC R1,0bn 1% FS R2,5bn 3% KZN R13,8bn 16% WC R18,6bn 22% EC R4,8bn 6% Municipalities in Gauteng recorded building plans to the value of R35,3 billion, 41% of the national total 33

34 Buildings completed 34
35 Value of buildings completed by province, 2013 GP R21,3bn 41% / LP R0,7bn 1% South Africa R52,2bn NW R1,7bn 3% MP R2,0bn 4% NC R0,4bn 1% FS R1,1bn 2% KZN R7,0bn 13% WC R15,7bn 30% EC R2,3bn 4% Municipalities in Gauteng recorded completed buildings to the value of R21,3 billion, 41% of the national total 35

36 2006 Number of buildings completed 2013 In both 2006 and 2013, Cape Town and Tswhane completed the most number of buildings 36


 CoJ CoCT RLM Average 15 21.5 16.7 17.")
37 Links to Capital Spending Public capital spending impetus for private sector investments. Cities generally have larger capital budgets than other municipalities. Highest spending in services infrastructure (transport, water, electricity, sanitation) followed by Housing for 2007/8 to 2011/12. Capital expenditure (% of municipal budget) CoJ CoCT RLM Average Economic (%) Social (%) Housing (%) Infrastructure


38 SDF priorities: corridor development EW, NS, public transport management areas; nodal development; marginalised areas; nonprioritized areas. Wards containing SDF features generally attracted higher levels of capital spending. Average investment in the corridors was the highest, followed 38 by the mixed-use & industrial nodes, and the marginalised areas.

39 Census 2001 Population Census 2011 Population 39

40 Statistics are about: People Places 40
 Decision-making (decision making in government, subnational, business & the public) Increased knowledge, understanding and use by the leadership, citizens and")
41 For USE in Outcome: use of evidence Planning (baseline information for NDP) Monitoring & Evaluation (measuring development and impact) Policy development (increasing rationale for making decisions for better policies) Decision-making (decision making in government, subnational, business & the public) Increased knowledge, understanding and use by the leadership, citizens and state 41


42 The importance of a spatial information frame? Postal services Address provision for household mail delivery Retail and business services Deliver goods, financial services, business location Emergency services Rapid response to save lives Disaster management Service delivery Provide basic services to consumer units Data collection Plan for the future Inform urban and regional planning Valuation roll Property descriptions and rates valuation An accurate and complete statistical frame 42

43 Geo-information integration Link customer unit to fundamental data Using the customer unit as the spatial integrator Benefits 43

44 and the need to know 44

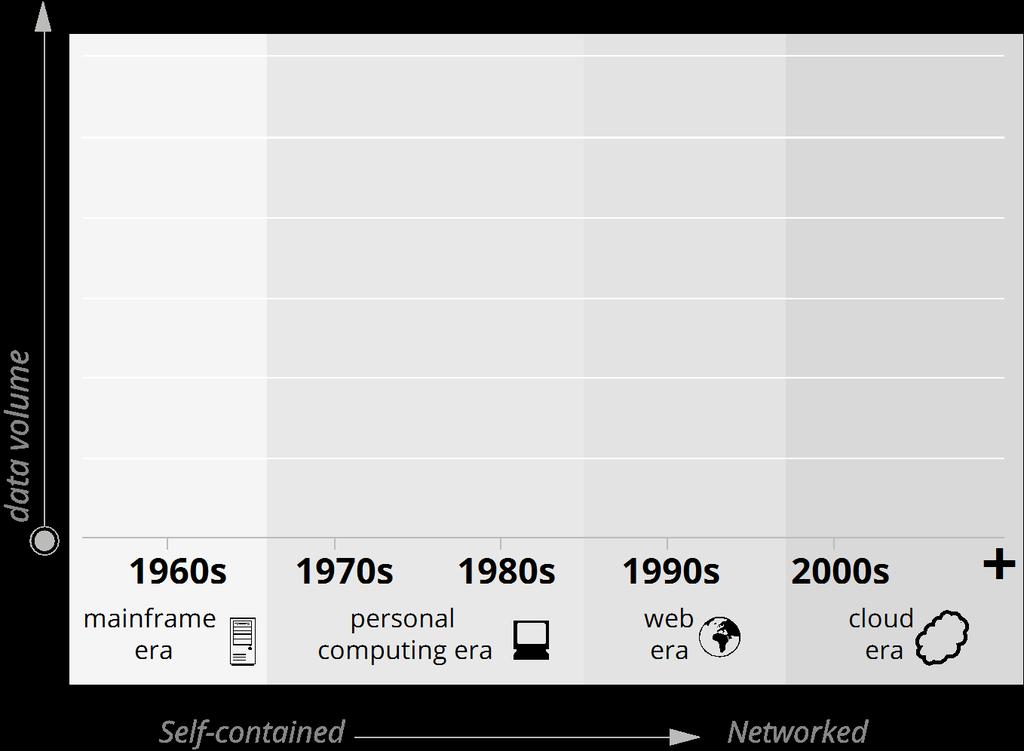
45 Industrial revolution of data 45


46 by-product unstructured and unfiltered product structured and planned clear concept & method high cost centralised point-in-time regulated HUGE macro-level manageable size 46
47 Proportion with flush toilet 47

48 Red indicates wards that have less than 5% households with flush toilets 48
49 Proportion with refuse removal 49
50 50

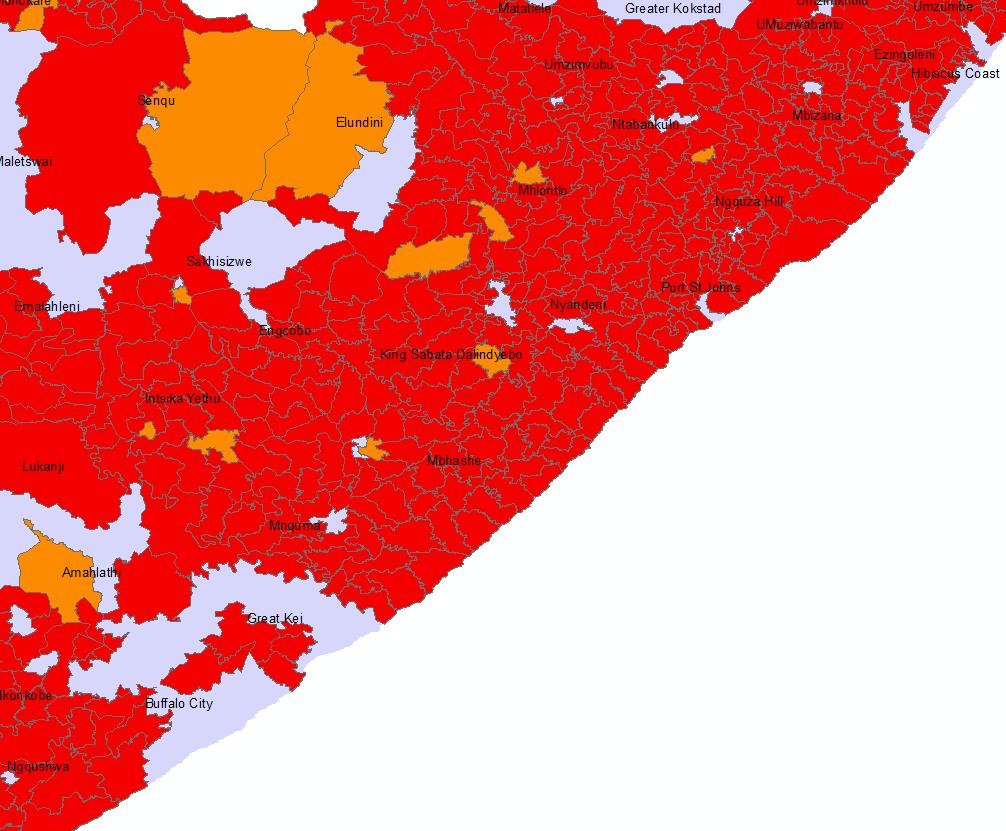
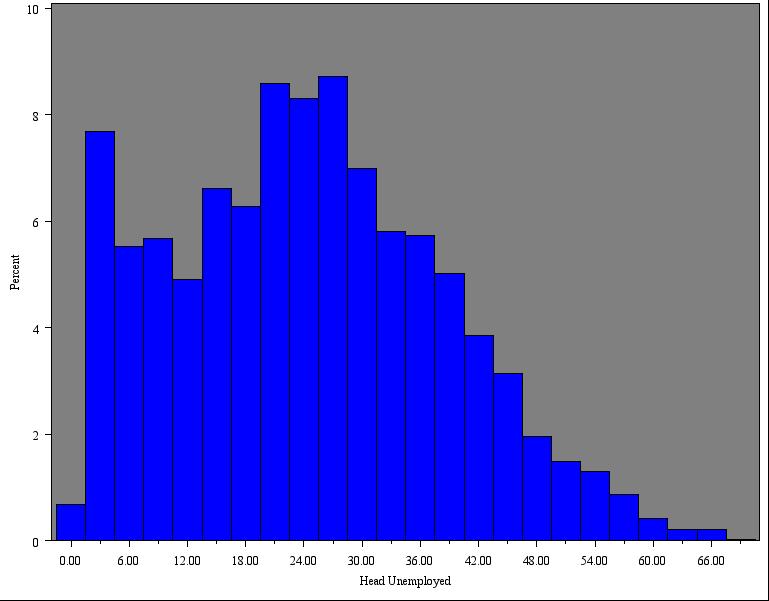
51 Proportion unemployed 51

52 Red colour means unemployment rate greater than 71% 52

53 %distribution of informal dwellings at ward level 53

54 Informal dwelling Red is less than 10% 54
55 55


56 Green it greater than 48% 56
57 57

58 RED is household with less than 5% access to piped water 58
59 59

60 Red shows 90% or greater 60
61 61

62 Red is less than 10% 62
63 Wards 63
64 64

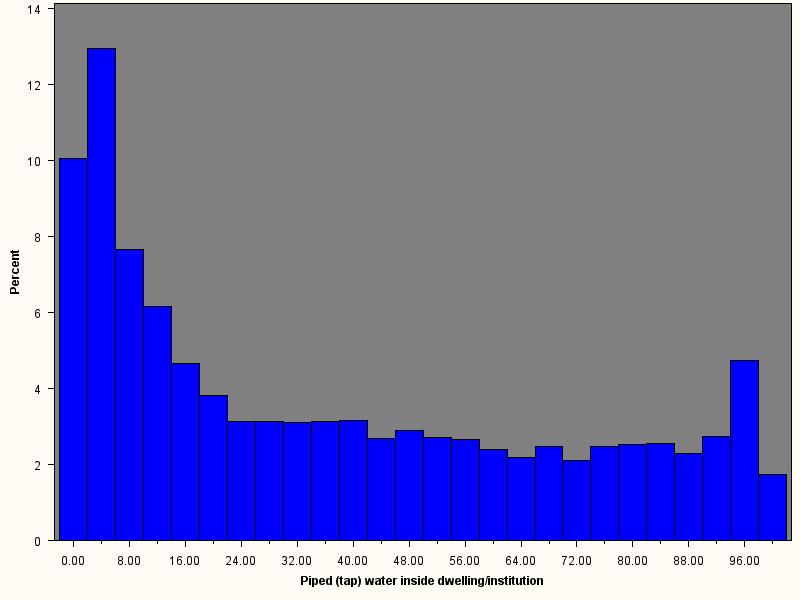
65 Piped water inside dwellin The red indicates household with piped water inside dwelling between 65 0 and 3.98%
66 66

67 Flush toilet The red Indicates household with f 67 lush toilets
68 Main place 68
69 69

70 No access to piped wate Red indicates at least 50% Households don t have 70 access to
71 Youth Unemployment Hot spot analysis 71
72 72

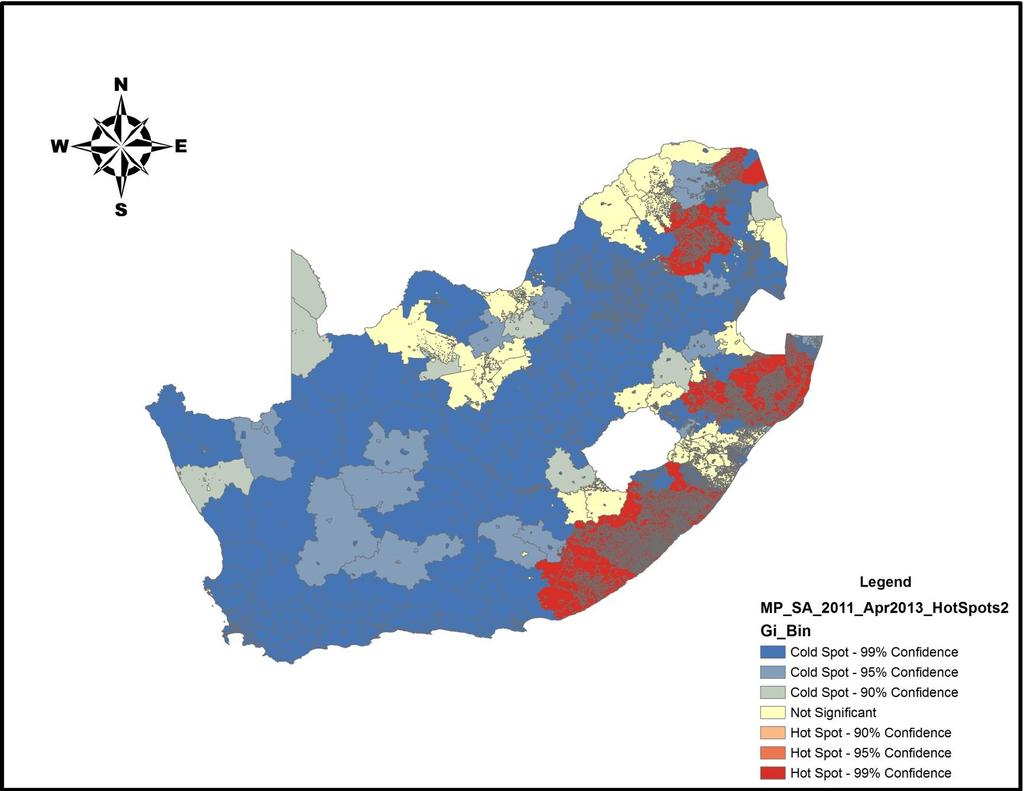
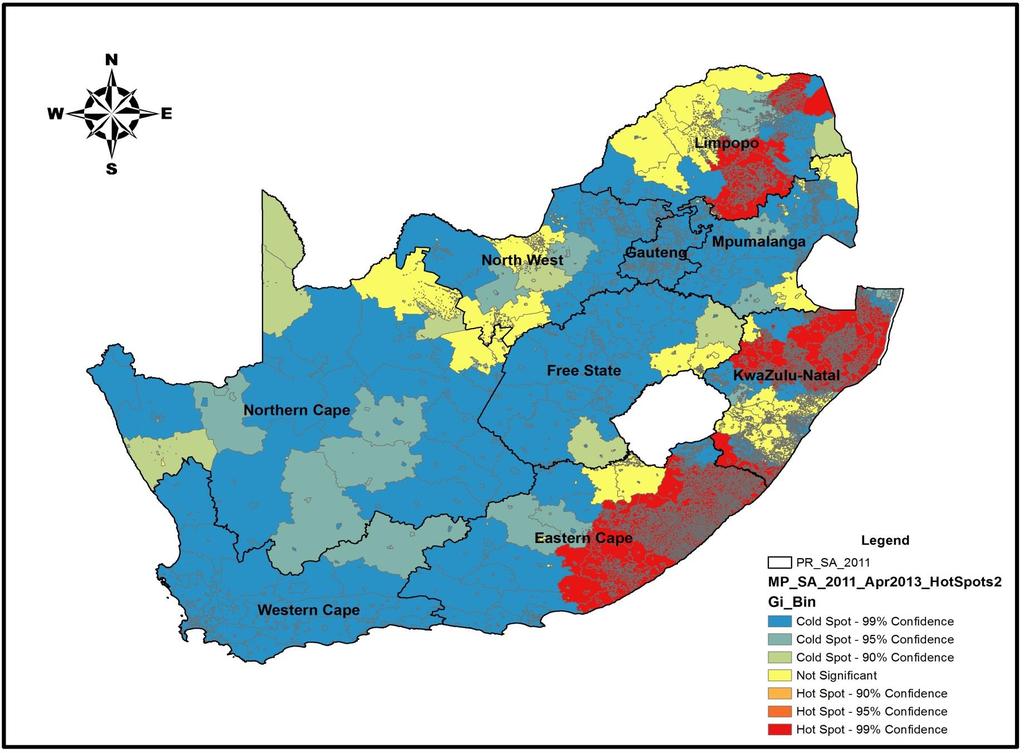
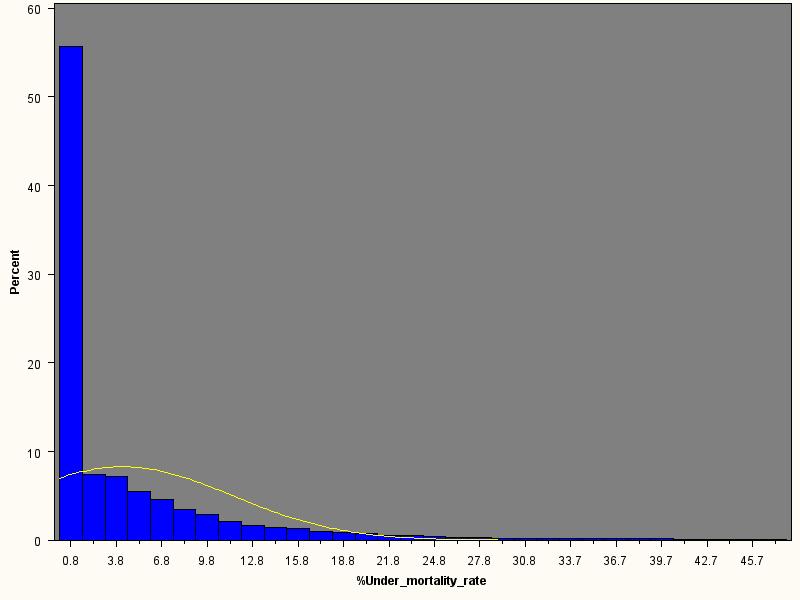
73 Red indicates areas with high under-5 mortality 73
74 Training and Analysis All Stats SA data is free Free Supercross training Spatial analysis Integrated Statistical analysis 74


75 The South Africa I know, the home I understand Thank you! 75
Internal migration determinants in South Africa: Recent evidence from Census RESEP Policy Brief
 Department of Economics, University of Stellenbosch Internal migration determinants in South Africa: Recent evidence from Census 2011 Eldridge Moses* RESEP Policy Brief february 2 017 This policy brief
GCRO DATA BRIEF: NO. 5 Gauteng: a province of migrants
 DATA BRIEF GCRO DATA BRIEF: NO. 5 Produced by the Gauteng City-Region Observatory (GCRO) A partnership of the University of Johannesburg (UJ), University of the Witwatersrand, Johannesburg (Wits), the
MIGRATION INTO GAUTENG PROVINCE
 Development Policy Research Unit University of Cape Town Private Bag Rondebosch 7701 Southern African Migration Project Post Net Box 321a Private Bag X30500 Johannesburg 2041 MIGRATION INTO GAUTENG PROVINCE
CSIR Policy Note 3. Using Election Registration Data to measure Migration Trends in South Africa. Introduction the need for additional data
 CSIR Policy Note 3 Using Election Registration Data to measure Migration Trends in South Africa Introduction the need for additional data Demography is not static, and population figures, distribution
MIGRATION TRENDS AND HUMAN SETTLEMENTS
 MIGRATION TRENDS AND HUMAN SETTLEMENTS SOME IMPLICATIONS FOR SERVICE CENTRES CATHERINE CROSS, CPEG 27 OCTOBER 2009 ECONOMY AND MIGRATION The economic downturn is now the key driver for migration The world
2016 Local government elections under the spotlight
 From left to right: Herman van Papendorp (Head of Investment Research and Asset Allocation), Sanisha Packirisamy (Economist) 216 Local government elections under the spotlight Background Having grown steadily
Internal Migration to the Gauteng Province
 Internal Migration to the Gauteng Province DPRU Policy Brief Series Development Policy Research Unit University of Cape Town Upper Campus February 2005 ISBN 1-920055-06-1 Copyright University of Cape Town
Thoko Sipungu 7/1/2016 A BRIEF REVIEW OF THE PERFORMANCE OF THE EASTERN CAPE IN TERMS OF THE STATISTICS SOUTH AFRICA COMMUNITY SURVEY 2016
 1 7/1/2016 A BRIEF REVIEW OF THE PERFORMANCE OF THE EASTERN CAPE IN TERMS OF THE STATISTICS SOUTH AFRICA COMMUNITY SURVEY 2016 Thoko Sipungu MONITORING AND ADVOCACY PROGRAMME PUBLIC SERVICE ACCOUNTABILITY
Statistics South Africa Private Bag X44 Pretoria 0001 South Africa. Steyn s Building 274 Schoeman Street Pretoria
 Statistics South Africa Private Bag X44 Pretoria 0001 South Africa Steyn s Building 274 Schoeman Street Pretoria Users enquiries: (012) 310-8600 Fax: (012) 310-8500 Main switchboard: (012) 310-8911 Fax:
Informal entrepreneurship and Gauteng
 Informal entrepreneurship and Gauteng ELLA Summit on Informality and Inclusive Growth Sally Peberdy (PhD) Gauteng City-Region Observatory (GCRO) sally.peberdy@gcro.ac.za Overview of QoL 2015 Overview of
Nalen Naidoo, 1 Murray Leibbrandt 2 and Rob Dorrington 3
 SADemJ (11)1 3 38 Magnitudes, Personal Characteristics and Activities of Eastern Cape Migrants: A Comparison with Other Migrants and with Non-migrants using Data from the 1996 and 2001 Censuses Nalen Naidoo,
Spatial Restructuring in South Africa: How has South Africa performed since 1994?
 Spatial Restructuring in South Africa: How has South Africa performed since 1994? Peter Bikam Department of Urban and Regional Planning, School of Environmental Sciences, University of Venda, Thohoyandou,
PAN-AFRICAN CONFERENCE ON INEQUALITIES IN THE CONTEXT OF STRUCTURAL TRANSFORMATION 28TH - 30TH APRIL 2014, ACCRA GHANA
 PAN-AFRICAN CONFERENCE ON INEQUALITIES IN THE CONTEXT OF STRUCTURAL TRANSFORMATION 28TH - 30TH APRIL 2014, ACCRA GHANA INEQUALITY IN SOUTH AFRICA: GOING BEYOND AVERAGES PAPER BY PALI LEHOHLA: STATISTICIAN
SOCIAL IMPACT ASSESSMENT FOR THE SWAZILAND RAIL LINK PROJECT
 SOCIAL IMPACT ASSESSMENT FOR THE SWAZILAND RAIL LINK PROJECT Prepared for: Transnet Project: 109578 2 July 2013 SIA SCOPING REPORT KZN Document Control Record Document prepared by: Aurecon South Africa
Can you measure social cohesion in South Africa?
 Can you measure social cohesion in South Africa? And can you fix what you don t measure? Alan Hirsch The Presidency, South Africa and University of Cape Town 1 Findings of the OECD Development Centre Global
An analysis of Policy Issues on Poverty Towards Achieving the Millennium Development Goals (MDGs): A South African Perspective Edwin Ijeoma..
: A South African Perspective Edwin Ijeoma..") An analysis of Policy Issues on Poverty Towards Achieving the Millennium Development Goals (MDGs): A South African Perspective Edwin Ijeoma.. PhD (Pret.) University of Pretoria. Preamble and Expected Research
An analysis of Policy Issues on Poverty Towards Achieving the Millennium Development Goals (MDGs): A South African Perspective Edwin Ijeoma.. PhD (Pret.) University of Pretoria. Preamble and Expected Research
Provincial Review 2016: Western Cape
 Provincial Review 2016: Western Cape The Western Cape s real economy is dominated by manufacturing and commercial agriculture. As a result, while it did not benefit directly from the commodity boom, it
Trends in poverty, urbanization and agricultural productivity in Zimbabwe
 Trends in poverty, urbanization and agricultural productivity in Zimbabwe Preliminary findings Rob Swinkels (World Bank) and Percy Chipunza (Ministry of Lands, Agriculture and Rural Resettlement) June
The Socio-Economic Characteristics and Implications of Youth Unemployment in Galeshewe Township in the Kimberley area (Northern Cape Province)
") The Socio-Economic Characteristics and Implications of Youth Unemployment in Galeshewe Township in the Kimberley area (Northern Cape Province) For A Masters Mini-Thesis SUBMITTED IN PARTIAL FULFILMENT
The Socio-Economic Characteristics and Implications of Youth Unemployment in Galeshewe Township in the Kimberley area (Northern Cape Province) For A Masters Mini-Thesis SUBMITTED IN PARTIAL FULFILMENT
SOCIAL IMPACT ASSESSMENT FOR THE SWAZILAND RAIL LINK PROJECT
 SOCIAL IMPACT ASSESSMENT FOR THE SWAZILAND RAIL LINK PROJECT Prepared for: Transnet Project: 109578 2 July 2013 Draft SIA SCOPING REPORT - Mpumalanga Document Control Record Document prepared by: Aurecon
Provincial Review 2016: Northern Cape
 Provincial Review 2016: Northern Cape The Northern Cape has by far the smallest population and economy of any of the provinces. Its real economy has been dominated by iron ore and ferro alloys, with the
INTRODUCTION TO THE 2001 MIGRATION STUDY PROJECT IN THE WESTERN CAPE PROVINCE
 INTRODUCTION TO THE 2001 MIGRATION STUDY PROJECT IN THE WESTERN CAPE PROVINCE The reasons behind the Migration Study in the Western Cape The principle of cooperative government established by the 1996
MIGRANTS IN THE CITY OF JOHANNESBURG A Report for the City of Johannesburg
 MIGRANTS IN THE CITY OF JOHANNESBURG A Report for the City of Johannesburg by Dr Sally Peberdy Professor Jonathan Crush and Ntombikayise Msibi Southern African Migration Project PostNet Box 321a Private
SEJA BASELINE SURVEY REPORT
 SEJA BASELINE SURVEY REPORT Foundation for Human Rights 2018 Table of Contents Glossary of terms... 4 Introduction... 1 Methodology... 2 Questionnaire design... 2 Language... 2 Computer-assisted personal
Statistics Update For County Cavan
 Social Inclusion Unit November 2013 Key Figures for Cavan Population 73,183 Population change 14.3% Statistics Update For County Cavan Census 2011 Shows How Cavan is Changing Population living in 70% rural
Poverty Data Disaggregation: Experiences and Suggestions of China. Wang Pingping Department of Household Surveys of National Bureau of China (NBS)
") Poverty Data Disaggregation: Experiences and Suggestions of China Wang Pingping Department of Household Surveys of National Bureau of China (NBS) Disaggregated poverty data is important for most of the
Poverty Data Disaggregation: Experiences and Suggestions of China Wang Pingping Department of Household Surveys of National Bureau of China (NBS) Disaggregated poverty data is important for most of the
Social Impact Assessment of the Proposed N2 Wild Coast Toll Highway. HIV/AIDS prevalence rate of 33.5% the highest in the country.
 HIV/AIDS prevalence rate of 33.5% the highest in the country. The KwaZulu-Natal Government s Industrial Strategy document of March 2004 offered a somewhat more positive perspective on provincial economic
Measures of Poverty. Foster-Greer-Thorbecke(FGT) index Example: Consider an 8-person economy with the following income distribution
 index Example: Consider an 8-person economy with the following income distribution") Foster-Greer-Thorbecke(FGT) index Example: Consider an 8-person economy with the following income distribution Individuals Income 1 0.6 2 0.6 3 0.8 4 0.8 5 2 6 2 7 6 8 6 Poverty line= 1 Recall that Headcount
Foster-Greer-Thorbecke(FGT) index Example: Consider an 8-person economy with the following income distribution Individuals Income 1 0.6 2 0.6 3 0.8 4 0.8 5 2 6 2 7 6 8 6 Poverty line= 1 Recall that Headcount
Characteristics of the underemployed in New Zealand
 Characteristics of the underemployed in New Zealand focuses on the proportion of underemployment for part-time workers. It brings in underemployment rates and levels to provide context. We explore personal,
RIJS Volume 2, Issue 7 (July 2013) ISSN: A Journal of Radix International Educational and. Research Consortium RIJS
 ISSN: A Journal of Radix International Educational and. Research Consortium RIJS") A Journal of Radix International Educational and Research Consortium RIJS RADIX INTERNATIONAL JOURNAL OF RESEARCH IN SOCIAL SCIENCE MAPPING SLUMS OF AN INDUSTRIAL CITY: PROBLEMS AND POLICY CONCERNS- A
A Journal of Radix International Educational and Research Consortium RIJS RADIX INTERNATIONAL JOURNAL OF RESEARCH IN SOCIAL SCIENCE MAPPING SLUMS OF AN INDUSTRIAL CITY: PROBLEMS AND POLICY CONCERNS- A
Migration to the cities and new vulnerabilities
 Author name Date Migration to the cities and new vulnerabilities, IIED IOM WMR 2015 Seminar 1 Understanding diversity and complexity among migrants Wealthier rural residents migrate permanently to the
Decent Work for the 21st Century
 Ninth Coordination Meeting on International Migration, New York, 17-18 February 2011 Decent Work for the 21st Century Gloria de Pascual-Teresa Director, International Migration Programme International
The Informal Economy: Statistical Data and Research Findings. Country case study: South Africa
 The Informal Economy: Statistical Data and Research Findings Country case study: South Africa Contents 1. Introduction 2. The Informal Economy, National Economy, and Gender 2.1 Description of data sources
Governing Migration & Urbanisation in South African Municipalities:
 Governing Migration & Urbanisation in South African Municipalities: Developing Approaches to Counter Poverty and Social Fragmentation Written by Loren B. Landau and Aurelia Segatti with Jean Pierre Misago
CDE EXECUTIVE SUMMARY
 CDE EXECUTIVE SUMMARY March 2014 CITIES OF HOPE Cities have never been more important for human well-being and economic prosperity. Half of the world s population lives in urban areas, while about 80 per
Setting the Scene: The South African Informal Sector. Caroline Skinner Urban Informality and Migrant Entrepreneurship
 Setting the Scene: The South African Informal Sector Caroline Skinner Urban Informality and Migrant Entrepreneurship International Statistics South African Context Labour Market Policy Context Size and
Gauteng 2055 Trend Paper: Population & Migration
 University of the Witwatersrand Forced Migration Studies Programme Gauteng 2055 Trend Paper: Population & Migration Prepared by: Loren B. Landau Forced Migration Studies Programme University of the Witwatersrand
Migration and Families The multiple role of youth in family migration
 OECD Development Centre Migration and Families The multiple role of youth in family migration Jason Gagnon International Dialogue on Migration Geneva 7/8 October 2014 What are the current dynamics of youth
Place-making and Development
 Access to the City: Place-Making and Development Dynamics Leslie Bank, Catherine Ndinda and Tim Hart EPD Place-making and Development The crisis of post apartheid South Africa is centrally a crisis of
Measuring Living Conditions and Integration of Refugees
 Measuring Living Conditions and Integration of Refugees Eric B. Jensen, U.S. Census Bureau Filip Tanay, European Commission International Forum on Migration Statistics January 15-16, 2018 Any views expressed
ndtv.com POPULATION Ann Maureen Samm-Regis
 ndtv.com POPULATION Ann Maureen Samm-Regis Definitions Population is the total number of people living in a specific area at a particular time. Demography: is the study of the population to determine its
Sustainable cities, human mobility and international migration
 Sustainable cities, human mobility and international migration Report of the Secretary-General for the 51 st session of the Commission on Population and Development (E/CN.9/2018/2) Briefing for Member
IUDF INPUT ONRURAL-URBAN
 IUDF INPUT ONRURAL-URBAN LINKAGES LindileL. Ndabeni, Strategic Workshop on Rural-Urban Interdependencies, South African Cities Network, Johannesburg, 20 May 2013 AREAS OF EMPHASIS IN THIS Rationale for
12 Socio Economic Effects
 12 Socio Economic Effects 12.1 Introduction This chapter considers the socio-economic impact of Edinburgh Tram Line One during its construction and operation. Two main aspects of the scheme are considered:
Measuring International Migration- Related SDGs with U.S. Census Bureau Data
 Measuring International Migration- Related SDGs with U.S. Census Bureau Data Jason Schachter and Megan Benetsky Population Division U.S. Census Bureau International Forum on Migration Statistics Session
Chapter 7. Urbanization and Rural-Urban Migration: Theory and Policy 7-1. Copyright 2012 Pearson Addison-Wesley. All rights reserved.
 Chapter 7 Urbanization and Rural-Urban Migration: Theory and Policy Copyright 2012 Pearson Addison-Wesley. All rights reserved. 7-1 The Migration and Urbanization Dilemma As a pattern of development, the
Addressing the investment challenges faced by South Africa and the rest of Africa. Trevor Manuel 30 July 2015
 Addressing the investment challenges faced by South Africa and the rest of Africa Trevor Manuel 30 July 2015 1 Africa s strengthening position GDP size ($bn) 2015 1 South Africa: 342 Africa: 2,275 World:
Employment Guarantee in South Africa: a case study of the CWP in Munsieville, Johannesburg
 Employment Guarantee in South Africa: a case study of the CWP in Munsieville, Johannesburg Dr. Khayaat Fakier ThembaMasondo Society, Work and Development Institute (SWOP) University of the Witwatersrand,
Downloads from this web forum are for private, non commercial use only. Consult the copyright and media usage guidelines on
 Econ 3x3 www.econ3x3.org A web forum for accessible policy relevant research and expert commentaries on unemployment and employment, income distribution and inclusive growth in South Africa Downloads from
MIGRATION AND POPULATION TRENDS IN GAUTENG PROVINCE
 MIGRATION AND POPULATION TRENDS IN GAUTENG PROVINCE 1996-2055 Loren B Landau & Veronique Gindrey University of the Witwatersrand, Johannesburg loren@migration.org.za and veronique.gindrey@wits.ac.za October
How s Life in Estonia?
 How s Life in Estonia? November 2017 Relative to other OECD countries, Estonia s average performance across the different well-being dimensions is mixed. While it falls in the bottom tier of OECD countries
A Profile of the Mpumalanga Province: Demographics, Poverty, Income, Inequality and Unemployment from 2000 till 2007
 Background Paper Series Background Paper 2009:1(8) A Profile of the Mpumalanga Province: Demographics, Poverty, Income, Inequality and Unemployment from 2000 till 2007 Elsenburg February 2009 Overview
Levels and Trends in Multidimensional Poverty in some Southern and Eastern African countries, using counting based approaches
 Poverty and Inequality in Mozambique: What is at Stake? 27-28 November 2017 Hotel Avenida Maputo, Mozambique Session 1: Poverty and Inequality Levels and Trends in Multidimensional Poverty in some Southern
President Jacob Zuma: Broad-Based Black Economic Empowerment Summit
 President Jacob Zuma: Broad-Based Black Economic Empowerment Summit 03 Oct 2013 The Minister of Trade and Industry and all Ministers and Deputy Ministers present, Members of the Presidential Broad-based
Remaking the Apartheid City* Presentation of Data: Durban, Draft, May 2007
 Remaking the Apartheid City* Presentation of Data: Durban, 1996-2001 Draft, May 2007 Daniel Schensul, Lead Investigator Ph.D. Candidate Department of Sociology Daniel_Schensul@Brown.edu Patrick Heller,
Population and Dwelling Counts
 Release 1 Population and Dwelling Counts Population Counts Quick Facts In 2016, Conception Bay South had a population of 26,199, representing a percentage change of 5.4% from 2011. This compares to the
Development Policy Research Unit University of Cape Town. Institutional Aspects of the Maputo Development Corridor
 Development Policy Research Unit University of Cape Town Institutional Aspects of the Maputo Development Corridor DPRU Policy Brief No. 01/P16 October 2001 DPRU Policy Brief 01/P17 Foreword The Development
Disaggregating SDG indicators by migratory status. Haoyi Chen United Nations Statistics Division
 Disaggregating SDG indicators by migratory status Haoyi Chen United Nations Statistics Division Defining migratory status Step 1. Country of birth or citizenship Country of birth: foreign-born vs native
NON - STANDARD EMPLOYMENT UPDATE
 NON - STANDARD EMPLOYMENT UPDATE Issue 4 In this issue we look at the recent arbitration awards dealing with the interpretation of the deeming provision of indefinite employment in section 198B (5) of
Compiling of labour migration data in Thailand. National Statistical Office,Thailand
 Compiling of labour migration data in Thailand National Statistical Office,Thailand 1 Thailand Statistical Master Plan The Statistics Act 2007 states that it is the obligation of NSO to develop a statistical
Done by: Thandokuhle Manzi
 Done by: Thandokuhle Manzi The Study Area Cato Manor is a working class area located seven kilometers from Durban's city center. It is characterized by an array of housing settings which range from proper
The Challenge of Youth Unemployment in South Africa
 The Challenge of Youth Unemployment in South Africa Nonkululeko Ngcobo CPEG 16 September 2009 BACKGROUND Youth internationally is defined as people between the ages 15-24, which is roughly 17% of the world
ANALYSIS OF POVERTY TRENDS IN GHANA. Victor Oses, Research Department, Bank of Ghana
 ANALYSIS OF POVERTY TRENDS IN GHANA Victor Oses, Research Department, Bank of Ghana ABSTRACT: The definition of poverty differs across regions and localities in reference to traditions and what society
Rural Cultural Policy in South Africa. Dr Teresa Connor FORT HARE INSTITUTE OF SOCIAL AND ECONOMIC RESEARCH EAST LONDON
 Rural Cultural Policy in South Africa Dr Teresa Connor FORT HARE INSTITUTE OF SOCIAL AND ECONOMIC RESEARCH EAST LONDON Definition of concepts Policy: The way in which conditions are created for cultural
Responding to Crises
 Responding to Crises UNU WIDER, 23-24 September 2016 The Economics of Forced Migrations Insights from Lebanon Gilles Carbonnier The Graduate Institute Geneva Red thread Gap between the reality of the Syrian
Poverty profile and social protection strategy for the mountainous regions of Western Nepal
 October 2014 Karnali Employment Programme Technical Assistance Poverty profile and social protection strategy for the mountainous regions of Western Nepal Policy Note Introduction This policy note presents
Korea s average level of current well-being: Comparative strengths and weaknesses
 How s Life in Korea? November 2017 Relative to other OECD countries, Korea s average performance across the different well-being dimensions is mixed. Although income and wealth stand below the OECD average,
Irregular Migration in Sub-Saharan Africa: Causes and Consequences of Young Adult Migration from Southern Ethiopia to South Africa.
 Extended Abstract Irregular Migration in Sub-Saharan Africa: Causes and Consequences of Young Adult Migration from Southern Ethiopia to South Africa. 1. Introduction Teshome D. Kanko 1, Charles H. Teller
Background Paper Series. Background Paper 2005:1(1) A profile of the Western Cape province: Demographics, poverty, inequality and unemployment
 A profile of the Western Cape province: Demographics, poverty, inequality and unemployment") Background Paper Series Background Paper 2005:1(1) A profile of the Western Cape province: Demographics, poverty, inequality and unemployment Elsenburg August 2005 Overview The Provincial Decision-Making
Background Paper Series Background Paper 2005:1(1) A profile of the Western Cape province: Demographics, poverty, inequality and unemployment Elsenburg August 2005 Overview The Provincial Decision-Making
CENSUS RESULTS NATIONAL HOUSEHOLD SURVEY
 2011 CENSUS RESULTS NATIONAL HOUSEHOLD SURVEY INTRODUCTION The inaugural National Household Survey (NHS) was a voluntary survey which replaced the mandatory long-form census questionnaire. The NHS was
[text from Why Graduation tri-fold. Picture?]
![[text from Why Graduation tri-fold. Picture?]](/thumbs/91/105296859.jpg "[text from Why Graduation tri-fold. Picture?]") 1 [text from Why Graduation tri-fold. Picture?] BRAC has since inception been at the forefront of poverty alleviation, disaster recovery, and microfinance in Bangladesh and 10 other countries BRAC creates
1 [text from Why Graduation tri-fold. Picture?] BRAC has since inception been at the forefront of poverty alleviation, disaster recovery, and microfinance in Bangladesh and 10 other countries BRAC creates
Plean Forbairt Development Plan
 17 STRATEGIC CONTEXT 18 CHAPTER 2 STRATEGIC CONTEXT 2.1 The National Development Plan 2000 2006 The purpose of the National Development Plan 2000 2006 is essentially to enhance regional economies and foster
Poverty, Livelihoods, and Access to Basic Services in Ghana
 Poverty, Livelihoods, and Access to Basic Services in Ghana Joint presentation on Shared Growth in Ghana (Part II) by Zeljko Bogetic and Quentin Wodon Presentation based on a paper by Harold Coulombe and
Targeting in a National Social Safety Net Programme. WFP Turkey
 Targeting in a National Social Safety Net Programme WFP Turkey Emergency Social Safety Net Background EU funded nationwide assistance programme to refugees in Turkey Registration: Ministry of Interior
Defining migratory status in the context of the 2030 Agenda
 Defining migratory status in the context of the 2030 Agenda Haoyi Chen United Nations Statistics Division UN Expert Group Meeting on Improving Migration Data in the context of the 2020 Agenda 20-22 June
Labour Force Structure. Employment. Unemployment. Outside Labour Force Population and Economic Dependency Ratio
 210 Statistical Yearbook of Abu Dhabi 2016 Labour Force. 5 Labour Force Structure Employment Unemployment Outside Labour Force Population and Economic Dependency Ratio Statistical Yearbook of Abu Dhabi
INCOME INEQUALITY WITHIN AND BETWEEN COUNTRIES
 INCOME INEQUALITY WITHIN AND BETWEEN COUNTRIES Christian Kastrop Director of Policy Studies OECD Economics Department IARIW general conference Dresden August 22, 2016 Upward trend in income inequality
Greater Golden Horseshoe Transportation Plan
 Greater Golden Horseshoe Transportation Plan Socio-Economic Profile Executive Summary October 2017 PREPARED BY Urban Strategies Inc. and HDR for the Ministry of Transportation SOCIO-ECONOMIC PROFILE -
Urbanisation and Migration in Africa Joseph Teye Centre for Migration Studies University of Ghana
 Urbanisation and Migration in Africa Joseph Teye Centre for Migration Studies University of Ghana Expert Group Meeting, United Nations Headquarters in New York, 1-2 November, 2018 Introduction Migration
Reducing vulnerability and building resilience what does it entail? Andrew Shepherd, Chronic Poverty Advisory Network, Overseas Development
 Reducing vulnerability and building resilience what does it entail? Andrew Shepherd, Chronic Poverty Advisory Network, Overseas Development Institute, London Expert Group Meeting on Strengthening Social
Poverty in the Third World
 11. World Poverty Poverty in the Third World Human Poverty Index Poverty and Economic Growth Free Market and the Growth Foreign Aid Millennium Development Goals Poverty in the Third World Subsistence definitions
DIVERSITY IN RURAL INCOMES ISSUES AFFECTING ACCESS AT HOUSEHOLD LEVEL
 DIVERSITY IN RURAL INCOMES ISSUES AFFECTING ACCESS AT HOUSEHOLD LEVEL This presentation covers How/why poor rural people diversify incomes Factors affecting poor people s access to non-farm employment
How s Life in Portugal?
 How s Life in Portugal? November 2017 Relative to other OECD countries, Portugal has a mixed performance across the different well-being dimensions. For example, it is in the bottom third of the OECD in
Contents. List of Figures List of Maps List of Tables List of Contributors. 1. Introduction 1 Gillette H. Hall and Harry Anthony Patrinos
 Contents List of Figures List of Maps List of Tables List of Contributors page vii ix x xv 1. Introduction 1 Gillette H. Hall and Harry Anthony Patrinos 2. Indigenous Peoples and Development Goals: A Global
Developing a Regional Core Set of Gender Statistics and Indicators in Asia and the Pacific
 Developing a Regional Core Set of Gender Statistics and Indicators in Asia and the Pacific Preparatory Survey Questionnaire REGIONAL CONSULTATIVE WORKSHOP TO DEVELOP A FRAMEWORK AND CORE SET OF GENDER
How s Life in Iceland?
 How s Life in Iceland? November 2017 In general, Iceland performs well across the different well-being dimensions relative to other OECD countries. 86% of the Icelandic population aged 15-64 was in employment
Town of Niagara-on-the-Lake Official Plan Review Growth Analysis Technical Background Report
 Town of Niagara-on-the-Lake Official Plan Review Growth Analysis Technical Background Report In association with: October 16, 2015 Contents Page Executive Summary... (i) 1. Introduction... 1 2. Population,
Urbanization and Rural-Urban Migration: Theory and Policy
 Urbanization and Rural-Urban Migration: Theory and Policy In this unit we would: 1.1 Examine the potential role of cities both modern sector and urban informal sector-in fostering economic development
Social and Economic Indicators
 Social and Economic Indicators February, 2004 1 Overview SSP Vision and Goals How do we measure progress Indicators what, why, who Key indicators for social and economic development 2 SSP Vision Healthy,
A Snapshot of Drinking-water and Sanitation in the Arab States 2010 Update
 A Snapshot of Drinking-water and in the Arab States 2010 Update A regional perspective based on new data from the WHO/UNICEF Joint Monitoring Program for Water Supply and UNICEF/NYHQ200-0016/Iyad El Baba,
How s Life. in the Slovak Republic?
 How s Life October 2015 in the Slovak Republic? Additional information, including the data used in this country note, can be found at: www.oecd.org/statistics/hows-life-2015-country-notes-data.xlsx HOW
The People Matter. The State of the Population in the Eastern Cape. Edited by Monde B. Makiwane and Dan OD Chimere-Dan
 The People Matter The State of the Population in the Eastern Cape Edited by Monde B. Makiwane and Dan OD Chimere-Dan 2010 Research and Population Unit Eastern Cape Department of Social Development The
Green Paper on Policing. Portfolio Committee on Police 23 July 2013
 Green Paper on Policing Portfolio Committee on Police 23 July 2013 CIVILIAN CIVILIAN SECRETARIAT SECRETARIAT FOR FOR POLICE POLICE Background to Green Paper Process The Green Paper was advertised for public
2015: 26 and. For this. will feed. migrants. level. decades
 INTERNATIONAL DIALOGUE ON MIGRATION 2015: CONFERENCE ON MIGRANTS AND CITIES 26 and 27 October 2015 MIGRATION AND LOCAL PLANNING: ISSUES, OPPORTUNITIES AND PARTNERSHIPS Background Paper INTRODUCTION The
The Poor in the Indian Labour Force in the 1990s. Working Paper No. 128
 CDE September, 2004 The Poor in the Indian Labour Force in the 1990s K. SUNDARAM Email: sundaram@econdse.org SURESH D. TENDULKAR Email: suresh@econdse.org Delhi School of Economics Working Paper No. 128
Trends in Poverty and Inequality in Decentralising Indonesia
 Trends in Poverty and Inequality in Decentralising Indonesia Riyana Miranti, Yogi Vidyattama, Erick Hansnata, Rebecca Cassells and Alan Duncan NATSEM, University of Canberra Presentation to the Working
How s Life in Belgium?
 How s Life in Belgium? November 2017 Relative to other countries, Belgium performs above or close to the OECD average across the different wellbeing dimensions. Household net adjusted disposable income
Panel 1: Multidimensional Poverty Measurement: Uses for a New Understanding of the Meaning of Poverty and Deprivation
 Panel 1: Multidimensional Poverty Measurement: Uses for a New Understanding of the Meaning of Poverty and Deprivation Jeni Klugman, Director of Human Development Report Office (UNDP) Some insights from
Jean-Luc Richard Université de Rennes 1 - Rennes, France
 Jean-Luc Richard Université de Rennes 1 - Rennes, France Life Course Perspective and the Study of Integration in France We need longitudinal data. Why? -France is a country where there are no national
The CDB-based Poverty and Select CMDGs Maps and Charts
 An unofficial research report of the Ministry of Planning with support from the United Nations Development Programme, Cambodia. The publication contains findings of the Commune Database analysis and is