POVERTY AND INEQUALITY
|
|
|
- Kathryn McLaughlin
- 5 years ago
- Views:
Transcription

1 GCRO RESEARCH REPORT # NO. 09 POVERTY AND INEQUALITY IN THE GAUTENG CITY-REGION JUNE 2018 Researched and written by Darlington Mushongera, David Tseng, Prudence Kwenda, Miracle Benhura, Precious Zikhali and Phindile Ngwenya
2 A PARTNERSHIP OF POVERTY AND INEQUALITY IN THE GAUTENG CITY-REGION ISBN: Researched and written by: Darlington Mushongera, David Tseng, Prudence Kwenda, Miracle Benhura, Precious Zikhali and Phindile Ngwenya Design: Breinstorm Brand Architects Cover image: Gareth Pon Copyright 2018 Gauteng City-Region Observatory Published by the Gauteng City-Region Observatory (GCRO), a partnership of the University of Johannesburg, the University of the Witwatersrand, Johannesburg, the Gauteng Provincial Government and organised local government in Gauteng (SALGA).
3 Poverty and inequality in the Gauteng City-Region

4 Photograph by Clive Hassall CONTENTS Introduction: Structure and overview of the report Darlington Mushongera Part 1: Poverty and inequality in the Gauteng City-Region: An income and expenditure analysis David Tseng Part 2: Labour market inequalities in the Gauteng City-Region Prudence Kwenda and Miracle Benhura Part 3: A Multidimensional Poverty Index (MPI) for Gauteng: Evidence from Quality of Life Survey data Darlington Mushongera, Precious Zikhali and Phindile Ngwenya 002
5 003

6 Photograph by Gareth Pon 004
7 005
8 POVERTY AND INEQUALITY IN THE GAUTENG CITY-REGION Introduction Structure and overview of the report DARLINGTON MUSHONGERA 1. Aim of the report Poverty and inequality are legacies of apartheid that continue to plague the South African society in spite of deliberate attempts by government to reverse this legacy. Why do poverty and inequality continue to be major developmental challenges in South Africa? To what extent have government efforts since 1994 contributed towards alleviating poverty and lessening inequality? What can local governments do, at their level, in order to make significant progress towards reducing both poverty and inequality? These are some of the questions that are being asked today in South Africa, more than 20 years after attainment of democratic rule in This report seeks to answer these questions from three different perspectives: (i) an income and expenditure analysis; (ii) a labour market inequality analysis; and (iii) a multidimensional poverty analysis. The scale of analysis is provincial, with a focus on Gauteng. The report provides an in-depth understanding of poverty and inequality in Gauteng in terms of patterns, drivers and changes over time. Some policy insights are also suggested. There are three parts to the report, each of which is a self-contained piece. 2. Main sections PART 1 provides an analysis of poverty and inequality from an income and expenditure perspective. The paper has two main objectives. The first is to give an overview of changes in poverty and income inequality in Gauteng for the 15-year period between 1995 and An examination of the relationship between economic growth, poverty and inequality over the same period is also presented. The second objective is to assess the impact of government provided social grants on income inequality and poverty in the province. The data used in the analysis are from Statistics South Africa s Income and Expenditure Survey (Stats SA IES) for 1995, 2000, 2005, and In order to ensure comparability between the respective surveys, adjusted cross-entropy weights were applied. PART 2 focuses on inequalities in the labour market over the period and uses data from Stats SA s Labour Force Survey and the Quarterly Labour Force Survey from 1995 to The main objective of the paper is to generate and explain a profile series of inequalities in the labour market based on labour force data. Important variables considered include race, gender and education. Particular attention is given to how these characteristics result in segmentation and discrimination in the labour market, ultimately generating income inequalities. IN PART 3, the authors use the Gauteng City-Region Observatory (GCRO) Quality of Life (QoL) Survey data for 2011 and 2013 to generate a Multidimensional Poverty Index for Gauteng (GMPI). The index was developed along the same lines as 006

9 STRUCTURE AND OVERVIEW OF THE REPORT The report provides an indepth understanding of poverty and inequality in Gauteng in terms of patterns, drivers and changes over time. Photograph by Seth van Staden 007
10 POVERTY AND INEQUALITY IN THE GAUTENG CITY-REGION the South African Multidimensional Poverty Index (SAMPI) by Stats SA and follows the Alkire-Foster methodology of multidimensional poverty analysis. QoL data can be disaggregated down to ward level. The authors were able to map their results by ward thereby showing the spatial variation in the GMPI across the different wards. Small area analyses such as this one provide invaluable knowledge that helps local municipalities in targeting areas with the most need. 3. Key findings Each of the three papers generated a set of findings about poverty and inequality in Gauteng and in spite of the different approaches and datasets used, the findings resonate with each other, confirming the nature and pattern of poverty and inequality in the province. Part 1: Income and expenditure analysis In both absolute and relative terms (regardless of the choice of the poverty line), poverty has fallen at the aggregate level and for Africanheaded households. However, race and gender remain the overwhelming markers of poverty in the province, with the poverty rate ratio for African to white almost 40:1, and female to male 2:1. Inequality trends suggest that Gauteng was most unequal in the first five years of democracy. Inequality then moderated slightly, but it has been statistically the same since However, there is evidence to show that the source of inequality has shifted from between racial groups to within groups, a trend that also applies nationally. An analysis of the nature of economic growth since 1995 suggests that individuals at the top end of the distribution gained most from the post-apartheid growth dividend, irrespective of race group. Although the democratic growth model is crafted around providing substantial redistributive income support to the bottom end of the distribution through an extensive social grant programme, the growth returns are still unbalanced. When inequality measures were estimated using income instead of expenditure the results clearly illustrated the importance of social grants as a source of income, and how social transfers have offset potentially greater increases in income inequality over the period 1995 to However, expecting such large-scale expansion of the social security net to reverse engineer the growth pattern and induce pro-poor growth is not viable as a policy option. Interventions to increase productivity for the poor and the unskilled, particularly those aimed at job creation through competitiveness, are most needed. Part 2: Labour market analysis There are no significant differences in labour force participation (LFP) rates across race, but significant differences exist by gender and age. The proportion of women participating in the labour force is lower than men, suggesting that this subgroup still faces some constraints that prohibit labour force participation. The same applies to youth (15-35 year olds) compared to older individuals; fewer youth are participating in the labour force relative to adults. While it is reassuring that all racial groups have almost similar participation rates, there are marked differences across race with regards to employment, distribution across sectors (i.e. formal vs informal) and occupation. Results indicate that unemployment is most prevalent among Africans, followed by coloureds, Indians/Asians and then whites. Education is also an important factor determining employment employment rates are high for those with higher levels compared to those with lower levels. There is a large proportion of Africans in 008
11 STRUCTURE AND OVERVIEW OF THE REPORT elementary jobs (i.e. in legislative, managerial and professional occupations) relative to whites. This situation barely improved despite initiatives to address the skewed distribution of labour market opportunities. Decomposition results show that the racial gap in employment is largely explained by Africans and coloureds having lower observed characteristics such as education, hence their disadvantage. Policies to improve human capital among Africans and coloureds could go a long way in reducing the racial inequities in employment that exist in Gauteng. Employment in the formal sector has been declining over time while informal employment has been rising. This decline has important implications for the welfare of workers and for inequality. While a growing informal sector can be a source of employment, the wages within this sector are meagre and therefore increase income inequality between formal and informal sector employees. In view of this, job creation initiatives must be aimed at promoting the creation of decent jobs. The large gap in formal employment between whites and Africans is mainly explained, suggesting that whites have superior (human capital) characteristics enabling them to enter formal employment relative to Africans. Again, this result calls for policies aimed at developing human capital among Africans to allow them to access better forms of employment. This study has a number of limitations. The dataset used does not allow for detailed disaggregation by location within Gauteng, which leaves the door open for future studies to provide a more complete picture at local level. Part 3: Multidimensional poverty analysis Multidimensional poverty was found to be correlated with income poverty, i.e. not only are households that are income poor more likely to be multidimensionally poor, they also suffer from higher intensities of poverty. The results highlight the interconnectedness between infrastructural development and socio-economic indicators. Specifically, being deprived in one multidimensional poverty indicator is associated with a higher likelihood of being deprived in other indicators. Spatially, multidimensional poverty tends to be highest in areas that have low economic activity and these areas happen to be located at the edges of the province, e.g. Westonaria and Merafong City. This indicates the disadvantage of being further away from the three metro regions (Johannesburg, Tshwane and Ekurhuleni) where economic activities are concentrated. This is a policy challenge given the finding that the unemployment indicator is the largest contributor to the overall GMPI. Although between 2009 and 2013 there was a fast decline in the incidence of households with none of the members working, the relative contribution of this indicator to the overall GMPI increased during this period. This raises questions about the ability of current investment patterns to create jobs and subsequently foster socio-economic development in outlying areas. Multidimensional poverty is, however, not restricted to areas located at the edges of the province: even in the three highest performing metro regions, pockets of severe multidimensional poverty prevail. Clear examples include Alexandra, Diepsloot and Tembisa. This is indicative of high infrastructural inequalities within these metro regions suggesting the need for local municipalities to channel more investments into lagging areas. The study also highlights that the role of mining in socio-economic development is not clearcut, e.g. Westonaria has high multidimensional poverty rates despite its heavy reliance on mining activities. It is, therefore, not apparent that mining contributes to socio-economic development in Westonaria. In sum, this analysis underscores the heterogeneity of communities and suggests that more in-depth analyses of developmental challenges at localised levels are needed to improve the effectiveness of evidence-based planning. This way, government is able to customise interventions that take into account these 009


12 POVERTY AND INEQUALITY IN THE GAUTENG CITY-REGION heterogeneities and continually improve the targeting of policy interventions. Finally, given that the different indicators of multidimensional poverty are related to services provision that falls under the mandate of the different spheres of government, an integrated approach to service delivery is a key factor in the reduction of multidimensional poverty in Gauteng. 4. Concluding remarks These analyses have highlighted the following key issues: The need for small area analyses of poverty and inequality that allow the results to be more relevant for and usable by local municipalities whose programmes have more direct impact on communities. Education as a means of building human capital needs to be up-scaled and made more effective as this is a key determinant in labour force participation. Economic opportunities are desperately needed, particularly in outlying areas. More effort is needed to harness Gauteng s economic progress towards alleviating poverty and increasing opportunities to lift the poor out of poverty traps. Migration is a significant feature of South Africa and of Gauteng, in particular; future research needs to explain how this factor is impacting on the levels of poverty and inequality in the province. 010

13 STRUCTURE AND OVERVIEW OF THE REPORT 011

14 Photograph by GCRO 012
15 013
16 POVERTY AND INEQUALITY IN THE GAUTENG CITY-REGION Part 1 Poverty and inequality in the Gauteng City-Region: An income and expenditure analysis DAVID TSENG Abstract In this section we examine the poverty and inequality outcomes for Gauteng province during its first 15 years of democracy. Despite recording one of its longest periods of positive economic growth in the country s history since the end of apartheid in 1994, we find a significant increase in the poverty rate in the first five years of democracy, followed by a consistent, significant improvement in the welfare of Gauteng residents in the ten-year period between 2000 and 2010, both at the aggregate level and for Africans. Similarly, inequality increased dramatically between 1995 and 2000, and has remained high since. Examining the interactions between growth, poverty and inequality further reveals that despite substantial redistributive efforts made by government, specifically through the social grant system, there is little evidence that so-called pro-poor growth exists in Gauteng. Keywords: poverty, inequality, social grants, Gauteng 1. Introduction The first 15 years of the post-apartheid era in the South African economy are comprised of a mixture of both economic successes and disappointments. On the one hand, the economy recorded one of its longest periods of positive economic growth in the country s history until the global financial crisis of For the period 1994 to 2008 (inclusive of the early recession in 2008) South Africa s annual growth in real gross domestic product (GDP) averaged 3.6 percent per annum and 3.3 percent for the period 1994 to 2010 (Statistics South Africa (Stats SA), 2013). On the other hand, the economy is facing high rates of unemployment, devastating income poverty and one of the most (if not the most) unequal societies in the world. The aim of this study is to provide an overview of the poverty and inequality outcomes, as well as the interactions with economic growth, in one of the vital economic hubs in South Africa and a commercial gateway to Africa: Gauteng province. This study has two main objectives. The first objective is to provide an overview of the changes in poverty and inequality for Gauteng over the 15-year period from 1995 to This also includes examining the relationship between economic growth, poverty and inequality over the same period. The second objective of the study is to review the impact of the South African government s provision of social grants on income poverty and inequality in the province. The structure of the study is as follows: Section 2 provides an overview of the shifts in income poverty and inequality between 1995 and The relationship between economic growth, poverty and inequality is examined in 014

17 PART 1: POVERTY AND INEQUALITY IN THE GAUTENG CITY-REGION... we find a significant increase in the poverty rate in the first five years of democracy, followed by a consistent, significant improvement in the welfare of Gauteng residents in the ten-year period between 2000 and Photograph by Bianca van Heerden 015
18 POVERTY AND INEQUALITY IN THE GAUTENG CITY-REGION Section 3, specifically by evaluating how growth in the income and expenditure of the poor has fared relative to the rich over the review period. In Section 4 the impact of social assistance by government on poverty and inequality will be analysed, and Section 5 concludes. 2. Poverty and inequality: A 15-year review 2.1 Data The dataset utilised in the analysis is an adjusted and combined dataset of all National Income and Expenditure Surveys (IES): The Post-apartheid Income and Expenditure Surveys (or PIES for short). The IES is a national household sampled survey that is conducted quinquennially to capture the incomes earned, as well as the amounts spent on goods and services by a household. The detailed, cross-sectional information collected is used to calculate and update the weights of the basket of goods and services for deriving the Consumer Price Index, which makes it a useful source of data for measuring nuanced poverty and inequality of households of various income sources and expenditure areas. The main proxy indicator used for measuring welfare in the study is the per capita household expenditure, except in Section 4 where per capita household income is used for investigating the impact of social grant incomes. For both measures, total household income and expenditure have been adjusted for household size in order to derive the per capita measures. It is noteworthy that consumption expenditure is often accepted as the more appropriate measure of welfare for at least three reasons: (i) actual consumption is more closely related to current basic needs, whereas income is only one of the elements which allow access to these goods and services; (ii) consumption is a superior measure for welfare in societies where a large proportion of the population is unemployed and their income may be hard to measure in monetary terms; and (iii) expenditure is a measure for welfare controls for unobserved wealth gaps such as savings and ability to access credit (Meyer and Sullivan, 2003). 2.2 Shifts in poverty: Table 1 presents the poverty rate 1 and poverty gap 2 for Gauteng from 1995 to 2010, in five-year increments, by race group, using both the upper-bound and lower-bound poverty lines. The poverty rate is the proportion of people living under the poverty line. The two standard poverty lines are R577 (upper-bound) and R416 (lower-bound) per person per month, both in March 2009 prices (Stats SA, 2013). The poverty gap essentially reflects the depth of poverty relative to the poverty line. These poverty measures have been calculated using per capita household expenditure based on the standard Foster, Greer and Thorbecke (FGT) class of poverty measures (Foster et al., 1984) The poverty rate is the ratio of the number of people who fall below the poverty line and the total population. 2. The average shortfall of the total population from the poverty line. 3. The Foster Greer Thorbecke indices are a class of poverty metrics, the most commonly used analytical indices in the literature to investigate poverty. The index essentially puts more weight on the poverty levels of the poorest individuals as the power of the index increases. See Foster et al. (1984) for further details. 016
19 PART 1: POVERTY AND INEQUALITY IN THE GAUTENG CITY-REGION Table 1: Poverty shifts by race of household head, Headcount rate (percent) Poverty gap ratio (percent) R577 a month poverty line (March 2009 prices) African Coloured Indian/Asian White Total R416 a month poverty line (March 2009 prices) African Coloured Indian/Asian White Total DATA SOURCE: Stats SA IES 1995, 2000, 2005 and 2010, own calculations. NOTES: (a) Cross-entropy weights are assumed for 1995 IES and sampling design weights for (b) Highlighted means statistically significant at the 95 percent confidence interval of the 5-year change; bolded numbers are statistically significant over the 10-year change between 2000 and 2010; underscored numbers are statistically significant over the 15-year change between 1995 and At the aggregate, poverty (both in absolute and relative terms) increased dramatically in the first five years of democracy between 1995 and 2000, regardless of the chosen poverty line. More specifically, at the upper-bound poverty line of R577 per person per month, poverty as measured by the headcount rate increased from 23.2 percent to 39.7 percent, while the poverty gap rose from 8 percent to 17 percent during the first five years of democracy. Both changes are statistically significant at the 95 percent confidence interval. Since 2000, there has been a modest, yet consistent improvement in welfare for households living in Gauteng province, particularly between 2000 and 2005 when the poverty headcount decreased to 34 percent in 2005 compared to 39.7 percent in The poverty gap ratio (i.e. relative poverty) also fell to 12.9 percent in 2005 from 17 percent in Although the 15-year change between 1995 and 2010 at the upper poverty line showed no significant change (or increase in the mean), and a significant increase in the poverty gap measure, the 10-year shift between 2000 and 2010 showed that both the poverty rate and the poverty gap decreased significantly to 29.2 percent for the headcount rate and 11.4 percent for the poverty gap ratio. The changes in poverty using the lower-bound poverty line show similar results as the upper-bound poverty line. However, by 2010 both the poverty 017
, but")
20 POVERTY AND INEQUALITY IN THE GAUTENG CITY-REGION Photograph by Mikey Rosato rate and relative poverty were above 1995 levels regardless of the poverty line used, indicating that poverty had worsened. By race, it is clear that individuals living in Gauteng as part of African-headed households not only remain the most deprived group in terms of welfare (evidently from the apartheid legacy), but they have also experienced the most significant 5-year changes during the 15-year period under review. At the upper-bound poverty line (i.e. R577 in 2009 prices) poverty as measured by the headcount rate remained statistically the same over the 15-year period of democracy between 1995 and However, in the last decade ( ) of this period, African-headed households experienced significant improvements in welfare. Results by racial group in Table 1 indicate that the headcount poverty rate for African-headed households increased significantly from 31.8 percent in 1995 to 50.3 percent in 2000, then decreased to 42.5 percent in 2005 and 37.8 percent in The poverty gap exhibits a similar trend as it first increased from 11 percent in 1995 to 21.5 percent during the first five years of democracy, then declined to 16.3 percent in 2005 and then fell to 14.7 percent in At the lower-bound poverty line of R416 (in 2009 prices) both poverty rates, as measured by the headcount rate and the poverty gap ratio, suggest a significant increase in poverty for African-headed households from 18.2 percent to 34.2 percent during the first five years of democracy. In 2005, the poverty rate was at 28 percent and it fell to 24.4 percent in Ultimately, the 10-year change since the millennium shows that poverty declined significantly at the 95 percent confidence interval. Similarly, for relative poverty, the poverty gap increased from 5.6 percent in 1995 to 13.3 percent in 2000, and then decreased to 8.7 percent and 8.6 percent in 2005 and 2010, respectively. The significant increases for both poverty measures at the lower poverty line and the poverty gap ratio at the higher poverty line suggest that those entrenched in deeper poverty in Gauteng experienced a relative decline in their welfare during the first 15 years of democracy. While Africans residing in Gauteng generally did not become either better or worse off over the 15-year period, they remained the poorest racial group in the province in terms of both absolute and relative measures of poverty and at both lines, for all years analysed. For example, in 2010 at the upper poverty line the overall headcount rate was 29.2 percent while that of Africans was almost 9 percentage points higher at 37.8 percent. Individuals living in households headed by other race groups were found to be not only better off in terms of poverty compared to those living in African-headed households for both poverty measures, at both lines, for all years, but they also did not experience any significant change over the period under review. The coloured population in Gauteng had an average poverty rate over the period of 24.9 percent and a poverty gap of 7.9 percent at the upper poverty line. The poverty rate for Indians/ Asians averaged at 6 percent over the period and 2.5 percent for the poverty gap. The population group that was least poor in Gauteng was the white population, at an average poverty headcount rate of 1.1 percent and a relative poverty rate of 0.4 percent over the period under review. Similar to the trend over the 15-year period (1995 to 2010) by race, poverty (headcount and gap ratio) increased notably between 1995 and 2000, but decreased consistently (as well as significantly for the most part) between 2000 and 2010, resulting in no change in welfare overall for both male and female-headed households in the province. Despite this, gender remains a key determinant of poverty. Individuals living in households headed by females remained more deprived in both absolute and relative terms, for all years, at both poverty lines. More specifically, in 2010, while 23 percent of individuals living in male-headed households were classified as poor, 42 percent of those living in female-headed 018
21 PART 1: POVERTY AND INEQUALITY IN THE GAUTENG CITY-REGION Table 2 below shows the changes in both poverty headcount rate and poverty gap ratio by gender for both upperbound and lower-bound poverty lines in Gauteng. Table 2: Poverty shifts by gender of household head, Headcount rate (percent) Poverty gap ratio (percent) R577 a month poverty line (March 2009 prices) Male Female R416 a month poverty line (March 2009 prices) Male Female DATA SOURCE: Stats SA IES 1995, 2000, 2005 and 2010, own calculations NOTES: (a) Cross-entropy weights are assumed for 1995 IES and sampling design weights for (b) Highlighted means statistically significant at the 95 percent confidence interval of the 5-year change; bolded numbers are statistically significant over the 10-year change between 2000 and 2010; underscored numbers are statistically significant over the 15-year change between 1995 and households were below the upper poverty line of R577 per person per month almost double the proportion of poor individuals living in male-headed households. In 2010, the poverty gap for female-headed households stood at 17.3 percent while that of maleheaded households was less than half at 8.8 percent. The change in poverty by educational attainment over the 15-year period in Gauteng reveals a decrease in market demand for individuals with less than or equal to completed matric as their highest level of qualification. In particular, household heads with primary, secondary or completed matric as their highest educational attainment in Gauteng experienced significant increases in poverty over the 15-year period between 1995 and 2010, despite a moderate decrease in poverty in the last decade, for both measures, at both lines. In contrast, groups with higher levels of qualification (certificate and above) did not experience any significant change in welfare over the same period. This may imply a degree of stability and improvement in welfare for individuals who invested in obtaining a certificate or a degree. Across the highest qualification categories, the data in Table 3 shows that households headed by someone with low levels of education face exponentially greater challenges of poverty than households with higher educational attainments, irrespective of the measures or the poverty lines. At the higher poverty line of R577 per person per month, individuals living in households headed by someone without any schooling or education have the highest incidence of poverty headcount 66 percent of individuals are classified as poor and are relatively the most deprived, with a poverty gap of 28.3 percent. The incidence of poverty is consistently differentiable and higher for household whose head has less education. At the other extreme, there is virtually no classified poverty if the household is headed by someone with a degree or higher level of education. 019
22 POVERTY AND INEQUALITY IN THE GAUTENG CITY-REGION Table 3: Poverty shifts by education of household head, Headcount rate (percent) Poverty gap ratio (percent) R577 a month poverty line (March 2009 prices) No schooling Primary (including Grade 0) Secondary (< Grade 12) Completed Grade 12 Certificate/diploma (< Grade 12) Certificate/diploma with Grade Degree or higher R416 a month poverty line (March 2009 prices) No schooling Primary (including Grade 0) Secondary (< Grade 12) Completed Grade 12 Certificate/diploma (< Grade 12) Certificate/diploma with Grade Degree or higher DATA SOURCE: Stats SA IES 1995, 2000, 2005 and 2010, own calculations NOTES: (a) Cross-entropy weights are assumed for 1995 IES and sampling design weights for (b) Highlighted means statistically significant at the 95 percent confidence interval of the 5-year change; bolded and underscored numbers are statistically significant over the 15-year change. 020

23 PART 1: POVERTY AND INEQUALITY IN THE GAUTENG CITY-REGION Photograph by Amanda van der Walt 2.3. Poverty shifts without poverty lines The estimates presented above show that at the aggregate, the differences for both the headcount rate and the poverty gap ratio over the 15-year period when using the two chosen poverty lines are mostly statistically negligible. However, this type of static poverty measurement of the FGT class is often criticised for being too dependent on arbitrarily chosen poverty lines. Simply put, these poverty measures do not, for instance, tell us anything about those consuming far below the poverty line and those that spend high above it the poorest of the poor and the rich beyond the extravagant. One way of avoiding such dependence when examining the changing pattern of poverty and not be hamstrung by debates around the choice of the poverty line is by deriving the cumulative distribution functions (CDFs), essentially a visual representation of the population s per capita expenditure. Figure 1 presents the CDFs for Gauteng province for 1995, 2000, 2005 and 2010 at per capita expenditures less than or equal to R1 500, in real prices. The vertical axis of the CDF shows the cumulative proportion of all individuals with a monthly per capita expenditure value less than or equal to the corresponding monthly per capita expenditure value on the horizontal axis. CDFs allow us to compare changes in poverty between two time periods independent of any feasible poverty line. Visually, if a CDF for period t+1 lies at any point on the horizontal axis below the CDF for period t, it means that poverty has decreased between the two periods irrespective of any specific poverty line. 021
24 POVERTY AND INEQUALITY IN THE GAUTENG CITY-REGION In particular, Africans, females and those with low levels of education have the highest rates of poverty and widest gap for relative poverty. Figure 1: CDF of per capita household income for Gauteng: CUMULATIVE PROPORTION PER CAPITA HOUSEHOLD PCREXP_TOTAL (MONTHLY) YEAR SOURCE: Stats SA IES 1995, 2000, 2005 and 2010, own calculations NOTE: (a) Cross-entropy weights are assumed for 1995 IES and sampling design weights for
25 PART 1: POVERTY AND INEQUALITY IN THE GAUTENG CITY-REGION The two vertical lines represent the two poverty lines used in the study thus far. The positions of the CDFs confirm the steady decrease in the levels of poverty from 2000 through to 2010 between per capita monthly expenditures of 0 to R1 500 per month. Visually, the cumulative proportion of poverty was clearly at its peak in 2000 and lowest in It is clear from the positions of the CDFs that first order dominance holds for the recent decade and for the most part since 2000, over the entire range below R1 500 per capita expenditure a month. However, we cannot speak with statistical confidence about the changes in household poverty levels using household expenditure data over the period due to the fact that the 1995 CDF is only slightly higher than the 2010 CDF. In sum then, when measured by the headcount rate and the poverty gap, for the 15-year change, poverty neither improved nor worsened in any significant way. However, during this period, the average welfare of individuals residing in Gauteng deteriorated dramatically in the first five years of democracy (as seen by the steep rise in the CDFs), and has improved consistently since. In particular, both at the aggregate and relative level, welfare has improved significantly over the 10-year period for African-headed households. The same trend is observed regardless of gender, which shows impressive improvement in welfare over the later 10-year period. In terms of education, the only groups that experienced relatively no change during the 15-year period were those with certificates/diplomas or higher degrees. Those with matric or less as their educational qualifications all experienced rising poverty and deterioration in welfare. However, despite these trends the legacy of apartheid persists in today s socio-economic landscape of Gauteng. In particular, Africans, females and those with low levels of education have the highest rates of poverty and widest gap for relative poverty Shifts in inequality: Recent literature suggests that South Africa is one of the most unequal societies in the world. Based on post-2000 data, the trends in income inequality for South Africa have consistently pointed to a sharp rise in the Gini coefficient, using various measures of income and expenditure across a series of nationally representative surveys. For example, Bhorat and Van der Westhuizen (2011) found that the Gini coefficient, calculated using per capita expenditure estimates from the 1995 and 2005/06 IES, increased from 0.64 in 1995 to 0.69 in Using alternative datasets and per capita income as proxy, Leibbrandt et al. (2009) found that the Gini coefficient for South Africa increased from 0.66 in 1993 to 0.70 in While these estimates were slightly different, the trends were similar. This evidence for post-apartheid South Africa confirms the fact that the country is one of the most unequal in the world. Focusing on Gauteng, the results in Table 4 below suggest a similar trend in inequality. Based on per capita household expenditure as the measure of welfare, the data show that inequality in the province increased significantly from 0.59 in 1995 to 0.72 in The upward trend persisted until 2005 with the Gini coefficient at 0.74, before declining to 0.68 in It is crucial to note, however, that only the first 5-year change in inequality was statistically significant at the 95 percent confidence interval. 023
26 POVERTY AND INEQUALITY IN THE GAUTENG CITY-REGION Table 4: Inequality shifts (Gini coefficients for 1995, 2000, 2005 and 2010) Total by gender Male Female by race African Coloured Indian/Asian White by education No schooling Primary (including Gr 0) Secondary (< Gr 12) Completed Gr Certificate/diploma (< Gr 12) Certificate/diploma (= Gr 12) University degree DATA SOURCE: Stats SA IES 1995, 2000, 2005 and 2010, own calculations NOTES: (a) Cross-entropy weights are assumed for 1995 IES and sampling design weights for (b) Highlighted means statistically significant at the 95 percent confidence interval of the 5-year change; bolded numbers are statistically significant over the 10-year change between 2000 and 2010; underscored numbers are statistically significant over the 15-year change between 1995 and Both male-and female-headed households experienced similar movements in inequality over the 15-year period. Inequality among male-headed households increased dramatically after the first five years of democracy from 0.57 to There was a significant increase in the inequality experienced by female-headed households between 2000 and 2005 from 0.67 to However, in 2010, inequality experienced by individuals living in both male- and female-headed households declined to Inequality as measured by the Gini coefficient by race shows that only Africans and whites experienced a significant change in inequality over the 15-year period ( ) after the first five years of democracy. The increase in inequality in the first five years of democracy after 1995 was the most 024
27 PART 1: POVERTY AND INEQUALITY IN THE GAUTENG CITY-REGION significant for both Africans and whites from 0.50 to 0.67 and 0.43 to 0.57, respectively. Inequality among African households was also the highest compared to all other racial groups throughout the review period. In terms of education, results show that inequality spiked in the first five years of democracy but declined at the means in Interestingly though, households headed by individuals with certificates/diplomas (with matric) and university degrees/higher qualifications did not experience any notable volatility in terms of inequality over the entire 15-year period under review. Overall, the levels of per capita expenditure inequality for Gauteng increased significantly in the first few years of the post-apartheid era, and reached a peak in The same trend was seen irrespective of gender, race and education (except for those with certificates/diplomas, with matric and higher degrees as the highest qualification). Although inequality in the province decreased between 2005 and 2010 in the mean, the change was not significant enough for statistical certainty. In relative terms among categories, the results suggest again that inequalities are prevalent among individuals living in female-headed, African households, and for those with low to medium levels of education (below certificate with less than matric as their highest educational attainment) Inequality within and between race groups In the South African context, because of the policy of apartheid, inequality between racial groups rather than within has always been a significant driver of aggregate inequality (Leibbrandt, Woolard and Bhorat, 2001). However, studies using the 1996 and 2001 Census data, or the 1995 and 2000 IES data, found an increase in the contribution of within-group inequality to total inequality over time driven to a large extent by increasing inequality within the African population (Hoogeveen and Özler, 2006; Leibbrandt et al., 2005). Table 5 presents inequality results for Gauteng using the Theil-T Index. The index is well-known for its decomposable capability when measuring inequality within and between groups. Table 5: Inequality within and between race groups 1995, 2000, 2005 and Total inequality (Theil-T) % % % % Within-group component % % % % African % % % % Coloured % % % % Indian/Asian % % % % White % % % % Between-group component % % % % DATA SOURCE: Stats SA IES 1995, 2000, 2005 and 2010, own calculations NOTES: (a) Cross-entropy weights are assumed for 1995 IES and sampling design weights for (b)highlighted means statistically significant at the 95 percent confidence interval of the 5-year change; bolded numbers are statistically significant over the 10-year change between 2000 and 2010; underscored numbers are statistically significant over the 15-year change between 1995 and
28 POVERTY AND INEQUALITY IN THE GAUTENG CITY-REGION The results suggest that over the 15-year period between 1995 and 2010 the contribution of withingroup inequality to total inequality increased from 0.41 (61.3 percent) of the total 0.66 for the Theil-T Index in 1995 to 0.74 (72.1 percent) of the total Theil-T at 1.03 in 2010; consequently, inequality between racial groups declined from 0.26 (or 39.4 percent of total contribution towards inequality) in 1995 to 0.29 (28.2 percent) of the total Theil-T measurement in Results also show that the within-group inequalities for the African and white population groups have been the dominant force for increasing inequality in the province over the 15-year period with the African group contributing from 21.5 percent to 44.8 percent and the white group contributing from 29.5 percent to 32.1 percent of the total inequality. Thus the key driver of per capita expenditure inequality over the longer period since 1995 in Gauteng has in fact been within-groups inequality and not between-groups. This is a crucial result. It suggests a different result, contrary to the perception inherited from the apartheid era that between-groups inequality ought to be the main driver of the welfare differences in the post-apartheid period since To conclude, the data show a consistent decline in poverty levels for the 10-year period between 2000 and 2010 at the aggregate level, and specifically for the African population, at both poverty lines for Gauteng. The estimates for the Gini coefficient, however, suggest that inequality remained high. Finally, our analysis of the drivers of inequality suggests that it is in fact not the betweenrace inequality which has been the key driver of Gauteng s rising misdistribution of welfare since 1995, but rather a growing disparity within the different racial groups, particularly among African and white groups. 3. Economic growth, poverty and inequality The standard FGT class of poverty measures, the Gini coefficient and the Theil-T measures of inequality, are very useful in understanding shifts in poverty and inequality, between 1995 and However, it is important to also estimate how the growth in the expenditures of poor households shifted relative to richer households over the same period. In the following section we therefore examine growth rates at various points across the expenditure distribution. As a starting point for this analysis we use Growth Incidence Curves (GICs) to examine the growth in expenditures over the period, according to a set of covariates. Methodologically, we draw on the work of Ravallion and Chen (2003) and Ravallion (2004). The GIC approach allows us to determine whether the growth in expenditure from 1995 to 2010 has been pro-poor, by plotting expenditure growth rates across each percentile of the distribution. For validity and completeness, all the GICs were calculated using both expenditure and income as the proxies for welfare. Although the GIC approach is extremely useful in determining the distributional nature of growth, it has some technical drawbacks that should be mentioned upfront. In the absence of panel data, it is a rather aggregate measure over a given distribution and does not track individual movements in and out of poverty during the review period. In addition, the GIC is sensitive at the tail of the percentiles, where it may show high volatility in growth rates between the two periods due to measurement or sampling errors in the independent IES. Below we examine the GIC for the period 1995 to 2010 according to a set of covariates. Essentially, the GIC approach allows us to determine whether growth in real per capita expenditure/income in this period has been pro-poor in nature by plotting the growth in income across each percentile of the distribution. 026

29 PART 1: POVERTY AND INEQUALITY IN THE GAUTENG CITY-REGION Photograph by Amanda van der Walt 027
30 POVERTY AND INEQUALITY IN THE GAUTENG CITY-REGION Figure 2: Income and expenditure GICs for Gauteng: GROWTH IN REAL PER CAPITA EXPENDITURE GROWTH INCIDENCE CURVE: GAUTENG PROVINCE POOREST P% RANKED BY PCREXP_TOTAL GROWTH IN REAL PER CAPITA INCOME GROWTH INCIDENCE CURVE: GAUTENG PROVINCE POOREST P% RANKED BY PCREXP_TOTAL 95% Confidence interval Growth rate in mean Median spline Mean of growth rates SOURCE: Development Policy Research Unit: The PIES 028
31 PART 1: POVERTY AND INEQUALITY IN THE GAUTENG CITY-REGION Growth rates Expenditure Income Mean Median Mean percentile Corresponding 10th percentile th percentile th percentile th percentile th percentile DATA SOURCE: Stats SA IES 1995, 2000, 2005 and 2010, own calculations NOTE: (a) Cross-entropy weights are assumed for 1995 IES and sampling design weights for The GICs in Figure 2 present the growth in real per capita income and expenditure for Gauteng province, arranged according to ascending percentiles of the distribution. The figure, using expenditure as the measurement for welfare, shows that individuals at the bottom half of the distribution curve experienced negative changes in their inflationadjusted expenditure between 1995 and Only those consuming at the 60th percentile and above experienced positive real growth in terms of expenditure. Similarly, on the income side, more than 40 percent of the bottom percentile experienced decline in income over the 15-year period and from the 60th percentile and upwards income earners in the province experienced positive growth. The table in Figure 2 also shows that the annual percentage change for both expenditure and income growth trajectories are similar in the mean (1.32 percent for expenditure and 0.66 percent for income), the median (-1.17 percent for expenditure and percent for income) and mean percentile (-0.45 percent for expenditure and percent for income). In terms of corresponding percentile growth rates, unsurprisingly, expenditure measure is superior in terms of consistency when compared with income measures. At the corresponding 10th percentile, the annual growth rate for expenditure was percent and percent for income between 1995 and 2010; at the 30th percentile, however, expenditure decreased to percent per annum between 1995 and 2010 but income was percent. Later, in Section 4, we present a modest visual comparability between the two measures in allowing for the analysis of the impact of social grants, which contains grant information that is available for income only. The GIC for African-headed households expenditure in Figure 3 (the income estimates are in the Appendix: Figure A1) shows that the bottom 60 percent of Africans living in Gauteng did not experience a statistically significant improvement in welfare over the 15-year period. 029
32 POVERTY AND INEQUALITY IN THE GAUTENG CITY-REGION Figure 3: GIC for African household head for Gauteng: GROWTH IN REAL PER CAPITA EXPENDITURE GROWTH INCIDENCE CURVE: GAUTENG PROVINCE, AFRICAN POOREST P% RANKED BY PCREXP_TOTAL 95% Confidence interval Growth rate in mean Median spline Mean of growth rates SOURCE: Development Policy Research Unit: The PIES Growth rates Expenditure Income (Figure A1) Mean Median Mean percentile Corresponding 10th percentile th percentile th percentile th percentile th percentile DATA SOURCE: Stats SA IES 1995, 2000, 2005 and 2010, own calculations NOTE: (a) Cross-entropy weights are assumed for 1995 IES and sampling design weights for
33 PART 1: POVERTY AND INEQUALITY IN THE GAUTENG CITY-REGION Only those consuming at the top 20 percent (80th-100th percentile) of the distribution curve saw their welfare increase while those in the middle of the distribution curve witnessed nearly zero change in welfare during this period. The lowest growth rate is negative 2 percent at the bottom percentile, while the highest growth rate is almost positive 3 percent. The visually consistent upward sloping of the GIC suggests the polarising of the expenditure distribution of individuals living in African households. In other words, expenditure estimates as a measure for welfare suggest that rich Africans are consuming more in real value, while the poor are consuming less. This result confirms earlier findings that inequality within racial groups in Gauteng has increased and has become the dominant factor contributing towards overall inequality in the province. The GIC using income as proxy for welfare is presented in Figure A1 in the Appendix. Figure 4: GIC for white household head for Gauteng: GROWTH INCIDENCE CURVE: GAUTENG PROVINCE, WHITES GROWTH IN REAL PER CAPITA EXPENDITURE POOREST P% RANKED BY PCREXP_TOTAL 95% Confidence interval Growth rate in mean Median spline Mean of growth rates SOURCE: Development Policy Research Unit: The PIES 031
34 POVERTY AND INEQUALITY IN THE GAUTENG CITY-REGION Growth rates Expenditure Income (Figure A2) Mean Median Mean percentile Corresponding 10th percentile th percentile th percentile th percentile th percentile DATA SOURCE: Stats SA IES 1995, 2000, 2005 and 2010, own calculations NOTE: (a) Cross-entropy weights are assumed for 1995 IES and sampling design weights for Results in Figure 4 suggest that individuals living in white households in Gauteng experienced mainly either zero or positive growth rates in their real expenditure across the overall distribution. More specifically, while the growth patterns for the bottom percentiles are not differentiable from zero growth, nearly 80 percent of the white population group at the 20th percentile or higher were consuming at or above the real level of expenditure in 2010 relative to 15 years prior. The highest growth rate averaged at nearly 4 percent per annum in real terms. The GIC pattern for white households is in stark contrast with that of Africans where nearly 60 percent of the bottom percentile consumed at or below the level consumed at the beginning of South Africa s democracy in Gauteng. The income GIC result is presented in Figure A2 in the Appendix for comparison. 032
35 PART 1: POVERTY AND INEQUALITY IN THE GAUTENG CITY-REGION Figure 5: GIC for male household head for Gauteng: GROWTH INCIDENCE CURVE: GAUTENG PROVINCE, MALE GROWTH IN REAL PER CAPITA EXPENDITURE POOREST P% RANKED BY PCREXP_TOTAL 95% Confidence interval Growth rate in mean Median spline Mean of growth rates SOURCE: Development Policy Research Unit: The PIES Growth rates Expenditure Income (Figure A3) Mean Median Mean percentile Corresponding 10th percentile th percentile th percentile th percentile th percentile DATA SOURCE: Stats SA IES 1995, 2000, 2005 and 2010, own calculations NOTE: (a) Cross-entropy weights are assumed for 1995 IES and sampling design weights for
36 POVERTY AND INEQUALITY IN THE GAUTENG CITY-REGION Figure 5 presents the GIC for individuals living in male-headed households. Again, nearly 60 percent of the entire consumption distribution experienced negative growth after 15 years of economic shifts in Gauteng. Relatively, those at the top percentiles (specifically those consuming at the 60th percentile and above level) benefited the most. The overall mean annual growth rate for welfare during the period under review was 1.69 percent. Figure 6 shows the result for female-headed households which is slightly more encouraging in that for the majority of the expenditure distribution, female-headed households experienced shifts in expenditure that are either statistically indistinguishable from zero or positive. The result for female-headed households using income as the welfare measure is presented in Figure A4 of the Appendix. Figure 6: GIC for female household head for Gauteng: GROWTH INCIDENCE CURVE: GAUTENG PROVINCE, FEMALE GROWTH IN REAL PER CAPITA EXPENDITURE POOREST P% RANKED BY PCREXP_TOTAL 95% Confidence interval Growth rate in mean Median spline Mean of growth rates SOURCE: Post-apartheid Income and Expenditure Series (PIES) 034
37 PART 1: POVERTY AND INEQUALITY IN THE GAUTENG CITY-REGION In general, individuals living in white households fared much better such that nearly 80 percent of the population living in those households experienced positive growth in their consumption value. Growth rates Expenditure Income (Figure A4) Mean Median Mean percentile Corresponding 10th percentile th percentile th percentile th percentile th percentile DATA SOURCE: Stats SA IES 1995, 2000, 2005 and 2010, own calculations NOTE: (a) Cross-entropy weights are assumed for 1995 IES and sampling design weights for In sum, a few key trends have emerged from the analysis of the GICs. At the aggregate, the bottom percentiles per capita household expenditure in Gauteng experienced negative growth of up to more than half the entire distribution (nearly 60 percent). Although the growth pattern is highly uneven and most of the changes are statistically insignificantly different from zero change, visually it is clear that the bulk of the growth benefit over the 15-year period is rather focused on those who were consuming at the top percentile of the expenditure distribution. In general, individuals living in white households fared much better such that nearly 80 percent of the population living in those households experienced positive growth in their consumption value. Ultimately, irrespective of race and gender, the upward sloping of all the GICs for Gauteng explains that the growth rates in expenditure are causing a polarising of the consumption distribution for the period. This suggests increased inequality and relative poverty for the 15-year period as confirmed by the earlier FGT class of poverty measures, as well as the Gini coefficient. 035
38 POVERTY AND INEQUALITY IN THE GAUTENG CITY-REGION 4. The impact of social grants The aim of this section is to evaluate the role of social grants in the growth distribution outcomes between 1995 and In order to do this we estimate and compare the poverty measurements, the Gini coefficient, and the GIC for the Gauteng province with, and without, grant incomes. However, information on grant income is only recorded as a part of the total income pool of the households. Therefore, in this section we mainly use income as the proxy for measuring the welfare of households in Gauteng. In order to establish comparability, Figure 7 visually presents the density functions for both income and expenditure in both 1995 and The density function essentially provides an indication of comparability between the two measures of welfare. The density functions suggest that both welfare measures are similarly distributed in the mean and almost identical in terms of ranges for both years for Gauteng. It is therefore without significant loss in generalisability to utilise income as the main proxy measure for welfare in order to gain nuanced information about the impact of grant income (Yu, 2011). Figure 7: K-density functions of income and expenditure for Gauteng INCOME EXPENDITURE DENSITY: INPCRHINC_TOTAL.2.1 DENSITY:INPCREXP_TOTAL INPCRHINC_TOTAL INPCREXP_TOTAL SOURCE: Stats SA IES 1995, 2000, 2005 and 2010, own calculations NOTE: (a) Cross-entropy weights are assumed for 1995 IES and sampling design weights for

39 PART 1: POVERTY AND INEQUALITY IN THE GAUTENG CITY-REGION Photograph by Amanda van der Walt From this point onwards we use total per capita household income as the measurement for welfare first including and then excluding grant income to measure the impact of social grants on welfare in the province. In other words, we calculate two sets of measures, the one set based on total income and the second set based on total income less grant income. Table 6 compares the headcount rates using the upper-bound poverty line as the reference for total per capita income with, and without, social grants. The headcount rate for income without grants provides an estimate of the possible levels of poverty in both 1995 and 2010 in the absence of the state s social grant system. A few key results emerge. At the aggregate level there was an increasing impact for the poverty reduction effect of social grants over the period under review. More specifically, in 1995, the inclusion of grant income reduced the provincial poverty rate by almost 2 percent, while in 2010 the impact increased to nearly 5 percent at the mean. By categories, it is evident that grant income played a crucial role in individuals welfare living in African and female-headed households, as well as those relatively less educated households. Headcount poverty for these categories was higher in the absence of government s provision of social grants. Interestingly though, there seems to be no discernible impact in 2010 for households with no schooling. This may, however, be the consequence of the insufficiency of the monetary grant which they receive to have any poverty reduction impact as referenced by the chosen poverty line. Overall then, over the 15-year period the grant impact has become more prevalent and the poverty reduction impact doubled, irrespective of race, gender or schooling. This also confirms the fact that since the advent of democracy the social grant system has both rapidly widened and deepened, according to Pauw and Ncube (2007) Pauw and Ncube (2007) show that since 1994 not only have the grant values and grant expenditure as a share of GDP increased (see Table A1 in the Appendix), but the number of grant recipients has more than trebled. In 1996/97, social grant transfers accounted for approximately 2.5 percent of GDP and by 2005/06 this share increased to over 3 percent The total number of beneficiaries grew from approximately 3 million in 1997 to 9.4 million in 2005, an average annual growth rate of more than 15 percent. 037
40 POVERTY AND INEQUALITY IN THE GAUTENG CITY-REGION Table 6: Per capita income poverty comparison by race, gender and education of household head, with and without grants for 1995 and With grants Without grants Diff. With grants Without grants Diff. R577 a month poverty line (March 2009 prices) Total by race African Coloured Indian/Asian White by gender Male Female by education No schooling Primary (including Grade 0) Secondary (< Grade 12) Completed Grade Certificate/diploma (< Grade 12) Certificate/diploma with Grade Degree or higher DATA SOURCE: Stats SA IES 1995, 2000, 2005 and 2010, own calculations. NOTES: (a) Cross-entropy weights are assumed for 1995 IES and sampling design weights for (b) Highlighted means statistically significant at the 95 percent confidence interval of the 5-year change. Grant incomes also played an important role in ameliorating the spike in inequality through targeted monetary injection to the poor. Table 7 shows that in the first 15 years of democracy income inequality had risen from 0.57 to 0.63 between 1995 and Excluding the assistance of grants, however, the inequality outcomes would have shifted from 0.58 to 0.66 during the period. In other words, the inequality reduction impact of grant income was 0.01 and 0.03 in 1995 and 2010 respectively a total Gini coefficient difference of By gender, it is clear from Table 7 that inequalities for both years among female-headed households are higher, and expectedly grant income also played a larger role for female than for maleheaded households. 038
41 PART 1: POVERTY AND INEQUALITY IN THE GAUTENG CITY-REGION Table 7: Shifts in per capita income inequality (Gini coefficients), with and without grants With grants Without grants Diff. With grants Without grants Diff. R577 a month poverty line (March 2009 prices) Total by gender Male Female by race African Coloured Indian/Asian White by education No schooling Primary (including Grade 0) Secondary (< Grade 12) Completed Grade Certificate/diploma (< Grade 12) Certificate/diploma with Grade Degree or higher DATA SOURCE: Stats SA IES 1995, 2000, 2005 and 2010, own calculations NOTE: (a) Cross-entropy weights are assumed for 1995 IES and sampling design weights for By race, similar to the poverty reduction impact of grants, individuals living in African-headed households witnessed a relatively more pronounced inequality-reducing impact of grant income than any other race groups at the mean over the period. The difference in inequality when comparing the presence and absence of grant income increased from a meagre 0.01 as measured by the Gini coefficient in 1995 to four times its impact 15 years later at 0.04 in Perhaps the most obvious impact comes from the category by educational attainment of the household head. The reduction in inequality caused by grants for households headed by someone without any schooling is 0.16 as measured by the Gini coefficient in the province. The inequality reduction impact also decreases with the increasing education of the 039
42 POVERTY AND INEQUALITY IN THE GAUTENG CITY-REGION households, which suggests that the grant system for the poor in Gauteng (and possibly for the entire country) was well-targeted and its scale impressive. Finally, Figure 8 shows the stark contrast between the GICs of household income in Gauteng with, and without, grant income between 1995 and Clearly, social grant assistance has become a key component of the household income pool and provides much support to the real growth of the individual s income especially at the bottom percentiles. More specifically, in the absence of grant income the growth rates for those earning between 3rd and 40th percentiles would have collapsed close to as much as 60 percent in terms of growth rate in real income. This result also confirms the earlier assertions by the differences in poverty rates as well as inequality that the social grant system plays a crucial part in today s income composition of households and their members in Gauteng. Figure 8: GIC for the Gauteng province: with and without grants for GROWTH INCIDENCE CURVE: GROWTH RATES FOR WITH AND WITHOUT GRANT 0 PER CAPITA GROWTH POOREST P% RANKED BY PER CAPITA INCOME P_growth P_growth_nog SOURCE: Post-apartheid Income and Expenditure Series: The PIES 040

43 PART 1: POVERTY AND INEQUALITY IN THE GAUTENG CITY-REGION Photograph by Amanda van der Walt In sum then, the results suggest that at the aggregate level both poverty and inequality reduction impacts in one of South Africa s social grant systems are real. Through poverty and inequality comparisons, the system itself shows that it is a well-targeted social assistance mechanism and has undergone substantial expansion over the 15-year period since democracy. However, evidence for pro-poor policy is a sufficient but not a necessary condition for pro-poor growth. 5. Conclusion The results presented in this study clearly show that in both absolute and relative terms poverty has fallen at the aggregate levels as well as for African-headed households in Gauteng for the last decade of the period under review i.e This result is significant and invariant to the choice of poverty line. However, the results also show that race and gender remain the overwhelming markers of poverty in Gauteng, with the poverty rate ratio for African to white almost 40:1, and female to male 2:1. The trends in inequality suggest that Gauteng was most unequal in the first five years of democracy and has since moderated. Hence, over the 15- year period, inequality in the province remains statistically the same. However, it is evident that the source of inequality has shifted from between racial groups to be more significant within racial groups. Our analysis of the nature of economic growth since 1995 suggests that individuals at the top end of the distribution curve gained most from the post-apartheid growth dividend, irrespective of racial group. The province s current democratic growth model is crafted around providing substantial redistributive income support to the bottom end of the distribution through an extensive social grant programme. Despite this, the growth returns are still unbalanced. For instance, when inequality measures are estimated using income instead of expenditure the results clearly illustrate the importance of social grants as a source of income, and how social transfers have offset potentially greater increases in income inequality over the period. However, while appearing to be an effective pro-poor policy and limiting the rise in income inequality, expecting such largescale expansion of the social security net to reverse engineer the growth pattern and induce pro-poor growth is not viable as a policy option. Instead, this highlights the importance of other interventions, particularly those aimed at job creation through competitiveness, increasing productivity for the poor and the unskilled. 041
44 POVERTY AND INEQUALITY IN THE GAUTENG CITY-REGION REFERENCES Bhorat, H., Leibbrandt, M., Maziya, M., Van der Berg, S. and Woolard, I. (2001) Fighting poverty: Labour markets and inequality in South Africa. Cape Town: UCT Press. Bhorat, H. and Van der Westhuizen, C. (2011) Pro-poor growth and social protection in South Africa: Exploring the interactions. Input paper prepared for the National Planning Commission (NPC). Foster, J.E., Greer, J. and Thorbecke, E. (1984) A class of decomposable poverty measures, Econometrica, 52(3): Hoogeveen, J.G. and Özler, B. (2006) Poverty and inequality in post-apartheid South Africa: Poverty and policy in post-apartheid South Africa. Cape Town: HSRC, pp Leibbrandt, M., Levinsohn, J. and McCrary, J. (2005) Incomes in South Africa since the fall of apartheid. No. w National Bureau of Economic Research (NBER) Working Paper No. w Cambridge, MA: NBER. Available at org/papers/w Leibbrandt, M., Woolard, I., Finn, A. and Argent, J. (2009) Trends in South African income distribution and poverty since the fall of apartheid. Organisation for Economic Co-operation and Development (OECD) Social, Employment and Migration Working Papers No Available at Meyer, B.D., and Sullivan, J.X. (2003) Measuring the well-being of the poor using income and consumption. National Bureau of Economic Research (NBER) No. w9760. Cambridge, MA: NBER. Available at Republic of South Africa (1999) Intergovernmental Fiscal Review Pretoria: Department of Finance (now National Treasury). Pauw, K. and Mncube, L. (2007) The impact of growth and redistribution on poverty and inequality in South Africa. Country Study No.7, June. Brasilia: International Poverty Centre. Ravallion, M. (2004) Pro-poor growth: A primer. World Bank Policy Research Working Paper Washington, D.C.: World Bank. Ravallion, M. and Chen, S. (2003) Measuring pro-poor growth. Economic Letters, 78(1): Statistics South Africa (Stats SA) Income and expenditure of households surveys (IES) 1995, 2000, 2005/06 and 2010/11. Pretoria: Stats SA. Yu, D. (2011) The comparability of income and expenditure surveys 1995, 2000 and 2005/2006. Stellenbosch Economic Working Papers, 11/08. Stellenbosch: Department of Economics and the Bureau for Economic Research, University of Stellenbosch. 042


45 PART 1: POVERTY AND INEQUALITY IN THE GAUTENG CITY-REGION Photographs by Amanda van der Walt 043
46 APPENDIX Figure A1: GIC for African household head: income, GROWTH IN REAL PER CAPITA INCOME GROWTH INCIDENCE CURVE: GAUTENG PROVINCE, AFRICAN POOREST P% RANKED BY PCRHINC_TOTAL 100 Figure A2: GIC for white household head: income, GROWTH IN REAL PER CAPITA INCOME GROWTH INCIDENCE CURVE: GAUTENG PROVINCE, WHITE POOREST P% RANKED BY PCRHINC_TOTAL % Confidence interval Growth rate in mean Median spline Mean of growth rates SOURCE: Development Policy Research Unit: The PIES DATA SOURCE: Stats SA IES 1995, 2000, 2005 and 2010, own calculations. NOTE: (a) Cross-entropy weights are assumed for 1995 IES and sampling design weights for
47 Figure A3: GIC for male household head: income, GROWTH IN REAL PER CAPITA INCOME GROWTH INCIDENCE CURVE: GAUTENG PROVINCE, MALE POOREST P% RANKED BY PCRHINC_TOTAL 100 Figure A4: GIC for female household head: income, GROWTH IN REAL PER CAPITA INCOME GROWTH INCIDENCE CURVE: GAUTENG PROVINCE, FEMALE POOREST P% RANKED BY PCRHINC_TOTAL % Confidence interval Growth rate in mean Median spline Mean of growth rates SOURCE: Post-apartheid Income and Expenditure Series (PIES) DATA SOURCE: Stats SA IES 1995, 2000, 2005 and 2010, own calculations. NOTE:(a) Cross-entropy weights are assumed for 1995 IES and sampling design weights for

48 POVERTY AND INEQUALITY IN THE GAUTENG CITY-REGION Photograph by Gareth Pon 046

49 PART 2: LABOUR MARKET INEQUALITIES IN THE GAUTENG CITY-REGION 047
50 POVERTY AND INEQUALITY IN THE GAUTENG CITY-REGION Part 2 Labour market inequalities in the Gauteng City-Region PRUDENCE KWENDA AND MIRACLE BENHURA Abstract This study examines non-wage (labour force participation, employment and occupations) inequality within the South African labour market, with special focus on Gauteng province. Using decomposition techniques on data drawn from the 1997 October Household Survey and the 2002 and 2007 September Labour Force Surveys we provide a temporal analysis of the factors underlying non-wage inequality within Gauteng along the gender, age and racial dimensions. We find statistically similar labour force participation rates by race, while the converse applies to gender and age. The proportion of women participating in the labour force is lower than that of men and lower for youth than for older individuals, suggesting that people in these subgroups still face some constraints that may prevent labour force participation. In addition, we find marked differences across race with regards to employment, distribution across sectors (i.e. formal vs informal) and occupation. The results indicate that unemployment is more prevalent among Africans than whites. These rates are also higher for women relative to men suggesting that women still face considerable constraints in accessing employment. We also find a large proportion of Africans in elementary jobs, in legislative, managerial and professional occupations relative to whites. Further, results show that the large gap in formal employment between whites and Africans is mainly due to lower human capital among Africans compared to whites. Overall, these results call for policies aimed at equipping Africans with human capital. Keywords: labour force, participation, employment, Gauteng 1. Introduction Two decades into the post-apartheid era South Africa is still grappling with its inheritance of a highly unequal labour market across all demographic groups. This legacy has compromised the national pace of socio-economic development in general and labour market development in particular. The labour market is the main source of livelihood for many. Official data show that 62.6 percent of South African households rely on labour market incomes (Statistics South Africa (Stats SA), 2012). Therefore, ironing out labour market inequalities has always been an overarching goal for the country s national and provincial governments. This has solicited underpinning studies on labour market inequality across various population groups. For instance, Casale and Posel (2011), Bhorat and Goga (2013), and Ntuli and Wittenberg (2013) explored gender disparities; while Allanson et al. (2000), and Azam and Rospabe (2007) studied racial disparities. However, these studies have concentrated on the 048

51 PART 2: LABOUR MARKET INEQUALITIES IN THE GAUTENG CITY-REGION The results indicate that unemployment is more prevalent among Africans than whites. These rates are also higher for women relative to men suggesting that women still face considerable constraints in accessing employment. Photograph by Bianca van Heerden 049
52 POVERTY AND INEQUALITY IN THE GAUTENG CITY-REGION The economic performance of Gauteng is mainly attributed to growth in the following industries: wholesale, retail and motor trade; catering and accommodation; general government services; finance, real estate and business services; and manufacturing. national picture which masks regional disparities. Understanding labour market dynamics at a local level is instrumental for tackling regional inequality and directing policies focused on local economic development. This paper contributes to the literature by investigating labour market inequalities in Gauteng. While these inequalities manifest themselves in wage and non-wage outcomes such as labour force participation (LFP), employment and occupations, this paper focuses on non-wage outcomes only. The analysis will be disaggregated by race, gender, age and education level to unveil important differences that might exist across various population groups. In order to infer developments over time, the paper provides an inter-temporal analysis using cross-sectional data for the period Specific datasets considered for multivariate analysis are the October Household Survey for 1997, September Labour Force Surveys for 2002 and 2007, and the first quarter of the Quarterly Labour Force Survey for 2012, produced by Stats SA. The analysis employs quantitative techniques, descriptive statistics and a decomposition analysis. This study is timely as the province is reviewing its current state and mapping the way forward after 20 years of democracy. The analysis for Gauteng is also important because the province is the main economic hub of South Africa. The rest of the paper is structured as follows: Section 2 presents some background information for Gauteng. This is followed in Section 3 by a detailed discussion of the data used in the study, and some descriptive statistics of labour market inequalities. Section 4 discusses the decomposition analysis, and Section 5 concludes. 2. Background Although geographically small, Gauteng is the country s main economic hub and is the largest employer and contributor to national gross domestic product (GDP). Table 1 shows that Gauteng contributes 35 percent to the country s GDP followed by KwaZulu-Natal and Western Cape provinces at 16.4 percent and 14.9 percent respectively (ESCECC, 2013). Gauteng s GDP grew from R389 billion in 1996 to R625 billion in 2009, and this trend remains unabated as can be seen in Table 1 (Gauteng Provincial Government (GPG), 2011; ECSECC, 2013). Gauteng employs 30.7 percent of the total number of workers in South Africa followed by KwaZulu-Natal and the Western Cape employing 18.5 percent and 13.3 percent respectively. The economic performance of Gauteng is mainly attributed to growth in the following industries: wholesale, retail and motor trade; catering and accommodation; general government services; finance, real estate and business services; and manufacturing. 050
53 PART 2: LABOUR MARKET INEQUALITIES IN THE GAUTENG CITY-REGION Table 1: GDP and employment growth rates by province, Q1 of 2013 Poverty gap ratio (percent) GDP Employment Rand (Million) Percent Number ( 000) Percent Western Cape (WC) Eastern Cape (EC) Northern Cape (NC) Free State (FS) KwaZulu-Natal (KZN) North West (NW) Gauteng (GP) Mpumalanga (MP) Limpopo (LP) Republic of South Africa (RSA) DATA SOURCE: ECSECC using Stats SA 2.1 Economic opportunities in Gauteng Gauteng province has a first-world ground and air transport infrastructure linking it to the rest of the world. The national ground routes that traverse Gauteng are connected to strategic centres such as Durban, Nelspruit, East London, Port Elizabeth, Cape Town and Musina which enables Gauteng investors to access major markets in other African countries. With regards to air transport, Gauteng hosts the largest and busiest international airport not only in South Africa but also on the African continent O.R. Tambo International Airport. The airport serves more than 17 million departing passengers a year and hosts airlines from all five continents. In comparison, the country s second largest international airport located in the Western Cape (Cape Town) serves 3.8 million passengers a year (Gauteng Economic Development Agency (GEDA), 2008). Gauteng has sophisticated infrastructure which makes it a strategic investment destination for both locals and foreigners and opens up a wider spectrum of economic opportunities for the province. To complement the investment pull factors in Gauteng, high-level research and development also takes place in the province. According to GEDA (2008), approximately 60 percent of South Africa s research and development takes place in Gauteng where 41 percent of the country s core biotechnology companies are located. Furthermore, Gauteng is home to outstanding research universities, technical colleges and leading research institutions. These include the University of the Witwatersrand (Wits), University of Pretoria (UP), Tshwane University of Technology (TUT), University of Johannesburg (UJ), University of South Africa (UNISA), the Council for Scientific and Industrial Research (CSIR), the Agricultural Research Council (ARC), and the Onderstepoort Veterinary Institute. 051
54 POVERTY AND INEQUALITY IN THE GAUTENG CITY-REGION Gauteng is furthermore Africa s financial capital hosting the head offices of more than 70 foreign banks, South African banks, stockbrokers and insurance giants (Hlekiso and Mahlo, 2006). The Johannesburg Stock Exchange (JSE) in Gauteng is ranked 17th in the world by market capitalisation (GEDA, 2008). To some extent this implies that investors in Gauteng have access to investment finance. Gauteng is thus a centre of industry with a highly sophisticated and diverse economy, robust transport and communications networks, business services, vibrant manufacturing and mining sectors and a state of the art information and communications technology (ICT) industry (GEDA, 2008). The industries in Gauteng avail quality jobs with average earnings of R a month, which means a better quality of life compared to other provinces (Leibbrandt et al., 2009). The economic opportunities in Gauteng attract a large number of the working-age population from other provinces and countries. Consequently, Gauteng is home to the country s largest workingage population, despite its small geographic size (see Table 2). Table 2: Labour market structure by province, Q2 of 2013 (in millions) WC EC NC FS KZN NW GP MP LP Working age Labour force Employed Unemployed Discouraged workers Not economically active (NEA) Other DATA SOURCE: Stats SA, Quarterly Labour Force Survey, Quarter 2, 2013 The better economic opportunities in Gauteng coupled with its relatively sophisticated transport, health, education and housing infrastructures, as well as pull factors such as relative political stability in the sub-saharan African region, lead to continuous increases in Gauteng s population. Apart from internal migrants, its immigrants include Indians, Pakistanis, Chinese, Europeans, Nigerians, Malawians, Mozambicans and Zimbabweans (Rasool et al., 2012). To shed some light on changes to Gauteng s population, Stats SA s National Community Survey of March 2007 showed that Gauteng had people. In mid-2010, this had increased to , i.e percent of the South African population. Census 2011 revealed that the population for Gauteng was Relative to its land size, the province has large amounts of perceived and actual endowments of socio-economic opportunities, especially jobs and education. In fact there is a widespread perception that better work and education opportunities are available in Gauteng (GPG, 2011). This necessitates a closer look at labour market opportunities in Gauteng, which are supposedly fluid due to the high impact of migration on the province. 052

55 PART 2: LABOUR MARKET INEQUALITIES IN THE GAUTENG CITY-REGION Photograph by Holger Deppe 3. An overview of labour market issues in South Africa The analysis of the Gauteng labour market is underpinned by obvious patterns in the national labour market. Studies of the South African labour market have shown that the largest proportion of participants is African, followed by whites, coloureds, and Indians/Asians, in line with the national population structure (Ntuli and Gwatidzo, 2013). These different racial groups experience the labour market quite differently in terms of employment level, wages, occupations and sectors of employment. Clearly, the South African labour market is hierarchical in both wage and non-wage outcomes. On average, whites occupy the top rung of the market s ladder of opportunities and outcomes followed by Indians/Asians, coloureds and Africans (Allanson et al., 2000; Bhorat et al., 2002; Hlekiso and Mahlo, 2006; Ntuli and Gwatidzo, 2013). As an example Ntuli and Gwatidzo (2013) used Census data for 2001 to show that the proportions of whites, Indians/Asians, coloureds and Africans in highly skilled occupations were 54, 40, 15.8, and 13.4 percent respectively. Also, unemployment statistics for the first quarter of 2013 showed that 28.8, 23.3, 12.3, and 7.2 percent of Africans, coloureds, Indians/Asians and whites respectively were unemployed. The racial statistics above mask some gender and age-related disparities in labour market opportunities and outcomes. Within each of the race groups women usually have inferior opportunities than men (Casale and Posel, 2002; Bhorat and Goga, 2013). In particular, unemployment rates are higher for women than men and women are more likely to be in informal sector survivalist jobs (Casale and Posel, 2002; Leibbrandt et al., 2009). For instance Leibbrandt et al. (2009) showed that 34 percent of female workers and 20 percent of male workers were employed in the informal sector. When considering age, young people (15 35 years) face dire labour market opportunities compared to adults, especially African youth. The youth unemployment rate hovers around 40 percent, which is worrisome given the importance of this cohort for future prospects of the economy. The distribution of opportunities in the South African labour market is not coincidental; rather it is mainly due to apartheid policies and patriarchal tendencies in society. While apartheid policies operated at many levels, worth noting are the education policies. These exposed most blacks (Africans, coloureds and Indians/Asians), but especially Africans, to poor quality education while the reverse was the case with whites (Van der Berg and Bhorat, 1999). This severely hampered blacks chances of securing occupations other than lowpaying unskilled jobs. Worse still, most of these individuals are still trapped in this situation because of abject poverty. The effects of these policies are partly responsible for high youth unemployment as unemployed youth who have degrees were educated at historically black universities and are therefore perceived to have low quality tertiary qualifications. The apartheid education policies were accompanied by job reservation policies which reserved high-paying highly-skilled jobs for whites, relegating blacks to lower level jobs (Van der Berg and Bhorat, 1999). The results of these policies are still evident today despite counter policies such as the Employment Equity Act (No. 55 of 1998) and affirmative action policies in the job market. On the other hand, patriarchy generally positions women below men in society, and this does filter to the gendered labour market outcomes and opportunities. With this picture of the entire South African labour market we proceed to analyse the labour market in Gauteng. 053
56 POVERTY AND INEQUALITY IN THE GAUTENG CITY-REGION 4. Data and descriptive statistics 4.1 Data The data used in this study were drawn from the October Household Surveys ( ), September Labour Force Surveys ( ), and Quarterly Labour Force Surveys ( ) published by Stats SA. In some sections (e.g. the multivariate analysis section) we used selected years, i.e. 1997, 2002, 2007 and The surveys are nationally representative and they provide information on the demographic and labour market status of workingage individuals in sampled households. However, the data do not allow us to identify local areas in Gauteng province and rural urban dimensions for the entire period. We therefore provide a broad analysis for Gauteng. We also created some variables to establish definitional consistency over time, e.g. education. Branson s cross-entropy weights were used to make the datasets comparable over time (Branson and Wittenberg, 2014).1 The samples of analysis are confined to working-age individuals (15-65 years) in Gauteng province, provided they had information on key variables for this study. For instance, for our key years there were individuals in 1997, in 2002, in 2007, and in Summary statistics for the data are discussed below. 4.2 Developments in LFP Table 3 presents the broad and official LFP rates by gender, age, race and education level for The broad definition of LFP encompasses workers, job seekers and discouraged workers, while the official definition excludes the latter. The statistics for the broad definition show an upward trend in overall LFP rates for the period from 69 percent in 1997 to 75 percent in For the official definition, we find LFP rates of 61 percent in 1997 and 72 percent in Along the gender dimension, we find that men s LFP rates are significantly higher than women s. A potential reason for these differences is women s disproportionate burden of household nurturing activities which hinder participation in the labour market. With regards to age, we find that LFP rates have been increasing across all age groups with the youth (age 15-35) having the lowest LFP rates. An analysis by race indicates that, in general, participation rates have been steadily increasing for all races with Africans registering the highest increase of 12 percentage points while whites had the least increase in participation rates of 8 percentage points over the 15-year period. The differences in participation rates across racial groups are mostly statistically insignificant suggesting that there are no substantial inter-racial inequities with regards to LFP. In contrast, we find marked differences in LFP rates by education level. LFP is higher for individuals with higher levels of education (i.e. diploma/certificate and degree) compared to those with lower levels (i.e. less than matric). This finding suggests that education plays an important role in encouraging LFP. These findings corroborate income and expenditure poverty analysis by Tseng in Part 1 of this report. 1. We are grateful to DataFirst resource unit for providing us with the Post-Apartheid Labour Market Series (PALMS) dataset with the weights. 054
57 PART 2: LABOUR MARKET INEQUALITIES IN THE GAUTENG CITY-REGION Table 3: LFP rates by various categories: Participation (broad) Participation (official) Gender Male Female Age Race African Coloured Indian/Asian White Education No schooling Primary Incomplete secondary Matric/NTC I - III Diploma/certificate Degree No. of obs No. of weighted obs DATA SOURCE: Own calculations from PALMS data NOTE: (a) Summary statistics by categories are computed using the official LFP definition. 055
 in Gauteng from 1994 to 2012.")
58 POVERTY AND INEQUALITY IN THE GAUTENG CITY-REGION Photograph by Gareth Pon 4.3 Developments in unemployment The problem of unemployment is not only persistent but also increasing in South Africa. This has important implications for inequality. Figure 1 depicts the evolution of unemployment (official definition) in Gauteng from 1994 to At the beginning of the democratic dispensation in 1994, total unemployment stood at 19 percent which dropped to 14 percent in This initial decline in unemployment could be partly a result of stringent abolishment of apartheid labour market policies, which restricted employment opportunities, particularly for Africans. The reduction in unemployment was short lived; this was followed by an increase in unemployment between 1996 and The period was marked by a gradual decline in unemployment, a trend which was soon reversed from 2007 onwards. An assessment by gender indicates that the problem of unemployment is more prevalent among women than men men have unemployment levels below average while those of women are above. This is consistent across all years under consideration in this paper indicating that women are persistently at a disadvantage. Similar to the case for women, Figure 1 also shows that youth unemployment (i.e. age years) is above average and even worse than women s. This indicates that younger workers are highly disadvantaged in the Gauteng labour market. As for race, Figure 1 shows that unemployment rates for Africans and whites are the extremes of the unemployment spectrum. In 1994, Africans unemployment rate was fairly high at 27 percent while that for whites was only 3 percent, an unconditional gap of 24 percentage points. This gap declined to 16 percent points in 1995 possibly due to concerted efforts by the new government to address this problem. However, the decline was unsustainable as Africans unemployment rate began to increase. Over the period the racial unemployment gap persistently hovered around the 1994 level, despite Black Economic Empowerment (BEE) policies. This echoes strong racial differences in access to jobs within Gauteng. 056
59 PART 2: LABOUR MARKET INEQUALITIES IN THE GAUTENG CITY-REGION Figure 1: Unemployment rates: UNEMPLOYMENT RATE YEAR Average Male African Female Youth (15-35 years) White DATA SOURCE: Authors, calculations based on PALMS data Table 4, which presents unemployment rates by education, shows that over the period unemployment rates were higher among individuals with lower levels of education (i.e. education less than or equal to matric/ntc-iii)2 compared to those with higher levels (i.e. diploma/certificate and degree). The marked differences in unemployment rates by education suggest that low levels of education act as a strong barrier to employment. For instance, in 2012 the unemployment rate for individuals with a degree was 5 percent compared to 22 percent for those with no schooling. There are three potential explanations for the presence of high unemployment among those with low levels of education. Firstly, based on the human capital models, education acts as a signal of ability in the labour market with high education being a signal of high ability; employers are often reluctant to employ individuals with low ability. Secondly, over the period under study there was a rapid increase in wages for unskilled workers making them an expensive resource (Fallon and Lucas, 1998). Thirdly, as pointed out by Bhorat (2000), there has 2. NTC refers to the National Technical Certificate. 057
60 POVERTY AND INEQUALITY IN THE GAUTENG CITY-REGION Table 4: Developments in unemployment by education Total Unemployment rate (broad) Unemployment rate (official) By education level No schooling Primary Incomplete secondary Matric/NTC I-III Diploma/certificate Degree No. of observations No. of weighted obs DATA SOURCE: Authors calculations based on PALMS data NOTE: (a) Summary statistics by categories are computed using the official unemployment definition. been a skills bias in the South African labour market in favour of skilled rather than unskilled workers. 4.4 Developments in formal employment Employment is an important labour market outcome; however, the quality of employment is of primary importance if inequality reduction is of interest to policy-makers. In view of this, we provide a brief assessment of the nature of employment in Gauteng along the formal/informal sector dichotomy and the distribution of occupation by race. The formal sector is often viewed as superior to informal employment. Workers become informally employed to escape unemployment (Lewis, 1954; Harris and Todaro, 1970) and often engage in precarious activities rewarded with low wages (Perry et. al., 2007). In view of this, if employment in Gauteng is concentrated or growing within the informal sector then there is a need for policies that ensure the creation of decent jobs. Table 5 shows the size and composition of the formal sector between 1997 and We find a gradual decline in formal employment from 85 percent in 1997 to 77 percent in Alternatively, employment in the informal sector has gradually increased from 15 percent in 1997 to 24 percent in Although the size of the informal sector is fairly small compared to other developing countries (International Labour Organisation (ILO), 2002), its growth has important implications for inequality. Previous South African studies show that informal sector workers are underpaid (Kingdon and Knight, 2007; Bargain and Kwenda, 2011). A disaggregation by demographic characteristics indicates that employment for women in the formal sector is lower than for men, but has been increasing over time. In contrast, the proportion of men in formal employment 058
61 PART 2: LABOUR MARKET INEQUALITIES IN THE GAUTENG CITY-REGION Table 5: Developments in formal employment Total formal sector Gender Female Male Age Race African Coloured Indian/Asian White Education No schooling Primary Incomplete secondary Matric/NTC I-III Diploma/certificate Degree No. of obs No. of weighted obs DATA SOURCE: Authors calculations based on PALMS data NOTE: (a) Summary statistics by categories are computed using the official unemployment definition. 059
. 4.")
62 POVERTY AND INEQUALITY IN THE GAUTENG CITY-REGION has been decreasing over time. For education, we find that the proportion of workers with lower levels of education (i.e. below matric) has been decreasing over time, while the proportion of workers with education above matric increased between 1997 and Again, this result is in support of the notion that there has been a shift of labour demand from unskilled to skilled workers as pointed out by Bhorat (2000). 4.5 Developments in occupation structure Next we examine the changes in distribution of occupation by race. Discrimination in the labour market under apartheid confined Africans to the lowest position on the socio-economic ladder. Understanding whether the situation has improved in Gauteng is essential given recent initiatives such as the Employment Equity Act (No. 55 of 1998) aimed at redressing past inequities. Table 6 shows that the proportion of Africans in legislative and managerial positions declined from 36 percent in 1997 to 33 percent in This was followed by a 21 percentage point increase in 2007 and a decrease of 18 percentage points in 2012 compared to In contrast there are no substantial changes for Indians/Asians and coloureds, while there is a decline in the proportion of whites in this occupation group between 1997 and In addition, the proportion of whites in professional positions also declined over this period while that of Africans increased from the 1997 level. The increase in Africans in top-level jobs could be as a result of BEE policies implemented over this period. We also find that the proportion of Africans in clerical and blue-collar positions increased while that of whites declined. A worrisome finding is that, among Africans, elementary jobs are highly prevalent and increasing, compared to all other racial groups. The persistent concentration of Africans in the elementary jobs category suggests little progression despite concerted efforts to empower them. Based on these results, it is clear that the distribution of occupations is still highly skewed. This might be partly rooted in the legacy of apartheid which inhibited, among Africans, the human capital development required for top-level jobs. Photograph by Amanda van der Walt 060
63 PART 2: LABOUR MARKET INEQUALITIES IN THE GAUTENG CITY-REGION Table 6: Occupation structure: Panel A: African Legislators, senior officials and managers Professionals a Clerks Blue collar b Elementary c Panel B: Coloured Legislators, senior officials and managers Professionals a Clerks Blue collar b Elementary c Panel C: Indian/Asian Legislators, senior officials and managers Professionals a Clerks Blue collar b Elementary c Panel D: White Legislators, senior officials and managers Professionals a Clerks Blue collar b Elementary c DATA SOURCE: Authors calculations based on PALMS data. NOTES: (a) Professionals is composed of professionals, technical and associate professionals. (b) Blue collar jobs refer to service workers and shop and market sales workers, skilled agricultural and fishery workers, craft and related trades workers, and plant and machine operators and assemblers. (c) Elementary jobs are composed of domestic workers and elementary occupation. 061
64 POVERTY AND INEQUALITY IN THE GAUTENG CITY-REGION 4.6 Multivariate analysis This section carries out a decomposition analysis of gender and racial differentials in LFP rates and employment opportunities in Gauteng using survey data for 1997, 2002, 2007 and The analysis employs Fairlie s (2005) decomposition method. This is similar to the well-known Blinder-Oaxaca (1973) decomposition method. The two differ in that the Blinder-Oaxaca decomposition method (1973) is applicable to linear dependent variables while Fairlie (2005) is applicable to binary dependent variables as is the case for this study. Generally, the method partitions the difference between two mutually exclusive groups LFP/employment probabilities into two components due to: differences in labour market characteristics (explained gap), and differences in coefficients to these characteristics (unexplained gap). The explained gap is rationalised by the human capital theory (Becker, 1962). Ideally the demographic group endowed with superior human capital (skills, education, and experience) is more productive and faces a higher labour market demand than others, hence has a wider opportunity set. The unexplained gap is attributable to differences in the labour market behaviour of the groups in response to their observable and unobservable characteristics, employers hiring behaviour, discrimination or favouritism, and other unobservable factors which influence labour market attachment (Even and Macpherson, 1993). This is underpinned by theories of labour market discrimination, segmentation and self-selection, among others. As an example, Becker s (1971) taste-based theory of discrimination conjectures the employment gap between two groups as an outcome of employers distastes (favour) for one group which reduces (increases) employers propensity to hire from that group, while the converse applies to the other. Fairlie s (2005) technique is appropriate for this paper as it provides insights into the relative importance of explained and unexplained components of the disparities in question. Such information is pertinent to strategies for closing the gaps, and consequently fostering socio-economic development in Gauteng. For instance, a finding which reveals dominance of the explained component necessitates initiatives to improve the disadvantaged groups human capital, and hopefully chances of employment and access to the much needed income. To provide better insight into Fairlie s (2005) decomposition method, the paper uses the white African racial employment gap as an example. It follows that a standard employment probit model is estimated for each race j (white (w)/african (a)): y ij β + ε = ijxij ij (1) where y ij is a binary dependent variable showing individual i of race j s employment status: 1 if employed, 0 otherwise. X is i s vector of observable characteristics including gender, age, education, marital status, and the proportion of employees in i s household. βij is the corresponding parameter vector and εij is an error term. ( X X ) ˆ β + ( ˆ β - ˆ β ) yˆ ˆ w ya = w a w gap Explained w a X a Unexplained Findings from the probit regressions for each race are then used to predict the employment probability for each individual i of race j. These individual probabilities are averaged to obtain the predicted probability of employment for race j:ŷ j. The difference between ŷ j for whites and Africans is the employment gap. This is partitioned into explained and unexplained components as follows. (2) 062

65 PART 2: LABOUR MARKET INEQUALITIES IN THE GAUTENG CITY-REGION Where X j and β j are race j s mean of characteristics and regression coefficients, respectively. The explained component shows part of the white African employment gap that is due to differences in mean characteristics, weighted by whites regression coefficients. The residual is the unexplained component which is given by differences in whites and Africans regression coefficients, weighted by Africans average characteristics. A similar exercise can be carried out by gender, as well as for other races. Table 7 presents results for the decomposition analysis. Photograph by Amanda van der Walt 063
66 POVERTY AND INEQUALITY IN THE GAUTENG CITY-REGION Table 7: Decomposition analysis for LFP and employment by gender and race (percentage) Panel A: Decomposing gender gaps in official LFP rates Total Male female Explained Unexplained Panel B: Decomposing gender and racial gaps in employment Total White African Explained Unexplained Total White-coloured Explained Unexplained White Indian/ Asian Total Explained Unexplained Total Male female Explained Unexplained Panel C: Decomposing gender and racial gaps in formal sector employment Total Male female Explained Unexplained Total Male female Explained Unexplained DATA SOURCE: Authors calculations based on PALMS data 064
67 PART 2: LABOUR MARKET INEQUALITIES IN THE GAUTENG CITY-REGION Results for LFP Panel A of Table 7 presents findings for the gender differential in LFP over the period. It is notable that we did not decompose the LFP rates by race as per the descriptive statistics which showed statistical similarity in racial LFP rates. Nonetheless, the results for gender show that women are less likely to participate than men even after controlling for observable characteristics. The evolution of the total LFP differential (differences in men and women s predicted probabilities of participation) does not follow an obvious pattern from 1997 to 2012, but the magnitude is in the range of 13 to 19 percentage points. As for the sources of the gap, a closer look at the contributions of the explained and unexplained components shows that the unexplained component accounts for 80 to 90 percent of the gap over the given period. This implies that the male female differential in LFP is largely attributable to gender differences in coefficients/behavioural response, rather than to differences in endowments of observable characteristics. This suggests that if men and women had the same distribution of labour market characteristics (e.g. education), women would be less likely to respond by entering the labour force. To some extent this finding is due to self-selection, cultural norms and gender roles in society where women are more likely to be housewives or full-time caregivers to household members. If this finding is plausible, it calls for associated measures to encourage female LFP Results for employment Panel B of Table 7 presents results from the decomposition analysis of differences between the employment probabilities of whites and blacks (i.e. Africans, coloureds and Indians/Asians). This criterion follows as whites historically have higher employment rates than blacks, and it is therefore crucial to understand changes in and sources of the advantage enjoyed by whites and the disadvantage experienced by blacks. In light of high unemployment in South Africa, employed people are not a representative sample of the labour force. This necessitates controlling for sample selection bias in employment regressions. However, recent South African labour market studies are increasingly showing the difficulty of controlling for selection bias in wage and employment studies (Casale and Posel, 2011; Bhorat and Goga, 2013). This has been associated with a lack of proper instruments to control for the bias within available datasets, and attempts to control for the bias might introduce more biases to the studies. We therefore follow the standard set in the literature and report findings for the decomposition analysis which is based on employment functions which do not account for selectivity, implying that the findings should be cautiously interpreted. In general, the findings show that the employment gap is highest between whites and Africans, followed by whites and coloureds, and then whites and Indians/Asians. This suggests that the Gauteng labour market is hierarchical with whites having better employment opportunities followed by Indians/Asians, coloureds and Africans, respectively. The gaps between whites and blacks increased between 1997 and 2002, decreased in 2007 and increased afterwards. The decline in the employment gap between 2002 and 2007 is partly due to an increase in employment opportunities for all in preparation for the 2010 football World Cup. The increase in the employment gap between 1997 and 2002 could be linked to the skills biasedness of the labour market which was associated with trade liberalisation and the need for competitiveness which meant that most blacks (especially Africans and coloureds) with low skills levels therefore lost their jobs in the process. The case for whites and Africans shows between 1997 and 2012, a larger portion of the racial employment gap is explained. The explained component constitutes 58, 68, 71 and 91 percent of the overall gap in 1997, 2002, 2007 and 2012 respectively. This implies that Africans are less likely to be employed than whites due to inferior labour market characteristics. The average human capital of African workers seems to be deteriorating over time, suggesting that unprepared Africans are being forced into the labour market by dire economic circumstances. For instance, the finding for 2012 implies that if Africans had a similar distribution of observable characteristics as whites their employment levels could have been
68 POVERTY AND INEQUALITY IN THE GAUTENG CITY-REGION percent higher than they actually were. Also, the fact that the contribution of characteristics has been increasing over time implies that the labour market is increasingly employing more skilled people compared to unskilled. The findings furthermore suggest that the contribution of the unexplained component has been weakening over time. To some extent this implies that employers hiring processes are becoming less discriminatory over time. This is likely to be a result of affirmative action policies in employment. As for whites and coloureds, the gap was around 17.5 and 24.2 percentage points in the analysis period. Similar to the case in the preceding paragraph, most of the employment gap was explained. In 1997, 2002, 2007 and 2012, the explained component comprised 62, 85, 57, and 85 percent of the gap, respectively. This is to be expected as coloureds are less likely to be educated than whites. The contribution of the unexplained component does not follow an obvious pattern, but it lies in the range of 15 to 43 percent over the whole period. It is possible that this might to some degree be reflective of hiring practices that do not favour members of the coloured group despite the presence of affirmative action policies. The white Indian/Asian employment gap appears insignificant as it lies between 1.4 and 8.4 percentage points during the period of analysis. The gap is largely attributable to differences in labour market characteristics, rather than to their coefficients. Overall, these findings reveal that the white black employment differential is mainly explained by racial differences in labour market characteristics, which suggests that endowing the disadvantaged groups with labour market skills can be a viable strategy for reducing racial employment disparities in Gauteng. Employers hiring practices should also lean towards the previously disadvantaged groups Gender differentials in employment Table 7 shows that the gender differential in employment declined from 10.2 to 1.6 percentage points over the 1997 to 2012 period. This is due to a relatively high entrance of women into the informal sector and an increase in the education levels of women over time (Casale and Posel, 2002). When comparing the relative contributions of gender disparities in characteristics and coefficients to the total differential, neither dominates throughout the period. This implies that gender differences in labour market characteristics and employers hiring behaviour should be contributing to the discrepancy Formal sector employment Panel C of Table 7 displays findings for the decomposition of the white African racial differentials in the probability of formal sector employment. While the discussion above has highlighted that blacks are less likely to be employed (in general) than whites due to inferior observable characteristics, it is not clear whether the same factors also explain the racial distribution in formal/informal sector employment a proxy for job quality. To this end, we discuss the findings for the white African disparity in formal sector employment, as these are on the extremities of the employment spectrum. The total white African formal sector employment gap (difference in whites and Africans predicted probabilities of formal sector employment) increased over the 1997 to 2012 period; it was 15.5, 20.3, 24.1, and 26.2 percentage points in 1997, 2002, 2007, and 2012 respectively. Thus the relative chances for Africans to enter the formal sector decreased over time. The sources of this trend can be inferred from the relative contributions of the explained and unexplained components to the total differential. Table 7 shows that in 1997 the gap 066
69 PART 2: LABOUR MARKET INEQUALITIES IN THE GAUTENG CITY-REGION was mostly attributable (94 percent) to differences in observable characteristics. Therefore, if Africans had whites distribution of observable characteristics in 1997, the then white African formal sector employment gap would have been 94 percent lower. However, the findings changed between 2002 and 2012 in 2002, 2007, and 2012, only 10, 24 and 14 percent of the gap was due to racial differences in observable characteristics. This implies that the white African differential in formal sector employment is now explained by differences in coefficients/behavioural response. On the one hand, possible explanations for this finding include hiring discrimination, i.e. some formal sector employers still have distaste for hiring Africans compared to whites. If this finding is plausible, it solicits punitive measures against employers. Employers play a critical role in the functioning of the labour market through availing quality jobs to all. On the other hand, the outcome could be due to relatively more Africans self-selecting themselves out of the formal sector (into the informal sector) possibly due to lower endowments of human capital. The finding that the unexplained component dominates the white-african formal sector employment differential also applies to the gender differential in formal sector employment, although the total gender differential is comparatively smaller. This suggests that strategies to increase Africans formal sector employment should be extended to women in general. 5. Conclusion This study examines non-wage labour market inequalities in Gauteng using cross-sectional labour force datasets from 1994 to Given that labour market outcomes (i.e. LFP, employment, sector of employment and occupation) can vary significantly across demographic groups, we disaggregate the analysis by race, age, gender and education. We further examine the factors underlying inequality using the Fairlie (2005) decomposition method. The key findings of this study are that there are no significant differences in participation rates across races; however, we find significant differences by gender and age. The proportion of women participating in the labour force is lower than that of men suggesting that this subgroup still faces some constraints which keeps it out of the labour force. A similar trend is observed between youth (15-35 years old) and older individuals. While it is reassuring that all racial groups have almost similar LFP rates, we find marked differences across race with regards to employment, distribution across sectors (i.e. formal vs informal) and occupation. The results indicate that unemployment is most prevalent among Africans, followed by coloureds, Indians/Asians and then whites. Education is also an important factor determining employment as employment rates are high for those with higher levels of education compared to those with lower levels. The developments along sectors of employment and occupations show an increase in informal sector activities over the period and little progression along the occupation dimension for Africans. We find a large proportion of Africans in elementary jobs (in the legislative, managerial and professional occupations) relative to whites. This situation barely improved despite recent initiatives to address the skewed distribution of labour market opportunities. 067

70 POVERTY AND INEQUALITY IN THE GAUTENG CITY-REGION Photograph by GCRO A simple examination of LFP and employment rates by demographic groups can reveal interesting patterns with regard to raw differentials in labour market outcomes. This, however, does not allow us to understand the factors driving these differentials. To achieve this, we decomposed the differentials using the procedure proposed by Fairlie (2005). Our analysis for employment reveals large employment gaps between whites and Africans. This large gap is also present between whites and coloureds, but is fairly small for whites and Indians/Asians. Decomposition results show that the racial gap in employment is largely explained suggesting that Africans and coloureds have lower observed characteristics such as education, which explains their disadvantage. Therefore, policies to improve human capital among Africans and coloureds might go a long way in reducing the racial employment inequities that exist in Gauteng. With regards to gender, we find a declining gender gap in employment. The weight of the explained component is almost similar to the unexplained component. This suggests a need for measures to reduce gender discrepancies in employers hiring behaviour, and the same for gender differences in labour market characteristics. Employment in the formal sector has been declining over time, while it has been increasing in the informal sector. These trends have important implications for the welfare of workers in general and inequality in particular. While a growing informal sector can be a source of employment, the wages within this sector are known to be meagre, thereby increasing inequality between formal and informal sector employees. In view of this, job creation initiatives must be aimed at promoting the creation of decent jobs. The large gap in formal employment between whites and Africans is mainly explained by suggesting that whites have superior (human capital) characteristics enabling them to enter formal employment relative to Africans. Again, this result calls for policies aimed at equipping Africans with human capital. We also uncover a gender gap in formal employment in favour of men. This suggests that women still face some constraints in accessing employment in the formal sector thus, gendered policies are essential. This study has a number of limitations. The dataset we used does not allow for detailed disaggregation by location within Gauteng. We provide an aggregated analysis at the provincial level. Future studies can endeavour to provide a more complete picture. 068
71 PART 2: LABOUR MARKET INEQUALITIES IN THE GAUTENG CITY-REGION REFERENCES Allanson, P., Atkins, J. and Hinks, T. (2000) A multilateral decomposition of racial wage differentials in the 1994 South African labour market. The Journal of Development Studies, 37(1): Azam, J. and Rospabe, S. (2007) Trade unions vs statistical discrimination: Theory and application to post-apartheid South Africa. Journal of Development Economics, 84(1): Bargain, O. and Kwenda, P. (2011) Earnings structures, informal employment and selfemployment: New evidence from Brazil, Mexico and South Africa. Review of Income and Wealth, 57: S100 S122. Becker, G.S. (1962) Investment in human capital: A theoretic analysis. Journal of Political Economy, LXX, No. 5, Part 2: Becker, G.S. (1971) Economics of discrimination. Chicago: University of Chicago Press. Bhorat, H. (2000) The impact of trade and structural changes on sectoral employment in South Africa. Development Southern Africa. Special issue. September, 17(3): Bhorat, H. and Goga, S. (2013) The gender wage gap in post-apartheid South Africa: A re-examination. Journal of African Economies, 22(5): Bhorat, H., Lundall, P. and Rospabe, S. (2002) The South African labour market in a globalized world: Economic and legislative considerations, Employment Paper 2002/32. Cape Town: Development Policy Research Unit (DPRU), University of Cape Town. Geneva: International Labour Organization. Blinder, A.S. (1973) Wage discrimination: Reduced form and structural estimates. Journal of Human Resources, 8(4): Branson, N. and Wittenberg, M. (2014) Reweighting South African National Household Survey data to create a consistent series over time: A cross-entropy estimation approach. South African Journal of Economics, 82(1): Casale, D. and Posel, D. (2002) The continued feminisation of the labour force in South Africa. South African Journal of Economics, March, 70: Casale, D. and Posel, D. (2011) Unions and the gender wage gap in South Africa. Journal of African Economies, 20(1): Eastern Cape Socio-Economic Consultative Council (ECSECC) (2013) Quarterly Economic Update, First Quarter. Available at ecsecc.org/information-centre/?type=statisticsdata#publications. Even, W. and Macpherson, D.A. (1993) The decline of private sector unionism and gender wage gap. Journal of Human Resources, 28(2): Fairlie, R. (2005) An extension of the Blinder-Oaxaca decomposition technique to logit and probit models. Journal of Economic and Social Measurement, 30(4): Fallon, P. and Lucas, R. (1998) South African labour markets: Adjustments and inequalities. Discussion Paper 12, Discussion papers on the South African economy. Washington, D.C.: World Bank. Gauteng Economic Development Agency (GEDA) (2008) Gauteng Economic Opportunity Atlas: Gauteng, South Africa. Johannesburg: GEDA. Harris, J.R. and Todaro, M.P. (1970) Migration, unemployment, and development: A two-sector analysis, American Economic Review, 60(1):
72 POVERTY AND INEQUALITY IN THE GAUTENG CITY-REGION Hlekiso, T. and Mahlo, T. (2006) Wage trends and inequality in South Africa: A comparative analysis, Labour Market Frontiers, 8: Pretoria: South African Reserve Bank. International Labour Organisation (ILO) (2002). Women and men in the informal economy: A statistical picture. Geneva: ILO. Kingdon, G. and Knight, J. (2007) Unemployment in South Africa, : Causes, problems and policies, Journal of African Economies, 16(5): Leibbrandt, M., Woolard, I., McEwen, H. and Koep, C. (2009) Employment, and inequality outcomes in South Africa. Cape Town: Southern Africa Labour and Development Research Unit (SALDRU) and School of Economics, University of Cape Town. Lewis, W.A. (1954) Economic development with unlimited supplies of labour. Manchester School of Economics and Social Studies, 24(3): Ntuli, M. and Gwatidzo, T. (2013) A comparative analysis of immigrants and natives occupational attainment in post-apartheid South Africa. International Business and Economics Research Journal, 12(9): Ntuli, M. and Wittenberg, M. (2013) Determinants of black women s labour force participation in post-apartheid South Africa. Journal of African Economies, 22(3): Oaxaca, R.L. (1973) Male female wage differentials in urban labour markets. International Economic Review, 14(3): Perry, G., Maloney, W., Arias, O., Fajnzylber, P., Mason, A. and Saavedra-Chanduvi, J. (eds) (2007) Informality: Exit and exclusion. World Bank Latin American and Caribbean Studies. Washington, D.C.: World Bank. Rasool, F., Botha C.J. and Bisschoff C.A. (2012) Push and pull factors in relation to skills shortages in South Africa, Journal of Social Sciences, 30(1): Van der Berg, S. and Bhorat, H. (1999) The present as a legacy of the past: The labour market, inequality and poverty in South Africa. Development Policy Research Unit (DPRU) Working Papers 99029, Cape Town: DPRU, University of Cape Town. Photographs by Amanda van der Walt 070


73 PART 2: LABOUR MARKET INEQUALITIES IN THE GAUTENG CITY-REGION 071

74 POVERTY AND INEQUALITY IN THE GAUTENG CITY-REGION Photograph by Amanda van der Walt 072

75 PART 3: A MULTIDIMENSIONAL POVERTY INDEX FOR GAUTENG 073
76 POVERTY AND INEQUALITY IN THE GAUTENG CITY-REGION Part 3 A Multidimensional Poverty Index (MPI) for Gauteng: Evidence from Quality of Life Survey data DARLINGTON MUSHONGERA, PRECIOUS ZIKHALI AND PHINDILE NGWENYA Abstract Analyses of poverty in South Africa have generally focused on money-metric measures and tend to be pitched at either national or provincial levels. These unidimensional approaches, though important, are narrow and provide little information on the many dimensions of poverty that poor people experience. National level analyses also mask the poverty dynamics that prevail at the micro level. As a result, these studies are of limited use to local government where policy implementation occurs and where information about the poor is desperately needed. The key limiting factor has been the nature of available datasets which do not permit spatial disaggregation to local or lower levels. While National Census data allow for lower level spatial disaggregation, the ten-year gap between censuses limits government planning capabilities. The availability of three recent and unique Quality of Life Survey (QoL) datasets from the Gauteng City-Region Observatory (GCRO) presents an opportunity to undertake a multidimensional poverty analysis for Gauteng at three geo-scales: provincial, local and ward levels. We develop a Multidimensional Poverty Index (MPI) for Gauteng for 2011 and 2013 using the Alkire-Foster method. Overall, the MPI for Gauteng is low but varies markedly by municipality and by ward. The MPI is revealed to be strongly correlated with income poverty. Not only are income poor households more likely to be multidimensionally poor, they also suffer from higher intensities of poverty. Multidimensional poverty tends to be highest in areas that have low economic activity and are located on the edges of the province. However, pockets of multidimensional poverty exist even in better performing municipalities. More in-depth analyses of developmental challenges at much more localised levels are needed to assist local government to devise policies that channel investments into lagging areas and avoid using approaches that are indifferent to the heterogeneities that exist across local geographical spaces. Keywords: multidimensional poverty, headcount ratio, poverty intensity, Quality of Life Survey, Gauteng 1. Introduction In spite of major policy and legislative interventions enacted since 1994, reducing poverty and inequality remains one of the major challenges facing the South African government. The first post-apartheid government prioritised the reduction of poverty and inequality and this is reflected in several policies and legislative enactments, in particular the Reconstruction and Development Programme (RDP) 074

77 PART 3: A MULTIDIMENSIONAL POVERTY INDEX FOR GAUTENG More in-depth analyses of developmental challenges at much more localised levels are needed to assist local government to devise policies that channel investments into lagging areas and avoid using approaches that are indifferent to the heterogeneities that exist across local geographical spaces. Photograph by Simphiwe Mangole 075
78 POVERTY AND INEQUALITY IN THE GAUTENG CITY-REGION of 1994 (Republic of South Africa (RSA), 1994: 7). Twenty years on, reducing poverty and inequality along with unemployment are still major objectives of government, occupying a central place in the National Development Plan (NDP) 2030, published in November In addition to pursuing economic growth as a broad measure for alleviating poverty and lowering inequality, the South African government also uses the budget to pursue these goals through the social wage (RSA, 2013; Statistics South Africa (Stats SA), 2014a). 1 The social wage which constituted around 60 percent of total government spending in 2013 provides the poor, the previously disadvantaged, and marginalised communities access to basic services under the Free Basic Services Programme (FBS) and other social protection initiatives (RSA, 2013). Free basic services include subsidised access to electricity, water, sanitation, and refuse removal. Social protection comprises social grants. Social spending on primary healthcare, education, enhancing access to productive assets by the poor (e.g. housing and land), and job creation through the Expanded Public Works Programme (EPWP) also forms part of the social wage. Initiatives to reduce poverty and inequality are also high on the agenda of the current Gauteng Provincial Government (GPG). In 2014, GPG adopted the Multi-Pillar Programme for Radical Transformation for Gauteng. One of the ten pillars currently included in the programme is Accelerated Social Transformation (AST) 2 and poverty reduction forms part of this sub-programme (GPG, 2014a). In addition to the AST, GPG launched the Ntirhisano (working together) Service Delivery War Room Strategy (NSDWR). This strategy aims at establishing a cohesive and integrated network of service response structures that connect all levels of administration from provincial down to ward level. The strategy also aims at creating a shift in how people s needs are identified, responded to and resolved (GPG, 2014b). A public complaints and response system and a household profiling system were put in place during 2014 and community-based field workers were deployed to monitor service delivery at local level (GPG, 2014b). These initiatives are indicative of the commitment by the leadership of GPG to accelerate social transformation and deal with the various aspects that define poverty at the local level. A strategy for ensuring that the various local municipalities and other development agencies work in tandem was drawn up as a way of avoiding duplication of efforts. GPG also took advantage of existing partnerships with research institutions, in particular GCRO, in pursuance of the ward profiling process. This ward profiling process enables the identification of areas that are lagging behind in terms of infrastructure provision and ensure that development initiatives target needy communities. 2. Poverty measurement In order to effectively address poverty in the manner envisaged by GPG, accurate, reliable and timely information at the local scale is essential. Local level analyses are also important for evaluating the impact of government poverty reduction programmes. Since Sen s (1976) 3 seminal work on 1. The social wage refers to monetary and in-kind support given to vulnerable households. Four components make up the social wage in South Africa (i) housing and community amenities; (ii) health; (iii) education; and (iv) social protection. The first three replace or subsidise day-today expenses for housing, education and health thereby reducing the cost of living. The fourth is income paid directly to vulnerable groups. 2. A Gauteng programme aimed at raising the living standards of all the people in the province through provision of quality education and healthcare, social protection to the vulnerable, in particular, women and children, and eradication of poverty and building social cohesion and social solidarity. 3. This work proposed a new measure of poverty, which avoided some of the shortcomings of preceding measures. An axiomatic approach was used to derive the poverty measure and the conception of welfare in the axiom set is ordinal. Given the limited information requirement, the new measure is practically useful. 076
79 PART 3: A MULTIDIMENSIONAL POVERTY INDEX FOR GAUTENG measuring poverty, significant advances have been made towards finding an appropriate measure of poverty and social wellbeing. However, reliance on a single measure of poverty is problematic because it limits policy-makers understanding given that poverty takes different forms beyond just income. As can be expected, the choice of the poverty measure has direct bearing on how poverty is understood and consequently influences how it is analysed and the type of policies that are prescribed to address it (Alkire and Foster, 2011). In general, therefore, poverty measurement methodologies can have tremendous practical and policy relevance (Alkire and Foster, 2011).The need for a multidimensional approach to poverty is widely shared as a guide to the search for an adequate indicator of poverty (Anand and Sen, 1997). As (Sen, 2000:9) rightly observed: Human lives are battered and diminished in all kinds of different ways, and the first task, seen in this perspective, is to acknowledge that deprivations of very different kinds have to be accommodated within a general overarching framework. Based on Sen s observation, it is clear that the multidimensional measurement of poverty is essential from both practical and policy perspectives. Several attempts have been made to do this, notably Anand and Sen (1997); Atkinson (2003); Bourguignon and Chakravarty (2003); Kakwani and Silber (2008); and Thorbecke (2008). The conception of poverty as being multidimensional also forms the basis for the Human Development Index (HDI) and the Millennium Development Goals (MDGs). Traditionally, poverty analyses across the world have favoured the money-metric measures that utilise mainly income data and a given threshold. Using this unidimensional approach, all individuals or households that fall below a specified minimum income threshold (the poverty line) are deemed poor. A numerical poverty measure is used to determine the overall level of poverty across the entire population relative to the given poverty line (Alkire and Foster, 2011). 4 In spite of the contestations in the setting of the threshold amount, the general appeal for moneymetric approaches is that income is an important component of household welfare. It facilitates access to a wide range of other items that are essential to life, e.g. food, clothing, schooling, household assets, and so on. However, money-metric measures of poverty are often criticised for limiting comparisons across countries (or surveys) given that survey designs vary across countries. Money-metric measures often fail to capture the value of services that are typically not transacted on the market even though these services form a significant part of the broader multidimensional aspects of poverty. For instance, access to water, sanitation, education, health, and food, contributes significantly to household welfare and the costs are often much higher than reflected in household expenditures on these items. In South Africa, numerous analyses of poverty and inequality have been conducted, e.g. Seekings and Nattrass (2005); Woolard and Leibbrandt (2006); Bhorat et al. (2007); Leibbrandt et al. (2010); Leibbrandt and Levinsohn (2011); Ngepah (2011); Tregenna (2011); Sekhampu (2013); and Stats SA (2014a). The majority of the literature on levels of poverty and inequality in post-apartheid South Africa is based on either national or provincial population surveys. Key national datasets used, either alone or in combination, include the Income and Expenditure Surveys (IES), the October Household Surveys (OHS), the Quarterly Labour Force Surveys (QLFS), and the National Census. A number of sub-national surveys have also been undertaken at sub-provincial levels notably the KwaZulu-Natal Income Dynamics Study (KIDS) and the Cape Area Panel Study. Detailed but succinct summaries of findings from these studies are given in Noble et al. (2006). Some of these studies have applied a range of poverty lines to assess the incidence, intensity and severity of poverty, e.g. Woolard and Leibbrandt (2001); Martins (2003); and Hoogeveen and Özler (2006). Each of these lines is set at different levels based on particular assumptions. However, the 4. For a concise history and the use of unidimensional measures see Alkire and Foster (2011). 077
80 POVERTY AND INEQUALITY IN THE GAUTENG CITY-REGION use of money-metric measures in South Africa not only presents a mixed view of changes in wellbeing since 1994 but also they differ markedly from nonmoney-metric approaches showing an increase in welfare (Schiel, undated). For example, Bhorat et al. (2009) showed that in South Africa people s access to public assets such as formal housing, piped water, electricity for lighting and cooking, as well as certain private assets such as radios and televisions, increased remarkably after 1994, particularly among the previously disadvantaged groups. Using a range of socio-economic and demographic indicators in 21 nodes across South Africa that are known for their high levels of poverty, Everatt (2009) also showed that after 1994 poverty levels improved significantly in the 21 nodes, although challenges do still exist. As such, unidimensional measures tend to underestimate both levels of and changes in welfare. However, it is possible for there to be a situation where income poverty is falling while non-income poverty is rising. Apart from being predominantly unidimensional and money-metric, most studies on poverty in South Africa have a shortcoming that renders their findings less relevant at sub-national levels such as provinces and local municipalities. The shortcoming is that they tend to be aimed at a national level owing to the nature of available datasets that constrain analysis of poverty at sub-national level. Alternative approaches are therefore needed to complement the money-metric measures as well as to focus attention on poverty dynamics at sub-national and localised levels (the spatial dimension). In South Africa, there is a strong correlation between apartheid geography and the socio-economy of the country. Apartheid South Africa was characterised by acute state driven structural imbalances that prejudiced mainly the African population. These imbalances have persisted well into the post-apartheid period raising questions about the efficacy of current government policies, approaches to poverty reduction, and the targeting mechanisms. Although poverty reduction is high on the policy agenda of GPG, limited information exists on the nature, depth and severity of the various dimensions of poverty at the localised level to enable government to craft appropriate and effective policy interventions at that level. Accordingly, this paper deepens our understanding of poverty at sub-provincial level in South Africa by exploring changes in non-monetary measures of poverty and wellbeing between 2009 and 2013 using Gauteng province as a case study. Specifically, the paper: (i) expands the analysis of poverty by adopting a multidimensional approach which focuses on non-money-metric aspects of poverty; and (ii) examines the spatial configuration of multidimensional poverty within Gauteng. The analysis is made possible by the availability of three datasets from GCRO s QoL Surveys that focus exclusively on Gauteng. These datasets permit a more nuanced analysis of poverty as a result of their emphasis on aspects that directly affect people s wellbeing. In addition, the datasets permit analysis down to the ward level. Such a level of analysis is not possible when using official datasets such as the General Household Surveys (GHS), IES, and QLFS, among others, which allow only for national and provincial level analyses. Given that the mandate for service delivery in South Africa falls directly on the local sphere of government, these national surveys have limited value to policy-makers at the local level. This paper aims to address this shortcoming not just by computing an MPI, but also by showing the spatial variations in multidimensional poverty across Gauteng s geographical localities. The findings of this study are intended to inform the poverty reduction initiatives for AST under Gauteng s Multi-Pillar Programme introduced in The rest of the paper is organised as follows: Section 3 situates Gauteng within the broader national geographical and socio-economic context. In Section 4, a multidimensional approach to poverty analysis is discussed. The data used in the analysis are presented in Section 5, while Section 6 outlines the Alkire-Foster methodology. Results are presented in Section 7, followed by a discussion in Section 8, and conclusion in Section The premier for Gauteng province, Mr David Makhura, stressed during the State of Province Address that the province was adopting evidence-based planning. 078
.")
81 PART 3: A MULTIDIMENSIONAL POVERTY INDEX FOR GAUTENG 3. Gauteng province: An overview 3.1 Location and size Gauteng is one of South Africa s nine provinces and is centrally located in the northern part of the country (Figure 1). It shares its border with four other provinces namely Limpopo to the north, Mpumalanga to the east, the Free State to the south, and North West to the west. The province straddles major transportation routes in the country. It is relatively small in physical size stretching an estimated km 2 or just over 1 percent of South Africa s total land area. Gauteng is comprised of ten local municipalities, three of which are some of the largest metropolitan cities in the country by population and by economic activity. These are the City of Johannesburg (CoJ) which is the financial capital, City of Tshwane (CoT) which is also commonly known as Pretoria and serves as the administrative capital, and Ekurhuleni Metropolitan Municipality (EMM) which is a major industrial hub and home to the well-known O.R. Tambo International Airport. Figure 1 shows the map of Gauteng and its ten local municipalities. Gauteng is largely an urban province and this dates back to the discovery of gold in the late 19th century and subsequent gold mining activities of the early to mid-20th century. The scale of gold mining was so large that it attracted a lot of investment from across the world and the demand for both skilled and unskilled labour was very high. Within the space of a century, the area had evolved into a very large urban landscape characterised by a wide diversity of cultures and socio-economic disparities. Ironically, despite being a place of gold, Gauteng has some of the most underdeveloped communities in the country and levels of inequality are very high. Photograph by GCRO 079
82 POVERTY AND INEQUALITY IN THE GAUTENG CITY-REGION Figure 1: Map of Gauteng and its municipalities limpopo city of tshwane north west mogale city randfontein city of johannesburg ekurhuleni metropolitan municipality mpumalanga merafong city westonaria lesedi emfuleni midvaal kilometres free state Gauteng province Provincial boundaries SOURCE: GCRO GIS Maps NOTE: The boundaries of municipalities changed in the 2016 local government elections, and the two municipalities of Randfontein and Westonaria were merged into a new municipality - Rand West. The analysis in this chapter is based on the old municipalities, and so the old map of local government in Gauteng is used here. 080
83 PART 3: A MULTIDIMENSIONAL POVERTY INDEX FOR GAUTENG 3.2. Demography Although physically smaller than any other province, Gauteng is the most populous province in the country with an estimated population of over 12 million (Stats SA, 2011). It is therefore close in size to metropolitan Los Angeles, which has an estimated 12.9 million people in an area of km 2, and metropolitan Paris with 11.7 million people in a region of km 2 (GCRO, 2012). National Census 2011 showed that 23.1 percent of South Africa s population lives in Gauteng. Projecting forward at current annual average population growth rates Gauteng may have as many as 15.6 million people by 2020, at which point it would house 26.5 percent of the country s population (GCRO, 2012). Figure 2 shows that more than 85 percent of Gauteng s population is located in the three metropolitan municipalities. Although all municipalities are predominantly African, there is a higher concentration of Africans in areas with low economic activity. Examples include Westonaria, Merafong City and Emfuleni where the African population constitutes 92 percent, 87 percent and 86 percent respectively. Low economic activity is associated with limited access to employment and income-generating activities. Under apartheid, Africans were also forced to live in overcrowded and underserviced townships where high levels of deprivation are often still found. The legacy of this segregation remains visible in present-day Gauteng. Figure 2: Population distribution in Gauteng Johannesburg 36.1% Ekurhuleni 25.9% Tshwane 23.8% Emfuleni 5.9% Mogale City 3.0% Merafong City 1.6% Randfontein 1.2% Westonaria 0.9% Lesedi 0.8% Midvaal 0.8% 0% 10% 20% 30% 40% SOURCE: Stats SA (2011) 081
84 POVERTY AND INEQUALITY IN THE GAUTENG CITY-REGION Table 1 shows population distribution by race based on data from National Census As the table indicates, 78 percent of Gauteng s population is African. Given such a skewed population distribution and the policy of separate development pursued by the apartheid government, poverty and inequality trends correlate highly with race. This is also a distinctive feature of development in South Africa generally. Table 1: Population distribution by race and by municipality (percent) African Coloured Indian/ Asian White Emfuleni Midvaal Lesedi Mogale City Randfontein Westonaria Merafong City Ekurhuleni Johannesburg Tshwane Total DATA SOURCE: Stats SA (2011) While population statistics at regional level are critical, it is usually at the household level where local government interest lies because the rollout of service delivery (i.e. water and electricity supply, waste removal, housing provision, etc.) depends on the number of households in a given municipality. National Census 2011 revealed that there are 3.9 million households in Gauteng (24.4 percent of total households nationally), having increased by nearly 1.2 million since the Census of Apart from natural population increase, Gauteng also attracts a large number of people from other provinces, neighbouring countries and elsewhere. The majority, particularly those from other provinces, are poor young people looking for economic opportunities that Gauteng is assumed to offer (Landau and Gindrey, 2008). 082
85 PART 3: A MULTIDIMENSIONAL POVERTY INDEX FOR GAUTENG Figure 3: Population age distribution for Gauteng 3.0% 2.5% 2.0% 1.5% 1.0% 0.5% 0.0% AGE IN COMPLETED YEARS SOURCE: Authors, using Quantec data As shown in Figure 3, there is a very large population in the year old cohort, which can only be explained by the high rate of migration into the province. As a result, Gauteng faces huge challenges related to unemployment, migration, pressure on service delivery and urbanisation more generally. Municipalities in Gauteng are therefore under extreme pressure to maintain and improve existing levels of service delivery while extending services to cater for the growing population and the rapid rate of urbanisation. 083
86 POVERTY AND INEQUALITY IN THE GAUTENG CITY-REGION 3.3. Access to basic services National Census 2011 shows that access to formal housing and basic services such as water, sanitation and electricity has improved significantly over the last ten years. On average, about 75 percent of households across Gauteng now live in formal dwellings, 92 percent have access to water in their dwelling or yard, 92 percent have access to a flush or chemical toilet, 88 percent have refuse collection by their municipality once a week, and 90 percent use electricity for lighting. Access to telephone and cellular communication rose phenomenally from 59.2 percent in 2002 to 96.3 percent in 2012 (Stats SA, 2014b). Although overall service delivery appears to have increased, the picture is not uniform across Gauteng municipalities with places such as Westonaria, Merafong City and Midvaal still lagging behind in certain respects. As will be shown later, the picture again changes when analysis is taken to a much lower level, i.e. the ward. Here we notice pockets of poverty in well-off municipalities such as Johannesburg, Tshwane and Ekurhuleni. Despite the increase in access, there is a growing trend not just of service delivery protests but also of dissatisfaction with local government by members of the community in Gauteng. During the 2013 QoL Survey all ten municipalities recorded dissatisfaction rates of 46 percent and above compared to only three municipalities in This disjuncture between access and levels of satisfaction with government requires in-depth analysis and a more robust method of analysing poverty, as well as locating the major hot spots in the province where levels of access to basic services is lacking. Knowledge of the dimensions of poverty and their spatial distribution is essential for government to design appropriate policy interventions and target the right people. It is clear that all municipalities need to improve the quality of services beyond the RDP Level 1 standards that were set in 1994 as an interim measure. There is growing evidence that communities are seeking better forms of sanitation than the provision of chemical toilets, for example Poverty, inequality, unemployment With an income Gini of 0.69, South Africa is among the countries with very high levels of income inequality (Triegaardt, 2006; Tregenna and Tsela, 2012; World Bank, 2012). Such levels of income inequality are more acute in urban environments, and Gauteng is no exception. High income inequality coupled with high levels of deprivation and a large population exerts pressure on government to deliver services. Municipalities are also hard-pressed to assist the poor and indigent members of society who cannot afford to pay for services. Spatial data from the GCRO s 2013 QoL Survey indicate that income inequality is very high in the three metropolitan areas of Johannesburg (income Gini of 0.74), Ekurhuleni (0.77) and Tshwane (0.72). In a country like South Africa with low levels of social cohesion (GCRO, 2012), high-income inequality is a potential source of socio-economic tension and extreme incidences of violence such as xenophobia. In spite of the existence of a large industrial base, Gauteng had a high unemployment rate of 25.5 percent as of the second quarter of Although the unemployment rate was lower than the national average (36 percent), Gauteng faces a more serious problem given the size of its population (the 25.5 percent unemployment rate translates to about 1.8 million people who are unemployed). Table 2 shows that unemployment rates increased in all municipalities between 2008 and Although the unemployment rate is generally high across all municipalities, it is worse for places like Ekurhuleni (27.8 percent for 2013), Merafong City (28.4 percent), Emfuleni (39.2 percent) and Westonaria (42 percent). Only Tshwane and Mogale City have unemployment rates of less than 23 percent. 084

87 PART 3: A MULTIDIMENSIONAL POVERTY INDEX FOR GAUTENG Table 2: Unemployment rates by municipality Tshwane Mogale City Randfontein Lesedi Johannesburg Midvaal Ekurhuleni Merafong City Emfuleni Westonaria Gauteng DATA SOURCE: Quantec Linked to unemployment, Gauteng has a significant proportion of households without a single source of income. The households also face challenges when they try to get on to the government indigent register in order to receive social grant support. During Census 2011, 17 percent of Gauteng households reported that they did not have any income of these 87 percent were African. With 3.9 million households and an average household size of 4.2, it means that approximately 2.7 million people in Gauteng face deep poverty due to lack of income. Photograph by Amanda van der Walt 085
88 POVERTY AND INEQUALITY IN THE GAUTENG CITY-REGION 3.5. Economy It is ironic that Gauteng faces problems of poverty and unemployment when it has a very large and diverse economy. As shown in Figure 4, the gross domestic product (GDP) for Gauteng far exceeds that of other provinces, a trend that has been maintained over the last 20 years. For example, in 2012 alone Gauteng contributed 35 percent to total GDP for South Africa. In real terms, Gauteng s GDP has increased from R million to R million between 1995 and 2012 (an increase of 83 percent). In spite of its large population, per capita GDP is also much higher compared to other provinces and it increased significantly from R in 1995 to R in 2012 (an increase of 20 percent). However, given the high levels of inequality, the massive wealth generated in Gauteng is only enjoyed by a small proportion of the population. As Piketty s works suggest, the more income is generated, the wider the gap between the rich and the poor (Moore, 2014). Figure 4: GDP per province: Gauteng KwaZulu-Natal Western Cape Eastern Cape Mpumalanga Limpopo North West Free State Northern Cape RAND MILLION SOURCE: Authors, using Quantec data 086
89 PART 3: A MULTIDIMENSIONAL POVERTY INDEX FOR GAUTENG The bulk of Gauteng s wealth is generated in the three metropolitan areas as shown in Table 3. Approximately 90 percent of total provincial wealth comes from the three metropolitan cities of Johannesburg, Tshwane and Ekurhuleni. Table 3 shows that GDP as measured by Gross Value Added (GVA) is highest in the metro areas for the three years 2009, 2011 and In other Gauteng municipalities such as Randfontein, Midvaal, Westonaria, Lesedi and Merafong City economic activity has either become stagnant or has declined considerably as shown by the almost insignificant levels of output. The result is that people in economically low areas are forced to travel long distances to work, to search for jobs and/or conduct business. Table 3: GVA by municipality at constant 2005 prices R millions % of total R millions % of total R millions % of total Tshwane Mogale City Randfontein Lesedi Johannesburg Midvaal Ekurhuleni Merafong City Emfuleni Westonaria Gauteng DATA SOURCE: Quantec 087
 of 2008/09 was the first survey designed by Stats SA with the specific objective of measuring poverty.")
90 POVERTY AND INEQUALITY IN THE GAUTENG CITY-REGION 4. MPI: An alternative approach The Living Condition Survey (LCS) of 2008/09 was the first survey designed by Stats SA with the specific objective of measuring poverty. The LCS emerged from earlier attempts by government to find a suitable measure of poverty. These attempts include: (i) the Key Indicators of Poverty in South Africa, 1995; (ii) Participative Poverty Assessment South Africa Report, 1998; (iii) Poverty and Inequality Report, 1998 (Studies in Poverty and Inequality Institute (SPII), 2013); (iv) the Taylor Committee on the State of Poverty in South Africa, 2002 (Taylor, 2002); and (v) Towards an Anti-Poverty Strategy for South Africa, 2008 (RSA, 2008). 6 In 2012, South Africa published a set of three national poverty lines for use in assessing poverty in the country (Stats SA, 2014b). These lines were labelled with the following threshold amounts: (i) the food poverty line (FPL) R305; (i) lower-bound poverty line (LBPL) R416; and (ii) upper-bound poverty line (UBPL) R577. In the same year the three poverty lines were applied to the 2008/9 LCS. Despite using the three poverty lines, the Stats SA poverty profiles based on the 2008/9 LCS data were largely unidimensional even though thresholds were set in such a way as to relate to specific baskets of goods and services. However, having an income equivalent to any of the three thresholds does not imply access and hence the survey made various incorrect assumptions about what happens in reality. For example, the prices of goods and services are not uniform across the different municipalities. Photograph by Holger Deppe 6. This study used a poverty line based on monthly household expenditure of R800. It acknowledged the absence of more rigorous statistics but the figure used equated to the lowest international poverty line of a dollar a day at the time. 088

91 PART 3: A MULTIDIMENSIONAL POVERTY INDEX FOR GAUTENG Photograph by Skhumbuzo Mtshali 4.1 The multidimensional approach to poverty analysis Although money-metric approaches to poverty analysis are desirable on the basis of objectivity, reliance on a single dimension of poverty is problematic. The approaches assume the existence of markets and as such they fail to account for missing markets. Important outcomes such as education, health, water and sanitation improve people s wellbeing but are not typically transacted wholly on the market. On the other hand, poverty is a complex concept and conventional measures do not capture comprehensively what the concept entails. The MPI is one of the latest attempts at finding alternative approaches to complement the money-metric approach of measuring poverty as well as providing policy-makers with adequate information on the levels and dimensions of deprivation that people suffer. The increase in non-monetary data relevant to poverty has widened the scope for conducting MPI type analyses of poverty. Such data include the GCRO QoL Survey data. Across the world, a number of researchers and organisations have adopted the multidimensional framework for poverty analysis. These include work on the Human Development Index (HDI) by the United Nations Development Programme (UNDP) 7 and the Global Multidimensional Poverty Index by the Oxford Poverty and Human Development Initiative (OPHI). 8 In the case of South Africa, a key study that used a multidimensional approach to poverty analysis was the Provincial Indices of Multiple Deprivation for South Africa (PIMD) developed using Census 2001 data (Noble et al., 2006). Thirteen indicators spread across five domains of deprivation were used in the analysis. 9 In 2008, the presidency commissioned the Southern Africa Labour and Development Research Unit (SALDRU) to implement the National Income Dynamics Study (NIDS). NIDS was the first national panel survey designed with the specific objective of tracking not only poverty but also changes in household income over time. Finn and Leibbrandt (2013) compiled the MPI transition matrices for South Africans using the NIDS data and compared changes in the poverty profile of respondents across the three survey waves of 2008, 2010, and Although NIDS data have everything it takes to comprehensively analyse poverty, it is a national panel survey and it is not possible even to conduct provincial level analysis. The usefulness of findings from NIDS to policy-makers at local level is therefore limited The five domains used were: (i) income and material deprivation; (ii) employment deprivation; (iii) health deprivation; (iv) education deprivation; and (v) living environment deprivation. 089

92 POVERTY AND INEQUALITY IN THE GAUTENG CITY-REGION The most recent multidimensional poverty analysis is the South African Multidimensional Poverty Index (SAMPI) conducted by Stats SA during 2013/14. The SAMPI uses 2001 and 2011 Census data and the analysis drills down to ward level. While the SAMPI was designed along the lines of the Global MPI, it was adapted for the South African context and thus does differ in a few respects (Stats SA, 2014c). The analysis done in this paper is an addition to the growing body of literature on multidimensional poverty analysis. It develops a Multidimensional Poverty Index for Gauteng (GMPI) using the Alkire-Foster method (Alkire and Foster, 2011). The GMPI provides comparison over a six-year period, , and therefore allows us to track changes in multidimensional poverty over much shorter periods. Consequently we are able to assess the susceptibility of households to shocks in the economy as well as test the responsiveness of government and the impact of their interventions. Uniquely, the GMPI further breaks down the analysis by income groups to capture and compare poverty dynamics across the different income groups. The contribution of each indicator to GMPI is also assessed thereby providing information on the indicators in which households are mostly deprived. Alkire and Foster (2011) outline a number of desirable properties associated with the MPI methodology and put forward proposals that make multidimensional poverty analyses useful to policy-makers and practitioners. These include: (i) its comprehensiveness as it takes into account the various types of deprivations that people face, it allows for the compilation of comprehensive poverty profiles; (ii) openness there is no limit to the number of dimensions or indicators that can be used; (iii) flexibility the choice of dimensions and indicators can be adapted to suit the available data; (iv) decomposability the MPI is a weighted average of a number of subgroup poverty levels, hence each subgroup can be analysed both independently and as an aggregate; (v) replication invariance poverty is measured relative to population size, facilitating comparisons across different population sizes; (vi) symmetry the measure of poverty is not affected by a switch in achievements between people, this way, the MPI does not overemphasise one group of people over another; and (vii) uses ordinal data unlike unidimensional measures, the MPI accommodates ordinal data, i.e. ranked preferences it is therefore possible to aggregate across dimensions without losing critical information about the dimensions and Photograph by GCRO 090

93 PART 3: A MULTIDIMENSIONAL POVERTY INDEX FOR GAUTENG Photograph by Trevor McGurk indicators (Alkire and Foster, 2011). The Alkire- Foster method is based on a concept of poverty as multiple deprivations that are simultaneously experienced. This means that persons confronted by a broad range of deprivations are considered poor, while those with limited breadth of deprivation may not necessarily be poor (Alkire and Foster, 2011). Alkire and Foster apply a censoring process, which limits consideration to the deprivations of the poor. As a result, the method is sensitive to the joint distribution of deprivations, a characteristic that is suppressed in unidimensional measures. It combines both the headcount poverty (the proportion of people that are poor) and the intensity (the average percentage of dimensions for which the poor are deprived). It is important to note that while the terms deprivation and poverty are often used interchangeably, they are conceptually different. Deprivation refers to lack of access to specific services and thus alludes to people s needs not being met. Poverty, on the other hand, refers to the extent to which resources constrain people s capability to meet those needs. Though not complete, there is an overlap between the two concepts. Deprivation is expected to have a direct bearing on poverty, and vice versa. Examples of indicators that are used to gauge deprivation include water and sanitation, energy, housing, and schooling, all of which pertain to public service delivery. While it can be argued that there is no guarantee that providing these services would lift people from poverty, it is true that such provision improves their lives and could enable them to be more active in identifying and pursuing opportunities that create resources and eventually reduce poverty. The indicators used in this paper reflect a mix of the two concepts. This is because data limitations do not allow us to disentangle lack of resources to access services from lack of access because the relevant authorities have not put in place the infrastructure to support provision of that particular service. For instance, it is not possible to establish whether a household has no access to electricity because they cannot pay for a connection or because the relevant public authority has not provided the infrastructure. Yet, for indicators such as food security, lack of resources would clearly be relevant. Technically, the term deprivation is used here to refer to a condition where a household falls short of a given threshold (cut-off) in a particular indicator. 091
94 POVERTY AND INEQUALITY IN THE GAUTENG CITY-REGION 5. Data This paper utilises GCRO QoL data for 2011 and GCRO QoL Surveys are conducted biannually and are deliberately designed to focus solely on Gauteng. Given this unique focus on Gauteng, QoL Surveys are an important information source for all municipalities in the province that are interested in understanding the impact of service delivery efforts on communities as well as people s perceptions of and attitudes to governance in general. A key feature of QoL data is that each variable can be disaggregated to ward level. In addition, the QoL Surveys have been designed to ask specific questions about quality of life not often included in many national surveys. Consequently the GCRO QoL Survey is best suited to a multidimensional approach to poverty analysis with potential to drill down to small local areas. The sample size for QoL was respondents in 2011, and respondents in This makes the GCRO QoL Survey the largest single living conditions survey of its kind in the country. The 2013 QoL Survey is particularly important for this analysis for several reasons. Firstly, the sample size is fairly large. Secondly, there was more emphasis on the metropolitan areas of Johannesburg, Tshwane and Ekurhuleni to allow for more nuanced analysis because this is where the bulk of Gauteng s population is located. Figure 5 shows the distribution of interviews across the ten local municipal areas of Gauteng. The City of Johannesburg had the largest proportion of interviews (36.1 percent) followed by Ekurhuleni (25.9 percent) and Tshwane (23.8 percent). The least was Lesedi where the population is very low. Thirdly, the data are ward representative and therefore a fairly accurate picture of sub-place level characteristics can be generated. Fourthly, the 508 wards in Gauteng (which were used as the Population Sampling Units (PSUs)) were further broken down into Small Area Layers (SALs) permitting a balanced sample distribution across each ward. Probability Proportional to Size (PPS) sampling was used to determine the distribution of population in each SAL and every fifth stand was selected for interview. In cases where there were multiple dwellings on a single stand, random sampling was used to select a household for the interview. Fifthly, the data were geo-coded so that respondents can be located within a 50m radius of their dwelling. This is useful in cases where further analysis about the respondents is required in which neighbourhood characteristics matter and we used that to generate maps for our results. Finally, the 2013 final dataset was reweighted to reflect the Census 2011 figures due to low response rates in certain categories of particular variables. As such the QoL data reflect the actual population distribution by race, sex and other biometric characteristics. QoL Surveys are conducted with the head of household if present, or any member who is 18 years or older and is present at the time of the interview. It was assumed that responses from these individuals correctly represent the characteristics of the household and of other household members. Although this may prejudice the results, the prejudice is negligible because the survey focuses on factual aspects about the household and where opinion is required, it is of the respondent. 092
95 PART 3: A MULTIDIMENSIONAL POVERTY INDEX FOR GAUTENG Figure 5: Distribution of interviews by municipalities Interviews per municipality (weighted) % city of tshwane 812 3% mogale city % merafong city % randfontein % westonaria % city of johannesburg % ekurhuleni % lesedi % emfuleni % midvaal kilometres SOURCE: GCRO CIS Maps, data from GCRO QoL Survey, 2013 MAP PRODUCED BY: Daniel Kibirige & C. Wray 093
96 POVERTY AND INEQUALITY IN THE GAUTENG CITY-REGION 6. Methodology Estimation of the MPI is based on the counting methodology developed by Alkire and Foster (2008, 2011). 10 The advantage of the Alkire-Foster method is that it is flexible, allowing for the inclusion of any number of dimensions. Another advantage is that the method follows a counting approach in its determination of the multidimensionally poor, which is a suitable approach for dealing with dimensions of an ordinal nature. This method also employs a more rigorous way of identifying the poor it uses the counting approach to identify the poor, and then adjusts the resultant poverty finding with measures of the breadth and depth of that poverty finding. The method begins by identifying the poor ( Pk (yi;z)) using a two-stage cut-off process, i.e. indicators cut-off (z j ) and poverty cut-off (k). A set of indicator dimensions (d) is identified that are considered essential for human wellbeing. These are the basis for identifying deprivation. Weights are assigned to the different indicator dimensions, and the weighting scheme can vary. In the ensuing analysis, nested weights were used, where the dimensions were classified into four broad partitions. Each partition was assigned equal weighting (1/4), containing nested indicator dimensions. Eleven indicators are considered in this paper, partitioned into four broad dimensions: standard of living; food security; economic activity; and education. With T=4 denoting the number of broad dimensions, the dimension specific weight is: w d j = 1 1 T d (1) using equal weighting. 11 Firstly the deprivation cut-off for each indicator dimension selected is defined. This cut-off point is a normative minimum level that household i needs to achieve in order for them not to be defined as deprived. The set of deprivation cut-offs, sometimes called poverty lines, is represented by a vector, z = ( z 1, z 2,...z d ). A household is then defined as deprived if its achievement is less than the cut-off, i.e. z ij <z j. The second step is to choose k, the number of deprivations that a household must experience in order for them to be considered multidimensionally poor. The choice of k is such that 1 < k < d so that poverty is neither defined as being deprived in only one indicator (k = 1) nor is it defined as being deprived in all indicators (k = d). k can be chosen normatively, either based on previous studies or based on what society would consider reasonable. In such instances, k can take on a real number, such as k = 2. It can also be chosen to reflect a country s or province s specific policy goal. In this analysis k = 33.3% was used, to focus on the multidimensionally bottom 1/3 of the population. A household is multidimensionally poor if the weighted indicators of which it is deprived sum up to at least 33.3 percent, i.e. if they are deprived in at least a third of the weighted indicators used in the calculation of the MPI. The count of the weighted number of deprivations in which the household is deprived is represented by c i such that if c i k then that household is considered poor. 10. See Appendix B for illustration. 11. For example, for the housing-adjusted standard of living dimension, the weight is calculated as: (1/4 )x (1/7) =(1/28). 094
97 PART 3: A MULTIDIMENSIONAL POVERTY INDEX FOR GAUTENG So the two-stage identification process is represented by: q = wiρ k ( yi; z) (2) where q is the number of poor households; w i = s i h i is the weight factor, which is a product of the sample weight s i and the household size h i P k is the identification of households y i = (y i1, y i2,..., y id ) is household i's achievements across d indicator dimensions z = (z 1, z 2,...,z d ) is a vector of poverty lines, made of a collection of thresholds below which a household is considered poor. This is then used to estimate the poverty headcount ratio: H = q n, (3) where q is the number of poor, and n is the total population. However H on its own violates two of the properties of a multidimensional index. First, it is not dimensionally monotonous, meaning that it is not sensitive to the number of dimensions that a poor person is deprived in. Dimensional monotonicity means that if a household becomes newly deprived in another dimension, overall poverty should increase. H is also not decomposable, which means that it is not possible to break down H to show the contribution of each dimension to poverty. Therefore an adjustment factor for H is necessary, to correct for these weaknesses. The adjustment factor, A is estimated as: A = 1 qd n i= 1 w i c i (4) and c* i are the counted deprivations for households achieving c1 k It can thus be said that the MPI is based on the dimension adjusted headcount ratio because it is a product of two main components: MPI = H x A...(5) 095
 Stats SA s SAMPI analysis of 2014 (Stats SA, 2014b); (ii) relevance of indicators to")
98 POVERTY AND INEQUALITY IN THE GAUTENG CITY-REGION 6.1 Choice of indicators Four broad dimensions are considered in this paper: standard of living; food security; economic activity; and education. The choice of dimensions, indicators and deprivation cut-off points to include in the GMPI, was guided by: (i) Stats SA s SAMPI analysis of 2014 (Stats SA, 2014b); (ii) relevance of indicators to Gauteng; and (iii) data limitations in the QoL Survey. Food, water, sanitation, energy, and housing are considered basic needs for humans. In South Africa, large segments of the population were previously subjected to conditions that made it extremely difficult, if not impossible, to access basic services. Therefore the condition of the basic need that has to do with the standard of living becomes important. Post-1994, the democratic government has tried to fill that gap by providing housing, but also stipulating that access to water and sanitation services and electricity are basic human rights for everyone. There are still wide gaps when it comes to such provisions: many households live in shacks and many communities protest that they still do not have access to piped water and that they do not benefit from services provided by their municipalities. These indicators have been included in the analysis to get a sense of the magnitude of backlogs in service delivery. This would serve as valuable input to policies on human settlements. Two indicators on communication were selected, i.e. ownership of cell phones and television sets. This is an indicator of asset ownership, and therefore a proxy for household wealth. Although health is an important dimension for policy in South Africa, it could not be used in the analysis because of data limitations as the QoL Survey does not collect data on health. Instead, food security another important policy dimension was used. The analysis expanded the dwelling type as another dimension under the broader standard of living category to include ownership and overcrowding as poverty measures. Table 4 shows the broad dimensions as well as nested indicator dimensions used in this analysis, the deprivation cut-offs and the weights attached to each indicator. Overall, 11 indicators across four dimensions were used to compile the GMPI. Photograph by Jhono Bennet 096
99 PART 3: A MULTIDIMENSIONAL POVERTY INDEX FOR GAUTENG Table 4: Dimensions, indicators and deprivation cut-offs for the GMPI Dimension Indicator Deprivation cut-off Weights Standard of living Housing Household dwelling is a shack (informal dwelling both in backyard and not in backyard) 1/28 Housing Overcrowded: 2 persons per room 1/28 Water No access to piped water in dwelling or in yard 1/28 Sanitation No access to a flush toilet 1/28 Energy No access to electricity for lighting 1/28 Communication Household has no cell phone 1/28 Communication Household has no television set 1/28 Food security Food At least one household member had to skip a meal Food Household did not have enough money to feed children Economic activity Unemployment No-one in the household is employed 1/4 Education Years of school attendance 1/8 1/8 Respondent has five or less years of schooling 1/4 SOURCE: Authors Four broad dimensions are considered in this paper: standard of living; food security; economic activity; and education. The choice of dimensions, indicators and deprivation cut-off points to include in the GMPI, was guided by: (i) Stats SA s SAMPI analysis of 2014 (Stats SA, 2014b); (ii) relevance of indicators to Gauteng; and (iii) data limitations in the QoL Survey. 097
100 POVERTY AND INEQUALITY IN THE GAUTENG CITY-REGION 7. Results This section presents the findings from our analysis and is structured in a way that answers the following questions sequentially. What proportion of Gauteng households is deprived per indicator, i.e. the proportion that falls below a specific deprivation cut-off? How does the proportion of Gauteng households that is deprived per indicator vary across income groups? How does the proportion of Gauteng households that is deprived per indicator vary across municipalities? How does the MPI vary spatially?»» What proportion of Gauteng households is deprived per indicator? Table 5 provides an overview of the proportion of Gauteng households that are deprived in each of the MPI indicators specified in Table 4. Table 5: Proportion of households falling below the deprivation cut-off Standard of living % % Household dwelling is a shack (informal dwelling) Overcrowded: more than 2 persons per room No access to piped water No access to a flush toilet No access to electricity Household has no cellular phone Household has no television set Economic activity No-one in the household is employed Food security At least one household member had to skip a meal Household did not have enough money to feed children Education Respondent has five or less years of schooling SOURCE: Authors, using data from GCRO QoL Survey,
101 PART 3: A MULTIDIMENSIONAL POVERTY INDEX FOR GAUTENG... living in a shack could also trap a household in poverty because service delivery infrastructure in these areas is more often poor, lacking, or difficult to provide. In 2013, 14.4 percent of households lived in informal dwellings loosely referred to as shacks a 4.5 percentage point rise compared to 9.9 percent in Living in shacks is directly linked to poverty because typically it is poor households that opt for such forms of accommodation due to affordability concerns. Yet, living in a shack could also trap a household in poverty because service delivery infrastructure in these areas is more often poor, lacking, or difficult to provide. The increase in the proportion of households living in shacks suggests that access to housing remains a significant challenge for many households in Gauteng. The majority of poor migrants from other provinces also find themselves living in shacks because they are much more affordable. Using the standard of more than two persons per room, 17.3 percent of the Gauteng population was defined as being overcrowded in This followed a 7.8 percentage points decrease from 25.2 percent in Individuals living under overcrowded conditions often suffer from poor health and education outcomes (Leventhal and Newman, 2010; Lund et al., 2011). As a result, overcrowding is often viewed as a good indicator of persistent poverty because it is less susceptible to fluctuations compared to other measures of poverty. In 27.4 percent of households none of their members were employed. This followed a marked improvement from 38 percent in This is consistent with the challenges of unemployment that the country as a whole is currently battling with. The encouraging news is that this indicator recorded the fastest decline between 2011 and The other encouraging statistic is the relatively low incidence of households with no access to electricity, which was 7.3 percent in The food security cluster also registered improvements between 2011 and The proportion of households for which at least one household member had to skip a meal fell by 6 percentage points from 20.3 to 14.3 percent. While 17.8 percent had, at some point in the year prior to the survey, not had enough money to feed children in 2011, this had declined to 10.9 percent in The province has improved in the education indicator as there has been a reduction in the respondents with less than five years of schooling. Overall, Table 5 suggests difficulty when it comes to provision of basic services as reflected in the standard of living indicators. All indicators in this category recorded an increase between 2011 and 2013 with the exception of the proportion of households living in overcrowded conditions using the standard of more than two persons per room as well as the proportion of households with no access to electricity. Access to housing continues to be a challenge and there is no evidence of improvements in access to piped water and flush toilets.»» How does the proportion of Gauteng households that is deprived per indicator vary across income groups? An interesting policy question is how multidimensional deprivation varies across income groups. In addition to other indicators of wellbeing, the QoL Surveys collected information on household income. The variable is an interval variable with equal and constant distances between values. An adjustment to the original intervals was made, resulting in six categories of income groups, one of which captured households with no income. The aim is to show how deprivation levels vary by income. 099
102 POVERTY AND INEQUALITY IN THE GAUTENG CITY-REGION Figure 6: Multidimensional poverty indicators by income group: 2013 Lives in a shack 30 PERCENTAGE OF HOUSEHOLDS No income R1 - R1 600 R R3 200 R R6 400 R R R or more INCOME GROUP No access to piped water PERCENTAGE OF HOUSEHOLDS No income R1 - R1 600 R R3 200 R R6 400 R R R or more INCOME GROUP SOURCE: Authors, using data from GCRO QoL Survey,
103 PART 3: A MULTIDIMENSIONAL POVERTY INDEX FOR GAUTENG Overcrowded: 2 persons per room PERCENTAGE OF HOUSEHOLDS No income R1 - R1 600 R R3 200 R R6 400 R R R or more INCOME GROUP No access to a flush toilet PERCENTAGE OF HOUSEHOLDS No income R1 - R1 600 R R3 200 R R6 400 R R R or more INCOME GROUP 101
104 POVERTY AND INEQUALITY IN THE GAUTENG CITY-REGION 16 No access to electricity PERCENTAGE OF HOUSEHOLDS No income R1 - R1 600 R R3 200 R R6 400 R R R or more INCOME GROUP Food security 30 PERCENTAGE OF HOUSEHOLDS No income R1 - R1 600 R R3 200 R R6 400 R R R or more At least one member had to skip a meal Not enough money to feed children SOURCE: Authors, using data from GCRO QoL Survey,
105 PART 3: A MULTIDIMENSIONAL POVERTY INDEX FOR GAUTENG No access to cellular phone or television set PERCENTAGE OF HOUSEHOLDS No income R1 - R1 600 R R3 200 R R6 400 R R R or more No cellular phone No television set Education and unemployment 60 PERCENTAGE OF HOUSEHOLDS No income R1 - R1 600 R R3 200 R R6 400 R R R or more No-one employed Five or less years of schooling 103
106 POVERTY AND INEQUALITY IN THE GAUTENG CITY-REGION Figure 6 provides insights with a focus on Widespread disparities in the multidimensional poverty indicators are revealed, with poorer households exhibiting higher incidences of deprivation. The indicator that has the highest disparity is one that indicates whether any of the members are employed. While 74.6 percent of households with no income had none of their members employed, the corresponding figure for households with an income of more than R per month was only 8.6 percent. A similar story holds with respect to the remainder of the indicators: the proportions of the deprived decline with income and the same pattern holds for both 2011 and For example, at 25.6 percent, the proportion of households living in a shack among households with no income was close to 24 times more than the corresponding proportion among the top income group which stood at 1.1 percent. This is equivalent to a gap of around 24.6 percentage points. In sum, the analysis by income group underscores income poverty as a catalyst for other multidimensional aspects of poverty in Gauteng. It is important to emphasise that the relationship could be bi-directional in nature: while lack of income could trap households in multidimensional poverty, multidimensional poverty can also limit household opportunities for generating income. For instance, having no access to electricity could be a constraint to starting certain types of businesses.»» How does the proportion of Gauteng households that is deprived per indicator vary across municipalities? Notable differences prevail in multidimensional deprivation across municipalities. Using 2013 to illustrate these differences, Westonaria is clearly the worst affected when it comes to multidimensional deprivation. In 2013, this municipality had the highest proportion of those affected in all indicators except four: having none of the members employed, both food security indicators, and education. A total of 29.7 percent of Westonaria residents lived in a shack in 2013, 15.3 percentage points higher than the Gauteng average of 14.4 percent (see Table 6). Randfontein households are hardest hit when it comes to unemployment as 34.6 percent of households had none of its members working. Emfuleni is the worst affected in terms of both food security indicators used in the analysis, having the highest proportion of households in which a member had to skip a meal (26.1 percent) and in which there were no adequate resources to feed children (18.9 percent). Lesedi lags behind with respect to education. Table A1 in Appendix A presents the results for


107 PART 3: A MULTIDIMENSIONAL POVERTY INDEX FOR GAUTENG Photograph by Christina Culwick Photograph by Mikey Rosato 105
108 Table 6: Multidimensional poverty indicators by municipality: 2013 Indicator Emfuleni Midvaal Lesedi Mogale City Randfontein Westonaria Merafong City Ekurhuleni City of Joburg City of Tshwane Lives in a shack Overcrowded: 2 persons per room No access to piped water No access to a flush toilet No electricity No cell phone No television No-one employed A member skipped a meal Not enough money to feed children Five or less years of schooling SOURCE: Authors, using data from GCRO QoL Survey, 2013
109 PART 3: A MULTIDIMENSIONAL POVERTY INDEX FOR GAUTENG Figures 7 to 9 show a mapping of wards that fell in the worst two categories in each of the three measures. Figure 7: Worst wards Headcount soshanguve mamelodi ekangala diepsloot tembisa alex sandton daveyton khutsong carletonville elandsrand fochville soweto grasmere katlehong kwathema sebokeng ratanda kilometres % % 19% % 32.5% % Not MPI poor SOURCE: Authors/GCRO GIS Maps, using data from GCRO QoL Survey, 2013 MAP PRODUCED BY: S. Katumba, C. Wray & D. Mushongera For example, Figure 7 shows headcount, and generally wards that have high headcount are located on the edges of the province, mainly the south and western parts. However, there are pockets in the central part of the province where headcount was high. Interestingly, although certain wards have high headcount, the intensity is not as high, as shown in Figure
110 POVERTY AND INEQUALITY IN THE GAUTENG CITY-REGION Figure 8: Worst wards Intensity soshanguve mamelodi ekangala diepsloot tembisa alex sandton daveyton khutsong carletonville elandsrand fochville soweto grasmere katlehong kwathema sebokeng ratanda kilometres % % 53.2% % 60.8% % Not MPI poor SOURCE: Authors/GCRO GIS Maps, using data from GCRO QoL Survey, 2013 MAP PRODUCED BY: S. Katumba, C. Wray & D. Mushongera Other wards had lower headcount but very high intensity. This means that for the few MPI poor households that exist in those wards, the extent of poverty is high, i.e. they are deprived in several indicators. Such wards are concentrated along the gold reef running centrally from east to west and some are in the northern part of the province. 108
111 PART 3: A MULTIDIMENSIONAL POVERTY INDEX FOR GAUTENG Figure 9: Worst wards MPI soshanguve mamelodi ekangala diepsloot tembisa alex sandton daveyton khutsong carletonville elandsrand fochville soweto grasmere katlehong kwathema sebokeng ratanda kilometres Not MPI poor SOURCE: Authors/GCRO GIS Maps, using data from GCRO QoL Survey, 2013 MAP PRODUCED BY: S. Katumba, C. Wray & D. Mushongera In terms of the overall MPI, the worst areas are to the west and south west of the province and pockets in Johannesburg and Ekurhuleni as shown in Figure 9. Overall, this mapping shows that: (i) being located further away from the three metro regions (i.e. City of Johannesburg, Tshwane and Ekurhuleni) where economic activities are concentrated clearly presents disadvantages to these outlying areas; and (ii) pockets of poverty within the metro areas continue to exist with little or no improvements at all. 109
112 POVERTY AND INEQUALITY IN THE GAUTENG CITY-REGION 7.2. Decomposition of the MPI Figure 10 reports the censored headcount ratios, i.e. the proportion of Gauteng households that are poor and deprived in each indicator. The poor made gains in MPI poverty between 2011 and 2013, although the picture is not as clear-cut for Gauteng as a region. Considering changes between 2011 and 2013, the percentage of households who were MPI poor and deprived in each indicator fell for all indicators. Figure 10: Censored multidimensional deprivation Five or less years or schooling Live in a shack Overcrowded, 2 persons per room No access to piped water No access to flush toilet No access to electricity No cellular phone No television set No-one employed At least one member had to miss a meal Not enough money to feed children Education Standard of living Economic activity Food security SOURCE: Authors, using data from GCRO QoL Survey 110
113 PART 3: A MULTIDIMENSIONAL POVERTY INDEX FOR GAUTENG Figure 11 decomposes the MPI poor according to the intensity of their deprivation. For instance, the share of the MPI poor whose intensities were greater than 33.3 percent but less than 40 percent increased from 18.4 percent in 2011 to 24.4 percent in Figure 12 presents the proportion of the whole Gauteng population that is poor in the specified percentage of indicators or more. For instance, 4.6 percent of Gauteng households were deprived in 50 percent or more weighted indicators in These are considered to suffer from severe MPI poverty. Figure 11: Intensity of deprivation among the poor % % % % % % % Percentage of MPI poor SOURCE: Authors, using data from GCRO QoL Surveys for 2011 and
114 POVERTY AND INEQUALITY IN THE GAUTENG CITY-REGION Figure 12: Percentage of households deprived in X percent or more of the MPI weighted indicators 90% + 80% + 70% + 60% % % % Percentage of Gauteng population SOURCE: Authors, using data from GCRO QoL Surveys for 2011 and 2013 Figure 13 highlights the percentage contribution of each indicator to the overall MPI. Having all household members not working is by far the largest contributor to the overall MPI, contributing 42.1 percent in 2013 and 39 percent in Thus although this indicator recorded the fastest decline between 2011 and 2013 as reflected in Table 6, its relative contribution to the overall MPI during this period increased. Having to skip a meal due to inadequate resources registered the second highest contribution, followed by inadequate resources to feed children, at 16.8 percent and 12.8 percent in 2013, respectively. 112
115 PART 3: A MULTIDIMENSIONAL POVERTY INDEX FOR GAUTENG Figure 13: Relative contribution of each indicator to overall poverty PERCENTAGE OF CONTRIBUTION TO MPI Not enough money to feed children At least one member skipped a meal No-one employed No television set No cellular phone No access to electricity No access to a flush toilet No access to piped water Overcrowded: 2 persons per room Lives in a shack Five or less years of schooling SOURCE: Authors, using data from GCRO QoL Surveys for 2011 and
116 POVERTY AND INEQUALITY IN THE GAUTENG CITY-REGION 8. Discussion Gauteng is the richest province in South Africa and judging from the per capita GDP it has a wealth base capable of sustaining its population on decent standards of living. However, the distribution of income is highly skewed spatially, and as reflected by the high Gini, wealth is concentrated in the hands of a few individuals. Spatially, wealth is concentrated in the three metropolitan areas of Johannesburg, Tshwane and Ekurhuleni. The metropolitan areas also offer better opportunities of employment due to proximity and the existence of very large formal and informal economies compared to outlying areas. Since 1994, South Africa has made efforts to address poverty and inequality through various policies and programmes. The main aim of these policies has been redressing the imbalances and injustices created by apartheid. The local sphere of government in South Africa is constitutionally mandated to provide and maintain basic services especially water, sanitation and electricity. A national policy on indigency was introduced to serve as a safety net to cushion those families that are too poor to afford the cost of basic services. The indigence policy came into being after government realised that levels of deprivation are too high for particular households and in most cases households lack a source of income. Local municipalities are required to raise funds to support this particular group of people in order to avoid extreme deprivation. However, some municipalities, especially those in outlying areas of the province, do not have a wide tax base to raise sufficient revenue to support indigent households. This means that access to free basic services varies across municipalities. Although social grants offer complementary support to such households, these are often inadequate to lift indigent households out of poverty. Other services, such as education, lie within the realm of the provincial government. In Gauteng, for example, the provincial department of education works to ensure that enrolments are high, the throughput rate is increased, facilities are adequate, and that school attendance is high through school nutrition and learner transport programmes. However, the quality of education is still an area of great concern. Despite these bold measures during the last 20 years, the results of this study show that challenges remain. By combining the dimensions upon which a household is deprived, the MPI method used in this paper does not reveal a consistent improvement between 2011 and Some dimensions improved while others worsened. For example, the number of households living in shack dwellings rose between 2011 and 2013, along with a slight increase of 2.1 percentage points in the people with no access to piped water as well as access to flush toilets. However, the number of households with no members working decreased drastically from 38 percent in 2011 to 27.4 percent in There has been an improvement in education as the proportion of those with less than five years of schooling is declining. As more people gain access to education, future prospects for better standards of living are positive as long as the throughput rate is kept high and the economy generates enough jobs to accommodate new entrants into the job market. Our data show that municipalities with low economic activity such as Westonaria, Randfontein, Midvaal and Lesedi have high MPI values. A focus on poverty dynamics at much localised levels using the 2013 data showed that headcount MPI is generally high in previously disadvantaged south and south-western high-density locations: Diepsloot, Alexandra, Tembisa and parts of Ekurhuleni. Where multidimensional poverty exists, the degree is high. Intensity of poverty is highest in Ekurhuleni (3 wards), Johannesburg (2 wards), Mogale City, Merafong City and Emfuleni (1 ward each). Most of these areas are associated with informal settlements, overcrowding and backyard buildings. Where housing conditions are poor, service delivery is difficult and opportunities for employment are limited. 114

117 PART 3: A MULTIDIMENSIONAL POVERTY INDEX FOR GAUTENG New initiatives The provincial government has taken bold steps to eradicate the social, economic and spatial legacy of apartheid and colonialism. Current initiatives by the premier for Gauteng to revitalise township economies could go a long way in increasing opportunities for township dwellers and those in informal settlements that are by their very nature difficult to serve from a service delivery point of view. Economic activity and food security are also much worse in these areas. Together with asset ownership and schooling, these dimensions are the main drivers of poverty in the province (Figure 13). The provincial government unveiled a ten-pillar programme to transform Gauteng s socio-economy and all departments were called upon to respond to the challenges of poverty and inequality. This has been reflected in the budgets, for example, in its 2014/15 budget the Gauteng member of the executive council (MEC) for education stated that the education budget was designed to contribute to poverty alleviation and lowering of inequality and unemployment through skills development, school infrastructure development to accommodate more learners, teacher provision and support, and prioritisation of early childhood development. Although education, health and infrastructure featured strongly in previous budgets, the 2014/15 Gauteng Provincial Budget emphasises these issues even more and aspects such as job creation, road and schooling infrastructure, and support to small, medium and micro-sized enterprises (SMMEs) were highlighted. Food security was also highlighted as a measure for alleviating poverty given the growing number of orphans and child-headed households in the province. As much as R146.3 million was allocated to child and youth care centres for the 2014/15 financial year to help address the problem of orphans and child-headed households considering the high level of vulnerability that these groups experience. Such households are less likely to afford a decent lifestyle in the absence of substantial support from government. In education, the need for quality education was emphasised and supported with a large budget that is structured to cater for no-fee-paying schools. As noted earlier, access to education increases potential for other opportunities, such as employment, that could lift people out of poverty. This could open up access to other services that contribute to better quality of life. Photograph by Simphiwe Mangole 115
118 POVERTY AND INEQUALITY IN THE GAUTENG CITY-REGION 9. Conclusion This paper contributes to deepened understanding of poverty at the local levels in South Africa by exploring changes in non-money-metric measures of poverty and wellbeing between 2011 and 2013 using the Gauteng province as a case study. It uses two recent datasets generated by the GCRO QoL Surveys to: (i) expand the analysis of poverty by computing a MPI for Gauteng; and (ii) examine the spatial configuration of multidimensional poverty within the province. Multidimensional poverty is found to be correlated with income poverty: not only are households that are income poor more likely to be multidimensionally poor, they suffer from higher intensities of poverty. Further, the study highlights the interconnectedness between infrastructural development and socio-economic indicators. Specifically, being deprived in one poverty indicator is associated with a higher likelihood of being deprived in other indicators. Generally, the urban space economy of Gauteng derives from apartheid geography and the history of mining activity. Our findings indicate that there is path dependency and that due to the legacy of apartheid, infrastructural imbalances still prevail. Spatially, multidimensional poverty tends to be highest in areas that have low economic activity and happen to be located at the edges of the province. These include, among others, Westonaria and Merafong City. There appears to be a disadvantage in being further away from the three metro regions (i.e. the City of Johannesburg, Tshwane and Ekurhuleni) where economic activities are concentrated. This is a policy challenge given the finding that the unemployment indicator is the largest contributor to the overall MPI. Although the incidence of households with none of its members working recorded the fastest decline between 2009 and 2013, the relative contribution of this indicator to the overall MPI increased during this period. This raises questions about the ability of current investment patterns to create jobs and subsequently foster socioeconomic development in outlying areas. Multidimensional poverty is, however, not restricted to areas at the edges of the province and even in the highest performing three metro regions pockets of severe multidimensional poverty prevail. Clear examples include Alexandra, Diepsloot and Tembisa. This is indicative of high infrastructural inequalities within these metro regions, suggesting the need for local municipalities to devise policies that channel investments into lagging areas. Revitalising township economies can unlock the potential of these areas to contribute to multidimensional poverty reduction in the province. The study also highlights that the role of mining in socio-economic development is not clear-cut. For example, Westonaria has high multidimensional poverty rates despite its heavy reliance on mining activities. It is, therefore, not apparent that mining contributes to socio-economic development in Westonaria. In sum, the foregoing analysis underscores the heterogeneity of communities and suggests that more in-depth analysis of developmental challenges at localised levels is needed to improve the effectiveness of evidence-based planning. This way, government is able to customise interventions that take into account these heterogeneities and continually improve targeting of policy interventions. In addition, given that the different indicators of multidimensional poverty are related to services whose provision falls under the mandate of different spheres of government, an integrated approach to service delivery is key to reducing multidimensional poverty in Gauteng. 116
119 PART 3: A MULTIDIMENSIONAL POVERTY INDEX FOR GAUTENG REFERENCES Alkire, S., and Foster, J. (2011) Understandings and misunderstandings of multidimensional poverty measurement. Oxford Poverty and Human Development Initiative (OPHI) Working Paper No. 43. Oxford: Oxford Department of International Development. Anand, S., and Sen, A. (1997) Concepts of human development and poverty: A multidimensional perspective. In poverty and human development: Human development papers. New York: United Nations Development Programme, pp Atkinson, A.B. (2003) Multidimensional deprivation: Contrasting social welfare and counting approaches. Journal of Economic Inequality, 1: Bhorat, H., Van der Westhuizen, C. and Goga, S. (2007) Welfare shifts in the post-apartheid South Africa: A comprehensive measurement of changes. Working Paper 07/128. Development Policy Research Unit (DPRU), University of Cape Town. Cape Town: DPRU. Bhorat, H., Van der Westhuizen, C. and Jacobs, T. (2009) Income and non-income inequality in post-apartheid South Africa: What are the drivers and possible policy interventions? Trade & Industrial Policy Strategies (TIPS), Policy Brief Series. Development Policy Research Unit (DPRU), University of Cape Town. Cape Town: DPRU. Bourguignon, F. and Chakravarty, S.R. (2003) The measurement of multidimensional poverty. Journal of Economic Inequality, 1: Everatt, D. (2009) Dispatches from the war on poverty in South Africa s 21 poorest rural and urban nodes, , in McLennan, A. and Munslow, B. (eds), The politics of service delivery. Johannesburg: Wits Press, pp Finn, A. and Leibbrandt, M. (2013) The dynamics of poverty in the first three waves of NIDS. Working Paper Number 119/ NIDS Discussion Paper 2013/1. SALDRU, University of Cape Town. Cape Town: SALDRU. Gauteng City-Region Observatory (GCRO) (2012) Key findings from Statistics South Africa s 2011 National Census for Gauteng, GCRO Data Briefs. Johannesburg: GCRO. Gauteng Provincial Government (GPG) (2014a) Gauteng News, SOPA Special Edition. Johannesburg: GPG. Gauteng Provincial Government (GPG) (2014b) Gauteng News, Aug/Sept. Johannesburg: GPG. Hoogeveen, J. and Özler, B. (2006) Not separate, not equal: Poverty and inequality in post-apartheid South Africa, in Bhorat, H. and Kanbur, R. (eds), Poverty and policy in post-apartheid South Africa. Pretoria: Human Sciences Research Council (HSRC) Press, pp Kakwani, N. and Silber, J. (2008) The many dimensions of poverty. Basingstoke: Palgrave. Landau, L.B. and Gindrey, V. (2008) Migration and population trends in Gauteng Province Migration Studies Working Paper Series No. 42. Forced Migration Studies Programme. Johannesburg: University of the Witwatersrand. Leibbrandt, M. and Levinsohn, J (2011) Fifteen years on: Household incomes in South Africa. National Bureau of Economic Research (NBER) Working Paper Cambridge, MA: NBER. Leibbrandt, M., Woolard, I., Finn, A., Argent, J. (2010) Trends in South African income distribution and poverty since the fall of apartheid. Organisation for Economic Co-operation and Development (OECD) Social, Employment and Migration Working Papers, No Paris: OECD. Leventhal, T. and Newman, S. (2010) Housing and child development. Children and Youth Services Review, 32:
120 POVERTY AND INEQUALITY IN THE GAUTENG CITY-REGION Lund, C., De Silva, M., Plagerson, S., Cooper, S., Chisholm, D., Das, J., Knapp, M. and Patel, V. (2011) Poverty and mental disorders: Breaking the cycle in low-income and middle-income countries, The Lancet, 378: Martins, J.H. (2003) Minimum living level and consumer price index: What s in a name? Development South Africa, 20: Moore, H. (2014) Why is Thomas Piketty s 700-page book a bestseller? The Guardian. 21 September. Available at money/2014/sep/21/-sp-thomas-piketty-bestsellerwhy. Accessed 12 December Ngepah, N. (2011) Production, inequality and poverty linkages in South Africa. Economic Research Southern Africa (ERSA) Working Paper 206. Pretoria: Competition Commission of South Africa. Noble, M., Babita, M., Barnes, H., Dibben, C., Magasela, W., Noble, S., et al. (2006). The provincial indices of multiple deprivation for South Africa Oxford: Department of Social Policy and Social Work, University of Oxford. Republic of South Africa (RSA) (1994) White paper on reconstruction and development of Pretoria: The Presidency. Republic of South Africa (RSA) (2008) Towards an anti-poverty strategy for South Africa: A discussion Document. Pretoria: The Presidency. Republic of South Africa RSA (2013) Budget review RP: 344/2012. Pretoria: National Treasury. Schiel, R. (Undated) Money metric versus non money metric measures of well-being. Available at reinhard-schiel.1.pdf. Seekings, J. and Nattrass, N. (2005) Class, race, and inequality in South Africa. New Haven: Yale University Press. Sekhampu, T.J. (2013) Determinants of poverty in a South African township. Journal of Social Science, 34: Sen, A. (2000) A decade of human development. Journal of Human Development, 1: Sen, A. (1976) Poverty: An ordinal approach to measurement. Econometrica, 44(2): Statistics South Africa (Stats SA) (2011) National Census Pretoria: Stats SA. Statistics South Africa (Stats SA) (2014a) Poverty trends in South Africa: An examination of absolute poverty between 2006 and Pretoria: Stats SA. Statistics South Africa (Stats SA) (2014b) The South African MPI: Creating a multidimensional poverty index using census data. Pretoria: Stats SA. Statistics South Africa (Stats SA) (2014c) General Household Survey, Pretoria: Stats SA. Studies in Poverty and Inequality Institute (SPII) (2013) The measurement of poverty in South Africa project: Key issues. Working Paper No 1. Johannesburg: SPII. Taylor, V. (ed.) (2002) Transforming the present, protecting the future. Report of the committee of inquiry into a comprehensive system of social security for South Africa. Pretoria: Department of Social Development. Thorbecke, E. (2008) Multidimensional poverty: Conceptual and measurement issues, in Kakwani, N. and Silber, J. (eds), The many dimensions of poverty. New York: Palgrave Macmillan, pp Tregenna, F. (2011) What are the distributional implications of halving poverty in South Africa when growth alone is not enough? Applied Economics, 44(20):
121 PART 3: A MULTIDIMENSIONAL POVERTY INDEX FOR GAUTENG Tregenna, F. and Tsela, M. (2012) Inequality in South Africa: The distribution of income, expenditure and earnings. Development South Africa, 29: Triegaardt, J.D. (2006) Reflections on poverty and inequality in South Africa: Policy considerations in an emerging democracy. Paper presented at the annual Association of South African Social Work Education Institutions (ASASWEI) conference, University of Venda, Department of Social Work, September Woolard, I. and Leibbrandt, M. (2001) Measuring poverty in South Africa, in H. Bhorat (ed.), Fighting poverty: Labour markets and inequality in South Africa. Cape Town: UCT Press, pp Woolard, I. and Leibbrandt, M. (2006) Towards a poverty line for South Africa: A background note. Southern Africa Labour and Development Research Unit (SALDRU) University of Cape Town. Cape Town: SALDRU. World Bank (2012) South Africa economic update: Focus on inequality of opportunity. Washington, D.C.: International Bank for Reconstruction and Development/World Bank. 119
122 APPENDIX A Table A1: Multidimensional poverty indicators by municipality, 2011 Indicator Emfuleni Midvaal Lesedi Mogale City Randfontein Westonaria Merafong City Ekurhuleni City of Joburg City of Tshwane Lives in a shack Overcrowded at 2 persons per room No access to piped water No access to a flush toilet No electricity No cell phone No television No-one employed A member skipped a meal Not enough money to feed children Five or less years of schooling SOURCE: Authors, using data from GCRO QoL Survey, 2011


123 APPENDIX B Figure 14: Summary of MPI methodology Multidimensional poverty index 121
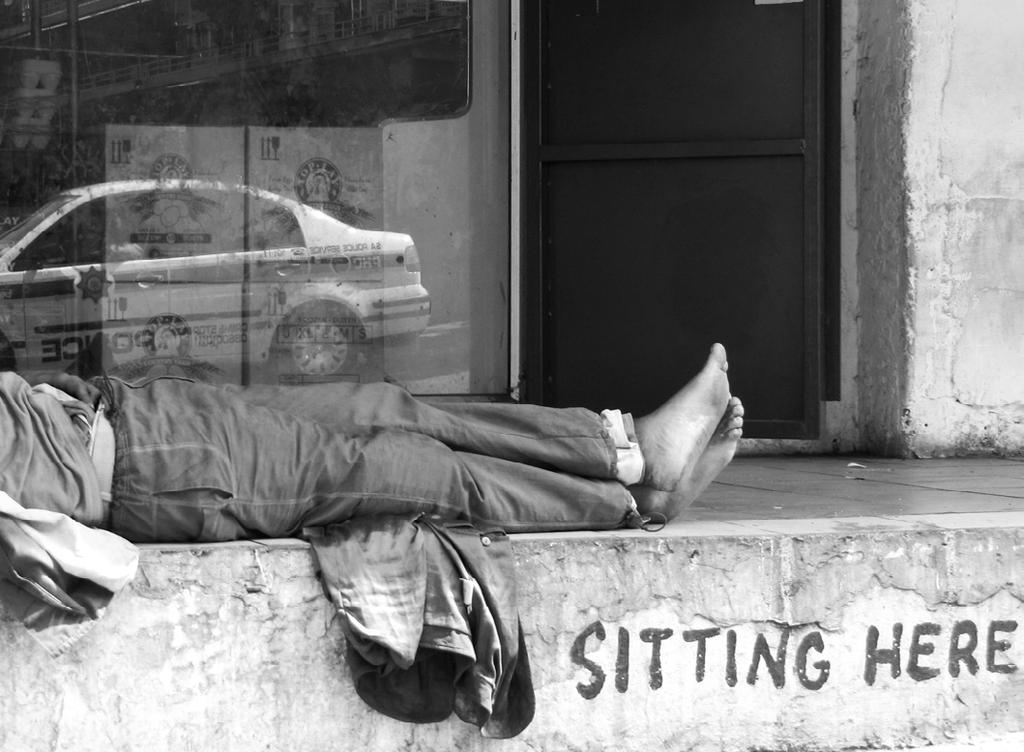
124 122
125 Top: Photograph by Gareth Pon Bottom: Photograph by Roxy Do Rego
 +27 11 717 7280 info@gcro.ac.za Braamfontein Johannesburg Gauteng South Africa tel +27 11 717 7280 email info@gcro.")
126 GAUTENG CITY-REGION OBSERVATORY 6th Floor University Corner Cnr Jorissen and Jan Smuts Braamfontein Johannesburg GAUTENG CITY-REGION OBSERVATORY Gauteng South Africa 4th Floor University Corner 11 Jorissen St (Cnr Jorissen and Jan Smuts) Braamfontein Johannesburg Gauteng South Africa tel
Background Paper Series. Background Paper 2005:1(1) A profile of the Western Cape province: Demographics, poverty, inequality and unemployment
 A profile of the Western Cape province: Demographics, poverty, inequality and unemployment") Background Paper Series Background Paper 2005:1(1) A profile of the Western Cape province: Demographics, poverty, inequality and unemployment Elsenburg August 2005 Overview The Provincial Decision-Making
Background Paper Series Background Paper 2005:1(1) A profile of the Western Cape province: Demographics, poverty, inequality and unemployment Elsenburg August 2005 Overview The Provincial Decision-Making
Internal migration determinants in South Africa: Recent evidence from Census RESEP Policy Brief
 Department of Economics, University of Stellenbosch Internal migration determinants in South Africa: Recent evidence from Census 2011 Eldridge Moses* RESEP Policy Brief february 2 017 This policy brief
A Profile of the Gauteng Province: Demographics, Poverty, Income, Inequality and Unemployment from 2000 till 2007
 Background Paper Series Background Paper 2009:1(7) A Profile of the Gauteng Province: Demographics, Poverty, Income, Inequality and Unemployment from 2000 till 2007 Elsenburg February 2009 Overview The
Poverty and Inequality
 10 Poverty and Inequality Introduction This chapter deals with poverty and inequality which are among South Africa s most intractable development challenges linked to high unemployment. The concepts of
Spatial Inequality in Cameroon during the Period
 AERC COLLABORATIVE RESEARCH ON GROWTH AND POVERTY REDUCTION Spatial Inequality in Cameroon during the 1996-2007 Period POLICY BRIEF English Version April, 2012 Samuel Fambon Isaac Tamba FSEG University
How s Life in Australia?
 How s Life in Australia? November 2017 In general, Australia performs well across the different well-being dimensions relative to other OECD countries. Air quality is among the best in the OECD, and average
A Profile of the Mpumalanga Province: Demographics, Poverty, Income, Inequality and Unemployment from 2000 till 2007
 Background Paper Series Background Paper 2009:1(8) A Profile of the Mpumalanga Province: Demographics, Poverty, Income, Inequality and Unemployment from 2000 till 2007 Elsenburg February 2009 Overview
How s Life in Canada?
 How s Life in Canada? November 2017 Canada typically performs above the OECD average level across most of the different well-indicators shown below. It falls within the top tier of OECD countries on household
How s Life in Hungary?
 How s Life in Hungary? November 2017 Relative to other OECD countries, Hungary has a mixed performance across the different well-being dimensions. It has one of the lowest levels of household net adjusted
How s Life in Switzerland?
 How s Life in Switzerland? November 2017 On average, Switzerland performs well across the OECD s headline well-being indicators relative to other OECD countries. Average household net adjusted disposable
Part 1: Focus on Income. Inequality. EMBARGOED until 5/28/14. indicator definitions and Rankings
 Part 1: Focus on Income indicator definitions and Rankings Inequality STATE OF NEW YORK CITY S HOUSING & NEIGHBORHOODS IN 2013 7 Focus on Income Inequality New York City has seen rising levels of income
How s Life in Belgium?
 How s Life in Belgium? November 2017 Relative to other countries, Belgium performs above or close to the OECD average across the different wellbeing dimensions. Household net adjusted disposable income
How s Life in Austria?
 How s Life in Austria? November 2017 Austria performs close to the OECD average in many well-being dimensions, and exceeds it in several cases. For example, in 2015, household net adjusted disposable income
Korea s average level of current well-being: Comparative strengths and weaknesses
 How s Life in Korea? November 2017 Relative to other OECD countries, Korea s average performance across the different well-being dimensions is mixed. Although income and wealth stand below the OECD average,
How s Life in the United Kingdom?
 How s Life in the United Kingdom? November 2017 On average, the United Kingdom performs well across a number of well-being indicators relative to other OECD countries. At 74% in 2016, the employment rate
Internal Migration to the Gauteng Province
 Internal Migration to the Gauteng Province DPRU Policy Brief Series Development Policy Research Unit University of Cape Town Upper Campus February 2005 ISBN 1-920055-06-1 Copyright University of Cape Town
How s Life in Estonia?
 How s Life in Estonia? November 2017 Relative to other OECD countries, Estonia s average performance across the different well-being dimensions is mixed. While it falls in the bottom tier of OECD countries
How s Life in the Czech Republic?
 How s Life in the Czech Republic? November 2017 Relative to other OECD countries, the Czech Republic has mixed outcomes across the different well-being dimensions. Average earnings are in the bottom tier
How s Life in the Netherlands?
 How s Life in the Netherlands? November 2017 In general, the Netherlands performs well across the OECD s headline well-being indicators relative to the other OECD countries. Household net wealth was about
Background Paper Series. Background Paper 2003: 3. Demographics of South African Households 1995
 Background Paper Series Background Paper 2003: 3 Demographics of South African Households 1995 Elsenburg September 2003 Overview The Provincial Decision-Making Enabling (PROVIDE) Project aims to facilitate
How s Life in Ireland?
 How s Life in Ireland? November 2017 Relative to other OECD countries, Ireland s performance across the different well-being dimensions is mixed. While Ireland s average household net adjusted disposable
How s Life in Finland?
 How s Life in Finland? November 2017 In general, Finland performs well across the different well-being dimensions relative to other OECD countries. Despite levels of household net adjusted disposable income
and with support from BRIEFING NOTE 1
 and with support from BRIEFING NOTE 1 Inequality and growth: the contrasting stories of Brazil and India Concern with inequality used to be confined to the political left, but today it has spread to a
Japan s average level of current well-being: Comparative strengths and weaknesses
 How s Life in Japan? November 2017 Relative to other OECD countries, Japan s average performance across the different well-being dimensions is mixed. At 74%, the employment rate is well above the OECD
How s Life in the United States?
 How s Life in the United States? November 2017 Relative to other OECD countries, the United States performs well in terms of material living conditions: the average household net adjusted disposable income
Southern Africa Labour and Development Research Unit
 Southern Africa Labour and Development Research Unit Drivers of Inequality in South Africa by Janina Hundenborn, Murray Leibbrandt and Ingrid Woolard SALDRU Working Paper Number 194 NIDS Discussion Paper
How s Life in Slovenia?
 How s Life in Slovenia? November 2017 Slovenia s average performance across the different well-being dimensions is mixed when assessed relative to other OECD countries. The average household net adjusted
INCOME INEQUALITY WITHIN AND BETWEEN COUNTRIES
 INCOME INEQUALITY WITHIN AND BETWEEN COUNTRIES Christian Kastrop Director of Policy Studies OECD Economics Department IARIW general conference Dresden August 22, 2016 Upward trend in income inequality
How s Life in New Zealand?
 How s Life in New Zealand? November 2017 On average, New Zealand performs well across the different well-being indicators and dimensions relative to other OECD countries. It has higher employment and lower
Pro-Poor Growth and the Poorest
 Background Paper for the Chronic Poverty Report 2008-09 Pro-Poor Growth and the Poorest What is Chronic Poverty? The distinguishing feature of chronic poverty is extended duration in absolute poverty.
How s Life in Norway?
 How s Life in Norway? November 2017 Relative to other OECD countries, Norway performs very well across the OECD s different well-being indicators and dimensions. Job strain and long-term unemployment are
UGANDA S PROGRESS TOWARDS POVERTY REDUCTION DURING THE LAST DECADE 2002/3-2012/13: IS THE GAP BETWEEN LEADING AND LAGGING AREAS WIDENING OR NARROWING?
 RESEARCH SERIES No. 118 UGANDA S PROGRESS TOWARDS POVERTY REDUCTION DURING THE LAST DECADE 2002/3-2012/13: IS THE GAP BETWEEN LEADING AND LAGGING AREAS WIDENING OR NARROWING? SARAH N. SSEWANYANA IBRAHIM
Spain s average level of current well-being: Comparative strengths and weaknesses
 How s Life in Spain? November 2017 Relative to other OECD countries, Spain s average performance across the different well-being dimensions is mixed. Despite a comparatively low average household net adjusted
How s Life in France?
 How s Life in France? November 2017 Relative to other OECD countries, France s average performance across the different well-being dimensions is mixed. While household net adjusted disposable income stands
Chile s average level of current well-being: Comparative strengths and weaknesses
 How s Life in Chile? November 2017 Relative to other OECD countries, Chile has a mixed performance across the different well-being dimensions. Although performing well in terms of housing affordability
Persistent Inequality
 Canadian Centre for Policy Alternatives Ontario December 2018 Persistent Inequality Ontario s Colour-coded Labour Market Sheila Block and Grace-Edward Galabuzi www.policyalternatives.ca RESEARCH ANALYSIS
How s Life in Sweden?
 How s Life in Sweden? November 2017 On average, Sweden performs very well across the different well-being dimensions relative to other OECD countries. In 2016, the employment rate was one of the highest
How s Life in Iceland?
 How s Life in Iceland? November 2017 In general, Iceland performs well across the different well-being dimensions relative to other OECD countries. 86% of the Icelandic population aged 15-64 was in employment
A Profile of the Northern Cape Province: Demographics, Poverty, Income, Inequality and Unemployment from 2000 till 2007
 Background Paper Series Background Paper 2009:1(3) A Profile of the Northern Cape Province: Demographics, Poverty, Income, Inequality and Unemployment from 2000 till 2007 Elsenburg February 2009 Overview
How s Life in the Slovak Republic?
 How s Life in the Slovak Republic? November 2017 Relative to other OECD countries, the average performance of the Slovak Republic across the different well-being dimensions is very mixed. Material conditions,
How s Life in Portugal?
 How s Life in Portugal? November 2017 Relative to other OECD countries, Portugal has a mixed performance across the different well-being dimensions. For example, it is in the bottom third of the OECD in
DPRU WORKING PAPERS. Wage Premia and Wage Differentials in the South African Labour Market. Haroon Bhorat. No 00/43 October 2000 ISBN:
 DPRU WORKING PAPERS Wage Premia and Wage Differentials in the South African Labour Market Haroon Bhorat No 00/43 October 2000 ISBN: 0-7992-2034-5 Development Policy Research Unit University of Cape Town
Wages in Post-apartheid South Africa
 The Journal of the helen Suzman Foundation Issue 75 April 215 Wages in Post-apartheid South Africa South Africa entered the post-apartheid era with one of the most unequal income distributions in the world.
GLOBALIZATION, DEVELOPMENT AND POVERTY REDUCTION: THEIR SOCIAL AND GENDER DIMENSIONS
 TALKING POINTS FOR THE EXECUTIVE SECRETARY ROUNDTABLE 1: GLOBALIZATION, DEVELOPMENT AND POVERTY REDUCTION: THEIR SOCIAL AND GENDER DIMENSIONS Distinguished delegates, Ladies and gentlemen: I am pleased
Levels and Trends in Multidimensional Poverty in some Southern and Eastern African countries, using counting based approaches
 Poverty and Inequality in Mozambique: What is at Stake? 27-28 November 2017 Hotel Avenida Maputo, Mozambique Session 1: Poverty and Inequality Levels and Trends in Multidimensional Poverty in some Southern
How s Life in Mexico?
 How s Life in Mexico? November 2017 Relative to other OECD countries, Mexico has a mixed performance across the different well-being dimensions. At 61% in 2016, Mexico s employment rate was below the OECD
Italy s average level of current well-being: Comparative strengths and weaknesses
 How s Life in Italy? November 2017 Relative to other OECD countries, Italy s average performance across the different well-being dimensions is mixed. The employment rate, about 57% in 2016, was among the
Ghana Lower-middle income Sub-Saharan Africa (developing only) Source: World Development Indicators (WDI) database.
 Source: World Development Indicators (WDI) database.") Knowledge for Development Ghana in Brief October 215 Poverty and Equity Global Practice Overview Poverty Reduction in Ghana Progress and Challenges A tale of success Ghana has posted a strong growth performance
Knowledge for Development Ghana in Brief October 215 Poverty and Equity Global Practice Overview Poverty Reduction in Ghana Progress and Challenges A tale of success Ghana has posted a strong growth performance
Household Income inequality in Ghana: a decomposition analysis
 Household Income inequality in Ghana: a decomposition analysis Jacob Novignon 1 Department of Economics, University of Ibadan, Ibadan-Nigeria Email: nonjake@gmail.com Mobile: +233242586462 and Genevieve
Wage Premia and Wage Differentials in the South African Labour Market
 2000 Annual Forum at Glenburn Lodge, Muldersdrift Wage Premia and Wage Differentials in the South African Labour Market Haroon Bhorat 1 Development Policy Research Unit University of Cape Town 1 Director,
Poverty Reduction and Economic Growth: The Asian Experience Peter Warr
 Poverty Reduction and Economic Growth: The Asian Experience Peter Warr Abstract. The Asian experience of poverty reduction has varied widely. Over recent decades the economies of East and Southeast Asia
The widening income dispersion in Hong Kong :
 Lingnan University Digital Commons @ Lingnan University Staff Publications Lingnan Staff Publication 3-14-2008 The widening income dispersion in Hong Kong : 1986-2006 Hon Kwong LUI Lingnan University,
vi. rising InequalIty with high growth and falling Poverty
 43 vi. rising InequalIty with high growth and falling Poverty Inequality is on the rise in several countries in East Asia, most notably in China. The good news is that poverty declined rapidly at the same
POLICY BRIEF. Assessing Labor Market Conditions in Madagascar: i. World Bank INSTAT. May Introduction & Summary
 World Bank POLICY INSTAT BRIEF May 2008 Assessing Labor Market Conditions in Madagascar: 2001-2005 i Introduction & Summary In a country like Madagascar where seven out of ten individuals live below the
Contents. List of Figures List of Maps List of Tables List of Contributors. 1. Introduction 1 Gillette H. Hall and Harry Anthony Patrinos
 Contents List of Figures List of Maps List of Tables List of Contributors page vii ix x xv 1. Introduction 1 Gillette H. Hall and Harry Anthony Patrinos 2. Indigenous Peoples and Development Goals: A Global
How s Life in Denmark?
 How s Life in Denmark? November 2017 Relative to other OECD countries, Denmark generally performs very well across the different well-being dimensions. Although average household net adjusted disposable
The Ghana Poverty and Inequality Report: Using the 6th Ghana Living Standards Survey 2016
 The Ghana Poverty and Inequality Report: Using the 6th Ghana Living Standards Survey 2016 By Edgar Cooke (Ashesi University College, Ghana); Sarah Hague (Chief of Policy, UNICEF Ghana); Andy McKay (Professor
How s Life in Turkey?
 How s Life in Turkey? November 2017 Relative to other OECD countries, Turkey has a mixed performance across the different well-being dimensions. At 51% in 2016, the employment rate in Turkey is the lowest
CH 19. Name: Class: Date: Multiple Choice Identify the choice that best completes the statement or answers the question.
 Class: Date: CH 19 Multiple Choice Identify the choice that best completes the statement or answers the question. 1. In the United States, the poorest 20 percent of the household receive approximately
Rural and Urban Migrants in India:
 Rural and Urban Migrants in India: 1983 2008 Viktoria Hnatkovska and Amartya Lahiri This paper characterizes the gross and net migration flows between rural and urban areas in India during the period 1983
Rural and Urban Migrants in India:
 Rural and Urban Migrants in India: 1983-2008 Viktoria Hnatkovska and Amartya Lahiri July 2014 Abstract This paper characterizes the gross and net migration flows between rural and urban areas in India
A Profile of the Limpopo Province: Demographics, Poverty, Income, Inequality and Unemployment from 2000 till 2007
 Background Paper Series Background Paper 2009:1(9) A Profile of the Limpopo Province: Demographics, Poverty, Income, Inequality and Unemployment from 2000 till 2007 Elsenburg February 2009 Overview The
Socio-Economic Mobility Among Foreign-Born Latin American and Caribbean Nationalities in New York City,
 Socio-Economic Mobility Among Foreign-Born Latin American and Caribbean Nationalities in New York City, 2000-2006 Center for Latin American, Caribbean & Latino Studies Graduate Center City University of
How s Life in Greece?
 How s Life in Greece? November 2017 Relative to other OECD countries, Greece has a mixed performance across the different well-being dimensions. Material conditions in Greece are generally below the OECD
QUALITY OF LIFE SURVEY IV:
 GCRO DATA BRIEF # NO.7 QUALITY OF LIFE SURVEY IV: CRIME AND PERCEPTIONS OF SAFETY IN GAUTENG SEPTEMBER 2017 Authors: Mncedisi Siteleki, Richard Ballard, Aidan Mosselson A PARTNERSHIP OF QUALITY OF LIFE
How s Life in Germany?
 How s Life in Germany? November 2017 Relative to other OECD countries, Germany performs well across most well-being dimensions. Household net adjusted disposable income is above the OECD average, but household
The Trends of Income Inequality and Poverty and a Profile of
 http://www.info.tdri.or.th/library/quarterly/text/d90_3.htm Page 1 of 6 Published in TDRI Quarterly Review Vol. 5 No. 4 December 1990, pp. 14-19 Editor: Nancy Conklin The Trends of Income Inequality and
Post-Secondary Education, Training and Labour September Profile of the New Brunswick Labour Force
 Post-Secondary Education, Training and Labour September 2018 Profile of the New Brunswick Labour Force Contents Population Trends... 2 Key Labour Force Statistics... 5 New Brunswick Overview... 5 Sub-Regional
How s Life in Poland?
 How s Life in Poland? November 2017 Relative to other OECD countries, Poland s average performance across the different well-being dimensions is mixed. Material conditions are an area of comparative weakness:
Executive summary. Part I. Major trends in wages
 Executive summary Part I. Major trends in wages Lowest wage growth globally in 2017 since 2008 Global wage growth in 2017 was not only lower than in 2016, but fell to its lowest growth rate since 2008,
Poverty, Livelihoods, and Access to Basic Services in Ghana
 Poverty, Livelihoods, and Access to Basic Services in Ghana Joint presentation on Shared Growth in Ghana (Part II) by Zeljko Bogetic and Quentin Wodon Presentation based on a paper by Harold Coulombe and
Unequal Recovery, Labor Market Polarization, Race, and 2016 U.S. Presidential Election. Maoyong Fan and Anita Alves Pena 1
 Unequal Recovery, Labor Market Polarization, Race, and 2016 U.S. Presidential Election Maoyong Fan and Anita Alves Pena 1 Abstract: Growing income inequality and labor market polarization and increasing
2. Money Metric Poverty & Expenditure Inequality
 Arab Development Challenges 2. Money Metric Poverty & Expenditure Inequality 1 Chapter Overview Kinds of poverty lines Low money metric poverty but high exposure to economic shock The enigma of inequality
ARTICLES. Poverty and prosperity among Britain s ethnic minorities. Richard Berthoud
 Poverty and prosperity among Britain s ethnic minorities Richard Berthoud ARTICLES Recent research provides evidence of continuing economic disadvantage among minority groups. But the wide variation between
The Poor in the Indian Labour Force in the 1990s. Working Paper No. 128
 CDE September, 2004 The Poor in the Indian Labour Force in the 1990s K. SUNDARAM Email: sundaram@econdse.org SURESH D. TENDULKAR Email: suresh@econdse.org Delhi School of Economics Working Paper No. 128
II. Roma Poverty and Welfare in Serbia and Montenegro
 II. Poverty and Welfare in Serbia and Montenegro 10. Poverty has many dimensions including income poverty and non-income poverty, with non-income poverty affecting for example an individual s education,
Characteristics of Poverty in Minnesota
 Characteristics of Poverty in Minnesota by Dennis A. Ahlburg P overty and rising inequality have often been seen as the necessary price of increased economic efficiency. In this view, a certain amount
Occupational gender segregation in post-apartheid South Africa
 UNU-WIDER Helsinki, March 7, 2018 Occupational gender segregation in post-apartheid South Africa Carlos Gradín UNU-WIDER Motivation South Africa: dysfunctional labor market with low employment rates among
Statistical Yearbook. for Asia and the Pacific
 Statistical Yearbook for Asia and the Pacific 2015 Statistical Yearbook for Asia and the Pacific 2015 Sustainable Development Goal 1 End poverty in all its forms everywhere 1.1 Poverty trends...1 1.2 Data
Fiscal Impacts of Immigration in 2013
 www.berl.co.nz Authors: Dr Ganesh Nana and Hugh Dixon All work is done, and services rendered at the request of, and for the purposes of the client only. Neither BERL nor any of its employees accepts any
How Important Are Labor Markets to the Welfare of Indonesia's Poor?
 Public Disclosure Authorized Public Disclosure Authorized Public Disclosure Authorized Public Disclosure Authorized S /4 POLICY RESEARCH WORKING PAPER 1665 How Important Are Labor Markets to the Welfare
Asian Development Bank Institute. ADBI Working Paper Series. Income Distributions, Inequality, and Poverty in Asia,
 ADBI Working Paper Series Income Distributions, Inequality, and Poverty in Asia, 1992 2010 Duangkamon Chotikapanich, William E. Griffiths, D. S. Prasada Rao, and Wasana Karunarathne No. 468 March 2014
CHAPTER 3 THE SOUTH AFRICAN LABOUR MARKET
 CHAPTER 3 THE SOUTH AFRICAN LABOUR MARKET 3.1 INTRODUCTION The unemployment rate in South Africa is exceptionally high and arguably the most pressing concern that faces policy makers. According to the
Research Report. How Does Trade Liberalization Affect Racial and Gender Identity in Employment? Evidence from PostApartheid South Africa
 International Affairs Program Research Report How Does Trade Liberalization Affect Racial and Gender Identity in Employment? Evidence from PostApartheid South Africa Report Prepared by Bilge Erten Assistant
Michael Förster. OECD Social Policy Division. November 3 rd 2015
 Michael Förster OECD Social Policy Division November 3 rd 2015 Rózsavölgyi Szalon Budapest 4 November 2015 Three major OECD studies since 2008 2008 2011 2015 2/16 Results from recent OECD study on inequality:
Human Development Indices and Indicators: 2018 Statistical Update. Eritrea
 Human Development Indices and Indicators: 2018 Statistical Update Briefing note for countries on the 2018 Statistical Update Introduction Eritrea This briefing note is organized into ten sections. The
Poverty and Shared Prosperity in Moldova: Progress and Prospects. June 16, 2016
 Poverty and Shared Prosperity in Moldova: Progress and Prospects June 16, 2016 Overview Moldova experienced rapid economic growth, accompanied by significant progress in poverty reduction and shared prosperity.
Unemployment, Education and Skills Constraints in Post-Apartheid South Africa
 Unemployment, Education and Skills Constraints in Post-Apartheid South Africa Rosa Dias and Dorrit Posel Accelerated and Shared Growth in South Africa: Determinants, Constraints and Opportunities 18-20
Poverty Profile. Executive Summary. Kingdom of Thailand
 Poverty Profile Executive Summary Kingdom of Thailand February 2001 Japan Bank for International Cooperation Chapter 1 Poverty in Thailand 1-1 Poverty Line The definition of poverty and methods for calculating
LABOUR AND EMPLOYMENT
 5 LABOUR AND EMPLOYMENT The labour force constitutes a key resource that is vital in the growth and development of countries. An overarching principle that guides interventions affecting the sector aims
China s (Uneven) Progress Against Poverty. Martin Ravallion and Shaohua Chen Development Research Group, World Bank
 Progress Against Poverty. Martin Ravallion and Shaohua Chen Development Research Group, World Bank") China s (Uneven) Progress Against Poverty Martin Ravallion and Shaohua Chen Development Research Group, World Bank 1 Around 1980 China had one of the highest poverty rates in the world We estimate that
China s (Uneven) Progress Against Poverty Martin Ravallion and Shaohua Chen Development Research Group, World Bank 1 Around 1980 China had one of the highest poverty rates in the world We estimate that
Income Distributions, Inequality, and Poverty in Asia,
 Cornell University ILR School DigitalCommons@ILR International Publications Key Workplace Documents 3-2014 Income Distributions, Inequality, and Poverty in Asia, 1992 2010 Duangkamon Chotikapanich Monash
Poverty profile and social protection strategy for the mountainous regions of Western Nepal
 October 2014 Karnali Employment Programme Technical Assistance Poverty profile and social protection strategy for the mountainous regions of Western Nepal Policy Note Introduction This policy note presents
Poverty and Inequality Changes in Turkey ( )
") State Planning Organization of the Republic of Turkey and World Bank Welfare and Social Policy Analytical Work Program Working Paper Number 1: Poverty and Inequality Changes in Turkey (2003-2006) Meltem
State Planning Organization of the Republic of Turkey and World Bank Welfare and Social Policy Analytical Work Program Working Paper Number 1: Poverty and Inequality Changes in Turkey (2003-2006) Meltem
POVERTY AND INEQUALITY IN SOUTH WEST BENGAL: AN OVERVIEW
 Jharkhand Journal of Social Development, Vol. V, No.1 & 2, 2013 ISSN 0974 651x POVERTY AND INEQUALITY IN SOUTH WEST BENGAL: AN OVERVIEW Rajarshi Majumder Associate Professor, Department of Economics, University
19 ECONOMIC INEQUALITY. Chapt er. Key Concepts. Economic Inequality in the United States
 Chapt er 19 ECONOMIC INEQUALITY Key Concepts Economic Inequality in the United States Money income equals market income plus cash payments to households by the government. Market income equals wages, interest,
The Impact of Remittance on Poverty: Evidence from the South African National Income Dynamics Study (NIDS)
") The Impact of Remittance on Poverty: Evidence from the South African National Income Dynamics Study (NIDS) Seyfe Wurku & Joyce Marangu Abstract The study uses two approaches to assess the impact of remittance
The Impact of Remittance on Poverty: Evidence from the South African National Income Dynamics Study (NIDS) Seyfe Wurku & Joyce Marangu Abstract The study uses two approaches to assess the impact of remittance
Human Development Indices and Indicators: 2018 Statistical Update. Pakistan
 Human Development Indices and Indicators: 2018 Statistical Update Briefing note for countries on the 2018 Statistical Update Introduction Pakistan This briefing note is organized into ten sections. The
Executive summary. Strong records of economic growth in the Asia-Pacific region have benefited many workers.
 Executive summary Strong records of economic growth in the Asia-Pacific region have benefited many workers. In many ways, these are exciting times for Asia and the Pacific as a region. Dynamic growth and
Community Well-Being and the Great Recession
 Pathways Spring 2013 3 Community Well-Being and the Great Recession by Ann Owens and Robert J. Sampson The effects of the Great Recession on individuals and workers are well studied. Many reports document