Ecological Contexts of Reception: The Segregation of Hispanics and Asians in New Destination Areas. Douglas S. Massey
|
|
|
- Clemence Hines
- 5 years ago
- Views:
Transcription
1 Ecological Contexts of Reception: The Segregation of Hispanics and Asians in New Destination Areas Douglas S. Massey Office of Population Research Princeton University Abstract This paper explores trends in residential segregation, spatial isolation, and poverty concentration for Hispanics and Asians in new, traditional, and low immigration areas. The analysis uses a typology of destination areas derived from an earlier classification scheme developed by Singer (2004). It uses the index of dissimilarity to measure segregation from whites and the P* isolation index to measure both racial isolation and the degree of class isolation experienced by the poor of each group. Trends in segregation and spatial isolation do not differ much between new, traditional, and low immigration areas, though variation in the size and rate of growth of the Hispanic population in different areas does produce differences in the spatial isolation of Hispanics. In general, Hispanic display higher levels of segregation and isolation than Asians, and these conditions combine with elevated Hispanic poverty rates to produce relatively high concentrations of poverty. Although Asian poverty is also spatially concentrated, it is not produced by the interplay of segregation and poverty in the same way as among Hispanics. Given their lower levels of segregation, isolation, and poverty Asians generally experience more favorable contexts of reception than do Latinos in the spatial ecology of metropolitan America.
2 During the 1990s a new geography of immigration and settlement emerged in the United States. Prior to that time, immigration was heavily focused on just six states: California, Florida, Illinois, New Jersey, New York, and Texas. The degree of geographic concentration was especially marked for Hispanics. Among Mexican immigrants who arrived between 1985 and 1990, for example, 87% settled in one of these states, and the figure was 80% for other Latin Americans. In contrast, among those who arrived between 2000 and 2005, only 61% of Mexicans and 58% of Other Latin Americans settled in the same six states. Among Asians who arrived in each period, however, the shift was only from 65% to 53% (Massey and Capoferro 2008). Among Latino immigrants, the biggest shift was away from the state of California. Whereas 63% of Mexicans and 25% of Other Latinos who arrived in went to the Golden State, among those arriving in the respective shares were only 33% and 9%. Although the share of Asians going to California also declined, the drop was not as sharp, only falling from 35% to 24%. The principal reason for the dramatic shift of Hispanic immigration away from California was the massive militarization of that state s southern border, which diverted flows of undocumented Mexicans and Central Americans eastward through the Sonoran Desert, into Arizona, and onward to new destinations throughout the nation (Massey, Durand, and Pren 2016). The presence of Latino and Asian immigrants in new destination has attracted considerable attention (cf. Zúñiga and Hernández-León 2005; Massey 2008; Singer, Hardwick, and Bretell 2009; Marrow 2011; Frey 2014; Chambers et al 2017). Based on data from the 2000 Census, Singer (2004) generated a typology of immigrant destinations, classifying U.S. metropolitan areas into seven categories: Former Gateways, Continuous Gateways, Post-World War II Gateways, Emerging Gateways, Re- Emerging Gateways, and Low Migration Areas, a classification scheme she recently updated for 2014 (Singer 2015). Drawing on a modified version of this classification scheme, in the present analysis I consider the ecological context of reception for Hispanic and Asian immigrants by assessing trends in the residential segregation, spatial isolation, and the concentration of poverty for Hispanics and Asians in new and traditional destination areas. 1
3 DATA AND METHODS Data come from the Decennial Census of Housing and Population for 1970, 1980, 1990, 2000, and 2010 and the American Community Survey. Measures of residential segregation and spatial isolation for were taken from Logan and Stults (2011) and measures of segregation and isolation for 1970 were computed from data extracted from the professional version of Social Explorer ( All metropolitan areas and census tract grids were standardized to definitions used in Residential segregation and spatial isolation were measured using the index of dissimilarity (D) and the P* isolation index (Massey and Denton 1988). For any two groups X and Y, D gives the relative share of X and Y members who would have to exchange tracts to achieve an even residential distribution one in which each census tract replicates the percentage of X and Y members in the metropolitan area as a whole. For any group X, the P* isolation index gives the proportion of X members living in the census tract occupied by the average group X member.whereas D varies from 0 (complete integration) to 100 (complete segregation), the P* isolation index varies from the percentage of X members in the metropolitan population (minimal isolation) to 100 (total isolation). Singer s classification scheme for 2010 is presented in Appendix A. It includes former gateways, metropolitan areas that were once major immigrant ports of entry but no longer receive many immigrants. They consist largely of older manufacturing areas in the Northeast and Midwest, such as Buffalo and Cleveland. Continuous gateways are longstanding immigrant destinations that have experienced sustained entry from abroad since the early 20th century, including major gateways such as Chicago and New York but also minor gateways such as Fresno and San Antonio. Post-World War Two gateways include metropolitan areas that began receiving significant numbers of immigrants in the mid-20 th Century such as Dallas and Miami. Emerging gateways only began receiving immigrants in the late 20 th Century, including major new gateways such as Atlanta and Las Vegas as well as minor gateways such as Nashville and Salt Lake City. Reemerging gateways experienced significant immigration early in the 20 th Century and then after a long hiatus once again began receiving immigrants at century s end, including 2
4 areas such as Philadelphia and Seattle. Finally, low immigration areas have foreign born percentages below the national average and experience only modest immigration from abroad. Preliminary work using these categories revealed that segregation levels and trends were quite similar for low immigration areas and former gateways, so I combined these rubrics into a single category labeled low immigration (which includes 54 metropolitan areas). Trends in emerging and reemerging gateway areas were also quite similar, so these two classifications were combined to create a new category labeled new destinations (26 areas) Finally, since the Post World War Two gateways included major targets of Latin American immigration such as Los Angeles and Houston that have long served as traditional destinations for Mexicans, this category was combined with the continuous gateway category to create a new category here labeled traditional (41 areas). HISPANIC SEGREGATION, ISOLATION, AND POVERTY CONCENTRATION Figure 1 shows trends in Hispanic-white segregation in traditional, new, and low immigration metropolitan areas. Dissimilarity index values over 60 are conventionally considered to be high, while those between 30 and 60 are moderate, and those below 30 are low. By these criteria, levels of Hispanic segregation have consistently been in the moderate range. In 1970 average values were clustered tightly between 44 and 49 across the different destination types. Thereafter the dissimilarity index dropped to around 35 in 1980 in new and low destination areas, where it basically remained through 1990 before rising again in 2000 and ending up with values of around 40 in low destination areas and 43 in new destination areas in In contrast, Hispanic segregation in traditional areas remained elevated throughout the four decades, with the dissimilarity index rising slowly from around 47 in 1970 to reach 50 in 2000 before dropping slightly to 49 in As a point of comparison, black-white segregation in 2010 averaged around 60 (Rugh and Massey 2014). FIGURE 1 ABOUT HERE Thus Hispanics are not as segregated as African Americans irrespective of destination type, at least on average; and within new destination areas the average level of Hispanic-white segregation is lower than in traditional areas. However, from 1970 to 2010 the number of Hispanics rose quite sharply in 3
5 in most metropolitan areas, and as can be seen in Figure 2 this growth was associated with a significant increase in the degree to which Hispanics were spatially isolated within neighborhoods. In traditional areas of Hispanic settlement, the average P* isolation stood at around 22 in 1970 but rose steady over the ensuing decades to reach 42 in 2010, meaning that the average Latino in that year inhabited a census tract that was 42% Hispanic. Levels of isolation were much lower in new and low immigration areas through 1990 but thereafter moved up sharply. Whereas the isolation index rose slowly from around 10 to 12 between 1970 and 1990 in new immigration areas and from 5 to 8 in low immigration areas, after 1990 the increase accelerated in both types of metropolitan areas, reaching a value of 24 in new immigration areas and 16 in low immigration areas. FIGURE 2 ABOUT HERE Segregation has consequences for socioeconomic wellbeing because high levels of segregation imply restrictions on residential mobility; and because opportunities and resources are unevenly distributed in urban space, limits on residential mobility necessarily place limits on socioeconomic mobility (Massey and Denton 1985). In addition, segregation is directly connected to the geographic concentration of poverty (Quillian 2012) and exposure to concentrated disadvantage is increasingly recognized as a critical mechanism by which poverty is perpetuated over time and across the generations (Sampson 2013; Sharkey 2014). Figure 3 therefore plots trends in the concentration of Hispanic poverty from 1970 to 2010, with poverty concentration being measured using the P* isolation index for poor Hispanics relative to poor people of any origin. In essence, the index gives the percentage poor in the neighborhood of the average poor Hispanic. FIGURE 3 ABOUT HERE Whereas the degree of racial isolation varied considerably by destination type, we observe much less variation in the degree of class isolation experienced by poor Hispanics. All three destination types display the same time trend and very similar absolute levels of isolation. In 1970s the P* index of poverty concentration varied narrowly from 18 to 21, meaning that the average poor Latino lived in a neighborhood that was 18% to 21% poor and as of 1980 it stood at 18 across all destination types. In 4
6 general neighborhood poverty rates over 20 are considered to be high and those above 40 are viewed as extreme. By these standards, therefore, the concentration of Hispanic was on the margins of the high range but not extreme, certainly lower than that experienced by blacks. Although little change occurred through the 1970s, after 1980 poverty concentration rose across all destination types and the range of index values increased. As of 2000, the average poor Latino lived in a neighborhood that was 31% or 32% poor in low immigration and traditional immigration areas and 28% poor in new destination areas. By 2010, however, the range had constricted and the averages had fallen a bit, with index values ranging from 25 or 26 in new and traditional areas to 28% in low immigration areas. Since 1990, therefore, poor Hispanics have generally experienced rather high concentrations of poverty regardless of destination. Although average levels of Hispanic residential segregation may generally fall into the moderate range, in some metropolitan areas they can be quite high. Figure 4 shows levels of segregation, isolation, and poverty concentration for the five most segregated metropolitan areas in each destination category (ranked according to the index of Hispanic-white dissimilarity). Among both low and traditional immigration areas, locations in the northeast dominate. These are places in which Caribbean origins dominate, where groups such as Puerto Ricans, Cubans, and Dominicans contain significant numbers of persons of African descent. Prior research indicates that larger shares of darker-skinned, nonwhite Hispanics in this region historically have been associated higher levels of segregation than in other regions (Massey and Bitterman 1985; Denton and Massey 1989). Thus indices of Hispanic-white dissimilarity are above 60 in Springfield (MA), Providence, Peabody (MA), New York, Newark, and Boston; and indices are in the upper portion of the moderate range in Allentown and Lancaster (PA) as well. FIGURE 4 ABOUT HERE Among the most segregated low and traditional immigration areas, only Milwaukee and Los Angeles lie outside the northeast. In many ways Los Angeles stands out as the most segregated metropolitan area for Hispanics, with indices of segregation and isolation both above 60. Indeed, 5
7 according to Wilkes and Iceland (2004), by 2000 the Los Angeles metropolitan area had come to satisfy the criteria for hypersegregation, along with New York. Although the P* index for racial isolation never exceeds 50 in any other metropolitan area, Springfield stands out for its extreme level poverty concentration, with an isolation index value of The degree of poverty concentration is also quite high (above 30) in Providence, Milwaukee, and Boston, implying rather unfavorable contexts of reception for Hispanics in those metropolitan areas. Turning to new immigration areas, we see that the highest levels of segregation there do not reach those displayed in traditional and low immigration areas. In no metropolitan areas does the dissimilarity index exceed 60 and with the exception of Phoenix indices of racial isolation are all below 30, though Philadelphia does stand out for its relatively high concentration of Hispanic poverty. In that metropolitan area, the average Latino in 2010 lived in a tract that was almost 41% poor, certainly an inauspicious context for adaptation, assimilation, and socioeconomic advancement. ASIAN SEGREGATION, ISOLATION, AND POVERTY CONCENTRATION Unlike Hispanic-white segregation that between Asians and whites is much lower, has varied little over time, and has never varied much by destination type. As shown in Figure 5, in 1970 Asianwhite segregation stood at roughly 35 in all destination categories, and in 2010 the range only went from 36 to 38 (in contrast to among Hispanics). Given these modest levels of dissimilarity and the lower relative share of Asians compared to Hispanics in most metropolitan areas, levels of Asian spatial isolation have remained quite low, as indicated in Figure 6. From 1980 to 2010 the average P* isolation index rose only from 7 to 15 in traditional immigration areas, form 4 to 11 in new destination areas, and from 3 to 5 in low immigration areas. FIGURES 5 AND 6 ABOUT HERE Despite moderate levels of segregation and low levels of spatial isolation, the concentration of Asian poverty is quite high, only a little below that of Hispanics, and it follows the same trend as Hispanic poverty concentration over time (see Figure 7). From values of around 12 for traditional areas and 15 for new and low immigration areas in 1980, the class isolation index for poor Asians rose sharply 6
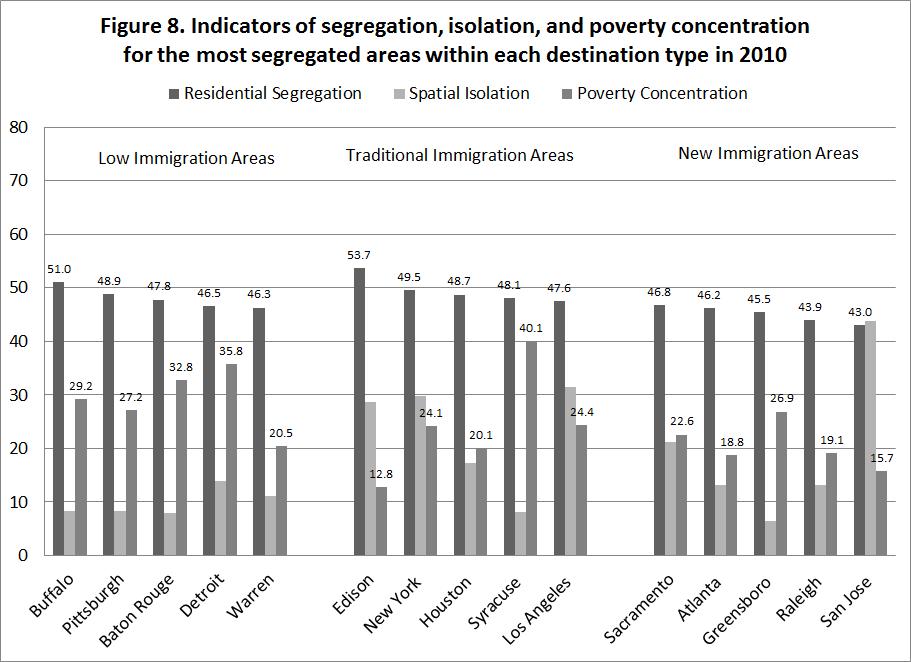
8 during the 1980s and then slowed down during the 1990s to peak at 29 in low immigration areas and around 26 in new and traditional immigration areas in 2000 before falling back to respective values of 26 and 22 in FIGURE 7 ABOUT HERE A quick glance at Figure 8, which shows measures of segregation, isolation, and poverty concentration for the five most segregated metropolitan areas in each destination category, reveals that levels of Asian white-segregation never reach the high levels observed for Hispanics. There are no Asianwhite dissimilarity indices above 60 and few above 50. Indeed, among low immigration areas, only Buffalo displays an index value above 50 and among traditional immigration areas, only Edison (NJ) displays an index above that threshold. Among new immigration areas, no metropolitan displayed an Asian-white dissimilarity above 50. The highest dissimilarity values are generally in the 40s and indices of racial isolation rarely exceed 30. FIGURE 8 ABOUT HERE Among low immigration areas, racial isolation indices range from 8 to 14 and among new and traditional areas they range from 7 to 30. In just two metropolitan areas do we observe isolation indices above 30: Los Angeles (around 32) and San Jose (around 44). As already noted, the class isolation of poor Asians is surprisingly high given their modest degree of residential segregation and spatial isolation (more on this below). The highest concentrations of poverty are 40 in Syracuse (a traditional immigration area), 36 in Detroit (a low immigration area), and 33 in Baton Rouge (another low immigration area). In most of the remaining areas, poverty concentration indices vary between 20 and 30 (in Buffalo, Pittsburgh, Warren (MI) among low immigration areas; in New York, Houston, and Los Angeles among traditional areas; and in Sacramento and Greensboro (NC) among new destination areas). Levels of concentrated poverty are low in Edison (NJ), Atlanta, Raleigh, and San Jose. DETERMINANTS OF SEGREGATION, ISOLATION, AND POVERTY CONCENTRATION In their analysis of data from 287 metropolitan areas Rugh and Massey (2014) found that nationwide, residential segregation and spatial isolation were determined by a small set of group 7
9 characteristics (the minority percentage, the percentage foreign born, levels of income and education relative to non-hispanic whites, and the degree of anti-black and anti-latino sentiment) and a few metropolitan characteristics (the restrictiveness of density zoning in suburbs, the size of the metropolitan population, the percent of workers in unions, the percent aged 65 and over, the median year of home construction, the share employed in finance, insurance, and real estate (the FIRE sector), and the relative size of the military population. Preliminary analyses uncovered no evidence that the relative size of the military population had any effect on Hispanic or Asian segregation (given high proportions of foreign born in these populations few are in the military). Early estimates also detected no significant effect of anti-latino sentiment on Hispanic segregation in the metropolitan areas under study, so we dropped these two variables from further considerations. However, preliminary estimates did detect significant effects of the estimated share of undocumented migrants among Hispanics (computed from data obtained from the Center for Migration Studies (2017) as well as the share of Hispanics who self-identified as nonwhite (computed from census data). The left-hand columns of Table 1 show a parsimonious model that explains 82% of the 2010 variance in Hispanic-white segregation using just six group characteristics and six metropolitan characteristics (full information on the independent variables is available from Rugh and Massey (2014). Dummy variables indicating type of destination revealed no significant differences between low immigration, new immigration and traditional immigration areas in the degree of Latino segregation, reinforcing the overall impression derived from the descriptive figures. TABLE 1 ABOUT HERE With respect to group characteristics, Hispanic segregation is found to increase with the metropolitan percentage of Hispanics, the share of foreign born Hispanics, and the percentage of nonwhite Hispanics and to fall as household income and the percent college educated rises among Hispanics relative to whites. Contrary to expectations, the share of Hispanics estimated to be undocumented was negatively related to the degree of Hispanic-white segregation. In terms of metropolitan characteristic, Hispanic segregation was found to be positively predicted by the 8
10 restrictiveness of suburban density zoning, the size of the metropolitan population, the share aged 65 or older, and the share of workers in the FIRE sector and negatively predicted by the percent unionized and the median year of home construction. However, the same set of independent variables explains only half as much of the variation in Asian-white segregation, with only four variables attaining statistical significance and no detectable effects associated with socioeconomic status indicators. As in the Hispanic model, destination type had no effect on the degree of segregation experienced by Asians. Their segregation was positively associated with the metropolitan percentage Asian, restrictive suburban density zoning, and large metropolitan population size. However, whereas the share of persons aged 65 or older positively predicted Hispanic segregation, it was negatively associated with Asian segregation. In general, the residential segregation of Asians was far less systematic than that of Hispanics. Given a predetermined level of dissimilarity from whites and the percentage minority, the degree of spatial isolation generally follows axiomatically with little additional influence from group or metropolitan characteristics. Such an axiomatic determination of spatial isolation is certainly the case for Hispanics, as shown in left-hand columns of the top panel of Table 2, wherein these two variables explain 96% of the variance in Hispanic spatial isolation. Type of destination had no significant bearing on the degree of spatial isolation experienced by Hispanics. Much the same is true of the Asian model shown in the right-hand columns of the top panel, where in the model explains 88% of the variation in Asian spatial isolation. However estimates indicate that Asian isolation levels are systematically lower in low immigration areas compared to new or traditional immigration areas. TABLE 2 ABOUT HERE Finally, the spatial concentration of poverty has been shown to stem in large part from an interaction between segregation and the poverty rate, such that when a poor population is highly segregated, concentrated poverty inevitably results. The bottom panel of Table 2 regresses the class isolation index for poor Hispanics and Asians on the poverty rate for each group and an interaction term, which multiplies the observed level of dissimilarity from whites by the poverty rate. Among Hispanics, 9
11 the degree of poverty concentration does not vary by type of destination and together the poverty rate and the interaction term explain 77% of the variation in poverty concentration, though the interaction term is only significant at the 10% level. Among Asians, however, poverty concentration tends to be greater in low immigration areas, and whereas the poverty-by-segregation interaction is highly significant, the poverty rate itself fails to achieve statistical significance, and only 39% of the variation in Asian poverty concentration is explained by the model. Thus compared with Hispanics, the concentration of Asian poverty is determined by other factors besides poverty and segregation. CONCLUSION In this paper I have analyzed trends and patterns of residential segregation, spatial isolation, and poverty concentration for Hispanics in new, traditional, and low immigration metropolitan areas. In general, segregation levels and patterns do not vary sharply by type of destination, especially for Asians. However, levels of Hispanic-white dissimilarity are greater than levels of Asian-white dissimilarity; and compared with Asian segregation, Hispanic segregation is more systematically related to group and metropolitan characteristics. The profile of a metropolitan area in which Hispanics experience relatively low levels of segregation is one with a small total population, a newer housing stock, a less restrictive suburban density zoning regime, a small elderly population, a high rate of unionization, and a labor market in which the FIRE sector employs few workers, and one in which Hispanics themselves constitute a small percentage of the metropolitan population, are relatively affluent and well-educated relative to whites, and are generally native born and self-identify as whites. In contrast, the profile of a metropolitan area where Asians are less segregated is much simpler: a small metropolitan population with a small percentage of Asians, a large share of elderly residents, and less restrictive density zoning in suburbs. The degree of Asian and Hispanic spatial isolation is largely determined by each group s percentage of the population and the level of segregation it experiences, and given lower levels of Asianwhite segregation and relatively small Asian populations in most metropolitan areas, the degree of spatial isolation experienced by Asians is considerably lower than that experienced by Hispanics, especially in 10
12 traditional immigrant destinations. Although levels of isolation have increased for both groups, the rate of increase has been much more rapid for Hispanics than Asians. Although segregation and poverty are known to interact such that the segregation of a high poverty group tends to concentrate poverty spatially, this dynamic plays out much more forcefully for Hispanics than Asians across U.S. metropolitan areas. Although Asians do display relatively high concentrations of poverty, their lower levels of segregation, isolation, and poverty mean that the concentration of Asian poverty is not produced so much by the interplay of segregation and poverty, but is attributable to other processes that remain unidentified. Whereas poverty and the segregation-poverty interaction account for only 39% of the inter-metropolitan variation in Asian poverty concentration, they account for 77% of the variation in Hispanic poverty concentration. In the end, when it comes to the spatial ecology of U.S. metropolitan areas, the analyses presented here do not reveal substantially different contexts of reception in new versus traditional areas of destination, but they do suggest difference ecological contexts for Hispanics and Asians. Gven the lower levels of segregation and spatial isolation observed for Asians and the weaker connection of Asian segregation to the concentration of Asian poverty, the ecological context of reception for Asians appears to be more favorable than that for Hispanics irrespective of the type of destination. Hispanics face higher levels of segregation, higher and more rapidly rising levels of isolation, and owing the dynamic interaction between Hispanic segregation and Hispanic poverty they a rather high concentration of poverty in many metropolitan areas. 11
13 REFERENCES Center for Migration Studies Center for Migration Studies PUMA-Level Unauthorized Population and Eligible-to-Naturalize Estimates. New York: Center for Migration Studies. Accessed on 4/14/16 at Chambers, Stafanie, Diana Evans, Anthony Messina, and Abigail Williamson The Politics of New Immigrant Destinations: Transatlantic Perspectives Paperback. Philadelphia, PA: Temple University Press. Denton, Nancy A., and Douglas S. Massey "Racial Identity among Caribbean Hispanics: The Effect of Double Minority Status on Residential Segregation." American Sociological Review 54: Frey, William H Diversity Explosion: How New Racial Demographics are Remaking America. Washington, DC: Brookings Institution Press. Logan, John R. and Brian J. Stults (2011. The Persistence of Segregation in the Metropolis: New Findings from the 2010 Census. Census Brief prepared for Project US2010. < > (accessed May 28, 2013). Massey, Douglas S New Faces in New Places: The Changing Geography of American Immigration. New York: Russell Sage Foundation. Massey, Douglas S., and Brooks Bitterman "Explaining the Paradox of Puerto Rican Segregation." Social Forces 64: Massey, Douglas S., and Chiara Capoferro The Geographic Diversification of American Immigration. Pp in Douglas S., Massey, ed., New Faces in New Places: The Changing Geography of American Immigration. New York: Russell Sage Foundation. Massey, Douglas S., and Nancy A. Denton "Spatial Assimilation as a Socioeconomic Outcome." American Sociological Review 50: "The Dimensions of Residential Segregation." Social Forces 67:
14 Massey, Douglas S., Jorge Durand, and Karen A. Pren Why Border Enforcement Backfired. American Journal of Sociology 121 (5): Marrow, Helen B New Destination Dreaming: Immigration, Race, and Legal Status in the Rural American South. Stanford, CA: Stanford University Press. Quillian, Lincoln Segregation and Poverty Concentration: The Role of Three Segregations. American Sociological Review 77: Rugh and Massey 2014 Rugh, Jacob S., and Douglas S. Massey Segregation in Post-Civil Rights America: Stalled Integration or End of the Segregated Century? The DuBois Review: Social Science Research on Race 11: Sampson, Robert J Great American City: Chicago and the Enduring Neighborhood Effect. Chicago, IL: University of Chicago Press. Sharkey, Patrick Stuck in Place: Urban Neighborhoods and the End of Progress Toward Racial Equality. Chicago, IL: University of Chicago Press. Singer, Audrey The Rise of New Immigrant Gateways. Washington, DC: The Brookings Institution A Typology of Immigrant Gateways, Washington, DC: The Brookings Institution. Singer, Audrey, Susan W. Hardwick, and Caroline B. Brettell, eds Twenty-First Century Gateways: Immigrant Incorporation in Suburban America. Washington, DC: The Brookings Institution. Wilkes, Rima, and John Iceland Hypersegregation in the Twenty-First Century: An Update and Analysis. Demography 41(1): Zúñiga, Victor, and Rubén Hernández-León, eds New Destinations: Mexican Immigration in The United States. New York: Russell Sage Foundation. 13
15 Table 1. OLS regression models predicting residential segregation from whites in Hispanics Asians Independent Variables B SE B SE Destination Type Low Immigration New Destination Group Characteristics Percent of Metro Population 0.16*** *** 0.09 Percent Foreign Born 0.10* Minority-White Income Ratio *** Minority-White College Educated *** Percent Undocumented -0.12** Percent Nonwhite 19.85*** Metropolitan Characteristics Density Zoning Restrictiveness 4.31*** *** 1.24 Ln of Population 2.61*** *** 0.87 Percent Unionized -0.28*** Percent Aged *** ** 0.22 Median Year of Home Construction -0.27*** Percent in Fire Sector 0.56* Intercept *** Adjusted R-Squared 0.82*** 0.41*** N *p<0.05; p<0.01; ***p<
16 Table 2. Effect of residential segregation in producing racial isolation and concentration of poverty. Hispanics Asians Independent Variables B SE B SE RACIAL ISOLATION Low Immigration Area *** 0.68 New Destination Area Segregation from Whites 0.59*** *** 0.04 Percent of Metro Population 1.01*** *** 0.04 Intercept *** *** 1.52 Adjusted R-Squared 0.96*** 0.88*** N POVERTY CONCENTRATION Low Immigration Areas * 0.99 New Destination Areas Group Poverty Rate 0.66*** Segregation x Poverty Interaction *** Intercept 10.06*** *** 1.30 R-Squared 0.77*** 0.39*** N
17 16
18 17
19 18

20 19
21 20
22 21
23 22
24 23
25 Appendix A. Singer s (2014) classification of U.S. metropolitan areas into destination categories. Low Immigration Areas Akron, OH MSA Albany-Schenectady-Troy, NY MSA Albuquerque, NM MSA Allentown-Bethlehem-Easton, PA-NJ MSA Augusta-Richmond County, GA-SC MSA Baton Rouge, LA MSA Birmingham-Hoover, AL MSA Boise City-Nampa, ID MSA Charleston-North Charleston-Summerville, SC MSA Chattanooga, TN-GA MSA Cincinnati-Middletown, OH-KY-IN MSA Colorado Springs, CO MSA Columbia, SC MSA Dayton, OH MSA Deltona-Daytona Beach-Ormond Beach, FL MSA Des Moines-West Des Moines, IA MSA Grand Rapids-Wyoming, MI MSA Greenville-Mauldin-Easley, SC MSA Harrisburg-Carlisle, PA MSA Jackson, MS MSA Jacksonville, FL MSA Kansas City, MO-KS MSA Knoxville, TN MSA Lancaster, PA MSA Little Rock-North Little Rock-Conway, AR MSA Louisville/Jefferson County, KY-IN MSA Madison, WI MSA Memphis, TN-MS-AR MSA New Orleans-Metairie-Kenner, LA MSA North Port-Bradenton-Sarasota, FL MSA Ogden-Clearfield, UT MSA Oklahoma City, OK MSA Omaha-Council Bluffs, NE-IA MSA Palm Bay-Melbourne-Titusville, FL MSA Portland-South Portland-Biddeford, ME MSA Provo-Orem, UT MSA Richmond, VA MSA Scranton--Wilkes-Barre, PA MSA Spokane, WA MSA Springfield, MA MSA Toledo, OH MSA Tulsa, OK MSA Virginia Beach-Norfolk-Newport News, VA-NC MSA Wichita, KS MSA Winston-Salem, NC MSA Youngstown-Warren-Boardman, OH-PA MSA 24
26 Emerging Immigrant Areas Atlanta-Sandy Springs-Marietta, GA MSA Austin-Round Rock-San Marcos, TX MSA Charlotte-Gastonia-Rock Hill, NC-SC MSA Columbus, OH MSA Durham-Chapel Hill, NC MSA Greensboro-High Point, NC MSA Indianapolis-Carmel, IN MSA Lakeland-Winter Haven, FL MSA Las Vegas-Paradise, NV MSA Nashville-Davidson--Murfreesboro--Franklin, TN MSA Orlando-Kissimmee-Sanford, FL MSA Phoenix-Mesa-Glendale, AZ MSA Raleigh-Cary, NC MSA Salt Lake City, UT MSA Continuous Immigration Areas Bakersfield-Delano, CA MSA Boston-Quincy, MA MDIV Peabody, MA MDIV Bridgeport-Stamford-Norwalk, CT MSA Cambridge-Newton-Framingham, MA MDIV Chicago-Joliet-Naperville, IL MDIV Gary, IN MDIV Lake County-Kenosha County, IL-WI MDIV El Paso, TX MSA Fresno, CA MSA Hartford-West Hartford-East Hartford, CT MSA McAllen-Edinburg-Mission, TX MSA Modesto, CA MSA Nassau-Suffolk, NY MDIV Newark-Union, NJ-PA MDIV New Haven-Milford, CT MSA New York-White Plains-Wayne, NY-NJ MDIV Edison-New Brunswick, NJ MDIV Oakland-Fremont-Hayward, CA MDIV Oxnard-Thousand Oaks-Ventura, CA MSA Rochester, NY MSA Rockingham County-Strafford County, NH MDIV San Antonio-New Braunfels, TX MSA San Francisco-San Mateo-Redwood City, CA MDIV Stockton, CA MSA Syracuse, NY MSA Tucson, AZ MSA Honolulu, HI MSA Worcester, MA MSA 25
27 Reemerging Immigrant Areas Baltimore-Towson, MD MSA Camden, NJ MDIV Denver-Aurora-Broomfield, CO MSA Minneapolis-St. Paul-Bloomington, MN-WI MSA Philadelphia, PA MDIV Portland-Vancouver-Hillsboro, OR-WA MSA Sacramento--Arden-Arcade--Roseville, CA MSA San Jose-Sunnyvale-Santa Clara, CA MSA Seattle-Bellevue-Everett, WA MDIV Tacoma, WA MDIV Tampa-St. Petersburg-Clearwater, FL MSA Wilmington, DE-MD-NJ MDIV Former Immigration Areas Buffalo-Niagara Falls, NY MSA Cleveland-Elyria-Mentor, OH MSA Detroit-Livonia-Dearborn, MI MDIV Warren-Troy-Farmington Hills, MI MDIV Milwaukee-Waukesha-West Allis, WI MSA Pittsburgh, PA MSA Providence-New Bedford-Fall River, RI-MA MSA St. Louis, MO-IL MSA Postwar Immigration Areas Bethesda-Rockville-Frederick, MD MDIV Dallas-Plano-Irving, TX MDIV Fort Worth-Arlington, TX MDIV Houston-Sugar Land-Baytown, TX MSA Los Angeles-Long Beach-Glendale, CA MDIV Santa Ana-Anaheim-Irvine, CA MDIV Miami-Miami Beach-Kendall, FL MDIV Fort Lauderdale-Pompano Beach-Deerfield Beach, FL MDIV West Palm Beach-Boca Raton-Boynton Beach, FL MDIV Riverside-San Bernardino-Ontario, CA MSA San Diego-Carlsbad-San Marcos, CA MSA Washington-Arlington-Alexandria, DC-VA-MD-WV MDIV 26
Table 1. Top 100 Metro Areas in Established, New/Emerging, and Pre-Emerging Gateways
 Table 1. Top 100 Metro Areas in, New/Emerging, and Pre-Emerging Gateways Bakersfield, CA Honolulu, HI Providence-New Bedford, RI-MA* Boston-Cambridge-Quincy, MA-NH Houston-Sugar Land-Baytown, TX Riverside-San
Racial and Ethnic Separation in the Neighborhoods: Progress at a Standstill
 Sponsored by American Communities Project Russell Sage Foundation us2010 discover america in a new century Racial and Ethnic Separation in the Neighborhoods: Progress at a Standstill John R. Logan (Brown
The New Geography of Immigration and Local Policy Responses
 1 Audrey Singer Senior Fellow The New Geography of Immigration and Local Policy Responses Brookings Mountain West University of Nevada Las Vegas 2 March 9, 2010 The New Geography of Immigration and Policy
The New Geography of Immigration and Local Policy Responses
 1 Audrey Singer Senior Fellow The New Geography of Immigration and Local Policy Responses Brookings Mountain West University of Nevada Las Vegas 2 March 9, 2010 The New Geography of Immigration and Policy
The Brookings Institution
 The Brookings Institution Center on Urban and Metropolitan Policy Bruce Katz, Director Census 2000: Key Trends & Implications for Cities Macalester College September 8, 2003 Overview I. II. III. About
Population Change and Crime Change
 University of Nebraska at Omaha DigitalCommons@UNO Publications Archives, 1963-2000 Center for Public Affairs Research 5-1982 Population Change and Crime Change Deborah Caulfield University of Nebraska
Immigrant Incorporation and Local Responses
 Audrey Singer Senior Fellow Immigrant Incorporation and Local Responses American Sociological Association San Francisco, CA August 9, 2009 Questions --- Exploration How do we evaluate recent state and
New Home Affordability Trends. February 23, 2018
 New Home Affordability Trends February 23, 2018 1 Regional Director Territories Territory Experts Todd Britsch WA, OR Mark Gianopulos IA, IL, IN, MI, MN, MO, ND, OH, SD, WI Quita Syhapanya ME, NH, VT,
The New Metropolitan Geography of U.S. Immigration
 The Brookings Institution Metropolitan Policy Program Audrey Singer, Immigration Fellow The New Metropolitan Geography of U.S. Immigration Mayors Institute on City Design Rethinking Neighborhoods for Immigrants
Diversity Spreads Out:
 Metropolitan Policy Program Diversity Spreads Out: Metropolitan Shifts in Hispanic, Asian, and Black Populations Since 2000 William H. Frey At the turn of the 21st century, the nation s melting pot ideal
16% Share of population that is foreign born, 100 largest metro areas, 2008
 Audrey Singer III. IMMIGRATION By the numbers 16% Share of population that is foreign born, 100 largest metro areas, 2008 1.13 Ratio of immigrants with college degrees to those without high school diplomas,
Twenty-first Century Gateways: Immigrant Incorporation in Suburban America
 Audrey Singer, Immigration Fellow Twenty-first Century Gateways: Immigrant Incorporation in Suburban America Annual meeting of the Association of American Geographers April 18, 2007 New metropolitan geography
Silence of the Innocents: Illegal Immigrants Underreporting of Crime and their Victimization
 Silence of the Innocents: Illegal Immigrants Underreporting of Crime and their Victimization Stefano Comino, 1 Giovanni Mastrobuoni, 2 Antonio Nicolò 3 1 University of Udine, 2 University of Essex, 3 University
Cities, Suburbs, Neighborhoods, and Schools: How We Abandon Our Children
 Cities, Suburbs, Neighborhoods, and Schools: How We Abandon Our Children Paul A. Jargowsky, Director Center for Urban Research and Education May 2, 2014 Dimensions of Poverty First and foremost poverty
By 1970 immigrants from the Americas, Africa, and Asia far outnumbered those from Europe. CANADIAN UNITED STATES CUBAN MEXICAN
 In Search of the American Dream After World War II, millions of immigrants and citizens sought better lives in the United States. More and more immigrants came from Latin America and Asia. Between 940
Independent and Third-Party Municipal Candidates. City Council Election Reform Task Force April 8, :00 p.m.
 Independent and Third-Party Municipal Candidates City Council Election Reform Task Force April 8, 2010 2:00 p.m. 28 of the 32 cities surveyed, or 88%, have non-partisan elections, so they do not have special
The New U.S. Demographics
 The Brookings Institution Center on Urban and Metropolitan Policy The New U.S. Demographics Audrey Singer Funders Network on Population, Reproductive Health and Rights November 10, 2003 QUESTIONS How has
Boomers and Seniors in the Suburbs:
 Center on Urban and Metropolitan Policy Boomers and Seniors in the Suburbs: Aging Patterns in Census 2000 The maturing of the suburban population ushers in a new era for suburbia, and presents both opportunities
Bright Green. Five Metropolitan Areas where the Latino Workforce and the Clean Economy Overlap. By Catherine Singley Harvey
 The National Council of La Raza (NCLR) the largest national Hispanic civil rights and advocacy organization in the United States works to improve opportunities for Hispanic Americans. Through its network
Are Republicans Sprawlers and Democrats New Urbanists? Comparing 83 Sprawling Regions with the 2004 Presidential Vote
 Are Republicans Sprawlers and Democrats New Urbanists? Comparing 83 Sprawling Regions with the 2004 Presidential Vote Stephen L. Sperry Associate Professor Clemson University College of Architecture, Arts
Overview of Boston s Population. Boston Redevelopment Authority Research Division Alvaro Lima, Director of Research September
 Overview of Boston s Population Boston Redevelopment Authority Research Division Alvaro Lima, Director of Research September - 2011 Historic Trends Boston s Population Boston reached its population peak
The Urban Institute Children of Immigrants Data Tool Technical Appendix
 Overview The Urban Institute Children of Immigrants Data Tool Technical Appendix The Urban Institute Children of Immigrants Data Tool generates charts and tables with indicators on children from birth
Lone Star industrial real estate and its link with U.S./Mexico trade
 Texas ties that bind: Lone Star industrial real estate and its link with U.S./Mexico trade Robert C. Kramp Director of Research & Analysis, Texas-Oklahoma Division Pedro Niño, Jr. Sr. Research Analyst,
The Impact of the Great Recession on Metropolitan Immigration Trends
 The Impact of the Great Recession on Metropolitan Immigration Trends AUDREY SINGER AND JILL H. WILSON As the country moves into recovery mode, immigrant settlement patterns are likely to reflect economic
Commuting in America 2013
 Commuting in America 2013 The National Report on Commuting Patterns and Trends Brief 4. Population and Worker Dynamics September 2013 About the AASHTO Census Transportation Planning Products Program Established
Migration Patterns in New Gateways of Texas The Innerburbs
 A resident of Wooten Park, Veronica moved from Ft. Worth to Austin to be close to friends and family. Migration Patterns in New Gateways of Texas The Innerburbs Pamela A. Rogers, Ph.D. Low-Income Housing
Bringing Vitality to Main Street How Immigrant Small Businesses Help Local Economies Grow
 Bringing Vitality to Main Street How Immigrant Small Businesses Help Local Economies Grow A report of the Fiscal Policy Institute and Americas Society/Council of the Americas Cities with Declining Population
Mrs. Yuen s Final Exam. Study Packet. your Final Exam will be held on. Part 1: Fifty States and Capitals (100 points)
") Mrs. Yuen s Final Exam Study Packet your Final Exam will be held on All make up assignments must be turned in by YOUR finals day!!!! Part 1: Fifty States and Capitals (100 points) Be able to identify the
Mrs. Yuen s Final Exam Study Packet your Final Exam will be held on All make up assignments must be turned in by YOUR finals day!!!! Part 1: Fifty States and Capitals (100 points) Be able to identify the
The Landscape of Recession: Unemployment and Safety Net Services Across Urban and Suburban America
 METROPOLITAN OPPORTUNITY SERIES The Landscape of Recession: Unemployment and Safety Net Services Across Urban and Suburban America Emily Garr Findings More than a year after the recession, demand for jobs
The Segregation Tax :
 Center on Urban & Metropolitan Policy Whether the value of the The Segregation Tax : The Cost of Racial Segregation to Black Homeowners By David Rusk 1 family home declines, is stable, or grows is vital
Newspaper Audience Database
 Fall 2005 Release www.naa.org/nadbase www.naa.org/nadbase Table of Contents About the Newspaper Audience Database................................... 3 Why Newspapers...........................................................
Creating Inclusive Communities
 Fostering opportunity through planning. Creating Inclusive Communities Lisa Corrado, Long Range Planning Manager City of Henderson John Tapogna, President EcoNorthwest Overview Recent research on economic
BENCHMARKING REPORT - VANCOUVER
 BENCHMARKING REPORT - VANCOUVER I. INTRODUCTION We conducted an international benchmarking analysis for the members of the Consider Canada City Alliance Inc., consisting of 11 (C11) large Canadian cities
ECONOMIC COMMENTARY. The Concentration of Poverty within Metropolitan Areas. Dionissi Aliprantis, Kyle Fee, and Nelson Oliver
 ECONOMIC COMMENTARY Number 213-1 January 31, 213 The Concentration of Poverty within Metropolitan Areas Dionissi Aliprantis, Kyle Fee, and Nelson Oliver Not only has poverty recently increased in the United
Megapolitan America. Luck Stone Corporation
 Megapolitan America Luck Stone Corporation Historical World Population Growth World population continually increases. With current world population over 6 billion (6,590,514,881 and counting) people, there
Historical and Revision Notes Act
 USC NB: This unofficial compilation of the U.S. Code is current as of Jan., 01 (see http://www.law.cornell.edu/uscode/uscprint.html). TITLE - GOVERNMENT ORGANIZATION AND EMPLOYEES PART III - EMPLOYEES
A MESSAGE TO THE NEXT PRESIDENT
 A MESSAGE TO THE NEXT PRESIDENT EXPERIENCE ALL THAT THE NATIONAL URBAN LEAGUE S STATE OF BLACK AMERICA HAS TO OFFER! Celebrating 40 years of the State of Black America now an all-digital experience! In
The Brookings Institution Metropolitan Policy Program Alan Berube, Fellow
 The Brookings Institution Metropolitan Policy Program Alan Berube, Fellow Confronting Concentrated Poverty in Fresno Fresno Works for Better Health September 6, 2006 Confronting Concentrated Poverty in
African Immigrants in Metropolitan Washington A Demographic Overview
 The Brookings Institution Center on Urban and Metropolitan Policy African Immigrants in Metropolitan Washington A Demographic Overview Jill H.Wilson African Immigrants and Refugees Foundation Conference
A Decade of Mixed Blessings: Urban and Suburban Poverty in Census 2000 The slight Findings overall poverty
 Center on Urban & Metropolitan Policy The slight overall poverty decline in the 1990s camouflaged sharper increases and decreases in certain parts of the nation. A Decade of Mixed Blessings: Urban and
5 Metro areas (out of 100) in which wages increased for low-, middle-, and high-wage workers, 1999 to 2008
 in which wages increased for low-, middle-, and high-wage workers, 1999 to 2008") Howard Wial and Alec Friedhoff VII. WORK By the numbers +3.4% / -8.3% Change in wages for highwage / low-wage workers, United States, 1999 to 2008 5 Metro areas (out of 100) in which wages increased for
Howard Wial and Alec Friedhoff VII. WORK By the numbers +3.4% / -8.3% Change in wages for highwage / low-wage workers, United States, 1999 to 2008 5 Metro areas (out of 100) in which wages increased for
Online Appendix. Table A1. Guidelines Sentencing Chart. Notes: Recommended sentence lengths in months.
 Online Appendix Table A1. Guidelines Sentencing Chart Notes: Recommended sentence lengths in months. Table A2. Selection into Sentencing Stage (1) (2) (3) Guilty Plea Dropped Charge Deferred Prosecution
The Changing Dynamics of Urban America
 The Changing Dynamics of Urban America Executive Summary March 30, 2004 by: Robert Weissbourd, RW Ventures & Christopher Berry, Harvard University i ACKNOWLEDGEMENTS CEOs for Cities, a national leadership
We Got More Educated, We Are Better Off Right? An Analysis of Regional Conversion of Bachelors Degree Attainment into Positive Labor Market Outcomes
 We Got More Educated, We Are Better Off Right? An Analysis of Regional Conversion of Bachelors Degree Attainment into Positive Labor Market Outcomes Prepared for Federal Reserve System Community Development
Immigration and Domestic Migration in US Metro Areas: 2000 and 1990 Census Findings by Education and Race
 Immigration and Domestic Migration in US Metro Areas: 2000 and 1990 Census Findings by Education and Race William H. Frey Population Studies Center The University of Michigan and The Brookings Institution
Analyzing the effects of residential segregation on socioeconomic. outcomes among minorities.
 Analyzing the effects of residential segregation on socioeconomic outcomes among minorities. Ameesh Upadhyay, Franklin and Marshall College. ECO 490 Honors Thesis Course Advisor: Sean E. Flaherty Expected
BOSTON IN FOCUS: A Profile from Census 2000
 BOSTON IN FOCUS: A PROFILE FROM CENSUS 2000 Living Cities: The National Community Development Initiative BOSTON IN FOCUS: A Profile from Census 2000 T he Brookings Institution Center on Urban and Metropolitan
Identifying America s Most Diverse, Mixed Income Neighborhoods
 Identifying America s Most Diverse, Mixed Income Neighborhoods Joe Cortright June, 2018 cityobservatory.org Executive Summary While much of our national discussion is focused on racial, ethnic and economic
Immigration Goes Nationwide Recent dispersal has made immigrants and new minorities more visible
 Immigration Goes Nationwide Recent dispersal has made immigrants and new minorities more visible William H. Frey The Brookings Institution Metropolitan Policy Program Briefing, Immigration Policy: Federal
Epicenter Cities and International Education 17th AIEC Melbourne, Victoria Australia
 Epicenter Cities and International Education 17th AIEC Melbourne, Victoria Australia Thursday, 23 October 2003 Todd Davis, Ph.D. Senior Scholar Institute of International Education The idea of the global
Children of Immigrants
 L O W - I N C O M E W O R K I N G F A M I L I E S I N I T I A T I V E Children of Immigrants 2013 State Trends Update Tyler Woods, Devlin Hanson, Shane Saxton, and Margaret Simms February 2016 This brief
Diversity Explosion. contributor to the Review as well as a senior fellow at the Institute, offering the
 book excerpt Diversity Explosion by william h. frey RRegular readers of the Milken Institute Review are familiar with the byline of the eminent demographer Bill Frey. He s a frequent contributor to the
U.S. Immigration Policy
 U.S. Immigration Policy Potential Impact on CRE September 2017 Introduction U.S. Immigration Policy Potential Impact on CRE SIGNIFICANT OVERHAUL OF IMMIGRATION LEGISLATION PROPOSED In early August, the
PORTLAND IN FOCUS: A Profile from Census 2000
 PORTLAND IN FOCUS: A PROFILE FROM CENSUS 2000 Living Cities: The National Community Development Initiative PORTLAND IN FOCUS: A Profile from Census 2000 T he Brookings Institution Center on Urban and Metropolitan
DETROIT IN FOCUS: A Profile from Census 2000
 DETROIT IN FOCUS: A PROFILE FROM CENSUS 2000 Living Cities: The National Community Development Initiative DETROIT IN FOCUS: A Profile from Census 2000 T he Brookings Institution Center on Urban and Metropolitan
COMPARATIVE ANALYSIS OF METROPOLITAN CONTEXTS: ANNIE E. CASEY FOUNDATION CITIES
 ANNIE E. CASEY FOUNDATION MAKING CONNECTIONS INITIATIVE COMPARATIVE ANALYSIS OF METROPOLITAN CONTEXTS: ANNIE E. CASEY FOUNDATION CITIES G. Thomas Kingsley and Kathryn L.S. Pettit December 3 THE URBAN INSTITUTE
The Brookings Institution Metropolitan Policy Program Bruce Katz, Director
 The Brookings Institution Metropolitan Policy Program Bruce Katz, Director The Council on Foundations May 8, 2006 Revitalizing Weak Market Cities in the U.S. Revitalizing Weak Market Cities in the U.S.
PATTERNS OF LOCAL SEGREGATION: DO THEY MATTER FOR CRIME? Lauren J. Krivo Reginald A. Byron Department of Sociology Ohio State University
 PATTERNS OF LOCAL SEGREGATION: DO THEY MATTER FOR CRIME? by Lauren J. Krivo Reginald A. Byron Department of Sociology Ohio State University Catherine A. Calder Department of Statistics Ohio State University
Annual Flow Report. of persons who became LPRs in the United States during 2007.
 Annual Flow Report MARCH 008 U.S. Legal Permanent Residents: 007 KELLy JEffERyS AND RANDALL MONGER A legal permanent resident (LPR) or green card recipient is defined by immigration law as a person who
Dynamic Diversity: Projected Changes in U.S. Race and Ethnic Composition 1995 to December 1999
 Dynamic Diversity: Projected Changes in U.S. Race and Ethnic Composition 1995 to 2050 December 1999 DYNAMIC DIVERSITY: PROJECTED CHANGES IN U.S. RACE AND ETHNIC COMPOSITION 1995 TO 2050 The Minority Business
The Brookings Institution Metropolitan Policy Program Robert Puentes, Fellow
 The Brookings Institution Metropolitan Policy Program Robert Puentes, Fellow Good News and Bad News: Westchester County and America s First Suburbs Not-For-Profit Leadership Summit IV Rye, NY May 15, 2006
Online Appendix for The Contribution of National Income Inequality to Regional Economic Divergence
 Online Appendix for The Contribution of National Income Inequality to Regional Economic Divergence APPENDIX 1: Trends in Regional Divergence Measured Using BEA Data on Commuting Zone Per Capita Personal
WYOMING POPULATION DECLINED SLIGHTLY
 FOR IMMEDIATE RELEASE Wednesday, December 19, 2018 Contact: Dr. Wenlin Liu, Chief Economist WYOMING POPULATION DECLINED SLIGHTLY CHEYENNE -- Wyoming s total resident population contracted to 577,737 in
Selected National Demographic Trends
 Selected National Demographic Trends Tawara D. Goode Director, Georgetown University National Center for Cultural Competence Assistant Professor, Center for Child and Human Development Spring 2016 University
April 12, Dear Senator Cochran, Senator Durbin, Congressman Frelinghuysen, and Congressman Visclosky:
 April 12, 2016 The Honorable Thad Cochran Chairman Subcommittee on Defense Senate Committee on Appropriations 122 Dirksen Senate Office Building Washington, DC 20510 The Honorable Rodney Frelinghuysen
IV. Residential Segregation 1
 IV. Residential Segregation 1 Any thorough study of impediments to fair housing choice must include an analysis of where different types of people live. While the description of past and present patterns
Towards a Policy Actionable Analysis of Geographic and Racial Health Disparities
 Towards a Policy Actionable Analysis of Geographic and Racial Health Disparities Institute of Medicine July 30, 2007 Dolores Acevedo-Garcia, PhD, MPA-URP Associate Professor With funding from W. K. Kellogg
COUNCIL OF THE GREAT CITY SCHOOLS 62nd ANNUAL FALL CONFERENCE BUILDING A GENERATION: BLUEPRINTS FOR SUCCESS IN URBAN EDUCATION OCTOBER 24 TO 28, 2018
 62nd ANNUAL FALL CONFERENCE BUILDING A GENERATION: BLUEPRINTS FOR SUCCESS IN URBAN EDUCATION OCTOBER 24 TO 28, 2018 SPONSORSHIP BROCHURE WELCOME TO BALTIMORE BALTIMORE SPONSORSHIP OPPORTUNITIES Wednesday,
FSC-BENEFITED EXPORTS AND JOBS IN 1999: Estimates for Every Congressional District
 FSC-BENEFITED EXPORTS AND JOBS IN 1999: Estimates for Every Congressional District Prepared for National Foreign Trade Council July 2, 2002 National Economic Consulting FSC-BENEFITED EXPORTS AND JOBS IN
Representational Bias in the 2012 Electorate
 Representational Bias in the 2012 Electorate by Vanessa Perez, Ph.D. January 2015 Table of Contents 1 Introduction 3 4 2 Methodology 5 3 Continuing Disparities in the and Voting Populations 6-10 4 National
The New Latinos: Who They Are, Where They Are
 September 10, 2001 The New Latinos: Who They Are, Where They Are John R. Logan, Director Lewis Mumford Center for Comparative Urban and Regional Research University at Albany As the Hispanic population
The Brookings Institution
 Metropolitan Policy Program The Brookings Institution New Housing, Income Inequality, and Distressed Metropolitan Areas Tara Watson 1 Policies that reduce income inequality can help reduce overbuilding
destination Philadelphia Tracking the City's Migration Trends executive summary
 destination Philadelphia October 6, 2010 executive summary An analysis of migration data from the Internal Revenue Service shows that the number of people moving into the city of Philadelphia has increased
Health Disparities in Pediatric Surgery
 Health Disparities in Pediatric Surgery Ala Stanford, MD, FACS, FAAP Cooper Children s Regional Hospital Cooper Medical School of Rowan University The American Academy of Pediatrics 2015 National Conference
SAN ANTONIO IN FOCUS: A Profile from Census 2000
 SAN ANTONIO IN FOCUS: A PROFILE FROM CENSUS 2000 Living Cities: The National Community Development Initiative SAN ANTONIO IN FOCUS: A Profile from Census 2000 T he Brookings Institution Center on Urban
January 17, 2017 Women in State Legislatures 2017
 January 17, 2017 in State Legislatures 2017 Kelly Dittmar, Ph.D. In 2017, 1832 women (1107D, 703R, 4I, 4Prg, 1WFP, 13NP) hold seats in state legislatures, comprising 24.8% of the 7383 members; 442 women
The Brookings Institution
 The Brookings Institution Center on Urban and Metropolitan Policy Alan Berube, Senior Research Analyst Census 2000: Key Trends & Implications for Cities Presentation to the Knight Center for Specialized
Bearing the Brunt: Manufacturing Job Loss in the Great Lakes Region, Howard Wial and Alec Friedhoff. Metropolitan Policy Program
 Metropolitan Policy Program Bearing the Brunt: Manufacturing Job Loss in the Great Lakes Region, 1995 2005 Howard Wial and Alec Friedhoff The Great Lakes states account for a disproportionately large share
Charlotte Community Survey
 Charlotte Community Survey Council Dinner Briefing April 14, 2014 1 Why Survey? To answer 2 questions: How are we doing? How do we know? Based on a simple premise: It is better to know. 2 Outline National
Professor Samuel Walker POLICE ACCOUNTABILITY CONSULTANT. Professor Samuel Walker
 Professor Samuel Walker POLICE ACCOUNTABILITY CONSULTANT 2018 Professor Samuel Walker 402-554-3590 Department of Criminal Justice 402-554-2326 (fax) University of Nebraska at Omaha Omaha, NE 68182-0149
The Brookings Institution Metropolitan Policy Program Robert Puentes, Fellow
 The Brookings Institution Metropolitan Policy Program Robert Puentes, Fellow The Changing Shape of the City Rail-Volution Chicago, IL November 7, 2006 The Changing Shape of the City I What is the context
11.433J / J Real Estate Economics
 MIT OpenCourseWare http://ocw.mit.edu 11.433J / 15.021J Real Estate Economics Fall 2008 For information about citing these materials or our Terms of Use, visit: http://ocw.mit.edu/terms. Week 12: Real
Paths to Citizenship: Data on the eligible-to-naturalize populations in the U.S.
 Paths to Citizenship: Data on the eligible-to-naturalize populations in the U.S. Manuel Pastor Director CSII Thai V. Le Research Assistant CSII Justin Scoggins Data Manager CSII Melissa Rodgers Director
Refugee Resettlement in Small Cities Reports
 The University of Vermont PR3: Refugee Resettlement Trends in the Southeast REPORT Pablo Bose & Lucas Grigri Photo Credit: L. Grigri Published April 2018 in Burlington, VT Refugee Resettlement in Small
INSTITUTE of PUBLIC POLICY
 INSTITUTE of PUBLIC POLICY Harry S Truman School of Public Affairs University of Missouri ANALYSIS OF STATE REVENUES AND EXPENDITURES Andrew Wesemann and Brian Dabson Summary This report analyzes state
Mobility and the Metropolis
 A report from Mobility and the Metropolis How Communities Factor Into Economic Mobility Dec 2013 Project Team Susan K. Urahn, executive vice president Travis Plunkett, senior director Erin Currier Diana
3Demographic Drivers. The State of the Nation s Housing 2007
 3Demographic Drivers The demographic underpinnings of long-run housing demand remain solid. Net household growth should climb from an average 1.26 million annual pace in 1995 25 to 1.46 million in 25 215.
McHenry County and the Next Wave
 McHenry County and the Next Wave McHenry County Council of Governments Increasing Jobs and Fostering Economic Development November 17, 2010 Stephen B. Friedman AICP, CRE, S. B. Friedman & Company with
Summary and Interpretation of the Federal Bureau of Investigation s Uniform Crime Report, 2005
 Research Corporation September 25, 2006 Summary and Interpretation of the Federal Bureau of Investigation s Uniform Crime Report, 2005 Sandra J. Erickson, MFS Research Associate Rosemary J. Erickson, Ph.D.
Sea Level Rise Induced Migration Could Reshape the U.S. Population Landscape
 Sea Level Rise Induced Migration Could Reshape the U.S. Population Landscape Mathew E. Hauer Department of Geography University of Georgia September 23, 2016 SEA LEVEL RISE Sea levels are expected to rise
The Brookings Institution Metropolitan Policy Program Robert Puentes, Fellow
 The Brookings Institution Metropolitan Policy Program Robert Puentes, Fellow A Review of New Urban Demographics and Impacts on Housing National Multi Housing Council Research Forum March 26, 2007 St. Louis,
Herald-Tribune. Sarasota/Bradenton/Venice Market
 Herald-Tribune Sarasota/Bradenton/Venice Market Sarasota/Bradenton/Venice Market Sarasota/Bradenton/Venice is the fifth largest market in the state of Florida. Top 10 Florida Markets Population Miami/Ft
C HAPMAN. Joel Kotkin & Wendell Cox UNIVERSITY PRESS. Special thank you to: Luke Phillips, Research Associate Mandy Shamis, Editor
 by Joel Kotkin & Wendell Cox Special thank you to: Luke Phillips, Research Associate Mandy Shamis, Editor C HAPMAN UNIVERSITY PRESS 2015 BEST CITIES FOR MINORITIES: GAUGING THE ECONOMICS OF OPPORTUNITY
Professor Samuel Walker POLICE ACCOUNTABILITY CONSULTANT. Professor Samuel Walker
 Professor Samuel Walker POLICE ACCOUNTABILITY CONSULTANT 2017 Professor Samuel Walker 402-554-3590 Department of Criminal Justice 402-554-2326 (fax) University of Nebraska at Omaha Omaha, NE 68182-0149
The Youth Vote in 2008 By Emily Hoban Kirby and Kei Kawashima-Ginsberg 1 Updated August 17, 2009
 The Youth Vote in 2008 By Emily Hoban Kirby and Kei Kawashima-Ginsberg 1 Updated August 17, 2009 Estimates from the Census Current Population Survey November Supplement suggest that the voter turnout rate
SMART GROWTH, IMMIGRANT INTEGRATION AND SUSTAINABLE DEVELOPMENT
 SMART GROWTH, IMMIGRANT INTEGRATION AND SUSTAINABLE DEVELOPMENT Manuel Pastor 02/04/2012 U.S. Decadal Growth Rates for Population by Race/Ethnicity, 1980-2010 1980-1990 1990-2000 2000-2010 96.3% 57.9%
SPECIAL FOCUS The Facts
 Vol. 28, No. 4 april 2011 SPECIAL FOCUS The Facts In Carder, airline pilots who were members of the Reserves and National Guard pursued a class action against Continental Airlines, asserting management
Dividing America? the role of 'division streets' in residential segregation
 University of Central Florida HIM 1990-2015 Open Access Dividing America? the role of 'division streets' in residential segregation 2012 Kate Griffin University of Central Florida Find similar works at:
CBRE CAPITAL MARKETS CBRE 2017 MULTIFAMILY CONFERENCE BEYOND THE CYCLE
 CBRE CAPITAL MARKETS CBRE 2017 MULTIFAMILY CONFERENCE BEYOND THE CYCLE INVESTING IN GOOD GROWTH: FINDING DEMAND IN ALL THE RIGHT PLACES JEFF ADLER Vice President, Yardi Matrix JEANETTE RICE Americas Head
We re Paying Dearly for Bush s Tax Cuts Study Shows Burdens by State from Bush s $87-Billion-Every-51-Days Borrowing Binge
 Citizens for Tax Justice 202-626-3780 September 23, 2003 (9 pp.) Contact: Bob McIntyre We re Paying Dearly for Bush s Tax Cuts Study Shows Burdens by State from Bush s $87-Billion-Every-51-Days Borrowing