Are Republicans Sprawlers and Democrats New Urbanists? Comparing 83 Sprawling Regions with the 2004 Presidential Vote
|
|
|
- Dulcie Lester
- 5 years ago
- Views:
Transcription


1 Are Republicans Sprawlers and Democrats New Urbanists? Comparing 83 Sprawling Regions with the 2004 Presidential Vote Stephen L. Sperry Associate Professor Clemson University College of Architecture, Arts and Humanities Department of Planning and Landscape Architecture Clemson, South Carolina, USA
2 Introduction Show a General Method for Constructing Density- Equalizing Vote Display Examine the Relationship Between Sprawl Development and the Election Winner by County and Sprawl Region USDA urban/rural codes Compared the 83 most sprawling regions As defined by Measuring Sprawl and Its Impact Quantitative Analysis of How Population Relates to Political Ties 2
3 Media and Academic Response to the Election Before 2000 Rarely Heard the Terms Blue States or Red States Started with the 2000 election Used over 2500 times in the media in 2003 (Numberg, 2005) Became a standard in today s reporting Media Wants to Typecast or Use Simple Explanations Compartmentalize the analysis Academics Used Stereotype Analysis Republicans are sprawlers or The Republican party s base is primarily exurbia or rural 3


4 Characteristics of Sprawl Unlimited Outward Expansion of Development Low Density Residential and Commercial Settlements Widespread Strip Commercial Development Leapfrogging Development Dominance of the Private Automobiles for Transportation Source: Robert Burchell, The Costs of Sprawl-Revisited. Transportation Cooperative Research Program Report 39, Washington, D.C.: National Academy Press. 4


5 New Urbanism New Urbanism Respects Traditional Urban Form and Is Defined by Principles Opposite of Sprawl: Denser development, walkable neighborhoods, mixed land use, community involvement and alternative transportation 5
6 So Where Were the Votes? Los Angeles County Was the Largest Concentration of Bush Votes with 954,764 votes All the surrounding counties went to Bush Cook County was Bush s second highest concentration with 580,553 votes Kerry received over 700,000 more votes in each county Kerry Lost Dallas by Less Than 10,000 votes All the surrounding counties went for Bush In Houston Kerry received over 470,000 votes for his 6 th largest total Came within 100,000 votes of Bush Are We Politically Segregated? 6

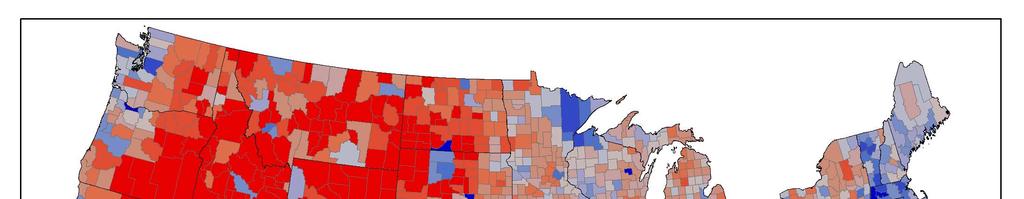
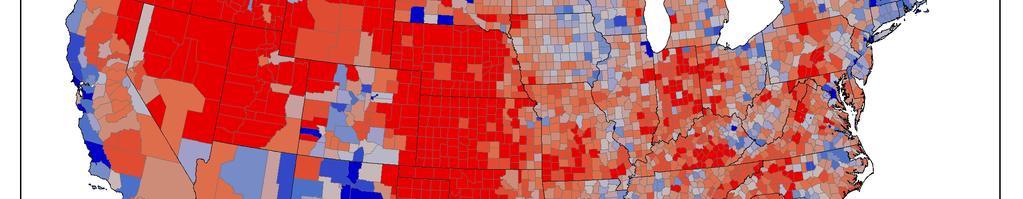
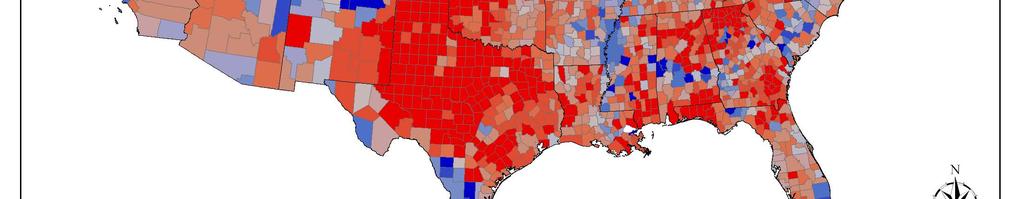
7 Election Maps The Sea of Red The Typical Election Chloropleth Map Does Not Reflect True Voting Patterns States are unequal in area Gives a false impression of Bush s vote distributions Over 60% of the states 53% of the electoral vote 51% of the popular vote So What Is the Best Map to Show the Voting Distribution? Source: Source: the Associated Press, ESRI Inc. USATODAY analysis by Paul Overberg Source Robert Vanderbi, Princeton University 7
8 Issues with the Color Ramps and Densities Solid Colors Do Not Reflect Vote Distribution in a County Shades of Purple Are Difficult To Read Warm and Cool Grays Are Easier to Understand Closer to the center the color ramp are shades of gray Warm gray for Bush Cool gray for Kerry How Can We Show Where the People Are? Clark County population verses county size 8
9 9
10 10
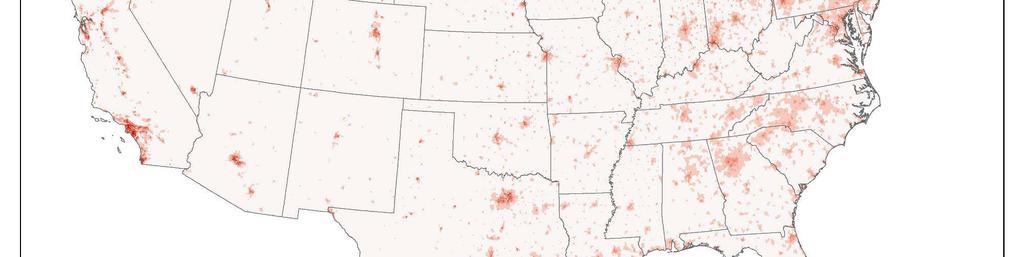
11 Population and Votes Merged Population Density by Census Tracts with Bush s Voting Percentage Shows where the concentrations of the voters actually occurred Classification Centers on Base Data of Less Than two People per Square Mile Highest population centers is approximately 9,000 for Bush and 90,000 for Kerry The Resulting Map Shows Spatially Accurate Voting Density 11
12 12
13 Sprawl Analysis The Vote s Spatial Distribution Between 2000 and 2004, There Was a Net Shift of Nearly 4 Million Votes for Bush (USA Today, 2004) Used the Rural-Urban Continuum Codes Developed by Calvin Beale of the USDA's Economic Research Service (USDA, 2003) A classification scheme that categorizes metropolitan counties by size Non-metropolitan counties classified by degree of urbanization and proximity to metro areas Also Compared the Vote in Ewing s et al Top 83 Sprawling Regions (Ewing, 2003) 13
14 Urban/Rural Codes and Sprawl Regions 14
15 National Metropolitan Vote Analysis Number of Counties Bush Votes Kerry Votes Nader Votes Bush Margin Bush Percentage Percent of Bush's Total Vote Percent of Kerry's Total Vote Percent of Total Vote Code Description Metro counties: 1 Counties in metro areas of 1 million population or more ,736,596 31,816, ,972 (4,080,101) 46.4% 46.5% 56.7% 51.4% 2 Counties in metro areas of 250,000 to 1 million population ,450,410 10,924,349 87,780 1,526, % 20.9% 19.5% 20.2% 3 Counties in metro areas of fewer than 250,000 population 351 6,934,487 4,979,517 47,440 1,954, % 11.6% 8.9% 10.3% Nonmetro counties: 4 Urban population of 20,000 or more, adjacent to a metro area 218 3,607,318 2,522,126 22,918 1,085, % 6.0% 4.5% 5.3% 5 Urban population of 20,000 or more, not adjacent to a metro area 105 1,336, ,734 11, , % 2.2% 1.7% 2.0% 6 Urban population of 2,500 to 19,999, adjacent to a metro area 609 3,837,788 2,500,736 23,150 1,337, % 6.4% 4.5% 5.5% 7 Urban population of 2,500 to 19,999, not adjacent to a metro area 450 2,162,112 1,408,603 16, , % 3.6% 2.5% 3.1% 8 Completely rural or less than 2,500 urban population, adjacent to a metro area , ,055 4, , % 1.1% 0.8% 1.0% 9 Completely rural or less than 2,500 urban population, not adjacent to a metro area , ,950 10, , % 1.6% 1.0% 1.3% - Total/Average 3,141 59,696,762 56,137, ,832 3,558, % 100.0% 100.0% 100.0% 15
16 Voting Comparison The Top Three Categories Accounted for 82% of the Nation Vote Bush received 79% and Kerry got 85% of their total votes Kerry had nearly a 600,000 vote margin Except in the most urban category, Bush won the other eight codes His vote margin percentage increased as a category became more rural from 46.5% to 62.8% The Republican Concentration Is in the Urban Areas of Less Than One Million People Accounted for 79% of Bush s vote margin Bush Received Nearly 33% of his net Vote Gain From the Mediumsized Metro Areas and Counties in the Metro Area with Less Than 250,000 Bush received over 3,500,000 more votes than Kerry. Except for the Most Urban Concentration, Both Candidate's Vote Percentage Were With 2 % of Each Other Showing that both candidates can attract votes in every urban-rural codes 16
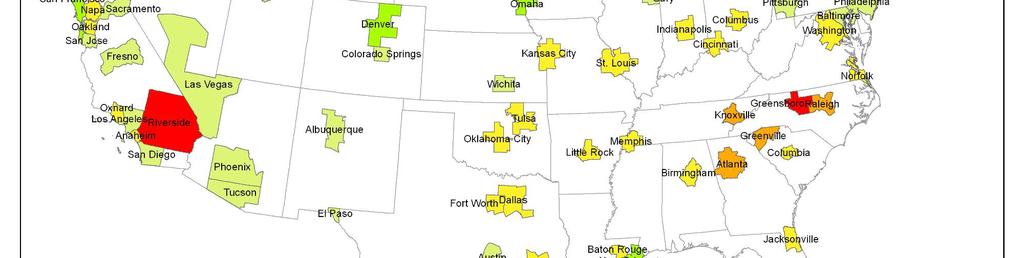
17 Measuring Sprawl and Its Impacts (Ewing, 2003) Investigated 22 Measures Sprawl Index Was Defined by Four Factors: Residential density; Neighborhood mix of homes, jobs, and services; Strength of centers, such as business districts; and Accessibility by the street network. The Study Was Limited to 83 Regions Original 101 regions Because of metro comparability for the four factors Missing Charlotte, NC; Nashville, TN; Louisville, KY and Richmond, VA 17
18 18
19 19
20 Sprawl Regions Vote Analysis Number of Counties 2000 Population Population Per Square Mile Nader Votes Bush Margin Bush Percentage Percent of Bush's Total Vote Percent of Kerry's Total Vote Code Description Total Area Bush Votes Kerry Votes Metro counties: 1 Counties in metro areas of 1 million population or more , ,389, ,949,259 30,529, ,083 (4,580,275) 45.8% 81.1% 84.6% 82.9% 2 Counties in metro areas of 250,000 to 1 million population 88 78,021 24,105, ,108,793 4,871,816 42, , % 16.0% 13.5% 14.7% 3 Counties in metro areas of fewer than 250,000 population 16 13,507 2,469, , ,878 5, , % 1.9% 1.4% 1.6% Nonmetro counties: 4 Urban population of 20,000 or more, adjacent to a metro area 14 21,377 1,176, , ,492 2, , % 0.9% 0.5% 0.7% 5 Urban population of 20,000 or more, not adjacent to a metro area 0.0% 0.0% 0.0% 6 Urban population of 2,500 to 19,999, adjacent to a metro area 3 18,799 87, ,678 17, , % 0.1% 0.0% 0.1% 7 Urban population of 2,500 to 19,999, not adjacent to a metro area 0.0% 0.0% 0.0% 8 Completely rural or less than 2,500 urban population, adjacent to a metro area , ,144 2,739-2, % 0.0% 0.0% 0.0% 9 Completely rural or less than 2,500 urban population, not adjacent to a metro area 0.0% 0.0% 0.0% - Total/Average , ,246, ,002,662 36,104, ,748 (4,102,044) 46.8% 100.0% 100.0% 100.0% Percent of Total Vote 20
21 Top 83 Sprawl Regions Accounts for Over 50% of the Nation s Population Top Three Urban-Rural Categories Accounted for Over 98% of the Vote for Each Candidate in These Regions Kerry Won the Most Sprawling Regions In The Country In the top three categories, Kerry s margin was over 4,200,000 votes Bush carried five of the six categories but with closer margins than the country vote outside the sprawl regions In Fringe or Exurban Counties of These Regions, Bush Improved his Winning Margin These exurban areas contain far fewer people than the central counties Bush received only 8% of his vote from these counties 21
22 22
23 23
24 Sprawl Regions by Sprawl Index & Bush s Vote Margin 300, ,000 Fort Worth - Atlanta, Arlington, GA TX Dallas, TX PMSA Oklahoma City, OK MSA Houston, TX PMSA Cincinnati, OH - KY - IN PMSA Anaheim Santa Ana, CA PMSA Salt Lake City - Ogden, UT MSA Phoenix, AZ MSA Colorado Springs, CO MSA Omaha, NE - IA MSA Bush's Vote Margin (100,000) (300,000) (500,000) (700,000) West Palm Beach Boca Raton Delray Beach, FL MSA Detroit, MI PMSA Cleveland, OH PMSA Washington, DC MD VA MSA Los Angeles Long Beach, CA PMSA Fort Lauderdale Hollywood - Pompano Beach, FL Portland, OR PMSA Philadelphia, PA NJ PMSA Chicago, IL PMSA Boston - Lawrence - Salem - Lowell - Brockton, MA (900,000) (1,100,000) New York, NY PMSA (1,300,000) Most Sprawling Regions Least Sprawling Regions 24
25 Voting Summary Table 4: Candidate Win Summary for 83 Sprawling Metropolitan Regions Metropolitan Region Mean Sprawl Index Regions Counties Bush Counties Bush % Bush Kerry Nader Total Votes Bush Margin Bush % Bush Region Wins % 13,700,922 10,153,334 49,723 23,903,979 3,547, % Kerry Region Wins % 18,301,740 25,951, ,025 44,430,137 (7,649,632) 41.4% Totals % 32,002,662 36,104, ,748 68,334,116 (4,102,044) 47.0% Table 5: Voting Analysis Summary for 83 Sprawling Metropolitan Regions Metropolitan Region Regions Overall Sprawl Score Counties Bush Counties Bush Kerry Nader Bush Margin Bush % Top15 Regions ,404,837 7,767,517 74,690 (2,362,680) 41.0% Middle 53 Regions ,810,427 23,048, ,676 (2,238,406) 47.4% Bottom 15 Regions ,787,398 5,288,356 26, , % Total ,002,662 36,104, ,748 (4,102,044) 46.8% Table 6: National Voting Analysis Summary Metropolitan Region Counties Bush Counties Total Votes Percent Bush Kerry Nader Bush Margin Bush % Kerry 60% Margin ,834, % 7,560,232 16,200,549 73,607 (8,713,924) 31.7% Middle Votes ,006, % 30,338,260 29,426, , , % Bush 60% Margin ,475, % 21,825,034 10,557,941 92,430 11,174, % Total ,315, % 59,723,526 56,185, ,043 3,131, % 25
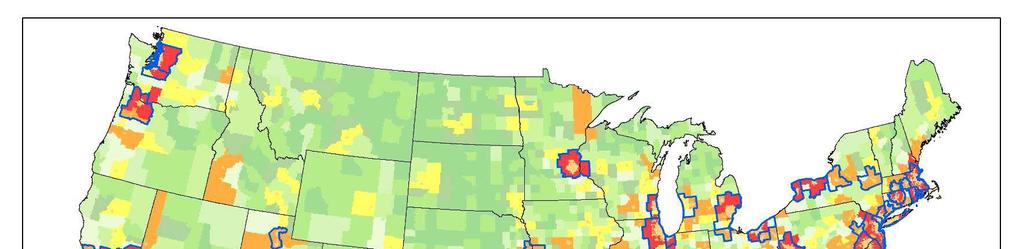
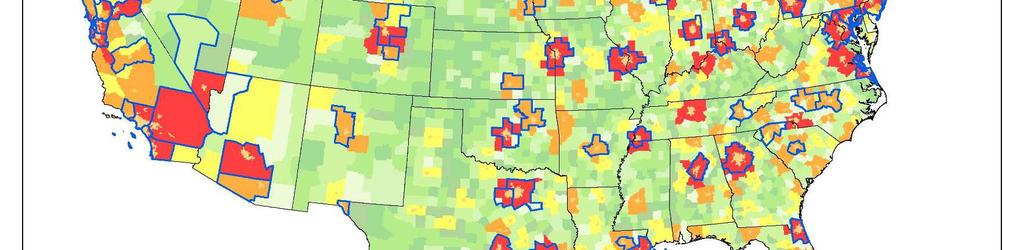
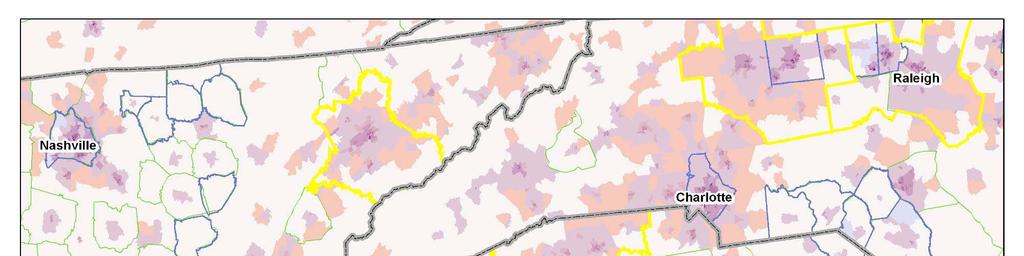
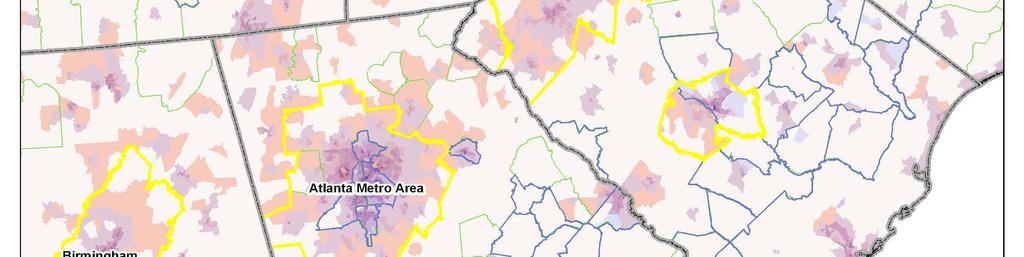
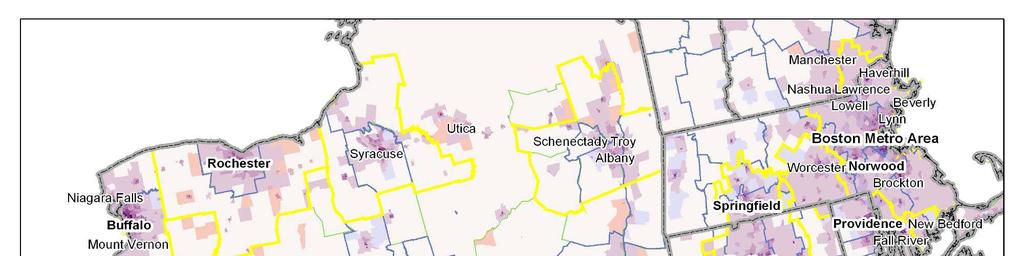
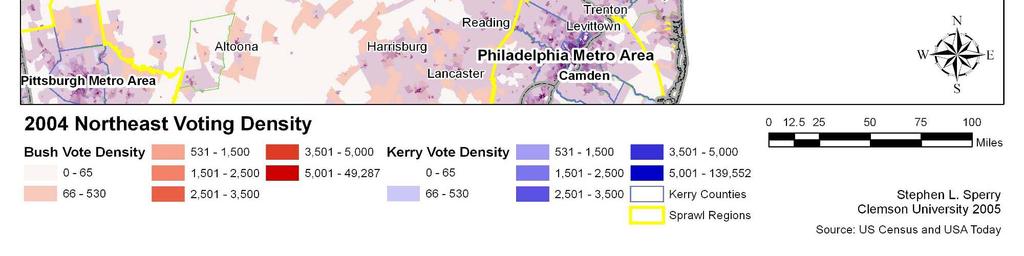
26 Where are the Votes? Mapped Each Party s Vote Density Separately The seven vote density classes were based on quantile breaks of the Republican vote and were rounded The Democratic vote used the same class breaks The difference is that the density range is higher in the last Democratic class 139,552 verses 49,287 The Vote Distributions Are Similar Between the Parties The Republicans spread out further from the urban cores then Democrats The Exception Is the Southern Republican Concentration of Votes Expanding From the Appalachian Mountain Region With its small cities and expanding to the more metropolitan areas of North Carolina, Tennessee, South Carolina, Georgia and Alabama. 26
27 27
28 28
29 29
30 30
31 Vote Concentrations Shades of Purple As Robert Vanderbi Says We Are Shades of Purple Urban Centers Are the Primarily Democratic Base However there are significant Republican concentrations Smaller Cities and Suburban Centers Are the Republican Base There are significant Democratic concentrations The Exurban Fringe Are Ripe Republican Camps New growth areas The exception is in the Northeast 31
32 Population Density by Urban/Rural Code Code Bush Pop Density Kerry Pop Density Approximate Ratio , : : : : : : : :2 32
33 Conclusion Are Republican Sprawlers? The Answer is Yes and No Exurbia, the fringe and less dense counties of large metropolitan areas, contributed 8% of Bush's vote Remember how many votes he received in Los Angeles and Chicago Are Democrats New Urbanists? The Answer is the Same The Democratic concentration is in the older and most urban areas They are within one to two percentage points of the Republicans distribution in the other categories Bush's Victory Was Attributable to Modest, but Broadbased Gains Across Every Region of The Country Including the cities Comparing the Republican and Democratic Vote Density The Country Is Not Polarized Into Two Camps 33
Are Republicans Sprawlers and Democrats New Urbanists? Understanding the Spatial Analysis of the 2004 Presidential Vote
 Are Republicans Sprawlers and Democrats New Urbanists? Understanding the Spatial Analysis of the 2004 Presidential Vote Stephen L. Sperry Associate Professor Clemson University Abstract After the 2004
Independent and Third-Party Municipal Candidates. City Council Election Reform Task Force April 8, :00 p.m.
 Independent and Third-Party Municipal Candidates City Council Election Reform Task Force April 8, 2010 2:00 p.m. 28 of the 32 cities surveyed, or 88%, have non-partisan elections, so they do not have special
Megapolitan America. Luck Stone Corporation
 Megapolitan America Luck Stone Corporation Historical World Population Growth World population continually increases. With current world population over 6 billion (6,590,514,881 and counting) people, there
Immigrant Incorporation and Local Responses
 Audrey Singer Senior Fellow Immigrant Incorporation and Local Responses American Sociological Association San Francisco, CA August 9, 2009 Questions --- Exploration How do we evaluate recent state and
Silence of the Innocents: Illegal Immigrants Underreporting of Crime and their Victimization
 Silence of the Innocents: Illegal Immigrants Underreporting of Crime and their Victimization Stefano Comino, 1 Giovanni Mastrobuoni, 2 Antonio Nicolò 3 1 University of Udine, 2 University of Essex, 3 University
New Home Affordability Trends. February 23, 2018
 New Home Affordability Trends February 23, 2018 1 Regional Director Territories Territory Experts Todd Britsch WA, OR Mark Gianopulos IA, IL, IN, MI, MN, MO, ND, OH, SD, WI Quita Syhapanya ME, NH, VT,
SPECIAL EDITION 11/6/14
 SPECIAL EDITION 11/6/14 The document below will provide insights on what the new Senate Majority means, as well as a nationwide view of House, Senate and Gubernatorial election results. We will continue
Cities, Suburbs, Neighborhoods, and Schools: How We Abandon Our Children
 Cities, Suburbs, Neighborhoods, and Schools: How We Abandon Our Children Paul A. Jargowsky, Director Center for Urban Research and Education May 2, 2014 Dimensions of Poverty First and foremost poverty
The Brookings Institution
 The Brookings Institution Center on Urban and Metropolitan Policy Bruce Katz, Director Census 2000: Key Trends & Implications for Cities Macalester College September 8, 2003 Overview I. II. III. About
Racial and Ethnic Separation in the Neighborhoods: Progress at a Standstill
 Sponsored by American Communities Project Russell Sage Foundation us2010 discover america in a new century Racial and Ethnic Separation in the Neighborhoods: Progress at a Standstill John R. Logan (Brown
STATISTICAL GRAPHICS FOR VISUALIZING DATA
 STATISTICAL GRAPHICS FOR VISUALIZING DATA Tables and Figures, I William G. Jacoby Michigan State University and ICPSR University of Illinois at Chicago October 14-15, 21 http://polisci.msu.edu/jacoby/uic/graphics
The New Metropolitan Geography of U.S. Immigration
 The Brookings Institution Metropolitan Policy Program Audrey Singer, Immigration Fellow The New Metropolitan Geography of U.S. Immigration Mayors Institute on City Design Rethinking Neighborhoods for Immigrants
Twenty-first Century Gateways: Immigrant Incorporation in Suburban America
 Audrey Singer, Immigration Fellow Twenty-first Century Gateways: Immigrant Incorporation in Suburban America Annual meeting of the Association of American Geographers April 18, 2007 New metropolitan geography
Electing a President. The Electoral College
 Electing a President The Electoral College The Original Electoral College System Compromise between allowing Congress to choose a chief executive and direct popular election -Allowing Congress goes against
The New Geography of Immigration and Local Policy Responses
 1 Audrey Singer Senior Fellow The New Geography of Immigration and Local Policy Responses Brookings Mountain West University of Nevada Las Vegas 2 March 9, 2010 The New Geography of Immigration and Policy
By 1970 immigrants from the Americas, Africa, and Asia far outnumbered those from Europe. CANADIAN UNITED STATES CUBAN MEXICAN
 In Search of the American Dream After World War II, millions of immigrants and citizens sought better lives in the United States. More and more immigrants came from Latin America and Asia. Between 940
a rising tide? The changing demographics on our ballots
 a rising tide? The changing demographics on our ballots OCTOBER 2018 Against the backdrop of unprecedented political turmoil, we calculated the real state of the union. For more than half a decade, we
2016 us election results
 1 of 6 11/12/2016 7:35 PM 2016 us election results All News Images Videos Shopping More Search tools About 243,000,000 results (0.86 seconds) 2 WA OR NV CA AK MT ID WY UT CO AZ NM ND MN SD WI NY MI NE
ELECTORAL COLLEGE AND BACKGROUND INFO
 ELECTORAL COLLEGE AND BACKGROUND INFO 1. Go to www.270towin.com and select the year 2000 2. How many total popular votes did George W. Bush receive? Al Gore? 3. How many total electoral votes did George
The New Geography of Immigration and Local Policy Responses
 1 Audrey Singer Senior Fellow The New Geography of Immigration and Local Policy Responses Brookings Mountain West University of Nevada Las Vegas 2 March 9, 2010 The New Geography of Immigration and Policy
Trump, Populism and the Economy
 Libby Cantrill, CFA October 2016 Trump, Populism and the Economy This material contains the current opinions of the manager and such opinions are subject to change without notice. This material has been
Migration Patterns in New Gateways of Texas The Innerburbs
 A resident of Wooten Park, Veronica moved from Ft. Worth to Austin to be close to friends and family. Migration Patterns in New Gateways of Texas The Innerburbs Pamela A. Rogers, Ph.D. Low-Income Housing
Mrs. Yuen s Final Exam. Study Packet. your Final Exam will be held on. Part 1: Fifty States and Capitals (100 points)
") Mrs. Yuen s Final Exam Study Packet your Final Exam will be held on All make up assignments must be turned in by YOUR finals day!!!! Part 1: Fifty States and Capitals (100 points) Be able to identify the
Mrs. Yuen s Final Exam Study Packet your Final Exam will be held on All make up assignments must be turned in by YOUR finals day!!!! Part 1: Fifty States and Capitals (100 points) Be able to identify the
A Dead Heat and the Electoral College
 A Dead Heat and the Electoral College Robert S. Erikson Department of Political Science Columbia University rse14@columbia.edu Karl Sigman Department of Industrial Engineering and Operations Research sigman@ieor.columbia.edu
The New U.S. Demographics
 The Brookings Institution Center on Urban and Metropolitan Policy The New U.S. Demographics Audrey Singer Funders Network on Population, Reproductive Health and Rights November 10, 2003 QUESTIONS How has
INSTITUTE of PUBLIC POLICY
 INSTITUTE of PUBLIC POLICY Harry S Truman School of Public Affairs University of Missouri ANALYSIS OF STATE REVENUES AND EXPENDITURES Andrew Wesemann and Brian Dabson Summary This report analyzes state
Gannett. December 2017
 Gannett December 2017 Gannett at a Glance LTM Revenue: $3.1BN LTM Digital Revenue: $981M LTM Adj. EBITDA: $357MM Market Cap: $1.3BN High Quality Trusted Content at Scale 109 Markets 160+ Brands and Magazines
Overview of Boston s Population. Boston Redevelopment Authority Research Division Alvaro Lima, Director of Research September
 Overview of Boston s Population Boston Redevelopment Authority Research Division Alvaro Lima, Director of Research September - 2011 Historic Trends Boston s Population Boston reached its population peak
16% Share of population that is foreign born, 100 largest metro areas, 2008
 Audrey Singer III. IMMIGRATION By the numbers 16% Share of population that is foreign born, 100 largest metro areas, 2008 1.13 Ratio of immigrants with college degrees to those without high school diplomas,
Epicenter Cities and International Education 17th AIEC Melbourne, Victoria Australia
 Epicenter Cities and International Education 17th AIEC Melbourne, Victoria Australia Thursday, 23 October 2003 Todd Davis, Ph.D. Senior Scholar Institute of International Education The idea of the global
Population Change and Crime Change
 University of Nebraska at Omaha DigitalCommons@UNO Publications Archives, 1963-2000 Center for Public Affairs Research 5-1982 Population Change and Crime Change Deborah Caulfield University of Nebraska
Presented by: Ted Bornstein, Dennis Cardoza and Scott Klug
 1 Attorney Advertising Prior results do not guarantee a similar outcome Models used are not clients but may be representative of clients 321 N. Clark Street, Suite 2800,Chicago, IL 60654 312.832.4500 2
Sea Level Rise Induced Migration Could Reshape the U.S. Population Landscape
 Sea Level Rise Induced Migration Could Reshape the U.S. Population Landscape Mathew E. Hauer Department of Geography University of Georgia September 23, 2016 SEA LEVEL RISE Sea levels are expected to rise
January 17, 2017 Women in State Legislatures 2017
 January 17, 2017 in State Legislatures 2017 Kelly Dittmar, Ph.D. In 2017, 1832 women (1107D, 703R, 4I, 4Prg, 1WFP, 13NP) hold seats in state legislatures, comprising 24.8% of the 7383 members; 442 women
Now is the time to pay attention
 Census & Redistricting : Now is the time to pay attention By Kimball Brace, President Election Data Services, Inc. Definitions Reapportionment Allocation of districts to an area Example: Congressional
The Brookings Institution Metropolitan Policy Program Alan Berube, Fellow
 The Brookings Institution Metropolitan Policy Program Alan Berube, Fellow Confronting Concentrated Poverty in Fresno Fresno Works for Better Health September 6, 2006 Confronting Concentrated Poverty in
Congressional Districts Potentially Affected by Shipments to Yucca Mountain, Nevada
 2015 Congressional Districts Potentially Affected by Shipments to Yucca Mountain, Nevada Fred Dilger PhD. Black Mountain Research 10/21/2015 Background On June 16 2008, the Department of Energy (DOE) released
Research Brief. Resegregation in Southern Politics? Introduction. Research Empowerment Engagement. November 2011
 Research Brief Resegregation in Southern Politics? David A. Bositis, Ph.D. November 2011 Civic Engagement and Governance Institute Research Empowerment Engagement Introduction Following the election of
Graduation and Retention Rates of Nonresidents by State
 Graduation and Retention Rates of Nonresidents by State March 2011 Highlights: California, Illinois, and Texas are the states with the largest numbers of nonresidents. Students from Ohio and Wyoming persist
Geek s Guide, Election 2012 by Prof. Sam Wang, Princeton University Princeton Election Consortium
 Geek s Guide, Election 2012 by Prof. Sam Wang, Princeton University Princeton Election Consortium http://election.princeton.edu This document presents a) Key states to watch early in the evening; b) Ways
Commuting in America 2013
 Commuting in America 2013 The National Report on Commuting Patterns and Trends Brief 4. Population and Worker Dynamics September 2013 About the AASHTO Census Transportation Planning Products Program Established
Key Factors That Shaped 2018 And A Brief Look Ahead
 Key Factors That Shaped 2018 And A Brief Look Ahead November 2018 Bill McInturff SLIDE 1 Yes, it was all about Trump. SLIDE 2 A midterm record said their vote was a message of support or opposition to
The New Latinos: Who They Are, Where They Are
 September 10, 2001 The New Latinos: Who They Are, Where They Are John R. Logan, Director Lewis Mumford Center for Comparative Urban and Regional Research University at Albany As the Hispanic population
OCT 13, 2011 COMMUTING IN THE 21 ST CENTURY
 METRO BOARD OF DIRECTORS OCT 13, 2011 COMMUTING IN THE 21 ST CENTURY WHERE WE RE AT SOME BASICS ABOUT CURRENT NATIONAL COMMUTING BEHAVIOR COMMUTING & TRANSPORTATION ALL TRANSPORT COMMUTING S ROLE COMMUTING
ELECTION UPDATE Tom Davis
 ELECTION UPDATE Tom Davis Polarization The Ideological sorting of the parties 1. Redistricting Residential Sorting Voting Rights Act Gerrymandering 2. Media Business Models Cable News Talk Radio Internet
UNIFORM NOTICE OF REGULATION A TIER 2 OFFERING Pursuant to Section 18(b)(3), (b)(4), and/or (c)(2) of the Securities Act of 1933
(3), (b)(4), and/or (c)(2) of the Securities Act of 1933") Item 1. Issuer s Identity UNIFORM NOTICE OF REGULATION A TIER 2 OFFERING Pursuant to Section 18(b)(3), (b)(4), and/or (c)(2) of the Securities Act of 1933 Name of Issuer Previous Name(s) None Entity Type
Item 1. Issuer s Identity UNIFORM NOTICE OF REGULATION A TIER 2 OFFERING Pursuant to Section 18(b)(3), (b)(4), and/or (c)(2) of the Securities Act of 1933 Name of Issuer Previous Name(s) None Entity Type
The Effect of Electoral Geography on Competitive Elections and Partisan Gerrymandering
 The Effect of Electoral Geography on Competitive Elections and Partisan Gerrymandering Jowei Chen University of Michigan jowei@umich.edu http://www.umich.edu/~jowei November 12, 2012 Abstract: How does
dcollege investigation. My dstuden students prior knowl-
 mathematical explorations classroom-ready activities The Electoral College Kimberly A. Markworth and Lara M. Willox Edited by gwen Johnson, gwendolyn.johnson@unt.edu, University of North Texas, Dallas,
NATIONAL VOTER SURVEY. November 30 December 3, 2017 N = 1,200 respondents (1/3 Landline, 1/3 Cell, 1/3 Internet) margin of error: +/- 2.
 margin of error: +/- 2.") NATIONAL VOTER SURVEY N = 1,200 respondents (1/3 Landline, 1/3 Cell, 1/3 Internet) margin of error: +/- 2.83% 1 For reference: the 2018 map. When we refer to competitive 2018 Senate states, we are referring
NATIONAL VOTER SURVEY N = 1,200 respondents (1/3 Landline, 1/3 Cell, 1/3 Internet) margin of error: +/- 2.83% 1 For reference: the 2018 map. When we refer to competitive 2018 Senate states, we are referring
SMART GROWTH, IMMIGRANT INTEGRATION AND SUSTAINABLE DEVELOPMENT
 SMART GROWTH, IMMIGRANT INTEGRATION AND SUSTAINABLE DEVELOPMENT Manuel Pastor 02/04/2012 U.S. Decadal Growth Rates for Population by Race/Ethnicity, 1980-2010 1980-1990 1990-2000 2000-2010 96.3% 57.9%
CODEBOOK/TOPLINES AP SURVEY OF UNDECIDED VOTERS September 21-28, ,329 likely undecided voters
 CODEBOOK/TOPLINES AP SURVEY OF UNDECIDED VOTERS September 21-28, 2004 1,329 likely undecided voters RESUME Interview Type 0 Not a resumed interview (duration less than 100 minutes) 1 Resumed interview
Geography of Homelessness, Part 4: Examining Urban Homelessness
 Geography of ness, Part 4: Examining ness While homelessness exists in all places, a majority of people experiencing homelessness are experiencing it in urban areas. Approximately 77 percent of the U.S.
Representational Bias in the 2012 Electorate
 Representational Bias in the 2012 Electorate by Vanessa Perez, Ph.D. January 2015 Table of Contents 1 Introduction 3 4 2 Methodology 5 3 Continuing Disparities in the and Voting Populations 6-10 4 National
Some Change in Apportionment Allocations With New 2017 Census Estimates; But Greater Change Likely by 2020
 FOR IMMEDIATE RELEASE Date: December 26, 2017 Contact: Kimball W. Brace 6171 Emerywood Court Manassas, Virginia 20112 202 789.2004 tel. or 703 580.7267 703 580.6258 fax Info@electiondataservices.com Tel.:
African Immigrants in Metropolitan Washington A Demographic Overview
 The Brookings Institution Center on Urban and Metropolitan Policy African Immigrants in Metropolitan Washington A Demographic Overview Jill H.Wilson African Immigrants and Refugees Foundation Conference
Unsuccessful Provisional Voting in the 2008 General Election David C. Kimball and Edward B. Foley
 Unsuccessful Provisional Voting in the 2008 General Election David C. Kimball and Edward B. Foley The 2002 Help America Vote Act (HAVA) required most states to adopt or expand procedures for provisional
If you have questions, please or call
 SCCE's 17th Annual Compliance & Ethics Institute: CLE Approvals By State The SCCE submitted sessions deemed eligible for general CLE credits and legal ethics CLE credits to most states with CLE requirements
BENCHMARKING REPORT - VANCOUVER
 BENCHMARKING REPORT - VANCOUVER I. INTRODUCTION We conducted an international benchmarking analysis for the members of the Consider Canada City Alliance Inc., consisting of 11 (C11) large Canadian cities
Alissa A. Horvitz Member Attorney
 Alissa A. Horvitz Member Attorney Speaking Engagements December 13, 2018 December 7, 2018 How to Prepare for OFCCP Manager Interviews New Jersey Industry Liaison Group Meeting Pittsburgh Industry Liaison
Paths to Citizenship: Data on the eligible-to-naturalize populations in the U.S.
 Paths to Citizenship: Data on the eligible-to-naturalize populations in the U.S. Manuel Pastor Director CSII Thai V. Le Research Assistant CSII Justin Scoggins Data Manager CSII Melissa Rodgers Director
Bringing Vitality to Main Street How Immigrant Small Businesses Help Local Economies Grow
 Bringing Vitality to Main Street How Immigrant Small Businesses Help Local Economies Grow A report of the Fiscal Policy Institute and Americas Society/Council of the Americas Cities with Declining Population
Candidate Faces and Election Outcomes: Is the Face-Vote Correlation Caused by Candidate Selection? Corrigendum
 Quarterly Journal of Political Science, 2010, 5: 99 105 Corrigendum Candidate Faces and Election Outcomes: Is the Face-Vote Correlation Caused by Candidate Selection? Corrigendum Matthew D. Atkinson, Ryan
Some Change in Apportionment Allocations With New 2017 Census Estimates; But Greater Change Likely by 2020
 FOR IMMEDIATE RELEASE Date: December 20, 2017 Contact: Kimball W. Brace 6171 Emerywood Court Manassas, Virginia 20112 202 789.2004 tel. or 703 580.7267 703 580.6258 fax Info@electiondataservices.com Tel.:
New Population Estimates Show Slight Changes For 2010 Congressional Apportionment, With A Number of States Sitting Close to the Edge
 67 Emerywood Court Manassas, Virginia 202 202 789.2004 tel. or 703 580.7267 703 580.6258 fax Info@electiondataservices.com EMBARGOED UNTIL 6:0 P.M. EST, SUNDAY, SEPTEMBER 26, 200 Date: September 26, 200
Children of Immigrants
 L O W - I N C O M E W O R K I N G F A M I L I E S I N I T I A T I V E Children of Immigrants 2013 State Trends Update Tyler Woods, Devlin Hanson, Shane Saxton, and Margaret Simms February 2016 This brief
Checklist for Conducting Local Union Officer Elections
 Checklist for Conducting Local Union Officer Elections This checklist has been developed by the Office of Labor-Management Standards (OLMS) to help election officials conduct union officer elections in
Creating Inclusive Communities
 Fostering opportunity through planning. Creating Inclusive Communities Lisa Corrado, Long Range Planning Manager City of Henderson John Tapogna, President EcoNorthwest Overview Recent research on economic
Constitution in a Nutshell NAME. Per
 Constitution in a Nutshell NAME Per Preamble We the People of the United States, in Order to form a more perfect Union, establish Justice, insure domestic Tranquility, provide for the common defense, promote
WYOMING POPULATION DECLINED SLIGHTLY
 FOR IMMEDIATE RELEASE Wednesday, December 19, 2018 Contact: Dr. Wenlin Liu, Chief Economist WYOMING POPULATION DECLINED SLIGHTLY CHEYENNE -- Wyoming s total resident population contracted to 577,737 in
Mineral Availability and Social License to Operate
 Mineral Availability and Social License to Operate Brett Jordan Division of Economics and Business Colorado School of Mines Camp Resources, August 7-9, 2016 Motivation Social License to Operate (SLO) NIMBYism
April 12, Dear Senator Cochran, Senator Durbin, Congressman Frelinghuysen, and Congressman Visclosky:
 April 12, 2016 The Honorable Thad Cochran Chairman Subcommittee on Defense Senate Committee on Appropriations 122 Dirksen Senate Office Building Washington, DC 20510 The Honorable Rodney Frelinghuysen
2016 NATIONAL CONVENTION
 Delegate Allocations and Region Formation 2016 NATIONAL CONVENTION ROSEN CENTRE, ORLANDO, FL FRIDAY, MAY 27 MONDAY, MAY 30 Written and Prepared By Alicia Mattson Secretary, Libertarian National Committee
Election 2014: The Midterm Results, the ACA and You
 Election 2014: The Midterm Results, the ACA and You James Slotnick, JD Sun Life Financial AVP, Broker Education Join the conversation on Twitter using #SLFElection2014 The Midterm Results The Outlook for
State Governments Viewed Favorably as Federal Rating Hits New Low
 APRIL 15, 2013 State Governments Viewed Favorably as Federal Rating Hits New Low FOR FURTHER INFORMATION CONTACT THE PEW RESEARCH CENTER FOR THE PEOPLE & THE PRESS Michael Dimock Director Carroll Doherty
State Legislative Competition in 2012: Redistricting and Party Polarization Drive Decrease In Competition
 October 17, 2012 State Legislative Competition in 2012: Redistricting and Party Polarization Drive Decrease In Competition John J. McGlennon, Ph.D. Government Department Chair and Professor of Government
The Youth Vote in 2008 By Emily Hoban Kirby and Kei Kawashima-Ginsberg 1 Updated August 17, 2009
 The Youth Vote in 2008 By Emily Hoban Kirby and Kei Kawashima-Ginsberg 1 Updated August 17, 2009 Estimates from the Census Current Population Survey November Supplement suggest that the voter turnout rate
REVISED ORDER GRANTING DEBTORS SEVENTEENTH OMNIBUS OBJECTION TO CLAIMS (Tax Claims Assumed by General Motors, LLC)
") HEARING DATE AND TIME: June 29, 2010 at 9:45 a.m. (Eastern Time) RESPONSE DEADLINE: June 22, 2010 at 4:00 p.m. (Eastern Time) UNITED STATES BANKRUPTCY COURT SOUTHERN DISTRICT OF NEW YORK ---------------------------------------------------------------x
HEARING DATE AND TIME: June 29, 2010 at 9:45 a.m. (Eastern Time) RESPONSE DEADLINE: June 22, 2010 at 4:00 p.m. (Eastern Time) UNITED STATES BANKRUPTCY COURT SOUTHERN DISTRICT OF NEW YORK ---------------------------------------------------------------x
The Brookings Institution Metropolitan Policy Program Bruce Katz, Director
 The Brookings Institution Metropolitan Policy Program Bruce Katz, Director The State of American Cities and Suburbs Habitat Urban Conference March 18, 2005 The State of American Cities and Suburbs I What
The Segregation Tax :
 Center on Urban & Metropolitan Policy Whether the value of the The Segregation Tax : The Cost of Racial Segregation to Black Homeowners By David Rusk 1 family home declines, is stable, or grows is vital
Refugee Resettlement in Small Cities Reports
 The University of Vermont PR3: Refugee Resettlement Trends in the Southeast REPORT Pablo Bose & Lucas Grigri Photo Credit: L. Grigri Published April 2018 in Burlington, VT Refugee Resettlement in Small
Mandated Use of Prescription Drug Monitoring Programs (PMPs) Map
 Map") Mandated Use of Prescription Drug Monitoring Programs (PMPs) Map Research Current as of January 2, 2018. This project was supported by Grant No. G1799ONDCP03A, awarded by the Office of National Drug Control
Mandated Use of Prescription Drug Monitoring Programs (PMPs) Map Research Current as of January 2, 2018. This project was supported by Grant No. G1799ONDCP03A, awarded by the Office of National Drug Control
2018 NATIONAL CONVENTION
 Delegate Allocations and Region Formation 2018 NATIONAL CONVENTION HYATT REGENCY, NEW ORLEANS, LA SUNDAY, JULY 1 TUESDAY JULY 3 Written and Prepared By Alicia Mattson Secretary, Libertarian National Committee
A Glance at THE LATINO VOTE IN Clarissa Martinez De Castro
 A Glance at THE LATINO VOTE IN 2016 Clarissa Martinez De Castro The Landscape 2 Latino voter growth continues. Latinos are a key factor in winning equation for White House and many state races, but investments/outreach
The Brookings Institution
 The Brookings Institution Metropolitan Policy Program Bruce Katz, Director Understanding Regional Dynamics: Implications for Social and Economic Justice Understanding Regional Dynamics: Implications for
Lone Star industrial real estate and its link with U.S./Mexico trade
 Texas ties that bind: Lone Star industrial real estate and its link with U.S./Mexico trade Robert C. Kramp Director of Research & Analysis, Texas-Oklahoma Division Pedro Niño, Jr. Sr. Research Analyst,
Immigration Goes Nationwide Recent dispersal has made immigrants and new minorities more visible
 Immigration Goes Nationwide Recent dispersal has made immigrants and new minorities more visible William H. Frey The Brookings Institution Metropolitan Policy Program Briefing, Immigration Policy: Federal
RIDE Program Overview
 RIDE Program Overview Table of Contents 1 Program Overview and the E-Verify Process 2 RIDE by the Numbers 3 Filling a Critical Gap and a Glance at Identity Fraud 4 Fact and Fiction? 5 Benefits of Working
NATIONAL VOTER REGISTRATION DAY. September 26, 2017
 NATIONAL VOTER REGISTRATION DAY September 26, 2017 THE PROBLEM Every year millions of Americans find themselves unable to vote because they miss a registration deadline, don t update their registration,
Minority Suburbanization and Racial Change
 University of Minnesota Law School Scholarship Repository Studies Institute on Metropolitan Opportunity 2006 Minority Suburbanization and Racial Change Institute on Metropolitan Opportunity University
Online Appendix for The Contribution of National Income Inequality to Regional Economic Divergence
 Online Appendix for The Contribution of National Income Inequality to Regional Economic Divergence APPENDIX 1: Trends in Regional Divergence Measured Using BEA Data on Commuting Zone Per Capita Personal
Annual Flow Report. of persons who became LPRs in the United States during 2007.
 Annual Flow Report MARCH 008 U.S. Legal Permanent Residents: 007 KELLy JEffERyS AND RANDALL MONGER A legal permanent resident (LPR) or green card recipient is defined by immigration law as a person who
Boomers and Seniors in the Suburbs:
 Center on Urban and Metropolitan Policy Boomers and Seniors in the Suburbs: Aging Patterns in Census 2000 The maturing of the suburban population ushers in a new era for suburbia, and presents both opportunities
New Americans in Lancaster
 New Americans in Lancaster APRIL 5, 2017 Kate Brick & Rich André New American Economy 500 Republican, Independent, and Democratic mayors and CEOs in all 50 states agree: Immigration is critical to America
Admitting Foreign Trained Lawyers. National Conference of Bar Examiners Washington, D.C., April 15, 2016
 Admitting Foreign Trained Lawyers National Conference of Bar Examiners Washington, D.C., April 15, 2016 Professor Laurel S. Terry Carlisle, Pennsylvania LTerry@psu.edu Overview of Remarks Why this issue
Charlie Cook s Tour of American Politics
 Charlie Cook s Tour of American Politics Insights into the 2018 midterm elections September 2018 Producer National Journal Presentation Center Director Alistair Taylor Roadmap Eight things to watch in
Governing Board Roster
 AASA Governance AASA is the national association most directly concerned with public education leadership. Its practicing superintendents and other school system leaders establish and oversee AASA's goals.
Federal Education: Of Elections &Politics. Oh, and Policy. Noelle Ellerson December 2014
 Federal Education: Of Elections &Politics. Oh, and Policy. Noelle Ellerson December 2014 Climates & To-Do List Funding State and local budgets have yet to reach prerecession levels Sequestration at the
2017A Financial Summary. $360MM Adjusted EBITDA $1BN Market Capitalization PREMIUM LOCAL NEWS BRANDS NATIONAL PRESENCE
 December 2018 Disclaimers This presentation may include certain forward-looking statements regarding business strategies, market potential, future financial performance and other matters. Forward-looking
National Popular Vote
 National Popular Vote Motivations This is NOT about trying to change the rules so that Team A or Team B has a better chance. This is about improving our elections for better democracy, better participation,
We re Paying Dearly for Bush s Tax Cuts Study Shows Burdens by State from Bush s $87-Billion-Every-51-Days Borrowing Binge
 Citizens for Tax Justice 202-626-3780 September 23, 2003 (9 pp.) Contact: Bob McIntyre We re Paying Dearly for Bush s Tax Cuts Study Shows Burdens by State from Bush s $87-Billion-Every-51-Days Borrowing