Immigrant Advances in Metropolitan New York
|
|
|
- Ruth Harper
- 6 years ago
- Views:
Transcription
1 Immigrant Advances in Metropolitan New York Andrew A. Beveridge, Queens College and Graduate Center CUNY New York Federal Reserve Conference The Passage to Banking: Linking Immigrants to Mainstream Financial Services November 21, 2002
2 Objectives of Presentation Look at Change of New York Area Immigrants Present Information on the Size and Composition of Foreign Born Location of Foreign Born How Various Immigrant Groups Are Faring in New York Metro Area
3 Data Sources Used Data from 1990 and 2000 Census Give a Good Picture of Size and Location of Groups Census 2000 Supplementary Survey Attempt to have Mini-Long Form During Census 2000 PUMS Data Not Yet Released
4
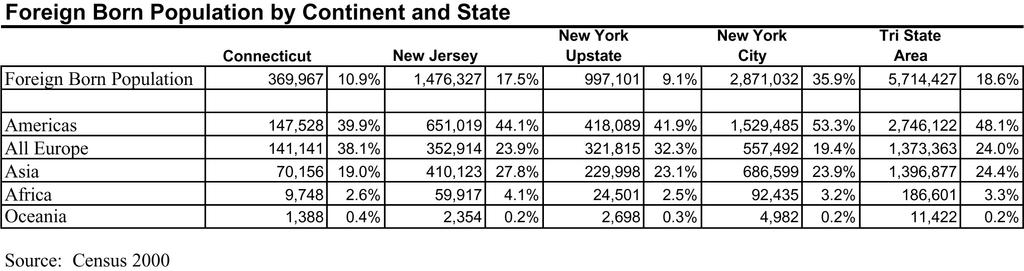
5
6
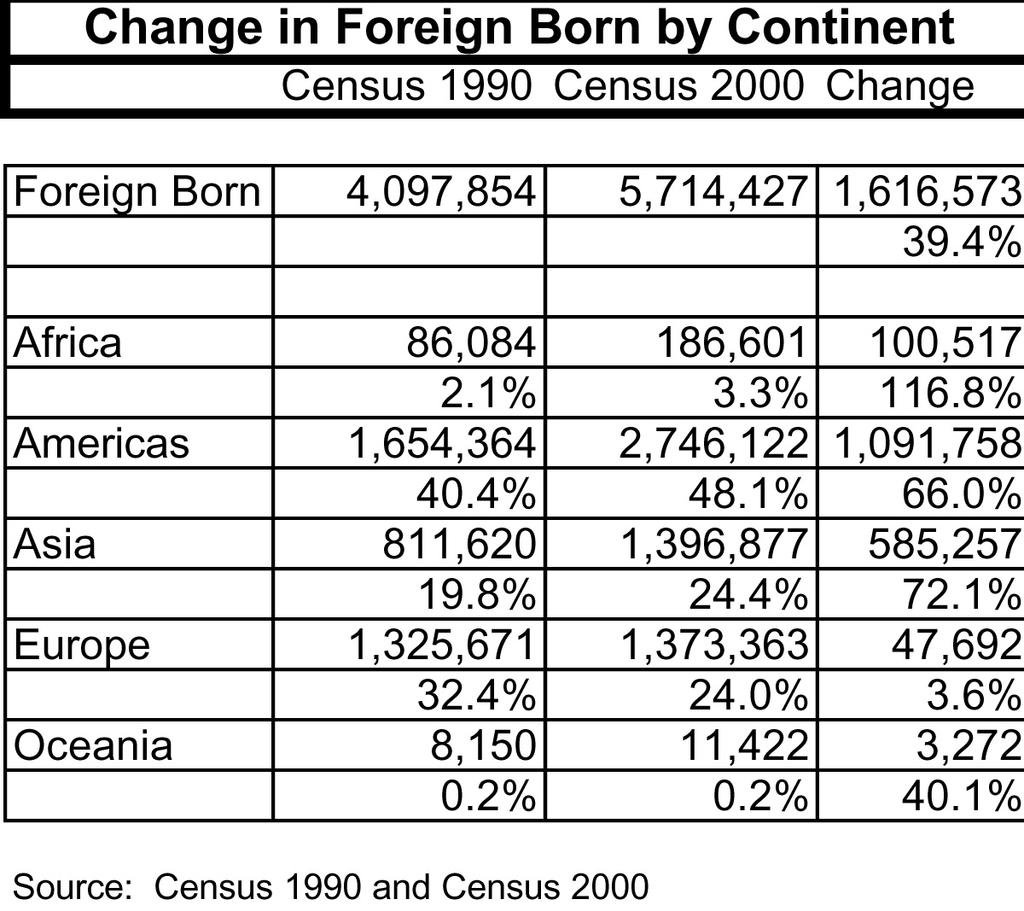
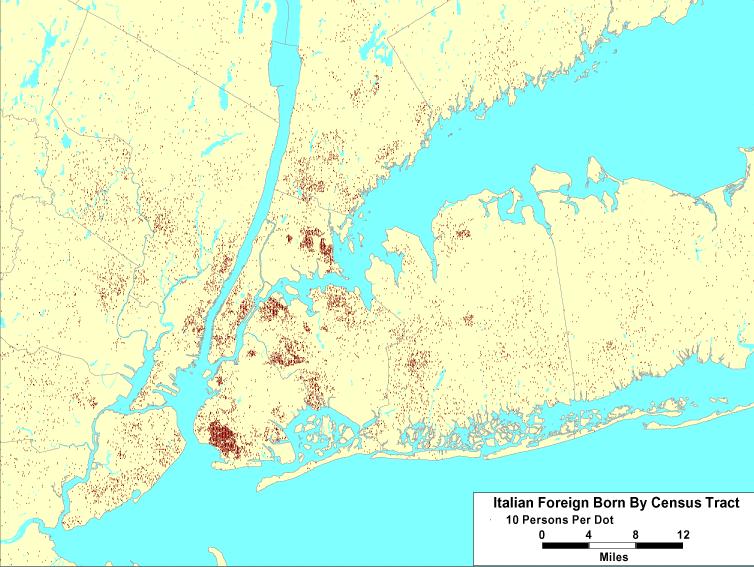
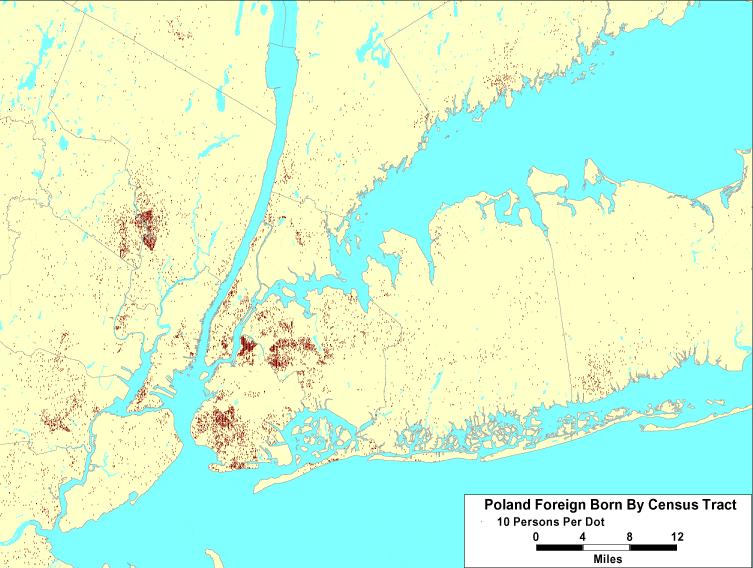
7 Patterns of Change Massive Growth of Immigrants Growth from Asia and Latin America Immense Minimal Growth from Europe Growth Throughout Region New York City (especially Queens) Immigrant Hub
8 Foreign Born Origin , , , , , ,000 0 Dominican Republic China Jamaica India Mexico Russia /USSR Italy Ecuador Columbia Poland Haiti Guyana Korea Philippines Germany Trinidad/Tobago United Kingdom El Salvador
9 Change in Foreign Origin 350.0% 300.0% 250.0% 200.0% 150.0% 100.0% 50.0% 0.0% -50.0% El Salvador United Kingdom Trinidad/Tobago Germany Philippines Korea Guyana Haiti Poland Columbia Ecuador Italy Russia /USSR Mexico India Jamaica China Dominican Republic
10 Country of Origin Census 2000 Top 18 Foreign Origins in Tri-State Area Percent of Foreign Born Cumulative Percent Census 1990 Change in Number Percent Change Dominican Republic 507, % 8.9% 279, , % China 380, % 15.6% 149, , % Jamaica 289, % 20.6% 184, , % India 251, % 25.0% 126, , % Mexico 242, % 29.3% 58, , % Russia /USSR 236, % 33.4% 123, , % Italy 232, % 37.5% 294,464-62, % Ecuador 201, % 41.0% 92, , % Columbia 193, % 44.4% 128,917 64, % Poland 174, % 47.4% 148,004 26, % Haiti 165, % 50.3% 106,896 58, % Guyana 162, % 53.2% 92,351 70, % Korea 155, % 55.9% 102,086 53, % Philippines 148, % 58.5% 93,053 55, % Germany 114, % 60.5% 148,327-34, % Trinidad/Tobago 113, % 62.5% 70,673 43, % United Kingdom 108, % 64.4% 119,569-10, % El Salvador 108, % 66.3% 51,369 56, %
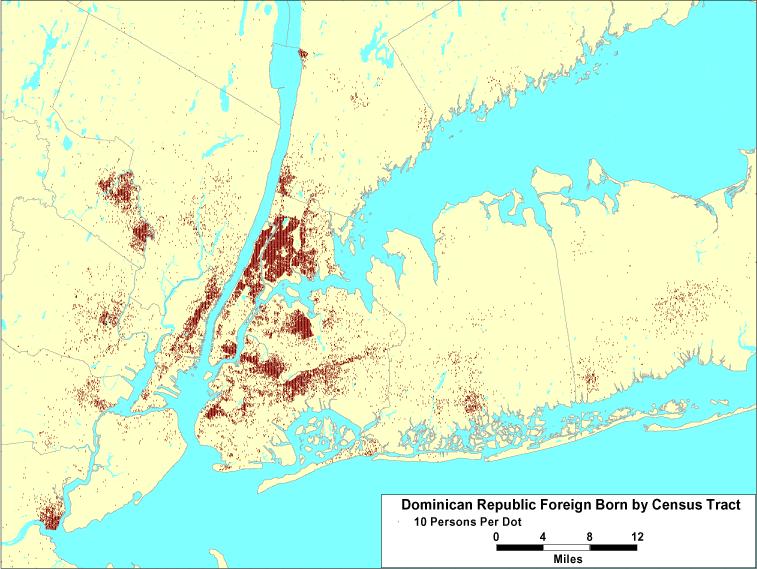
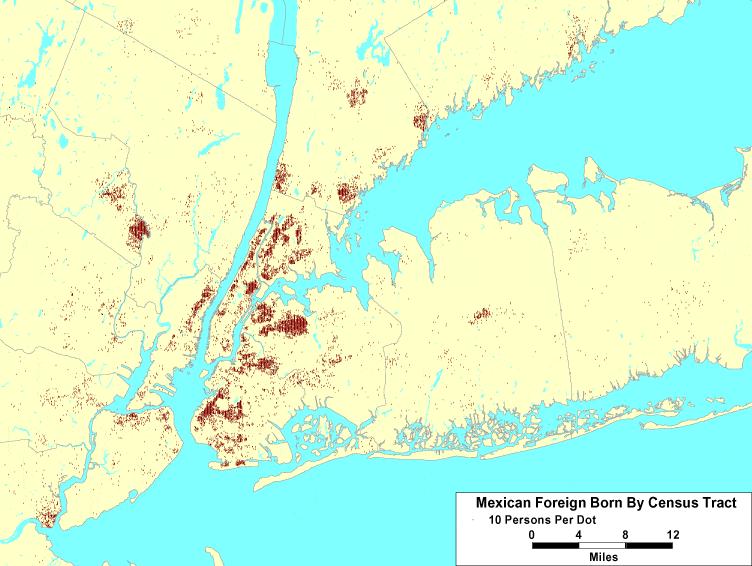
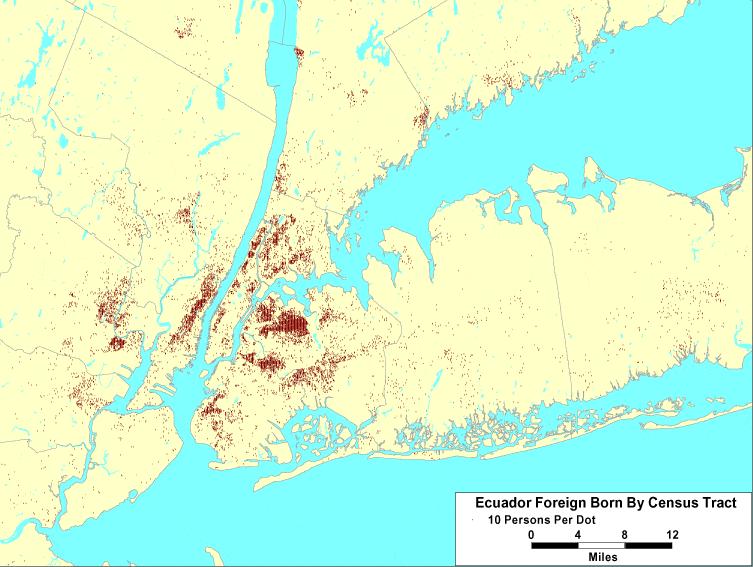
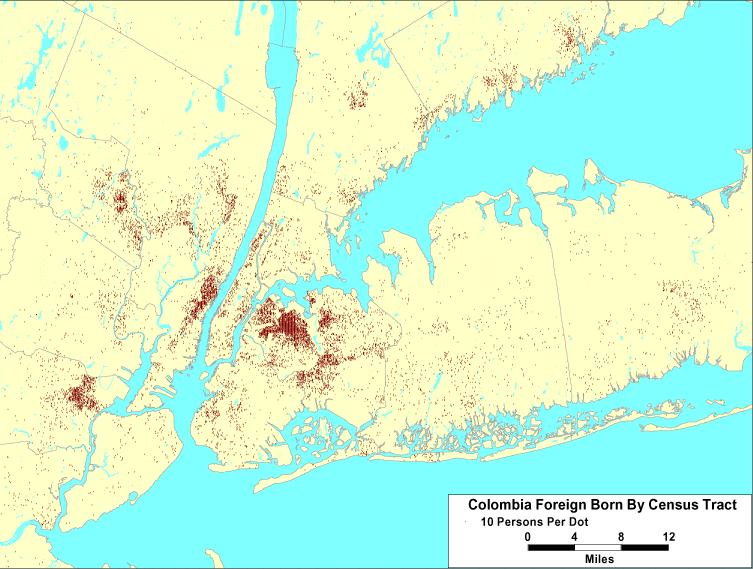
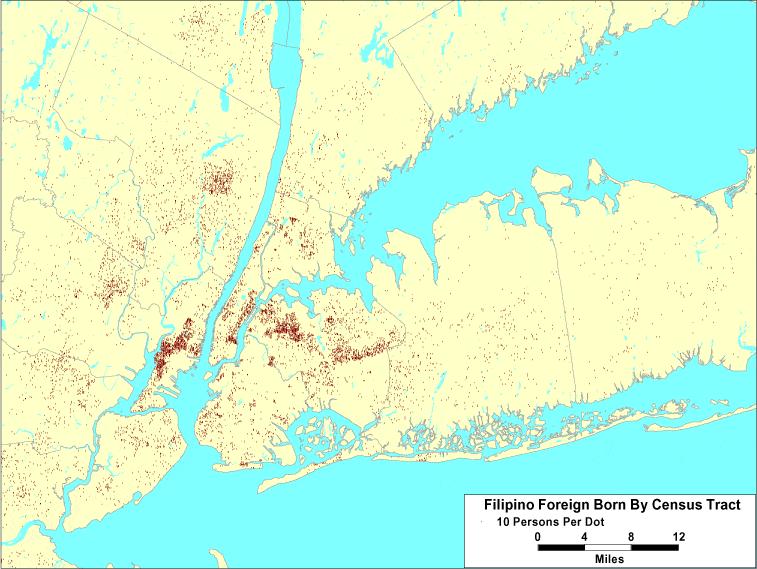
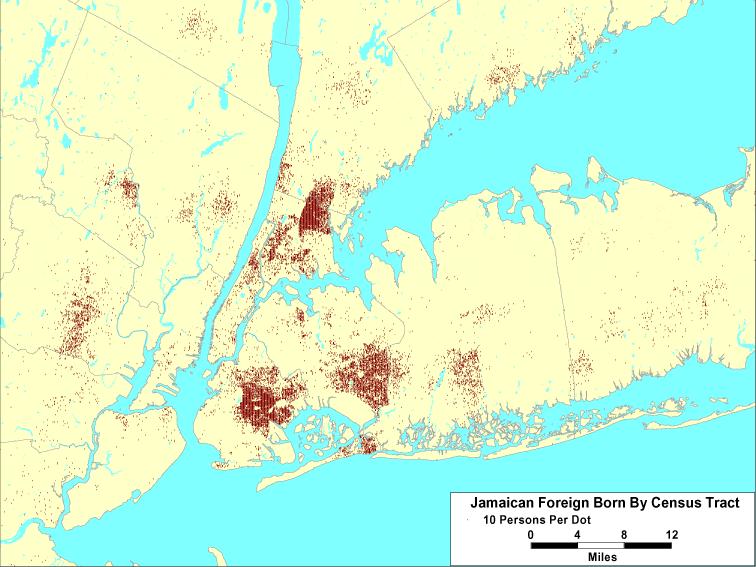
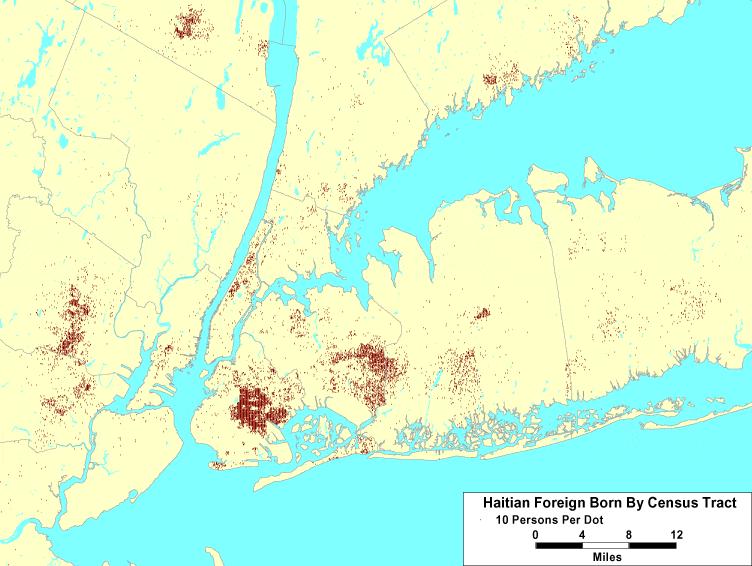
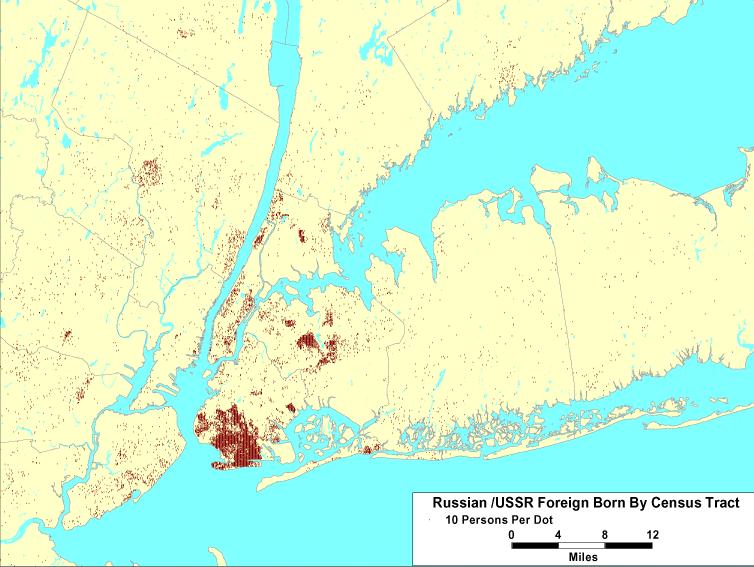
11 Growth Very Diverse New York Metropolitan Immigrant Growth Very Diverse Origins Include Many Different Countries Older Source: Russia, Italy, Poland Caribbean: Dominican Republic, Jamaica, Haiti New Sources: Mexico, Ecuador, Colombia Asia: China and India
12
13
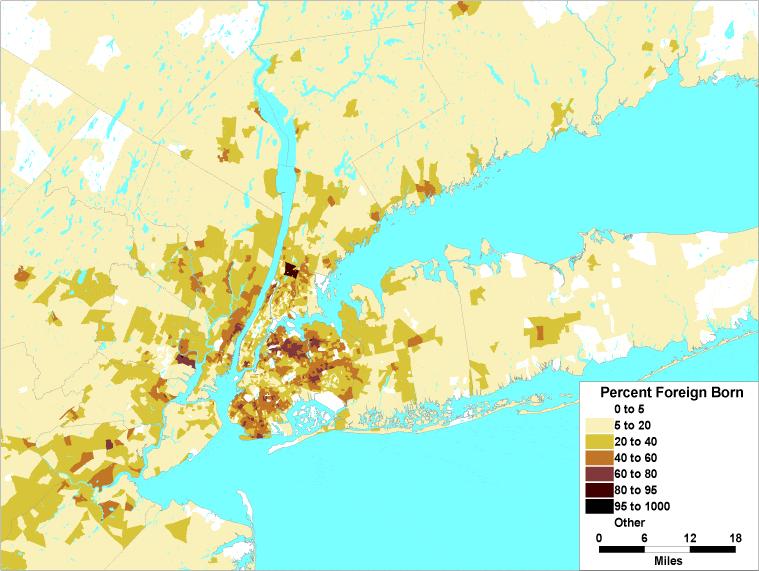
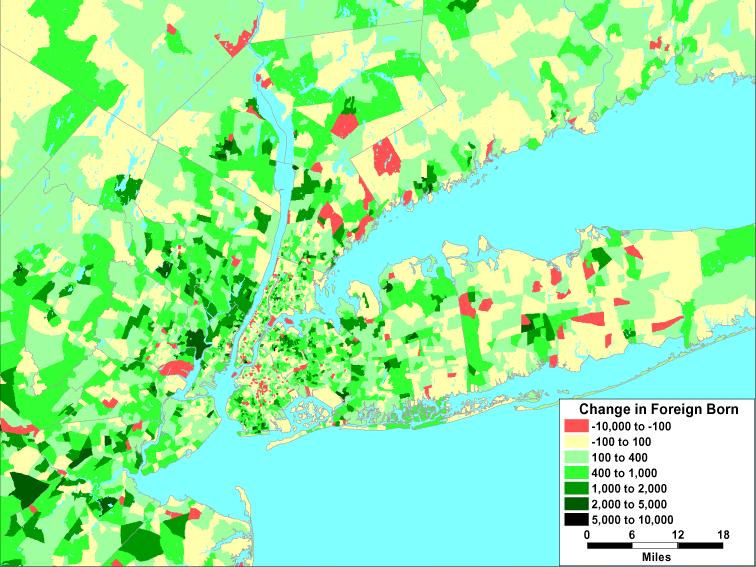
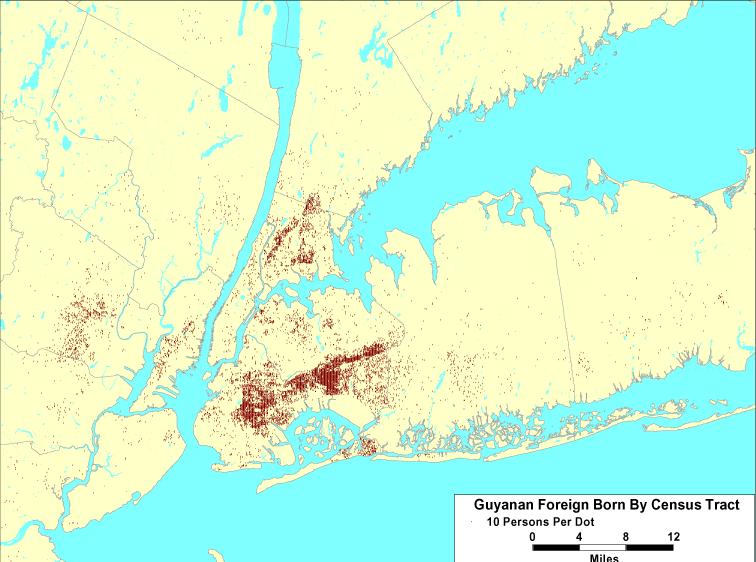
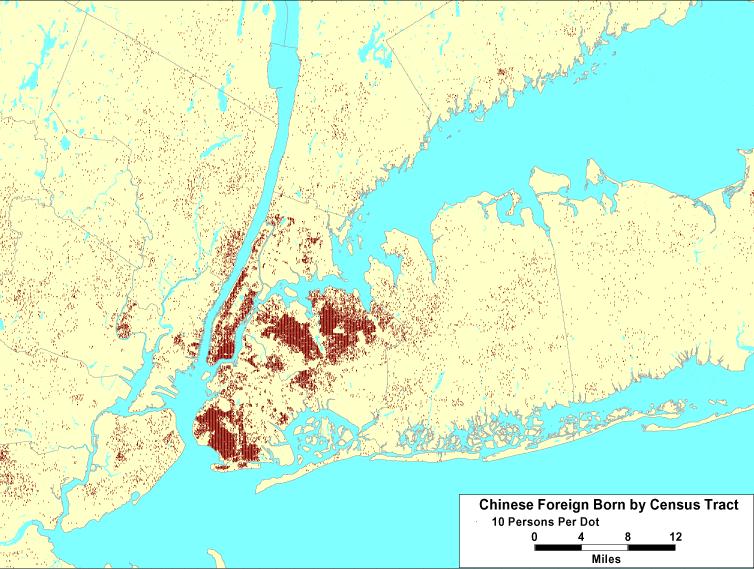
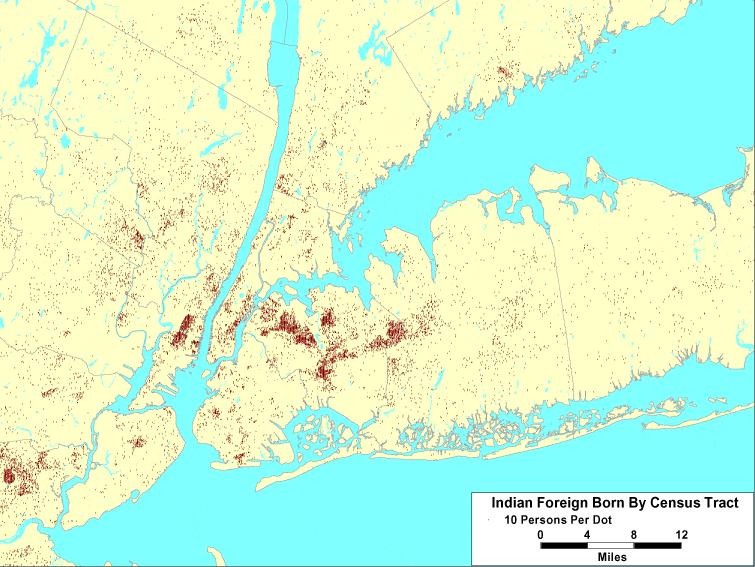
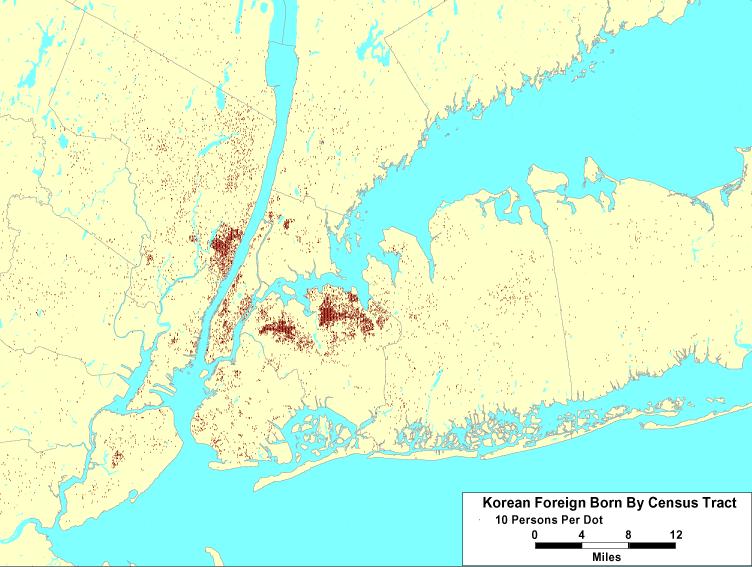
14 Settlement Patterns New York and Some Other Urban Centers Most Intense Growth Moving Out Into Suburbs Settlement Patterns Vary By Group
15
16
17
18
19
20
21
22
23
24
25
26
27
28

29 East Harlem, the Lower East Side, and the Lower West Side had the highest population density in turnof-the-century New York. The density of immigrants in the Lower East Side was most remarkable; particularly considering that most lived in tenements no more than four stories high.
30 Economic and Social Status Varies Greatly By Group Some In Highly Professional Areas Some In Entrepreneurial Businesses Some Economically Advanced Some Impoverished Some Mostly Family, Others Not Data Not Reliable, But Seems Consistent
31 Median Household Income by Immigrant Group $100,000 $90,000 $80,000 $70,000 $60,000 $50,000 $40,000 $30,000 $20,000 $10,000 $0 Dominican Republic China All Jamaica India Mexico Russia /USSR Italy Ecuador Columbia Poland Haiti Guyana Korea Phillipines
32 % Married Couple Family by Immigrant Group 90.0% 80.0% 70.0% 60.0% 50.0% 40.0% 30.0% 20.0% 10.0% 0.0% Dominican Republic China All Jamaica India Mexico Russia /USSR Italy Ecuador Columbia Poland Haiti Guyana Korea Phillipines
33 Percent Male 18 or Older, Various Groups 70.0% 60.0% 50.0% 40.0% 30.0% 20.0% 10.0% 0.0% Dominican Republic China All Jamaica India Mexico Russia /USSR Italy Ecuador Columbia Poland Haiti Guyana Korea Phillipines
34 Earnings of Workers From Various Groups $50,000 $45,000 $40,000 $35,000 $30,000 $25,000 $20,000 $15,000 $10,000 $5,000 $0 Dominican Republic China All Jamaica India Mexico Russia /USSR Italy Ecuador Columbia Poland Haiti Guyana Korea Phillipines
35 Self-Employment By Various Groups 25.0% 20.0% 15.0% 10.0% 5.0% 0.0% Dominican Republic China All Jamaica India Mexico Russia /USSR Italy Ecuador Columbia Poland Haiti Guyana Korea Phillipines
36 At Least BA 25 and Over for Various Groups 80.0% 70.0% 60.0% 50.0% 40.0% 30.0% 20.0% 10.0% 0.0% Dominican Republic China All Jamaica India Mexico Russia /USSR Italy Ecuador Columbia Poland Haiti Guyana Korea Phillipines
37 Percent Managerial/Professional Occupation Various Groups 40.0% 35.0% 30.0% 25.0% 20.0% 15.0% 10.0% 5.0% 0.0% Dominican Republic China All Jamaica India Mexico Russia /USSR Italy Ecuador Columbia Poland Haiti Guyana Korea Phillipines
38 Varying Immigrant Fortunes Groups and Individuals in Each Group Different Credit Needs Some Entrepreneurial, Others Work in Low Wage Service Jobs Some Highly Professional, Developing High-Income Communities One Would Expect Groups (Such as Mexicans to Settle
39 Other Information on New York Area Andrew A. Beveridge 209 Kissena Hall -- Sociology Queens College Flushing, New York
More than a Number. By Hanna Rose
 11367 More than a Number By Hanna Rose Defining a Neighborhood 11367 Map Queens College Is my home base; I also wanted something that included this side of Main Street. In the Beginning Queens College
Fiscal Policy Institute. Working for a Better Life. A Profile of Immigrants in the New York State Economy
 Fiscal Policy Institute Working for a Better Life A Profile of Immigrants in the New York State Economy In an overheated atmosphere, Fiscal Policy Institute set out to take a calm look at the real role
IMMIGRATION FACTS. How Changes to Family Immigration Could Affect Source Countries Sending Patterns. Migration Policy Institute
 The Migration Policy Institute is an independent, nonpartisan, and nonprofit think tank dedicated to the study of the movement of people worldwide. The institute provides analysis, development, and evaluation
A Demographic Profile of Mexican Immigrants in the United States
 A Demographic Profile of Mexican Immigrants in the United States Ariel G Ruiz Soto Associate Policy Analyst, U.S. Programs Migration Policy Institute Mexico Institute, Wilson Center November 5, 2018 Number
Study Area Maps. Profile Tables. W Broadway & Cambie St, Vancouver, BC Pitney Bowes 2016 Estimates and Projections. W Broadway & Cambie St
 Powered by PCensus Page 1 Study Area Maps Profile Tables 2016 Demographic Snapshot Population Trends Household Trends Population by Age and Sex Comparison Population by Age and Sex Household Maintainers
Latinos in Saratoga County. Trudi Renwick Senior Economist Fiscal Policy Institute April 26, 2008
 Latinos in Saratoga County Trudi Renwick Senior Economist Fiscal Policy Institute April 26, 2008 1 Fiscal Policy Institute set out to take a calm look at the real role of immigrants in New York Working
Illegal Immigration: How Should We Deal With It?
 Illegal Immigration: How Should We Deal With It? Polling Question 1: Providing routine healthcare services to illegal Immigrants 1. Is a moral/ethical responsibility 2. Legitimizes illegal behavior 3.
Immigrants and the Hudson Valley Economy
 Immigrants and the Hudson Valley Economy A Fiscal Policy Institute Report www.fiscalpolicy.org December 2009 Executive Summary Immigrants in New York s Hudson Valley contribute to the local economy in
Family-sponsored Preferences
 Annual Report of Immigrant Visa Applicants in the Family-sponsored and Employment-based preferences Registered at the National Visa Center as of November 1, 2009 Most prospective immigrant visa applicants
INFOBRIEF SRS. Over the past decade, both the U.S. college-educated
 INFOBRIEF SRS Science Resources Statistics National Science Foundation NSF 07-324 Directorate for Social, Behavioral, and Economic Sciences June 2007 WHY DID THEY COME TO THE UNITED STATES? A PROFILE OF
Facts & Figures in this issue: income employment growth trends baby boomers millennials immigration
 Facts & Figures in this issue: income employment growth trends baby boomers millennials immigration 2017 Baby Boomers The term baby boomer refers to individuals born in the United States between 1946 and
Mexico. Brazil. Colombia. Guatemala. El Salvador. Dominican Republic
 Migration and Remittances in Puerto Rico, the Dominican Republic, and Mexico Jorge Duany Department of Sociology and Anthropology University of Puerto Rico, Río Piedras Main Objectives Assess the growing
Highly educated immigrants, meaning those who arrive with a college degree or more, often find that
 CENTER FOR IMMIGRATION STUDIES July 2018 High-Skill Immigrants in Low-Skill Jobs By Jason Richwine Highly educated immigrants, meaning those who arrive with a college degree or more, often find that their
The Popula(on of New York City Recent PaFerns and Trends
 TM The Popula(on of New York City Recent PaFerns and Trends Presenta(on for the Macaulay Honors College of the City University of New York January 28, 2014 Joseph Salvo POPULATION DIVISION New York City
Distr. LIMITED LC/L.4068(CEA.8/3) 22 September 2014 ENGLISH ORIGINAL: SPANISH
 22 September 2014 ENGLISH ORIGINAL: SPANISH") Distr. LIMITED LC/L.4068(CEA.8/3) 22 September 2014 ENGLISH ORIGINAL: SPANISH Eighth meeting of the Statistical Conference of the Americas of the Economic Commission for Latin America and the Caribbean
Distr. LIMITED LC/L.4068(CEA.8/3) 22 September 2014 ENGLISH ORIGINAL: SPANISH Eighth meeting of the Statistical Conference of the Americas of the Economic Commission for Latin America and the Caribbean
African immigrants in the Washington region: a demographic overview
 African immigrants in the Washington region: a demographic overview Jill H. Wilson, Senior Research Analyst Presented at the DC Mayor s Office on African Affairs 2010 Census Kick-off 1 February 25, 2010
Legal Immigration to US Still Declining IMMIGRATION FACTS. Figure 1: Total Immigrant Admissions,
 The Migration Policy Institute is an independent, non-partisan, and non-profit think tank dedicated to the study of the movement of people worldwide. The institute provides analysis, development, and evaluation
Immigrant Remittances: Trends and Impacts, Here and Abroad
 Immigrant Remittances: Trends and Impacts, Here and Abroad Presentation to Financial Access for Immigrants: Learning from Diverse Perspectives, The Federal Reserve Bank of Chicago by B. Lindsay Lowell
Immigration Survey. Toplines. National Public Radio/Kaiser Family Foundation/Kennedy School of Government HARVARD UNIVERSITY
 Toplines HARVARD UNIVERSITY JOHN F. KENNEDY SCHOOL OF GOVERNMENT National Public Radio/Kaiser Family Foundation/Kennedy School of Government Immigration Survey October 2004 Methodology The NPR/Kaiser/Kennedy
U.S. Government Announces 2009 Diversity Immigrant Visa Lottery
 To our clients and friends: OCTOBER 3, 2007 Boston U.S. Government Announces 2009 Diversity Immigrant Visa Lottery Washington New York Stamford Los Angeles Palo Alto San Diego London The State Department
Population Growth and California s Future. Hans Johnson
 Population Growth and California s Future Hans Johnson Outline California s rapid growth Population diversity Implications for policy 2 California Has a Large and Growing Population 40,000 Population (in
How Extensive Is the Brain Drain?
 How Extensive Is the Brain Drain? By William J. Carrington and Enrica Detragiache How extensive is the "brain drain," and which countries and regions are most strongly affected by it? This article estimates
Geographic Mobility of New Jersey Residents. Migration affects the number and characteristics of our resident population
 Geographic Mobility of New Jersey Residents Migration affects the number and characteristics of our resident population Geographic Mobility of New Jersey Residents More than 4.1 million (or 47.4%) New
New data from the Census Bureau show that the nation s immigrant population (legal and illegal), also
, also") Backgrounder Center for Immigration Studies October 2011 A Record-Setting Decade of Immigration: 2000 to 2010 By Steven A. Camarota New data from the Census Bureau show that the nation s immigrant population
Backgrounder Center for Immigration Studies October 2011 A Record-Setting Decade of Immigration: 2000 to 2010 By Steven A. Camarota New data from the Census Bureau show that the nation s immigrant population
DATA PROFILES OF IMMIGRANTS IN THE DISTRICT OF COLUMBIA
 DATA PROFILES OF IMMIGRANTS IN THE DISTRICT OF COLUMBIA LATINO IMMIGRANTS Demographics Economic Opportunity Education Health Housing This is part of a data series on immigrants in the District of Columbia
Chapter 13. Country of Birth of the Foreign-Born Population
 Campbell Gibson American Demographic History Chartbook: 0 to www.demographicchartbook.com Chapter. Country of Birth of the Foreign-Born Population With a few exceptions, data on the foreign-born population
US Undocumented Population Drops Below 11 Million in 2014, with Continued Declines in the Mexican Undocumented Population
 Drops Below 11 Million in 2014, with Continued Declines in the Mexican Undocumented Population Robert Warren Center for Migration Studies Executive Summary Undocumented immigration has been a significant
Immigrants and the Direct Care Workforce
 JUNE 2017 RESEARCH BRIEF Immigrants and the Direct Care Workforce BY ROBERT ESPINOZA Immigrants are a significant part of the U.S. economy and the direct care workforce, providing hands-on care to older
Worker Remittances: An International Comparison
 Worker Remittances: An International Comparison Manuel Orozco Inter-American Dialogue February 28th, 2003 Inter-American Development Bank Worker Remittances: An International Comparison Manuel Orozco,
INTERNATIONAL MIGRATION IN THE AMERICAS
 INTERNATIONAL MIGRATION IN THE AMERICAS SICREMI 2012 EXECUTIVE SUMMARY Organization of American States Organization of American States INTERNATIONAL MIGRATION IN THE AMERICAS Second Report of the Continuous
RIETI BBL Seminar Handout
 Research Institute of Economy, Trade and Industry (RIETI) RIETI BBL Seminar Handout September 24, 2014 Speaker: Mr. Bruce STOKES http://www.rieti.go.jp/jp/index.html Japanese, American, Asian Views on
FROM ELLIS ISLAND TO THE QUEEN CITY: IMMIGRATION GEOGRAPHY AND CHARLOTTE IN THE 21 ST CENTURY
 FROM ELLIS ISLAND TO THE QUEEN CITY: IMMIGRATION GEOGRAPHY AND CHARLOTTE IN THE 21 ST CENTURY Owen J. Furuseth, Ph.D. Associate Provost for Metropolitan Studies and Extended Academic Programs; and Professor
Number of Applicants on Waiting List in Family-sponsored Preference Categories As of Nov. 1, 2017 vs. As of Nov. 1, 2018
 Annual Report of Immigrant Visa Applicants in the Family-sponsored and Employment-based preferences Registered at the National Visa Center as of November 1, 2018 Most prospective immigrant visa applicants
Labor Market Outcomes of Family Migrants in the United States: New Evidence from the New Immigrant Survey. Guillermina Jasso. New York University
 Labor Market Outcomes of Migrants in the United States: New Evidence from the New Immigrant Survey Guillermina Jasso New York University Mark R. Rosenzweig Yale University In reforming or designing an
Towards the 5x5 Objective: Setting Priorities for Action
 Towards the 5x5 Objective: Setting Priorities for Action Global Remittances Working Group Meeting April 23, Washington DC Massimo Cirasino Head, Payment Systems Development Group The 5x5 Objective In many
A Global View of Entrepreneurship Global Entrepreneurship Monitor 2012
 A Global View of Entrepreneurship Global Entrepreneurship Monitor 2012 Donna Kelley, Babson College REITI Workshop Tokyo Japan January 21, 2001 In 2012, its 14 th year, GEM surveyed 198,000 adults in 69
Becoming American History of Immigration Period 1
 National Museum of American Jewish History Becoming American History of Immigration 1880-1924 Period 1 Do Now Complete the K and W sections of the chart: What do you already know about the topic of immigration?
92 El Salvador El Salvador El Salvador El Salvador El Salvador Nicaragua Nicaragua Nicaragua 1
 Appendix A: CCODE Country Year 20 Canada 1958 20 Canada 1964 20 Canada 1970 20 Canada 1982 20 Canada 1991 20 Canada 1998 31 Bahamas 1958 31 Bahamas 1964 31 Bahamas 1970 31 Bahamas 1982 31 Bahamas 1991
A Note on International Migrants Savings and Incomes
 September 24, 2014 A Note on International Migrants Savings and Incomes Supriyo De, Dilip Ratha, and Seyed Reza Yousefi 1 Annual savings of international migrants from developing countries are estimated
How the US Acquires Clients. Contexts of Acquisition
 How the US Acquires Clients Contexts of Acquisition Some Basics of Client Acquisition Client acquisition requires the consent of both the US and the new client though consent of the client can be coercive
The New Metropolitan Geography of U.S. Immigration
 The Brookings Institution Metropolitan Policy Program Audrey Singer, Immigration Fellow The New Metropolitan Geography of U.S. Immigration Mayors Institute on City Design Rethinking Neighborhoods for Immigrants
ADMISSIONS SURVEY FALL 2017 ENTERING CLASS
 ADMISSIONS SURVEY FALL 2017 ENTERING CLASS Response to Survey: 100% represents 1% or less Gender Male 44% 46% Female 55% 52% Trans - Gender non-conforming - Choose not to answer - 2% Language Most Comfortable
Victoria A City in Capital Regional District
 Produced by Stats for Global Non-Response Rate: 24.6 Population Total Immigrants Change in Change in Immigrants Population Number Percent Population Number Percent 1991 71,228 14,665 20.6 1991 to 1996
Nelson A City in Central Kootenay Regional District
 Produced by Stats for Global NonResponse Rate: 28.3 Population Total Immigrants Change in Change in Immigrants Population Number Percent Population Number Percent 1991 8,849 1,175 13.3 1991 to 1996 736
Educated Migrants: Is There Brain Waste?
 7 Educated Migrants: Is There Brain Waste? Çaḡlar Özden Introduction The welfare of migrants is one of the key issues that need to be considered when migration policies are evaluated. The literature to
1615 L Street, NW, Suite 700 Washington, DC (main) (fax)
 (fax)") 1615 L Street, NW, Suite 700 Washington, DC 20036-5631 202-419-3600(main) 202-419-3608(fax) www.pewresearch.org A Fact Tank The Pew Research Center is a nonpartisan organization that provides information
1615 L Street, NW, Suite 700 Washington, DC 20036-5631 202-419-3600(main) 202-419-3608(fax) www.pewresearch.org A Fact Tank The Pew Research Center is a nonpartisan organization that provides information
Business Data For Engaging in International Real Estate Transactions in California. National Association of REALTORS Research Division
 Business Data For Engaging in International Real Estate Transactions in National Association of REALTORS Research Division November 2016 Table of Contents Introduction 1 Table 1. Population by Place of
Incarceration Data: Selected Comparisons
 Incarceration Data: Selected Comparisons Charles Patton III Race/Ethnicity: Multidisciplinary Global Contexts, Volume 2, Number 1, Autumn 2008, pp. 151-156 (Article) Published by Indiana University Press
Canada at 150 and the road ahead A view from Census 2016
 Canada at 150 and the road ahead A view from Census 2016 Dr. Doug Norris Senior Vice President and Chief Demographer 2017 Environics Analytics User Conference November 8, 2017 Canada continues to lead
Center for Immigration Studies
 Center for Immigration Studies Immigrants in the United States A Profile of America s Foreign-Born Population By Steven A. Camarota i About the Center The Center for Immigration Studies, founded in 1985,
Kaslo A Village in Central Kootenay Regional District
 Produced by Stats for Global NonResponse Rate: 46.8 Population Total Immigrants Change in Change in Immigrants Population Number Percent Population Number Percent 1991 863 15 17.4 1991 to 1996 2 15 1.
Joint Center for Housing Studies Harvard University
 Joint Center for Housing Studies Harvard University New Americans, New Homeowners: The Role and Relevance of Foreign-Born First-Time Homebuyers in the U.S. Housing Market Rachel Bogardus Drew N02-2 August
Trademarks FIGURE 8 FIGURE 9. Highlights. Figure 8 Trademark applications worldwide. Figure 9 Trademark application class counts worldwide
 Trademarks Highlights Applications grew by 16.4% in 2016 An estimated 7 million trademark applications were filed worldwide in 2016, 16.4% more than in 2015 (figure 8). This marks the seventh consecutive
CHILE NORTH AMERICA. Egypt, Israel, Oman, Saudi Arabia and UAE. Barge service: Russia Federation, South Korea and Taiwan. USA East Coast and Panama
 EUROPE Bulgaria, Greece, Italy, Netherlands and Turkey Belgium, Denmark, France, Germany, Malta, Netherlands, Poland, Slovenia, Spain and UK Belgium, Germany, Gibraltar, Greece, Italy, Malta, Netherlands,
Immigration and the US Economy:
 Immigration and the US Economy: Labor Market Impacts, Policy Choices, and Illegal Entry Gordon H. Hanson, UC San Diego and NBER Kenneth F. Scheve, Yale University Matthew J. Slaughter, Dartmouth College
The Foreign-Born Population of Southeastern Pennsylvania. By Randy Capps
 The Foreign-Born Population of Southeastern Pennsylvania By Randy Capps Philadelphia June 15 th, 2016 Acknowledgments Ariel Ruiz at MPI analyzed the data and wrote the slides for this presentation. James
CLACLS. A Profile of Latino Citizenship in the United States: Demographic, Educational and Economic Trends between 1990 and 2013
 CLACLS Center for Latin American, Caribbean & Latino Studies A Profile of Latino Citizenship in the United States: Demographic, Educational and Economic Trends between 1990 and 2013 Karen Okigbo Sociology
Fort St. James A District Municipality in Bulkley-Nechako Regional District
 A District Municipality in BulkleyNechako Regional District Produced by Stats for Global NonResponse Rate: 36.9 Population Total Immigrants Change in Change in Immigrants Population Number Percent Population
I. LEVELS AND TRENDS IN INTERNATIONAL MIGRANT STOCK
 I. LEVELS AND TRENDS IN INTERNATIONAL MIGRANT STOCK A. INTERNATIONAL MIGRANT STOCK BY DEVELOPMENT GROUP The Population Division estimates that, worldwide, there were 214.2 million international migrants
North Vancouver, City of A City in Greater Vancouver Regional District
 Global Non-Response Rate: 25.8 Population Total Immigrants Change in Change in Immigrants Population Number Percent Population Number Percent 1991 38,436,8 28.2 1991 to 1996 3,39 2,46 22.7 1996 41,475
Number of Applicants on Waiting List in Family Preference Categories As of Nov. 1, 2014 vs. As of Nov. 1, 2015
 Annual Report of Immigrant Visa Applicants in the Family-sponsored and Employment-based preferences Registered at the National Visa Center as of November 1, 2015 Most prospective immigrant visa applicants
National Travel and Tourism Office
 U.S. Department of Commerce International Trade Administration National Travel and Tourism Office International Visitation to the United States: A Statistical Summary of U.S. Visitation (2015 P ) International
Saanich A District Municipality in Capital Regional District
 Produced by Stats for Population Total Immigrants Change in Change in Immigrants Population Number Percent Population Number Percent 1991 95,583 20,285 21.2 1991 to 1996 5,805 755 3.7 1996 101,388 21,040
Burnaby A City in Greater Vancouver Regional District
 Produced by Stats for Global Non-Response Rate: 23.6 Population Total Change in Change in Population Number Percent Population Number Percent 1991 158,858 49,5 31.2 1991 to 1996,351 24,5 49.1 1996 179,9
Nanaimo A City in Nanaimo Regional District
 A City in Regional District Produced by Stats for Population Total Immigrants Change in Change in Immigrants Population Number Percent Population Number Percent 1991 6,129 8,885 14.8 1991 to 1996,1 2,44
The globalization of inequality
 The globalization of inequality François Bourguignon Paris School of Economics Public lecture, Canberra, May 2013 1 "In a human society in the process of unification inequality between nations acquires
THE U.S.-CHINA POWER SHIFT
 THE U.S.-CHINA POWER SHIFT Bruce Stokes Director, Global Economic Attitudes Pew Research Center Funded largely by the Pew Charitable Trusts Non-profit, non-partisan fact tank in Washington Research areas
Migration and Developing Countries
 Migration and Developing Countries Jeff Dayton-Johnson Denis Drechsler OECD Development Centre 28 November 2007 Migration Policy Institute Washington DC International migration and developing countries
RECENT IMMIGRANTS IN METROPOLITAN AREAS. Regina. A Comparative Profile Based on the 2001 Census April 2005
 RECENT IMMIGRANTS IN METROPOLITAN AREAS Regina A Comparative Profile Based on the 2001 Census April 2005 Produced by Strategic Research and Statistics For additional copies, please visit our website: Internet:
World Map Title Name. Russia. United States. Japan. Mexico. Philippines Nigeria. Brazil. Indonesia. Germany United Kingdom. Canada
 214 P Gersmehl Teachers may copy for use in their classrooms. Contact pgersmehl@gmail.com regarding permission for any other use. World Map Title Name Canada United States Mexico Colombia Ecuador Haiti
MIGRATION TRENDS IN SOUTH AMERICA
 South American Migration Report No. 1-217 MIGRATION TRENDS IN SOUTH AMERICA South America is a region of origin, destination and transit of international migrants. Since the beginning of the twenty-first
Temporary Migration & Transitions to Permanency: Foreign Workers in Manitoba
 Temporary Migration & Transitions to Permanency: Foreign Workers in Manitoba P resented a t t he 1 3 t h N a t ional M etropolis Conferenc e M a rch 25, 2011 P r e s e n t e d b y : J i l l B u c k l a
Monitoring the Dual Mandate: What Ails the Labor Force?
 Dallas Fed Economic Summit June 27, 216 Monitoring the Dual Mandate: What Ails the Labor Force? Pia Orrenius Federal Reserve Bank of Dallas Disclaimer: The views expressed here are those of the presenter
Fiscal Policy Institute. Working for a Better Life. A Profile of Immigrants in the New York State Economy
 Fiscal Policy Institute Working for a Better Life A Profile of Immigrants in the New York State Economy In an overheated atmosphere, Fiscal Policy Institute set out to take a calm look at the real role
GLOBALIZATION 4.0 The Human Experience. Presented to the World Economic Forum by SAP + Qualtrics
 + GLOBALIZATION 4.0 The Human Experience Presented to the World Economic Forum by SAP + Qualtrics 1 Survey methodology An original survey research project with more than 10,000 respondents across 29 countries
Introduction to Federal Immigration Law
 Introduction to Federal Immigration Law 1 SEJAL ZOTA IMMIGRATION LAW SPECIALIST S JUNE 22, 2010 Topics Immigration trends in NC Basics of immigration law & removal Immigration/criminal justice system crossover
Overview of Boston s Population. Boston Redevelopment Authority Research Division Alvaro Lima, Director of Research September
 Overview of Boston s Population Boston Redevelopment Authority Research Division Alvaro Lima, Director of Research September - 2011 Historic Trends Boston s Population Boston reached its population peak
View Royal A Town in Capital Regional District
 Produced by Stats for Global NonResponse Rate: 18.4 Population Total Immigrants Change in Change in Immigrants Population Number Percent Population Number Percent 1991 5,996 9 15.6 1991 to 1996 445 315
International Visitation to the United States: A Statistical Summary of U.S. Visitation (2011)
") U. S. Depar tment of Commerce International Trade Administration Manufac turing and Ser vices Ser vices Office of Travel and Tourism Industries International Visitation to the United States: A Statistical
U. S. Depar tment of Commerce International Trade Administration Manufac turing and Ser vices Ser vices Office of Travel and Tourism Industries International Visitation to the United States: A Statistical
Naturalization Information. image: azcentral. Lafayette Urban Ministry Immigration Clinic (765) N 4th St, Lafayette, IN 47901
 N 4th St, Lafayette, IN 47901") Naturalization Information image: azcentral Lafayette Urban Ministry Immigration Clinic (765) 423-2691 420 N 4th St, Lafayette, IN 47901 Spring 2018 1 Table of Contents Introduction...3 Are you thinking
Naturalization Information image: azcentral Lafayette Urban Ministry Immigration Clinic (765) 423-2691 420 N 4th St, Lafayette, IN 47901 Spring 2018 1 Table of Contents Introduction...3 Are you thinking
geography Bingo Instructions
 Bingo Instructions Host Instructions: Decide when to start and select your goal(s) Designate a judge to announce events Cross off events from the list below when announced Goals: First to get any line
Annual Flow Report. of persons who became LPRs in the United States during 2007.
 Annual Flow Report MARCH 008 U.S. Legal Permanent Residents: 007 KELLy JEffERyS AND RANDALL MONGER A legal permanent resident (LPR) or green card recipient is defined by immigration law as a person who
Immigration and Ethno-Cultural Diversity
 2016 London Census: Fact Sheet 7 Immigration and Ethno-Cultural Diversity On October 25, 2017 Statistics Canada released the 2016 Census data on Immigration and Ethno-Cultural Diversity. This summary highlights
Lake Cowichan A Town in Cowichan Valley Regional District
 Global NonResponse Rate: 28 Population Total Change in Change in Population Number Percent Population Number Percent 1991 2,241 295 13.2 1991 to 1996 615 15 5.1 1996 2,856 28 9.8 1996 to 21 29 2 7.1 21
Highlands A District Municipality in Capital Regional District
 Produced by Stats for Global NonResponse Rate: 33 Population Total Immigrants Change in Change in Immigrants Population Number Percent Population Number Percent 1991 1,94 1991 to 1996 329 1996 1,423 21
Port McNeill A Town in Mount Waddington Regional District
 Produced by Stats for Global NonResponse Rate: 35.1 Population Total Immigrants Change in Change in Immigrants Population Number Percent Population Number Percent 1991 2,641 225 8.5 1991 to 1996 284 5
RECENT IMMIGRANTS IN METROPOLITAN AREAS. Saskatoon
 RECENT IMMIGRANTS IN METROPOLITAN AREAS Saskatoon A Comparative Profile Based on the 2001 Census April 2005 Produced by Strategic Research and Statistics For additional copies, please visit our website:
The Impact of Immi ation
 The Impact of Immi ation York City on New Peter Lob0 In 2000, New York City was home to 2.9 million immigrants, the largest number in its history. These immigrants accounted for 36 percent of the city
At Home in the Nation s Capital: Immigrant Trends in Metropolitan Washington
 Center on Urban and Metropolitan Policy Brookings Greater Washington Research Program At Home in the Nation s Capital: Immigrant Trends in Metropolitan Washington Audrey Singer June 12, 2003 Metropolitan
During the 1990s, the nation s immigrant
 Backgrounder Center for Immigration Studies September 2003 Center for Immigration Studies Where Live An Examination of Residency of the Foreign Born by Country of Origin in and By Steven A. Camarota and
Quesnel A City in Cariboo Regional District
 Produced by Stats for Global NonResponse Rate:.4 Population Total Immigrants Change in Change in Immigrants Population Number Percent Population Number Percent 1991 8,8 1,35 16.4 1991 to 1996 26 5.4 1996
North Okanagan A Regional District in British Columbia
 Population Total Immigrants Change in Change in Immigrants Population Number Percent Population Number Percent 1991 61,744 7,855 12.7 1991 to 1996 9,863 685 8.7 1996 71,67 8,54 11.9 1996 to 1 1,6-28 -
Distr. LIMITED LC/L.4008(CE.14/3) 20 May 2015 ENGLISH ORIGINAL: SPANISH
 20 May 2015 ENGLISH ORIGINAL: SPANISH") Distr. LIMITED LC/L.4008(CE.14/3) 20 May 2015 ENGLISH ORIGINAL: SPANISH Fourteenth meeting of the Executive Committee of the Statistical Conference of the Americas of the Economic Commission for Latin
Distr. LIMITED LC/L.4008(CE.14/3) 20 May 2015 ENGLISH ORIGINAL: SPANISH Fourteenth meeting of the Executive Committee of the Statistical Conference of the Americas of the Economic Commission for Latin
Logan Lake A District Municipality in Thompson-Nicola Regional District
 A District Municipality in ThompsonNicola Regional District Produced by Stats for Global NonResponse Rate: 48.9 Population Total Immigrants Change in Change in Immigrants Population Number Percent Population
Spallumcheen A District Municipality in North Okanagan Regional District
 Produced by Stats for Global NonResponse Rate: 45.4 Population Total Immigrants Change in Change in Immigrants Population Number Percent Population Number Percent 1991 4,717 66 14. 1991 to 1996 65 155
2011 CENSUS & NATIONAL HOUSEHOLD SURVEY CITY OF BRAMPTON - WARD 1 PROFILE
 CENSUS & NATIONAL HOUSEHOLD SURVEY CITY OF BRAMPTON WARD 1 PROFILE WARD HIGHLIGHTS Population 53,130 Population 51.0% Females Population by Age Group 9% 20% 014 10.14% of total population 36 Median Age
East Kootenay A Regional District in British Columbia
 Produced by Stats for Global Non-Response Rate: 35.5 Population Total Immigrants Change in Change in Immigrants Population Number Percent Population Number Percent 1991 52,368 5,9 11.3 1991 to 1996 3,998-55
Public Affairs Profile Data available for TESS experiments
 Public Affairs Profile Data available for TESS experiments Variable partyid3 DERIVED: Political party affiliation (3 categories) partyid7 DERIVED: Political party affiliation (7 categories) Values 1 Republican
Planning Study Area 1 Burnaby Heights
 Neighbourhood Profiles 2006 Census Planning Study Area 1 Heights is bounded by Burrard Inlet to the north, Willingdon Avenue to the east, Hastings Street to the south and Boundary Road to the west. PLANNING
Global Opinions on the U.S.-China Relationship
 Global Opinions on the U.S.-China Relationship Richard Wike Director of Global Attitudes Research Pew Research Center Funded largely by the Pew Charitable Trusts Non-profit, non-partisan fact tank in Washington