Canada at 150 and the road ahead A view from Census 2016
|
|
|
- Erick Wells
- 6 years ago
- Views:
Transcription

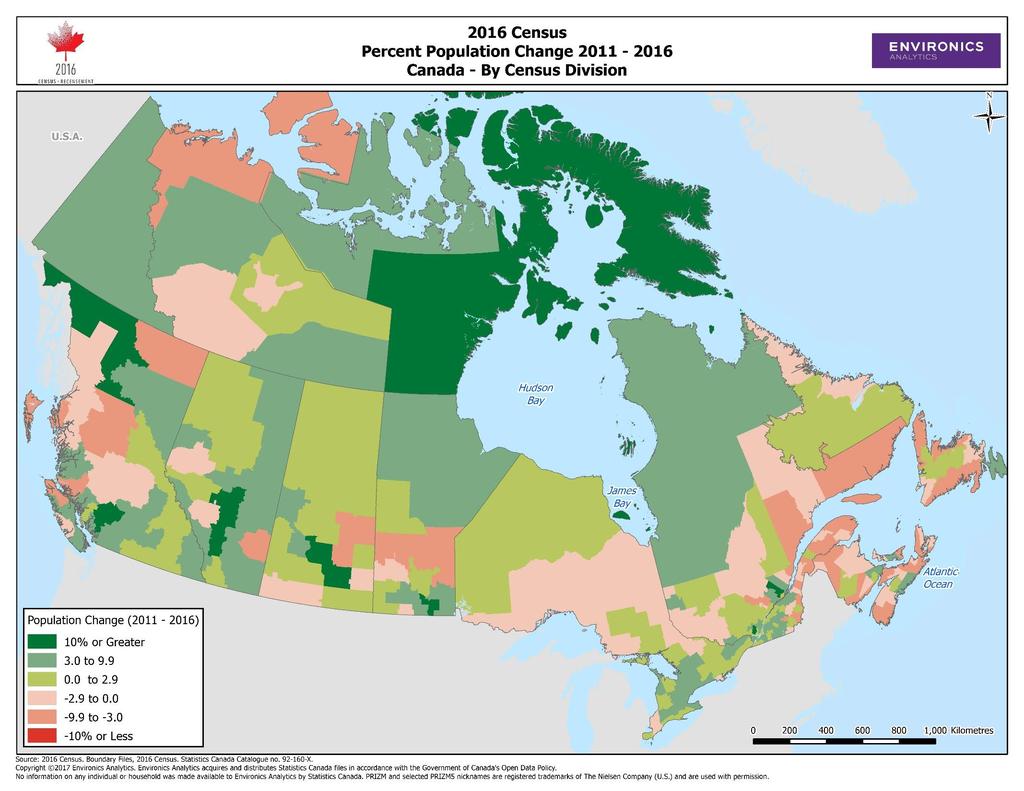
1 Canada at 150 and the road ahead A view from Census 2016 Dr. Doug Norris Senior Vice President and Chief Demographer 2017 Environics Analytics User Conference November 8, 2017

2 Canada continues to lead G7 in population growth, but growth varies across regions 2
3 Census Population (millions) Census Population Growth Rate () Growth rate at a 15 year low Immigration accounts for two-thirds of growth Census Population and Growth Rate, Canada Census Population (millions) Census Population Growth Rate () Source: Statistics Canada, various Censuses
4 All four western provinces had above-average growth Population Growth Rate (), Canada, Provinces and Territories, and to to NU AB SK MB YK BC Canada ON QC PEI NL NWT NS NB 2.9 Source: Various Censuses
5 5

6 Our Population is aging, but Canada is still young compared to other g7 countries 6
7 More Seniors than Children Percent of Population, Canada Age 0-14 Age Source: Statistics Canada, 2016 Census; Medium projections 7
8 By 2046, one in Four Canadians will be 65 Years and older Percent of Population, Canada Age 0-14 Age Source: Statistics Canada, 2016 Census; Medium projections 8
9 Why Canada is Starting to Look a Lot Older Percent Population Change , Canada Total Age Groups Source: Statistics Canada, 2016 Census 9
10 High growth of seniors population Projected Population Growth, , Canada Projected Population Growth, , Canada Total Under Total Under Source: Statistics Canada, Medium Population Projections 10
11 the suburbs are a-changin 11
12 higher growth of seniors in suburbs Growth of Population Age 65+, City Suburbs Population Aged 65+ as Percent of Total Population, 2016 City Suburbs Montreal GTA Vancouver Montreal GTA Vancouver GTA = Greater Toronto Area Source: Statistics Canada, 2016 Census 12


13 Smaller but more diverse families and households 13
14 A diversity of households Types of Households, 2016 Change in Number of Households Total 5.6 Non-family 2 or more persons 4.1 Other 3.6 Multigenerational household 2.9 One-person 28.2 Loneparent 8.9 Couple without children 25.8 Couple with children 26.5 Couple without children Couple with children Lone-parent Multigenerational Other census family Non-family 2+ persons One-person Total Households: 14,072,080 Source: Statistics Canada, 2016 Census 14
15 Trend has been for later family formation but pattern is slowing Percentage of Young Adults Married or Common-law, Canada Ages Ages Total on top Common-law 36 Married Source: Statistics Canada 2016 Census 15
16 Percentage of young adults living with parents continues to increase Young Adults Living with Parents, Canada, 2016 Ages Ages Sources: Statistics Canada, censuses of population, 1981 to
17 Number of Same-sex couples up 13 percent from 2011 Same-sex couples are 0.9 percent of all couples Count in 000 Number of Same-sex Couples, Canada Total on top Common-law Married Average household income All couples $ 87,600 Same-sex couples $ 96,900 Percent of same-sex couples with children Male 4.5 Female 20.1 Source: Statistics Canada 2016 Census 17

18 Increasing cultural diversity 18
19 Immigrants at highest level since 1931 Number and Proportion of Foreign-born Population in Canada, 1871 to 2036 Number Percentage 14,000,000 12,000,000 10,000,000 8,000,000 6,000, ,000, ,000, Source: Statistics Canada 7,540,830 Total Immigrants, ,000 Non-permanent residents, 2016
20 Immigrant numbers will continue to increase Number and Proportion of Foreign-born Population in Canada, 1871 to ,000,000 12,000,000 10,000,000 8,000,000 6,000, Number Percentage Actual 23.7 Projected ,000, ,000, Source: Statistics Canada Diversity projections 7,540,830 Total Immigrants, ,000 Non-permanent residents, 2016
21 89 countries with 10,000 or more immigrants Top Countries for Total Immigrants, 100,000 or More, Canada, 2016 Total Immigrants, 2016 Percent in Last 10 Years Total Immigrants, 2016 India China Philippines 668, , , Iran Poland Germany 154, , ,800 United Kingdom 499, United States 253, Portugal 139,400 Italy Hong Kong Pakistan Vietnam 236, , , , Jamaica Sri Lanka Korea, South France 138, , , ,600 Percent in Last 10 Years Total immigrants to Canada 7,540,825 Population growth over the past 10 years 30.1 Source: Statistics Canada, 2016 Census
22 Immigrants spreading out across the country Immigrants by Province, Canada Ontario Quebec Alberta British Columbia Manitoba Saskatchewan Nova Scotia New Brunswick Newfoundland and Labrador Prince Edward Island Immigrants , , , ,600 63,200 47,900 11,800 9,300 3,700 3,400 Percent Change from ,212,080 Total Canada Percent change: 14.8 Source: Statistics Canada, 2016 Census
23 Increased immigration from Syria, Iran and Philippines Number of Immigrants , Top Countries of Birth Percentage Change in Number of Immigrants, to Philippines 191,500 Syria India 169,300 Iran 56.4 China 139,800 Philippines 46.9 Iran 54,700 Nigeria 34.5 Pakistan 51,700 France 17.7 Syria 30,000 Pakistan 11.8 United States of America 40,000 India 9.7 France 26,500 China -7.5 United Kingdom 29,300 United States of America Nigeria 19,000 United Kingdom Source: Statistics Canada 2016 Census 23
24 immigrants increasingly speak English or French at home the longer they are in Canada Percent of Immigrants Who Speak English or French Most Often or Regularly at Home, 2016, Canada Total on top Speaks English or French regularly at home Speaks English or French most often at home All Immigrants Before Source: Statistics Canada, 2016 Census
25 Millions Over 1 in 5 are members of a visible minority group Number and Proportion of Visible Minority Population in Canada, 1981 to Number 11.2 Percentage Actual 22.3 Projected Visible Minority Population 7,674,580 Sources: Statistics Canada, 2016 Census of Population Release, and Diversity: Population Projections for Canada and its Regions, 2011 to 2036 (reference scenario)
26 Visible minority population numbers 7.6 million Visible Minority Population, 2016, Canada Percent 2+ Generations, 2016, Canada South Asian Chinese Black Filipino Arab Latin American Southeast Asian West Asian Multiple visible minorities Korean Visible minority, n.i.e. Japanese 1,924,600 1,577,100 1,198, , , , , , , , ,100 92,900 South Asian Chinese Black Filipino Arab Latin American Southeast Asian West Asian Multiple visible minorities Korean Visible minority, n.i.e. Japanese Source: Statistics Canada, 2016 Census
27 Visible minority now a majority in Toronto CMA Percent of the Population Visible Minority, CMAs, 2016, Canada Toronto 51 Ottawa - Gatineau 22 Vancouver 49 Windsor 20 Calgary Abbotsford - Mission Edmonton Winnipeg K - C - W Hamilton Regina Oshawa Saskatoon Montréal 23 Guelph 17 Canada 22 London 16 K-C-W is Kitchener - Cambridge - Waterloo Source: Statistics Canada, 2016 Census
28 Immigrants index below average on individual income, but second generation shows improvement Index of Median Individual Income, Population Aged 25-54, 2015, Canada (Total Population Aged =100) Not a visible minority Filipino Black Latin American Southeast Asian South Asian Chinese Japanese Arab Korean West Asian First Generation Index Chinese Japanese Not a visible minority Korean South Asian Filipino Arab Southeast Asian Black West Asian Latin American Second Generation Index Source: Statistics Canada, 2016 Census Median income for total population $43,300
29 Canada s Indigenous population 29
30 Close to 1.7 million aboriginal peoples in Canada Percent and Population, Aboriginal, 2016, Canada First Nations (North American Indian) 977, Métis 587, Other 43,975 3 Inuk (Inuit) 65,025 4 Total Aboriginal Population 1,673,780 Source: Statistics Canada, 2016 Census
31 Aboriginal population increased by 20 percent Population Growth, Canada Population Growth, Aboriginal Population Total Population First Nations (North American Indian) Métis Inuk (Inuit) Source: Statistics Canada, 2016 Census and 2011 National Household Survey
32 Visible minority and aboriginal populations account for all of total population growth Population Growth , Canada Total population Visible minority population Aboriginal population -0.3 Rest of population Population (millions) Source: Statistics Canada, 2016 Census
33 Nearly a quarter of Aboriginal population live in low-income Households Percent of Population Living in Low-income Households, 2015, Canada Percent of Population Living in Low-income Households by Age Group, 2015, Canada Aboriginal Non Aboriginal Age Groups Population excludes persons living on reserve or in the North Source: Statistics Canada, 2016 Census
34 Many dwellings in need of major repair, especially on reserves and in Inuit communities Percent of Population Living in Dwellings in Need of Major Repair, 2016, Canada Aboriginal Non-aboriginal On reserve Off reserve First Nations Métis Inuit Source: Statistics Canada, 2016 Census

35 Incomes increased over the decade but little change in low income 35
36 Resource-Rich provinces tend to have the highest incomes, led by Alberta Median Household Income ($), 2015, Canada Alberta Saskatchewan Ontario Canada British Columbia Manitoba Newfoundland and Labrador Prince Edward Island Nova Scotia Quebec New Brunswick 93,800 75,400 74,300 70,300 70,000 68,100 67,300 61,200 60,800 59,800 59,300 $ Percentage Change (2015$) Saskatchewan Newfoundland and Labrador Alberta Manitoba British Columbia Prince Edward Island New Brunswick Canada Nova Scotia Quebec Ontario Source: Statistics Canada, 2016 Census 36
37 Higher income increases for females, but gap remains Percentage Change in Median Individual Income, , Canada Males Females Males Females $40,782 $28, Median Income Canada (2015$) SK NL AB NS PE NB MB QC BC ON -2.4 Source: Statistics Canada, 2016 Census 37
38 Seniors spending power SOARS Population Growth, , Canada Aggregate Income Growth, , (2015$), Canada Total Ages Ages 55+ Total Ages Ages 55+ Source: Statistics Canada, Medium Population Projections 38
39 Little change in low-income except for seniors Percent of People in Low-Income Households (LIM-AT), 2016, Canada Total and over Age Groups Source: Statistics Canada, 2016 Census Note: 2015 Low-Income Threshold 1 person $22,133 2 persons $31,301 4 persons $44,266 39
40 Living arrangement of seniors have significant impact on their financial situation Median Income for Couples/Persons Aged 65 and Over, 2015$, Canada Percent of Population in Low-income Households, 2015, Canada 62, $ 28,400 8 Couple income* Living alone income Couples Living alone * At least one person is 65 or over ** Couples value is estimated Source: Statistics Canada 2016 Census 40

41 Housing #EAUC2017
42 Seniors living alone pay the most in Shelter Costs Percent Homeowners, Canada Total and over Source: Statistics Canada, 2006,2011 and 2016 Census
43 much higher growth for high-rise apartments Growth in Number of Dwellings by Type, Canada Total Single-detached Apartment 5 or more storeys Other 751, , , ,900 Growth Source: Statistics Canada, 2016 Census 43
44 Young and old most likely to live in condos Percent of Homeowners Living in Condominiums by Age Group, 2016, Canada 13.4 High-rise Other Total - all ages Age of primary household maintainer Age Groups Source: Statistics Canada, 2016 Census
45 Renters face Higher shelter costs Percent of Households Spending 30 or More of Income on Shelter Costs, 2016, Canada Owners Renters All ages Ages Ages 65 + All ages Ages Ages 65 + Source: Statistics Canada, 2016 Census 45
46 Lower income of seniors living alone means higher shelter costs Seniors Paying More than 30 of Income for Shelter Costs, 2016, Canada Total Owners Renters Total Couple Living alone Total Couple Living alone Total Couple Living alone Source: Statistics Canada, 2016 Census

47 Questions?

48 Thank You Dr. Doug Norris Senior Vice President and Chief Demographer #EAUC2017
2016 Census: Release 5 Immigration and ethnocultural diversity, Housing and the Aboriginal population
 2016 Census: Release 5 Immigration and ethnocultural diversity, Housing and the Aboriginal population Dr. Doug Norris Senior Vice President and Chief Demographer November 2, 2017 Today s presenter Dr.
The New Canada. Presented by: Dr. Darrell Bricker
 The New Canada Presented by: Dr. Darrell Bricker 2018 Darrell Bricker. All rights reserved. Contains Proprietary information and insights may not be disclosed or reproduced without the prior written consent
Canada s Visible Minorities: Andrew Cardozo and Ravi Pendakur
 Canada s Visible Minorities: 1967-2017 Andrew Cardozo and Ravi Pendakur Introduction Introductory remarks Demographic overview Labour market outcomes Policy initiatives Some defining moments Demographic
OBSERVATION. TD Economics A DEMOGRAPHIC OVERVIEW OF ABORIGINAL PEOPLES IN CANADA
 OBSERVATION TD Economics May 1, 213 A DEMOGRAPHIC OVERVIEW OF ABORIGINAL PEOPLES IN CANADA Highlights New data from the National Household Survey (NHS) show that just over 1.4 million people identified
Aboriginal Peoples in Canada: First Nations People, Métis and Inuit
 Aboriginal Peoples in Canada: First Nations People, Métis and Inuit 2011 National Household Survey (NHS) Social and Aboriginal Statistics September 16, 2013 Main analytical document Aboriginal Peoples
HOUSING RESEARCH REPORT. Household Mobility and Housing Choices
 HOUSING RESEARCH REPORT Household Mobility and Housing Choices CMHC helps Canadians meet their housing needs. Canada Mortgage and Housing Corporation (CMHC) has been helping Canadians meet their housing
DIVERSITY IN SASKATCHEWAN
 DIVERSITY IN SASKATCHEWAN Prepared for the: Saskatchewan Cooperative Association January 2016 Doug Elliott Sask Trends Monitor 444 19th Avenue Regina, Saskatchewan S4N 1H1 306-522-5515 sasktrends@sasktel.net
Immigrant and Temporary Resident Children in British Columbia
 and Temporary Resident Children in British Columbia January 2011 During the five-year period from 2005 to 2009, on average, approximately 40,000 immigrants arrived in B.C. annually and approximately 7,900
Visit our Publications and Open Data Catalogue to find our complete inventory of our freely available information products.
 Welcome to Mississauga Data This report and other related documents can be found at www.mississauga.ca/data. Mississauga Data is the official City of Mississauga website that contains urban planning related
2016 Census: Housing, Immigration and Ethnocultural Diversity, Aboriginal peoples
 October 26, 2017 Backgrounder 2016 Census: Housing, Immigration and Ethnocultural Diversity, Aboriginal peoples The 2016 Census Day was May 10, 2016. On October 25, 2017, Statistics Canada released data
PRINCE EDWARD ISLAND POPULATION REPORT 2017
 OVERVIEW PRINCE EDWARD ISLAND POPULATION REPORT 2017 DIAGRAM 1: PRINCE EDWARD ISLAND POPULATION, AS OF JULY 1, 1998-2017 155,000 150,000 145,000 140,000 135,000 130,000 On September 27, 2017 Statistics
Putting Numbers into Action: Aboriginal Data on the Statistics Canada Website
 Putting Numbers into Action: Aboriginal Data on the Statistics Canada Website Findings from the 2011 National Household Survey (NHS) Social and Aboriginal Statistics Division, Statistics Canada Outline
Alberta Immigrant Highlights. Labour Force Statistics. Highest unemployment rate for landed immigrants 9.8% New immigrants
 2016 Labour Force Profiles in the Labour Force Immigrant Highlights Population Statistics Labour Force Statistics Third highest percentage of landed immigrants in the working age population 1. 34. ON 2.
Immigration and Ethno-Cultural Diversity
 2016 London Census: Fact Sheet 7 Immigration and Ethno-Cultural Diversity On October 25, 2017 Statistics Canada released the 2016 Census data on Immigration and Ethno-Cultural Diversity. This summary highlights
Article. W Visible Minority Women. by Tina Chui and Hélène Maheux. July 2011
 Component of Statistics Canada Catalogue no. 89-503-X Women in Canada: A Gender-based Statistical Report Article W Visible Minority Women by Tina Chui and Hélène Maheux July 2011 How to obtain more information
2001 Census: analysis series
 Catalogue no. 96F0030XIE2001008 2001 Census: analysis series Canada s ethnocultural portrait: The changing mosaic This document provides detailed analysis of the 2001 Census of Population data released
CENSUS BULLETIN #5 Immigration and ethnocultural diversity Housing Aboriginal peoples
 CENSUS BULLETIN #5 Immigration and ethnocultural diversity Housing Aboriginal peoples October 25, 217 Bulletin Highlights: 86.1 per cent of the Brampton s 216 surveyed population held a Canadian citizenship
Study Area Maps. Profile Tables. W Broadway & Cambie St, Vancouver, BC Pitney Bowes 2016 Estimates and Projections. W Broadway & Cambie St
 Powered by PCensus Page 1 Study Area Maps Profile Tables 2016 Demographic Snapshot Population Trends Household Trends Population by Age and Sex Comparison Population by Age and Sex Household Maintainers
CITY OF MISSISSAUGA. Overview 2-1. A. Demographic and Cultural Characteristics
 Portraits of Peel Overview 2-1 A. Demographic and Cultural Characteristics Population: Size, Age and Growth 2-2 Immigrants 2-3 Visible Minorities 2-4 Language 2-5 Religion 2-6 Mobility Status 2-7 B. Household
The Chinese Community in Canada
 Catalogue no. 89-621-XIE No. 001 ISSN: 1719-7376 ISBN: 0-662-43444-7 Analytical Paper Profiles of Ethnic Communities in Canada The Chinese Community in Canada 2001 by Colin Lindsay Social and Aboriginal
North York City of Toronto Community Council Area Profiles 2016 Census
 Bar Chart showing the rate of population growth between the years 2006 and 2016 for the Ward compared to the City of based on the 2006 and data. For more information, please contact Michael Wright at 416-392-7558
Demographic and Economic Trends and Issues Canada, Ontario and the GTA
 Demographic and Economic Trends and Issues Canada, Ontario and the GTA Presented by Tom McCormack The Centre for Spatial Economics www.c4se.com Presented to Professional Marketing Research Society Toronto
Youth Criminal Justice in Canada: A compendium of statistics
 Youth Criminal Justice in Canada: A compendium of statistics Research and Statistics Division and Policy Implementation Directorate Department of Justice Canada 216 Information contained in this publication
Ward 4 Etobicoke Centre City of Toronto Ward Profiles 2016 Census
 Bar Chart showing the rate of population growth between the years 2006 and 2016 for the Ward compared to the City of based on the 2006 and data. For more information, please contact Michael Wright at 416-392-7558
2001 Census: analysis series
 Catalogue no. 96F0030XIE2001006 2001 Census: analysis series Profile of the Canadian population by mobility status: Canada, a nation on the move This document provides detailed analysis of the 2001 Census
2011 National Household Survey Profile on the Town of Richmond Hill: 1st Release
 2011 National Household Survey Profile on the Town of Richmond Hill: 1st Release Every five years the Government of Canada through Statistics Canada undertakes a nationwide Census. The purpose of the Census
Chairman and Members of the Planning and Development Committee. Thomas S. Mokrzycki, Commissioner of Planning and Building
 CD.15.DAT DATE: TO: FROM: SUBJECT: Chairman and Members of the Planning and Development Committee Thomas S. Mokrzycki, Commissioner of Planning and Building Mississauga: A City of Many Cultures MEETING
Understanding the Occupational Typology of Canada s Labour Force
 Understanding the Occupational Typology of Canada s Labour Force Author: Taylor Brydges, Taylor.Brydges@rotman.utoronto.ca p.416.946.7300 f.416.946.7606 Martin Prosperity Institute Joseph L. Rotman School
Will small regions become immigrants choices of residence in the. future?
 Will small regions become immigrants choices of residence in the future? By: Siyu Wang Student No. 6698166 Major paper presented to the department of economics of the University of Ottawa in partial fulfillment
Victoria A City in Capital Regional District
 Produced by Stats for Global Non-Response Rate: 24.6 Population Total Immigrants Change in Change in Immigrants Population Number Percent Population Number Percent 1991 71,228 14,665 20.6 1991 to 1996
2016 Census of Canada
 2016 Census of Canada People Introduction This release examines the demographic and geographic aspects of the identity population in Alberta from the 2016 Census. The population is relatively young and
people/hectare Ward Toronto
 Bar Chart showing the rate of population growth between the years 2006 and 2016 for the Ward compared to the City of based on the 2006 and data. For more information, please contact Michael Wright at 416-392-7558
MULTICULTURALISM IN CANADA
 MULTICULTURALISM IN CANADA Evidence and Anecdote ANDREW GRIFFITH Purpose Provide integrated view of multiculturalism Demographic, economic, social, political Latest data available Set out issues and implications
Tracking Trends in Kingston
 Tracking Trends in Photo: 22, Courtesy of City Hall Total Population: 152,358 Population Changes for CMAs, 21 to 26 25 19.2 2 15 1 11.6 9.2 8.9 8.2 6.6 59 5.9 55 5.5 54 5.4 51 5.1 51 5.1 5 5. 46 4.6 3.8
Saanich A District Municipality in Capital Regional District
 Produced by Stats for Population Total Immigrants Change in Change in Immigrants Population Number Percent Population Number Percent 1991 95,583 20,285 21.2 1991 to 1996 5,805 755 3.7 1996 101,388 21,040
Nanaimo A City in Nanaimo Regional District
 A City in Regional District Produced by Stats for Population Total Immigrants Change in Change in Immigrants Population Number Percent Population Number Percent 1991 6,129 8,885 14.8 1991 to 1996,1 2,44
Scarborough City of Toronto Community Council Area Profiles 2016 Census
 Bar Chart showing the rate of population growth between the years 2006 and 2016 for the Ward compared to the City of based on the 2006 and data. For more information, please contact Michael Wright at 416-392-7558
The Province of Prince Edward Island Food Insecurity Poverty Reduction Action Plan Backgrounder
 The Province of Prince Edward Island Food Insecurity Poverty Reduction Action Plan Backgrounder 5/17/2018 www.princeedwardisland.ca/poverty-reduction Food Insecurity SUMMARY Access to sufficient quantities
North Okanagan A Regional District in British Columbia
 Population Total Immigrants Change in Change in Immigrants Population Number Percent Population Number Percent 1991 61,744 7,855 12.7 1991 to 1996 9,863 685 8.7 1996 71,67 8,54 11.9 1996 to 1 1,6-28 -
Ward 14 Parkdale-High Park City of Toronto Ward Profiles 2016 Census
 Bar Chart showing the rate of population growth between the years 2006 and 2016 for the Ward compared to the City of based on the 2006 and data. For more information, please contact Michael Wright at 416-392-7558
RECENT IMMIGRANTS IN METROPOLITAN AREAS. Saskatoon
 RECENT IMMIGRANTS IN METROPOLITAN AREAS Saskatoon A Comparative Profile Based on the 2001 Census April 2005 Produced by Strategic Research and Statistics For additional copies, please visit our website:
Handout 1: Graphing Immigration Introduction Graph 1 Census Year Percentage of immigrants in the total population
 2001 Census Results Teacher s Kit Activity 10: Immigration and Citizenship Suggested Level: Intermediate Subjects: Mathematics, Geography, History, Citizenship Overview In this activity, students complete
Immigrant DELTA, B.C Delta Immigrant Demographics I
 Immigrant demographics DELTA, B.C. - 2018 Immigrant Demographics I Page 1 DELTA IMMIGRANT DEMOGRAPHICS Your quick and easy look at facts and figures around immigration. Newcomers are an important and growing
Strathcona A Regional District in British Columbia
 Produced by Stats for Population Total Immigrants Change in Change in Immigrants Population Number Percent Population Number Percent 1991 - - - 1991 to 1996 - - - 1996 - - - 1996 to 1 - - - 1 - - - 1 to
Immigrant. coquitlam, B.C Coquitlam Immigrant Demographics I
 Immigrant demographics coquitlam, B.C. - 2018 Immigrant Demographics I Page 1 coquitlam IMMIGRANT DEMOGRAPHICS Your quick and easy look at facts and figures around immigration. Newcomers are an important
BRAMALEA. Overview A. Demographic and Cultural Characteristics
 The Social Planning Council of Peel Portraits of Peel BRAMALEA Overview 13-1 A. Demographic and Cultural Characteristics Population: Size, Age and Growth 13-2 Immigrants 13-3 Visible Minorities 13-4 Language
North Vancouver, City of A City in Greater Vancouver Regional District
 Global Non-Response Rate: 25.8 Population Total Immigrants Change in Change in Immigrants Population Number Percent Population Number Percent 1991 38,436,8 28.2 1991 to 1996 3,39 2,46 22.7 1996 41,475
Form F5 Change of Information in Form F4 General Instructions
 Form 33-109F5 Change of Information in Form 33-109F4 General Instructions 1. This notice must be submitted when notifying a regulator of changes to Form 33-109F6 or Form 33-109F4 information in accordance
Burnaby A City in Greater Vancouver Regional District
 Produced by Stats for Global Non-Response Rate: 23.6 Population Total Change in Change in Population Number Percent Population Number Percent 1991 158,858 49,5 31.2 1991 to 1996,351 24,5 49.1 1996 179,9
Ward 17 Davenport City of Toronto Ward Profiles 2016 Census
 Bar Chart showing the rate of population growth between the years 2006 and 2016 for the Ward compared to the City of based on the 2006 and data. For more information, please contact Michael Wright at 416-392-7558
RECENT IMMIGRANTS IN METROPOLITAN AREAS. Toronto. A Comparative Profile Based on the 2001 Census April 2005
 RECENT IMMIGRANTS IN METROPOLITAN AREAS Toronto A Comparative Profile Based on the 2001 Census April 2005 Produced by Strategic Research and Statistics For additional copies, please visit our website:
Post-Secondary Education, Training and Labour January New Brunswick Analysis 2016 Census Topic: Immigration
 Post-Secondary Education, Training and Labour January 2018 New Brunswick Analysis 2016 Census Topic: Contents General Information... 2 Overview... 2 Population... 2 Demographics... 3 Sub-Provincial...
East Kootenay A Regional District in British Columbia
 Produced by Stats for Global Non-Response Rate: 35.5 Population Total Immigrants Change in Change in Immigrants Population Number Percent Population Number Percent 1991 52,368 5,9 11.3 1991 to 1996 3,998-55
SELECTED DEMOGRAPHIC TRENDS IN THE REGINA METROPOLITAN AREA
 SELECTED DEMOGRAPHIC TRENDS IN THE REGINA METROPOLITAN AREA Prepared for the: Regina Public Library Staff Development Day November 20, 2015 Doug Elliott Sask Trends Monitor 444 19th Avenue Regina, Saskatchewan
RECENT IMMIGRANTS IN METROPOLITAN AREAS. Regina. A Comparative Profile Based on the 2001 Census April 2005
 RECENT IMMIGRANTS IN METROPOLITAN AREAS Regina A Comparative Profile Based on the 2001 Census April 2005 Produced by Strategic Research and Statistics For additional copies, please visit our website: Internet:
CANADIAN DATA SHEET CANADA TOTAL POPULATION:33,476,688 ABORIGINAL:1,400,685 POPULATION THE ABORIGINAL PEOPLE S SURVEY (APS) ABORIGINAL POPULATION 32%
 ABORIGINAL POPULATION 32%") CANADA TOTAL POPULATION:33,476,688 ABORIGINAL:1,400,685 THE ABORIGINAL PEOPLE S SURVEY (APS) The 2012 Aboriginal Peoples Survey (APS) is a national survey of First Nations, Métis and Inuit people living
CANADA TOTAL POPULATION:33,476,688 ABORIGINAL:1,400,685 THE ABORIGINAL PEOPLE S SURVEY (APS) The 2012 Aboriginal Peoples Survey (APS) is a national survey of First Nations, Métis and Inuit people living
Immigrant PORT COQUITLAM, B.C Port Coquitlam Immigrant Demographics I
 Immigrant demographics PORT COQUITLAM, B.C. - 2018 Immigrant Demographics I Page 1 PORT COQUITLAM IMMIGRANT DEMOGRAPHICS Your quick and easy look at facts and figures around immigration. Newcomers are
Immigration and Ethnocultural Diversity in Quebec
 Immigration and Ethnocultural Diversity in Quebec The National Household Survey (NHS) Regional analysis January 2014 Immigration and Ethnocultural Diversity in Canada was part of the first release of data
Annual Demographic Estimates: Subprovincial Areas, July 1, 2016
 Catalogue no. 91-214-X ISSN 1920-8154 Annual Demographic Estimates: Subprovincial Areas, July 1, 2016 by Demography Division Release date: March 8, 2017 How to obtain more information For information about
MONITORING THE METROS: A MUCH-AWAITED 2011 UPDATE
 THE METRO BEAT TD Economics MONITORING THE METROS: A MUCH-AWAITED 211 UPDATE The 211 National Household Survey release on May 8 th provides a demographic and diversity update across Canada. This is the
Demographic and Socio-economic Influences on Housing Demand. n After averaging 154,000 from 1991 to 2001,
 Chapter 4 Demographic and Socio-economic Influences on Housing Demand Fast Facts n After declining during the 28-9 recession, employment grew in 21 and 211, reducing the national unemployment rate from
Permanent and temporary immigration to Canada from 2012 to 2014
 Catalogue no. 91-209-X ISSN 1718-7788 Permanent and temporary immigration to Canada from 2012 to 2014 by Laurent Martel and Carol D Aoust Release date: July 5, 2016 How to obtain more information For information
new westminster, B.C New Westminster Immigrant Demographics I
 Immigrant demographics new westminster, B.C. - 2018 Immigrant Demographics I Page 1 new westminster IMMIGRANT DEMOGRAPHICS Your quick and easy look at facts and figures around immigration. Newcomers are
TOWNSHIP OF LANGLEY, B.C Township of Langley Immigrant Demographics I
 Immigrant demographics TOWNSHIP OF LANGLEY, B.C. - 2018 Township of Langley Immigrant Demographics I Page 1 TOWNSHIP OF LANGLEY IMMIGRANT DEMOGRAPHICS Your quick and easy look at facts and figures around
Demographics. Chapter 2 - Table of contents. Environmental Scan 2008
 Environmental Scan 2008 2 Ontario s population, and consequently its labour force, is aging rapidly. The province faces many challenges related to a falling birth rate, an aging population and a large
2011 CENSUS & NATIONAL HOUSEHOLD SURVEY CITY OF BRAMPTON - WARD 1 PROFILE
 CENSUS & NATIONAL HOUSEHOLD SURVEY CITY OF BRAMPTON WARD 1 PROFILE WARD HIGHLIGHTS Population 53,130 Population 51.0% Females Population by Age Group 9% 20% 014 10.14% of total population 36 Median Age
2011 CENSUS & NATIONAL HOUSEHOLD SURVEY CITY OF BRAMPTON - WARD 3 PROFILE
 2011 CENSUS & NATIONAL HOUSEHOLD SURVEY CITY OF BRAMPTON WARD 3 PROFILE WARD HIGHLIGHTS Population 47,500 2011 Population 50.7% Females 2011 Population by Age Group 13% 18% 014 9.07% of total population
View Royal A Town in Capital Regional District
 Produced by Stats for Global NonResponse Rate: 18.4 Population Total Immigrants Change in Change in Immigrants Population Number Percent Population Number Percent 1991 5,996 9 15.6 1991 to 1996 445 315
Child and Family Poverty
 Child and Family Poverty Report, November 2009 Highlights In 2007, there were 35,000 (16.7%) children under age 18 living beneath the poverty line (before-tax Low Income Cut-off) in. has the third highest
2011 CENSUS & NATIONAL HOUSEHOLD SURVEY CITY OF BRAMPTON - WARD 4 PROFILE
 2011 CENSUS & NATIONAL HOUSEHOLD SURVEY CITY OF BRAMPTON WARD 4 PROFILE WARD HIGHLIGHTS Population 9.51% of total population 49,850 2011 Population 34 Median Age 50.5% Females 49.5% Males 2011 Population
CENSUS RESULTS WARD 8 PROFILE
 2011 CENSUS RESULTS WARD 8 PROFILE Town of Halton Hills City of Brampton Hwy. 407 Finch Ave. Town of Milton Hwy. 407 ETR Ninth Line 10 Derry Rd. Winston Churchill Blvd. 9 Erin Mills Pkwy. Mississauga Rd.
Manitoba Immigration Facts 2014 Statistical Report
 Manitoba Immigration Facts 2014 Statistical Report A message from the Minister I am pleased to present the 2014 Manitoba Immigration Facts report highlighting Manitoba s continued commitment to attracting,
Verdun borough HIGHLIGHTS. In 1996, the Verdun borough had a population of 59,714. LOCATION
 Socio-economic profile borough February 2002 HIGHLIGHTS In 1996, the borough had a population of 59,714. LOCATION Between 1991 and 1996, the population of the borough declined by 2.6%. One-person households
2011 CENSUS & NATIONAL HOUSEHOLD SURVEY CITY OF BRAMPTON - WARD 10 PROFILE
 2011 CENSUS & NATIONAL HOUSEHOLD SURVEY CITY OF BRAMPTON WARD 10 PROFILE WARD HIGHLIGHTS Population 10.72% of total population 56,185 2011 Population 33 Median Age 50.1% Females 49.9% Males 2011 Population
Castlegar A City in Central Kootenay Regional District
 Produced by Stats for Population Total Immigrants Change in Change in Immigrants Population Number Percent Population Number Percent 1991 6,579 885 13.5 1991 to 1996 448 45 5.1 1996 7,27 93 13.2 1996 to
Public Service Representation Depends on the Benchmark
 Public Service Representation Depends on the Benchmark One of the hallmarks of a successful multicultural society is the degree to which national institutions, both public and private, reflect the various
Catholic School Board Services Association
 Catholic School Board Services Association The Demographic Landscape Thursday, March 5, 2015 Jack Ammendolia Director, Education Division The Baby Boom Post WWII in Canada, the population and especially
CENSUS RESULTS WARD 9 PROFILE
 2011 CENSUS RESULTS WARD 9 PROFILE Town of Halton Hills City of Brampton Hwy. 407 Finch Ave. Town of Milton Hwy. 407 ETR Ninth Line 10 Derry Rd. Winston Churchill Blvd. 9 Erin Mills Pkwy. Mississauga Rd.
CENSUS RESULTS WARD 3 PROFILE
 2011 CENSUS RESULTS WARD 3 PROFILE Town of Halton Hills City of Brampton Hwy. 407 Finch Ave. Town of Milton Hwy. 407 ETR Ninth Line 10 Derry Rd. Winston Churchill Blvd. 9 Erin Mills Pkwy. Mississauga Rd.
Lake Country A District Municipality in Central Okanagan Regional District
 Produced by Stats for Population Total Immigrants Change in Change in Immigrants Population Number Percent Population Number Percent 1991 1991 to 1996 1996 9,7 1,275 14.2 1996 to 1 26 7 5.5 1 9,267 1,345
Salmon Arm A City in Columbia-Shuswap Regional District
 Produced by Stats for Global NonResponse Rate: 22.8 Population Total Change in Change in Population Number Percent Population Number Percent 1991 12,115 1,365 11.3 1991 to 1996 2,549 25 18.3 1996 14,664
Nelson A City in Central Kootenay Regional District
 Produced by Stats for Global NonResponse Rate: 28.3 Population Total Immigrants Change in Change in Immigrants Population Number Percent Population Number Percent 1991 8,849 1,175 13.3 1991 to 1996 736
SASKATCHEWAN STATISTICAL IMMIGRATION REPORT 2008
 SASKATCHEWAN STATISTICAL IMMIGRATION REPORT 2008 Ministry of Advanced Education, Employment and Labour Immigration Services Division Table of Contents Overview of Immigration to Saskatchewan... 1 Immigration
Conodo's Population Demographic Perspectives
 Conodo's Population Demographic Perspectives Canada's Population Demographic Perspectives One of a series from the 1976 Census of Canada Introduction The 1976 Census of Canada enumerated 23 million people,
Social and Demographic Trends in Burnaby and Neighbouring Communities 1981 to 2006
 Social and Demographic Trends in and Neighbouring Communities 1981 to 2006 October 2009 Table of Contents October 2009 1 Introduction... 2 2 Population... 3 Population Growth... 3 Age Structure... 4 3
HIGHLIGHTS. 62% with postsecondary 58% $1,081 average monthly rent. $1,026 average monthly rent. China #1 immigrant. China #1 immigrant place of birth
 HIGHLIGHTS Ward Toronto 2010 Household Income 62% with postsecondary certificate, diploma or degree 58% with postsecondary certificate, diploma or degree 30% 25% 20% 15% 10% 5% $1,081 average monthly rent
Port McNeill A Town in Mount Waddington Regional District
 Produced by Stats for Global NonResponse Rate: 35.1 Population Total Immigrants Change in Change in Immigrants Population Number Percent Population Number Percent 1991 2,641 225 8.5 1991 to 1996 284 5
Parksville A City in Nanaimo Regional District
 Produced by Stats for Global NonResponse Rate: 2.3 Population Total Immigrants Change in Change in Immigrants Population Number Percent Population Number Percent 1991 7,381 1,27 17.2 1991 to 1996 2,91
Quesnel A City in Cariboo Regional District
 Produced by Stats for Global NonResponse Rate:.4 Population Total Immigrants Change in Change in Immigrants Population Number Percent Population Number Percent 1991 8,8 1,35 16.4 1991 to 1996 26 5.4 1996
Keelesdale-Eglinton West
 BLACK CREEK DR 0-4 5-9 10-14 15-19 20-24 25-29 30-34 KEELE ST 35-39 40-44 45-49 50-54 -59 KANE AVE 60-64 65-69 70-74 75-79 80-84 85-89 90-94 95-99 100+ 2011 Neighbourhood Demographic Estimates EGLINTON
CENSUS RESULTS WARD 10 PROFILE
 2011 CENSUS RESULTS WARD 10 PROFILE Town of Halton Hills City of Brampton Hwy. 407 Finch Ave. Town of Milton Hwy. 407 ETR Ninth Line 10 Derry Rd. Winston Churchill Blvd. 9 Erin Mills Pkwy. Mississauga
Economic Challenges and Opportunities for Southwest Ontario and the GTA. Matthew Mendelsohn and Mike Moffatt February 2015
 Economic Challenges and Opportunities for Southwest Ontario and the GTA Matthew Mendelsohn and Mike Moffatt February 2015 Overview This presentation will look at: 1. Global megatrends 2. Economic outlook
CENSUS RESULTS WARD 6 PROFILE
 2011 CENSUS RESULTS WARD 6 PROFILE Town of Halton Hills City of Brampton Hwy. 407 Finch Ave. Town of Milton Hwy. 407 ETR Ninth Line 10 Derry Rd. Winston Churchill Blvd. 9 Erin Mills Pkwy. Mississauga Rd.
Skeena-Queen Charlotte A Regional District in British Columbia
 Global NonResponse Rate: 34.7 Population Total Immigrants Change in Change in Immigrants Population Number Percent Population Number Percent 1991 24,287 3,125 12.9 1991 to 1996 58 27 8.6 1996 24,795 2,855
Powell River A City in Powell River Regional District
 A City in Regional District Produced by Stats for Population Total Immigrants Change in Change in Immigrants Population Number Percent Population Number Percent 1991 12,991 1,965 15.1 1991 to 1996 14 4
Languages of work and earnings of immigrants in Canada outside. Quebec. By Jin Wang ( )
") Languages of work and earnings of immigrants in Canada outside Quebec By Jin Wang (7356764) Major paper presented to the Department of Economics of the University of Ottawa in partial fulfillment of the
Languages of work and earnings of immigrants in Canada outside Quebec By Jin Wang (7356764) Major paper presented to the Department of Economics of the University of Ottawa in partial fulfillment of the
The Labour Market Performance of Immigrant and. Canadian-born Workers by Age Groups. By Yulong Hou ( )
") The Labour Market Performance of Immigrant and Canadian-born Workers by Age Groups By Yulong Hou (7874222) Major paper presented to the Department of Economics of the University of Ottawa in partial fulfillment
The Labour Market Performance of Immigrant and Canadian-born Workers by Age Groups By Yulong Hou (7874222) Major paper presented to the Department of Economics of the University of Ottawa in partial fulfillment
HIGHLIGHTS Ward Toronto. 67% with postsecondary 58% $1,040 average monthly rent. $ $1,026 average monthly rent. China #1 immigrant place of birth
 HIGHLIGHTS Ward Toronto 2010 Household Income 67% with postsecondary certificate, diploma or degree 58% with postsecondary certificate, diploma or degree 30% 25% 20% 15% 10% 5% $1,040 average monthly rent
State of the West 2003
 State of the West 2003 Western Canadian Demographic and Economic Trends Robert Roach May 2003 F O U N D A T I O N BUILDING THE NEW WEST This report is part of the Canada West Foundation s Building the
CENSUS RESULTS WARD 7 PROFILE
 2011 CENSUS RESULTS WARD 7 PROFILE Town of Halton Hills City of Brampton Hwy. 407 Finch Ave. Town of Milton Hwy. 407 ETR Ninth Line 10 Derry Rd. Winston Churchill Blvd. 9 Erin Mills Pkwy. Mississauga Rd.