Pocket Political Education Slides & Handouts. 184 High St. Suite 603, Boston, MA,
|
|
|
- Collin Ellis
- 5 years ago
- Views:
Transcription


1 Pocket Political Education Slides & Handouts
2 The Nation in Crisis H Growing Insecurity Unstable employment Stagnant wages Insecure pensions Roller-coaster stock market H Greater Burdens Longer work hours Loss of family time Rising costs of housing, health care, education, utilities, and food H Stress, Isolation & Scapegoating Anger at immigrants Criminalization Environmental crisis Endless war 2
3 Median Adjusted Household Income by Race, Racial income inequality persists $90,000 $80,000 Asian $81,431 $70,000 $60,000 $50,000 $40,000 White Latino $65,041 $47,675 $39,490 $30,000 $20,000 Black $10, *Data on Asian Americans can be mis-leading. Many data sets group together populations of Asian immigrants that have very different civic, economic and cultural characteristics. Source: Pew Research Center s Tabulations of Current Population Survey Annual Social and Economic Supplement. 3
4 Median Annual Earnings for Women & Men, The gender wage gap continues $50,000 $45,000 Men $51,212 $40,000 $35,000 $37,608 $40,742 $30,000 $25,000 $20,000 $15,000 $22,819 Women Notes: Annual earnings data include self-employed workers; weekly data are for wage and salary workers only. Annual earnings are for people 15 years old and older beginning in 1980 and people 14 years old and older as of the following year for previous years. Before 1989 annual earnings are for civilian workers only. Weekly earnings are for full-time civilian workers aged 16 and older in and are not restricted to full-year workers. Full-time is work for at least 35 hours per week, full-year for at least 50 weeks per year. Annual median earnings data are typically released in September by the U.S. Census Bureau. The annual average of weekly median earnings is usually released in February by the U.S. Bureau of Labor Statistics. Both data series are derived from the Current Population Survey. Adjustments for data from earlier years to 2015 dollars are computed on the basis of the Consumer Price Index Research Series (CPI-U-RS); U.S. Bureau of Labor Statistics < (accessed September 2016). Source: Institute for Women s Policy Research, IWPR Fact Sheet #C446, updated September
5 Median Annual Earnings by Race and Gender, 2014 Race and gender disparities intersect $1.00 Men Women $0.75 $0.50 $0.25 White Latina/o Amerindian or Alaskan Native African American / Black Native Hawaiian & Pacific Islander Asian American* *Data on Asian Americans can be mis-leading. Many data sets group together populations of Asian immigrants that have very different civic, economic and cultural characteristics. Source: American Association of University Women (AAUW) 5
6 80% 70% 60% 50% 40% 30% 20% 10% 0% 12% Real Family Income Growth by Quintile & for Top 5% & Top 1%, The income gap has expanded +3% +12% +26% +54% +78% $29,101 - $52,698 - $82,033 - $129,007 $230,030 Up to $29,100 $52,697 $82,032 $129,006 and up and up Bottom 20% Second 20% Middle 20% Fourth 20% Top 20% Top 5% +185% $423,090 and up Top 1% Source: For quintiles and top 5%: US Census Bureau Historical Income Tables, Table F-1 (Income Limits ) and Table F-3 (Mean Income ). For income threshold for top 1%: Income Inequality in the United States, Emanuel Saez with Thomas Piketty, Quarterly Journal of Economics, updated to 2014 in Excel format, June 2015 (TabFig2014prel.xls). For percent growth: of top 1% Growing Together Growing Apart - Real Income Growth by Colin Gordon < 6
7 Real Family Income Growth by Quintile & for Top 5%, This gap wasn t as large before 120% 100% +116% +100% +111% +114% +99% +86% 80% 60% 40% 20% 0% In 1979: up to $9,861 Bottom 20% $9,861 - $16,215 Second 20% $16,215 - $22,972 Middle 20% $22,972 - $31,632 Fourth 20% $31,632 - and up Top 20% $50,746 - and up Top 5% Sources: Analysis of Census Bureau data from The State of Working America , Mishel, Lawrence and Bernstein, Jared, p. 37. Income ranges in 1979 dollars, from March 2000 Census Current Population Survey, Table F-1. 7

8 What s the Difference Between Income & Wealth? Think of a running stream that flows through a lake. Income is the money & assets that flow into the lake. Expenses are the money & assets that flow out. If there s anything left over, that s your Net Wealth. 8
9 Household Median Net Worth by Race, 2016 Net Worth is ASSETS minus DEBTS (What You OWN minus What You OWE) $171,000 $64,800 $17,600 $20,700 Black Latino All Other White Source: 9
10 Median Wealth for Single Women by Race/Ethnicity & Single White Men, 2013 Gender- and race-based disparities limit women s ability to build wealth. $30,000 $28,900 $20,000 $15,640 $10,000 $0 $200 Black Women $100 Latina Women White Women White Men Source: Center for Global Policy Solutions < 10


11 Ownership of Household Wealth in the U.S., 2016 Top 1% 39.7% The total net worth of the top 1% = $33.4 Trillion 60.3% Bottom 99% Source: Billionaire Bonanza: The Forbes 400 and the Rest of Us by Chuck Collins and Josh Hoxie 11

12 Ownership of Global Wealth, est Top 1% 48.2% 51.8% Bottom 99% Source: Global Wealth Report Credit Suisse Research Institute, October
13 The Power Shift Since the 1970s On the Rise Big Campaign Contributors Corporate Lobbyists Corporations Big Asset Owners CEOs Wall Street In Decline Popular Political Movements Voters Labor Unions Wage Earners Employees Main Street 13
14 Rule Changes Since the 1970s Policy changes reflect and reinforce the power shift. Minimum Wage: Unions: Trade: Taxes: Budget: Not raised to keep up with inflation & increased cost of living. Anti-union climate weakens the power & voice of workers. Global treaties benefit corporations, not workers or communities. Taxes descreased for the corporate elite and increased for workers. Public services cut. Corporate subsidies expand. Privatization: Government outsourcing plus no-bid contracts hurts taxpayers, workers, and public safety. Criminalization: People of color targeted, keeping racial divide in place. 14


15 The Minimum Wage and the Poverty Line, The federal minimum wage does not keep pace with the rising cost of living. $11.00 $10.00 $9.00 $8.00 $7.00 $6.00 $5.00 $4.00 $3.00 $2.00 $1.00 $0 Minimum Wage $1.60 Poverty Line $ % of the poverty wage 1968 Minimum Wage $2.90 Poverty Line $ % of the poverty wage 1979 Minimum Wage $7.25 Sources: Living wage is calculated by dividing that year s poverty threshhold for a family of four by 2080 hours (52 weeks x 40 hours). Poverty threshholds for 1968 and 1979 from U.S. Census Bureau, Historical Poverty Tables, Table 1. Poverty threshholds for 2015 from the U.S. Census Bureau, Poverty thresholds by Size of Family and Number of Children. Poverty Line $ % of the poverty wage
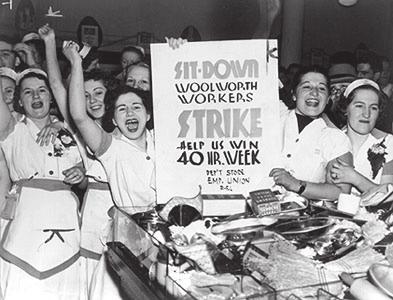
16 Percentage of the Workforce in a Union, Anti-union policies weaken the power & voice of workers. 35% 30% 25% 20% 15% 10% 5% 1937: Wagner Act 1936: Sit-Down Strike in Flint, MI 1947: Taft-Hartley Act Manufacturing Declines in U.S. 1981: Reagan Breaks PATCO Right-to-work rules Expand to 25 states 2017: 10.7% Unionized 0% Source: Bureau of Labor Statistics 16

17 Free Trade Treaties Help Corporations, Not Workers or Communities The aim of treaties such as NAFTA is to reduce barriers to trade. The worldwide result: Jobs shifted to low-wage countries Lower wages and living standards Weakened worker rights Environmental damage New trade & investment agreements, such as the Trans-Pacific Partnership (TPP)... permit foreign corporations operating in the U.S. to ignore U.S. laws that protect the environment and workers rights; threaten laws that protect community lending, health and safety, pay equity, pro-human rights government purchasing rules, public control of water & education, etc. Weakened economies in developing nations Cuts in social safety nets Rise in poverty FOR SALE 17
18 Structural Adjustment Restricts credit - no loans to small farmers Lowers tariffs & opens markets - cheap imports flood the marketplace Reduces government spending to pay back foreign debt - cuts welfare, education, health care, etc. - but continues support for the military Lowers wages & cuts price subsidies Privatizes state industries Deregulates financial markets 18
19 90% Top Marginal Income Tax Rates for the Top 1% and the Median Family, Big tax breaks for the wealthy - No tax relief for working families 91% 80% 70% Top 1% 70% 60% 50% 50% 40% 40% 35% 37% 30% Median Family 31% 20% 10% 22% 19% 25% 28% 25% 22% 0% Source: Tax Foundation < & < 19
20 80% 70% 60% 50% 40% 77% Percent of Federal Tax Collections from Individuals & Corporations Taxes have shifted from corporations to individuals. 80% 84% 87% 87% 81% 84% 30% 20% 10% 21% 17% 12% 9% 10% 11% 7% 0% Corporations Individuals Source: Congressional Budget Office, Revenues by Major Source, 1962 to (Note: 2018 projected April, 2018) 20

21 Privatizing Public Services Helps Investors, Hurts Consumers and Workers BAD IDEAS 21
22 1,600,000 U.S. State and Federal Prison Population, Incarceration has increased substantially... 1,400,000 1,476, 847 1,200,000 1,000, , , , , Source: The Sentencing Project. Fact Sheet: Trends in U.S. Corrections < 22
23 U.S. Incarceration Rates by Race, ,608 People of Color are 26% of the U.S. population yet are roughly 60% of those in prison! African American Latino White Number of people incarcerated per 100,000 Sources: U.S. Department of Justice Note: In 2010 American Indian and Alaskan Native were at 895 per 100,000 people. 23
24 Deportations from the U.S., Thousands Source: Department of Homeland Security 24

25 Boosts on the Escalator to the Middle Class Home Mortgage Interest Deduction G.I. Bill: Free College FHA Loans Social Security Homesteading Laws 25
26 Blocks on the Escalator to the Middle Class Predatory Lending Home Mortgage Redlining Interest Deduction Immigration Quotas G.I. Bill: Free College Racist Images FHA Loans Bracero Program Social Security Jim Crow Laws Homesteading Laws Slavery Loss of Land 26
27 Our Economy Devalues Women s Work When women are employed doing work performed largely by men they EARN LESS than their male counterparts. The work of child-rearing, care for the elderly and work in the home is often UNPAID WORK and is performed largely by women. Women are concentrated in the LOW-WAGE WORKFORCE. Source: Race, Gender and Work by Julie Matthaei & Teresa Amott,
28 Median Earnings by Race and Gender, 2014 Race and gender disparities intersect $1.00 Men Women $0.75 $0.50 $0.25 White Latina/o Amerindian or Alaskan Native African American / Black Native Hawaiian & Pacific Islander Asian American* *Data on Asian Americans can be mis-leading. Many data sets group together populations of Asian immigrants that have very different civic, economic and cultural characteristics. Source: American Association of University Women (AAUW) 28


29 Low-Wage Workforce by Gender and Race, % Women 37% Women of Color Women are only 46% of the total workforce but make up THREE-QUARTERS of LOW-WAGE workers. Women of color are only16% of the total workforce but make up 37% of LOW-WAGE workers. Low-Wage Workforce Source: National Women s Law Center calculations based on IPUMS-CPS (2013). The low-wage worfkforce is defined as the 10 largest low-wage occupations with median wages of less than $10.10 per hour per BLS, Occupational Employment Statistics. 29
30 Unpaid Work by Gender in the U.S. Average number of hours per week Women Men Unpaid work includes: Household management Caring for and helping household members Buying goods and services Cooking Cleaning Laundry & sewing Lawn and garden care Maintenance and repair Travel related to other unpaid work activities... Source: Notes: Pew Research Center analysis of 2012 American Time Use Survey, ATUS-X Ages 16 and older Paid-work related activities include time on the job, commute time, and any other time spent on job-related activities 30
31 The number of foreign-born people in the U.S. reflects push and pull factors such as job loss and immigration quotas. Millions 40 Total Number of Foreign-Born in the U.S Source: U.S. Census Bureau. 31
32 Percent of Foreign-Born in the U.S The percentage of foreign-born people in the U.S. reflects push and pull factors such as job loss and immigration quotas. 15% 12% % 6% % 0% Source: U.S. Census Bureau. 32


33 Our Theory of Change: Social Movements 33
 H Solidarity and Cooperation H Political & Economic Democracy H Sustainability H Pluralism and Diversity H Accountability H")
34 Principles of a Fair Economy H Equity in all dimensions (race, class, ethnicity, gender, etc.) H Solidarity and Cooperation H Political & Economic Democracy H Sustainability H Pluralism and Diversity H Accountability H Respect & Dignity for People and Planet 34


35 Strategies for Building a Fair Economy H Educate & Change the Conversation H Campaign to Build Power & Change the Rules H Connect the Dots and Build a Movement 35
36 We Need New Rules to Reduce Wealth & Income Inequality Lift the Floor for Lower Income People H Establish Living Wage standards H Raise the minimum wage H Invest in job creation & training H Increase the supply of affordable housing Level the Playing Field for Everyone H Fair taxes that treat income from investments and work the same H Postal banking services H Medicare for All H Trade policies that benefit wage-earners, consumers, & the environment H Quality education as a Constitutional right Address the Concentration of Wealth and Power H Progressive taxation of wealth and income H Reduced subsidies for excessive CEO pay H Campaign finance reform to get big money out of politics H Accountability for corporations receiving public subsidies 36
37 What You Can Do Today Educate Yourself and Others H Host a UFE Popular Economics Education workshop. H Learn to lead UFE workshops. H Educate yourself look at the resources on our list. Influence the Media H Write articles or letters to the editor. H Organize a writers group. H Stage a flash mob creative action. Build Power H Use your religious congregation as an organizing base. H Join or support a labor union. H Get involved in coalitions or civic groups. Support United for a Fair Economy H Make a donation and become a UFE member. H Encourage friends and colleagues to join. H Organize a fundraising house party. H Help us with outreach. Join Campaigns to Change the Rules H Support progressive tax proposals, such as the Robin Hood Tax. H Support local Living Wage campaigns and the Fight for $15. 37
38 Economy Quiz 1. How much larger is the total compensation for the McDonald s CEO than the average McDonald s worker?: a) 408 times larger b) 100 times larger c) 347 times larger 6. On average White women earn 81 cents to every dollar earned by White men. How much do Latina women earn compared to White men? a) 76 cents b) 65 cents c) 59 cents 2. How does the current income gap between White and Black families compare to the gap in 1967? a) The same b) It s slightly smaller today c) It s larger today 3. In 1990, the minimum wage was $3.80 an hour. In 2009, it increased to $7.25 an hour. If the minimum wage had gone up with productivity, what would it be now? a) $8.15 an hour b) $11.35 an hour c) $18.85 an hour 4. The successful candidates for U.S. Senate in 2016 spent an average of how much money on his or her Senate campaign? a) $1 million b) $5.2 million c) $10.4 million 7. Historically, what was the highest marginal tax rate on the top 1% in the United States? (The top marginal income tax rate is paid on just the amount of income above the cut-off for the top bracket.) a) 35% b) 92% c) 70% 8. According to the Social Security Administration how much money do undocumented immigrants pay into social security? (A benefit they are ineligible to receive.) a) $700 million b) $13 billion c) $2 billion 9. The richest eight people own as much wealth as how much of the global population? a) The poorest 20% b) The bottom third c) The bottom half 5. Net worth is one s assets (what you own) minus debts (what you owe). In 2013, the median net worth for White households was $141,900. What was the median net worth for African American households? a) $11,030 b) $35,800 c) $102, How powerful are we if we work together for a fair economy? a) Kinda powerful, I guess. b) Not very, if you think about it. c) Incredibly powerful, let s do this! A 62 Summer St., 2nd Fl., Boston, MA info@faireconomy.org
39 Bottom Quintile $0-29,100 B
40 Second Quintile $29,101-52,697 C
41 Middle Quintile $52,698-82,032 D
42 Fourth Quintile $82, ,006 E
43 Top Quintile $129,007 and up F
44 Top 5% $230,030 and up G
45 Top 1% $423,090 and up H

46 GOVERNMENT BOOSTS AND BLOCKS TO BUILDING WEALTH 62 Summer St., 2nd Fl., Boston MA Boosts Pre 1776 Land Grants to Colonists Indian Land Thefts 1830 Indian Removal Act 1865, th and 14 th Amendments 1849 Gold Rush 1790 Land Claims 1862 Naturalization 1853 Homestead Act Preemptive Acts 1776 Acts Civil War Open Doors to European Immigration 1887 Allotment Act 1893 Hawai i Annexed Freedmen s Bureau 1913 Home Mortgage Interest Deduction WW I 1934 Indian Reorganization Act 1935 New Deal Federal Housing Loans Social Security 1944 Labor Rights GI Bill Colonial Early US 1840s 1850s 1860s 1870s 1880s 1890s 1900s 1910s 1920s 1930s 1940s 1950s 1960s 1970s 1980s 1990s 2000s 2010s Great Depression WW II 1952 Asian Naturalization 1953 Tribal Termination 1962 Cuban Refugee Assistance Act 1964 Civil Rights Act & Affirmative Action Vietnam W ar 1968 Tribal Taxation 1977 Community Reinvestment Act 1986 Amnesty for Immigrants 1988 Japanese Reparations 1997 Tax Cuts for Asset Owners Subprime Mortgage Bubble Election of Obama Blocks 1787 Slavery in Constitution 1824 Monroe Doctrine 1850 Fugitive Slave Law 1848 Mexican Land Loss Annexation of Mexican Land Jim Crow Laws 1882 Chinese Exclusion Act & Other Asian Exclusions 1896 Plessy (Segregation Legal) 1898 Annexation of Puerto Rico 1935 FHA Redlining 1919 English Only Laws US Border Bracero Patrol Program 1960 Farm Loss Due to USDA 1954 Operation Wetback 1965 Immigration Quotas 1994 NAFTA Denial of Naturalization 1898 Possession of Philippines 1913 Alien Land Laws Japanese Internment I
47 PUSH & PULL FACTORS OF IMMIGRATION TO THE U.S. 11M 10,400,000 10M 9M 8,795,386 9,095,417 Number of Immigrants 8M 7M 6M 5M 4M 3M 2M 1M 0 151, s 599, s 1,713, s 2,598, s 2,314, s 7,338,062 5,735,811 5,246,613 4,493,314 4,107,209 3,687,564 3,321,677 2,812,191 2,515,479 1,035, , % 13.3% 14.8% 13.6% 14.7% 13.2% 11.6% 8.8% 6.9% 5.4% 4.7% 6.2% 7.9% 10.4% 1870s 1880s 1890s 1900s 1910s 1920s 1930s 1940s 1950s 1960s 1970s 1980s 1990s 2000s 12.7% PUSH Factors Trends & Events Outside the U.S Britain repeals Passenger Acts 1827 Monroe Doctrine (1823) Irish Potato Famine Mexican- American War Treaty of Guadalupe Hidalgo (1848) Industrial Revolution in Europe Pogroms in Russia and Ukraine WW I Deportations of Mexicans WW II Korean War Vietnam War Structural Adjustment Programs U.S.-lead War on Drugs in Latin America U.S. Military Intervention in Central America Free Trade Agreements Slavery WW I Great Depression WW II Free Trade Agreements PULL Factors Trends, Events, Policies & Laws Inside the U.S Indian Civil War Homestead Act (1862) 14th Amendment (1868) Industrial Revolution in the U.S. J Bracero Program Displaced Persons Act 1948 Embargo of Cuba Immigrant Act of 1965 OTHER LAWS & POLICIES AFFECTING MIGRATION TO THE U.S. Naturalization Act of 1790 Immigration Act of 1819 Chinese Exclusion Acts ( ) Contract Labor Law of 1885 Immigration Act of 1891 Immigration Act of 1907 Immigration Act of 1917 Emergency Quota Act of 1921 Immigration Act of 1924 Tyding- McDuffie Act 1934 McCarran- Walter Act of 1952 IndoChina Migration & Refugee Assistance Act Immigrant Reform & Control Act 1986 Prop USA PATRIOT Act 2001 Illegal Immigration Reform & Immigrant Responsibilities Act 1996 Creation of ICE 2003 Financial Crisis & Great Recession J
48 Attitudes Toward Immigrants - 1 [Immigrants of this group] threaten nothing less than the possibility of a great and perilous change in the very fabric of our [Anglo-Saxon] race. If a lower race mixes with a higher in sufficient numbers, history teaches us that the lower race will prevail. K
49 Attitudes Toward Immigrants - 2 With respect to [these immigrants] we are committing cultural suicide. The barbarians at the gate will only need to give us a slight push, and the emancipated body of Western Civilization will collapse in a heap. L
50 Attitudes Toward Immigrants - 3 When the hordes of other lands are permitted to come here, as is the case daily; when ignorance, poverty, crime is allowed to land upon our shores... it is time that good men lifted their arms and sounded their voices against the abomination... Because it is every day weakening the strength, and destroying the character of the country. America can only be America by keeping it American. Americans must fill our offices, great and small... This is OUR land. We own it. M
51 Attitudes Toward Immigrants - 4 [Immigrants of this nationality] are a riffraff of desperate scoundrals, ex-convicts, and jailbirds. N
52 Attitudes Toward Immigrants - 5 [The immigrants of this nationality] are nothing but imported beggars and animals, a mongrel mass of ignorance and crime and superstition, as utterly unfit for society s duties as they are for the common courtesies and decencies of civilized life. O
53 Attitudes Toward Immigrants 1. Italian immigrants in New York City Senator Henry Cabor Lodge (1909) 2. Mexicans Congressman Tom Tancredo, In Mortal Danger - The Battle for America s Borders and Security (2006) 3. German and Catholic immigrants The American Crusader (1854) 4. Russians, Hungarians, Poles, Italians, Greeks, and Asians NYC Police Commissioner Theodore Bingham (1908) 5. Irish The American Standard, a New Jersey newspaper (1859) P
The Charactaristics & Consequences of a Capitalist Economy. 62 Summer St. Boston, MA,
 The Charactaristics & Consequences of a Capitalist Economy 62 Summer St. Boston, MA, 02110 www.faireconomy.org info@faireconomy.org 617-423-2148 Defining Capitalism An economic system in which a country
Race, Ethnicity, and Economic Outcomes in New Mexico
 Race, Ethnicity, and Economic Outcomes in New Mexico Race, Ethnicity, and Economic Outcomes in New Mexico New Mexico Fiscal Policy Project A program of New Mexico Voices for Children May 2011 The New Mexico
THE COLOR OF ENTREPRENEURSHIP Why the Racial Gap among Firms Costs the U.S. Billions
 APRIL 2016 Why the Racial Gap among Firms Costs the U.S. Billions BY ALGERNON AUSTIN Businesses owned by people of color are playing an important part in restoring the health of the American economy after
United States Migration Patterns (International and Internal)
") United States Migration Patterns (International and Internal) US Immigration Patterns Three main eras of international migration to the U.S. Colonial/Early U.S. immigration (1700 early 1800s) British
United States Migration Patterns (International and Internal) US Immigration Patterns Three main eras of international migration to the U.S. Colonial/Early U.S. immigration (1700 early 1800s) British
Unlocking Opportunities in the Poorest Communities: A Policy Brief
 Unlocking Opportunities in the Poorest Communities: A Policy Brief By: Dorian T. Warren, Chirag Mehta, Steve Savner Updated February 2016 UNLOCKING OPPORTUNITY IN THE POOREST COMMUNITIES Imagine a 21st-century
THEORIES OF ASSIMILATION - LeMay Ch. 2
 THEORIES OF ASSIMILATION - LeMay Ch. 2 What is assimilation? Cultural norms: food, clothing, etc. Job Market Outgroup marriage Identification as hyphenated Americans Less prejudice by majority No discrimination
CASE 12: INCOME INEQUALITY, POVERTY, AND JUSTICE
 CASE 12: INCOME INEQUALITY, POVERTY, AND JUSTICE The Big Picture The headline in the financial section of the January 20, 2015 edition of USA Today read, By 2016 1% will have 50% of total global wealth.
Racial Inequities in the Washington, DC, Region
 W A S H I N G T O N A R E A R E S E A R C H I N I T I A T V E Racial Inequities in the Washington, DC, Region 2011 15 Leah Hendey December 2017 The Washington, DC, region is increasingly diverse and prosperous,
Illegal Immigration: How Should We Deal With It?
 Illegal Immigration: How Should We Deal With It? Polling Question 1: Providing routine healthcare services to illegal Immigrants 1. Is a moral/ethical responsibility 2. Legitimizes illegal behavior 3.
We could write hundreds of pages on the history of how we found ourselves in the crisis that we see today. In this section, we highlight some key
 We could write hundreds of pages on the history of how we found ourselves in the crisis that we see today. In this section, we highlight some key events that illustrate the systemic nature of the problem
Labor Force Characteristics by Race and Ethnicity, 2015
 Cornell University ILR School DigitalCommons@ILR Federal Publications Key Workplace Documents 9-2016 Labor Force Characteristics by Race and Ethnicity, 2015 Bureau of Labor Statistics Follow this and additional
Globalization: It Doesn t Just Happen
 Conference Presentation November 2007 Globalization: It Doesn t Just Happen BY DEAN BAKER* Progressives will not be able to tackle the problems associated with globalization until they first understand
HUMAN GEOGRAPHY. By Brett Lucas
 HUMAN GEOGRAPHY By Brett Lucas MIGRATION Migration Push and pull factors Types of migration Determining destinations Why do people migrate? Push Factors Pull Factors Emigration and immigration Change in
Immigration defines North America. Immigration to the U.S. from the late 1800 s to Now
 Immigration defines North America Immigration to the U.S. from the late 1800 s to Now Immigrants of the Late 1800 s - Where? 3 Western European countries in particular provided the most immigrants England,
Immigrants in the Economy / Immigrant Entrepreneurship
 11.947 Race, Immigration and Planning Session 5 Lecture Notes: J. Phillip Thompson Immigrants in the Economy / Immigrant Entrepreneurship I. The Economy: a. What was the role of slavery in the U.S. Economy?
Immigration and Discrimination. Effects of the Industrial Revolution
 Immigration and Discrimination Effects of the Industrial Revolution Types of Immigration Push problems that cause people to leave their homeland. Pull factors that draw people to another place. Where
Testimony to the United States Senate Budget Committee Hearing on Opportunity, Mobility, and Inequality in Today's Economy April 1, 2014
 Testimony to the United States Senate Budget Committee Hearing on Opportunity, Mobility, and Inequality in Today's Economy April 1, 2014 Joseph E. Stiglitz University Professor Columbia University The
U.S. Family Income Growth
 Figure 1.1 U.S. Family Income Growth Growth 140% 120% 100% 80% 60% 115.3% 1947 to 1973 97.1% 97.7% 102.9% 84.0% 40% 20% 0% Lowest Fifth Second Fifth Middle Fifth Fourth Fifth Top Fifth 70% 60% 1973 to
Regional Data Snapshot
 Regional Data Snapshot Population, Economy & Education Features SET Civic Forum Glacial Lakes Region, South Dakota Table of Contents 01 Overview 03 Human Capital 02 Demography 04 Labor Force 01 overview
Index. G Gaertner, S.L., 3
 A Act Affordable Care, 21 Chinese Exclusion of 1882, 35, 41 Civil Rights, 31 Displaced Persons, 45 Foreign Miners License, 34 Geary, 35 Illegal Immigration Reform and Immigrant Responsibility, 45 Immigration
Persistent Inequality
 Canadian Centre for Policy Alternatives Ontario December 2018 Persistent Inequality Ontario s Colour-coded Labour Market Sheila Block and Grace-Edward Galabuzi www.policyalternatives.ca RESEARCH ANALYSIS
CREATING THE U.S. RACIAL ORDER DYNAMIC 3: IMMIGRATION
 CREATING THE U.S. RACIAL ORDER DYNAMIC 3: IMMIGRATION CREATING THE U.S. RACIAL ORDER 1. Enslavement and Racial Domination 2. Conquest and Dispossession 3. Immigration and Racialized Incorporation IMMIGRATION
Structural Change: Confronting Race and Class
 Structural Change: Confronting Race and Class THE KIRWAN INSTITUTE FOR THE STUDY OF RACE AND ETHNICITY & ISAIAH OHIO ORGANIZING COLLABORATIVE WEEKLONG TRAINING TOLEDO, OH JULY 19, 2010 Presentation Overview
The ten years since the start of the Great Recession have done little to address
 BUDGET & TAX CENTER December 2017 ENJOY READING THESE REPORTS? Please consider making a donation to support the Budget & tax Center at www.ncjustice.org MEDIA CONTACT: PATRICK McHUGH 919/856-2183 patrick.mchugh@ncjustice.org
CLACLS. A Profile of Latino Citizenship in the United States: Demographic, Educational and Economic Trends between 1990 and 2013
 CLACLS Center for Latin American, Caribbean & Latino Studies A Profile of Latino Citizenship in the United States: Demographic, Educational and Economic Trends between 1990 and 2013 Karen Okigbo Sociology
Chapter 6: Women-Owned and Minority-Owned Businesses
 Chapter 6: Women-Owned and Minority-Owned Businesses 1 Learning Objectives To realize women-owned businesses have grown rapidly since 1980 as a result of many factors To understand why women-owned businesses
Minorities in American Society (SYD 3700) Concepts, Themes, History, and Theories Healy Text
 Concepts, Themes, History, and Theories Healy Text") 1 Minorities in American Society (SYD 3700) Concepts, Themes, History, and Theories Healy Text Chapter 1: What is a minority group? Inequality --Most important defining characteristic of minority groups.
1 Minorities in American Society (SYD 3700) Concepts, Themes, History, and Theories Healy Text Chapter 1: What is a minority group? Inequality --Most important defining characteristic of minority groups.
Chapter 1: Objectives
 Chapter 1: Objectives Identify Texas political party activists and government officials to inform participation in the political affairs of the state and its counties, cities, and special districts. Understand
Environmental Justice Demographic Profile
 CENTRAL PUGET SOUND REGION Environmental Justice Demographic Profile January 2016 Contents INTRODUCTION... 3 OBJECTIVES... 4 DEFINITIONS... 4 Minority Populations... 4 Low-Income Population... 4 Other
Recent Job Loss Hits the African- American Middle Class Hard
 cepr CENTER FOR ECONOMIC AND POLICY RESEARCH Briefing Paper Recent Job Loss Hits the African- American Middle Class Hard John Schmitt 1 October 2004 CENTER FOR ECONOMIC AND POLICY RESEARCH 1611 CONNECTICUT
Chinese Americans. Chinese Americans - Characteristics (2010 ACS)
") Asian Americans are a diverse group in the United States. According to the U.S. Census Bureau, Asian refers to a person having origins in any of the original peoples of the Far East, Southeast Asia or
Asian Americans are a diverse group in the United States. According to the U.S. Census Bureau, Asian refers to a person having origins in any of the original peoples of the Far East, Southeast Asia or
BY Rakesh Kochhar FOR RELEASE MARCH 07, 2019 FOR MEDIA OR OTHER INQUIRIES:
 FOR RELEASE MARCH 07, 2019 BY Rakesh Kochhar FOR MEDIA OR OTHER INQUIRIES: Rakesh Kochhar, Senior Researcher Jessica Pumphrey, Communications Associate 202.419.4372 RECOMMENDED CITATION Pew Research Center,
Historical timeline of race relations
 Historical timeline of race relations Introduction The most helpful conversations about race happen when people have knowledge of the racialized history of the United States. Racialized historical data
LWV New Mexico Immigration Study
 LWV New Mexico Immigration Study Editorial comment: This study was authorized almost a year ago. I have collected a large amount of material. It is possible the Congress will pass immigration reform this
Poverty and Progress: The State of Being Poor in Arizona and the New Threats Ahead
 November 1, 2017 Poverty and Progress: The State of Being Poor in Arizona and the New Threats Ahead Participation in federal and state programs has contributed to welcome progress in the fight against
Working women have won enormous progress in breaking through long-standing educational and
 THE CURRENT JOB OUTLOOK REGIONAL LABOR REVIEW, Fall 2008 The Gender Pay Gap in New York City and Long Island: 1986 2006 by Bhaswati Sengupta Working women have won enormous progress in breaking through
Regional Data Snapshot
 Regional Data Snapshot Population, Economy & Education Features SET Civic Forum East Central NM, New Mexico Table of Contents 01 Overview 03 Human Capital 02 Demography 04 Labor Force 01 overview East
Immigrants are playing an increasingly
 Trends in the Low-Wage Immigrant Labor Force, 2000 2005 THE URBAN INSTITUTE March 2007 Randy Capps, Karina Fortuny The Urban Institute Immigrants are playing an increasingly important role in the U.S.
GRADE 5. United States Studies: 1865 to the Present
 Standard 5-1: The student will demonstrate an understanding of Reconstruction and its impact on the United States. Reconstruction was a period of great hope, incredible change, and efforts at rebuilding.
FISCAL POLICY INSTITUTE
 FISCAL POLICY INSTITUTE Learning from the 90s How poor public choices contributed to income erosion in New York City, and what we can do to chart an effective course out of the current downturn Labor Day,
Spotlight on the 50+ AAPI Population
 Spotlight on the 50+ AAPI Population Survey research and analysis by AAPI Data October 2015 Supported by Summary The Asian American, Native Hawaiian, and Pacific Islander population above the age of 50
U.S. immigrant population continues to grow
 U.S. immigrant population continues to grow Millions 45 40 35 30 25 20 15 10 5 0 Source: PEW Research Center. All foreign-born immigrants Unauthorized immigrants 40.4 38.0 31.1 12.0 11.1 8.4 2000 2007
Immigration and American Identity
 America as Nation of Immigrants Immigration and American Identity 1 Give me your tired, your poor, Your huddled masses yearning to breathe free, The wretched refuse of your teeming shore, Send these, the
UNDOCUMENTED AMERICANS CARLOS ADOLFO GONZALEZ
 UNDOCUMENTED AMERICANS CARLOS ADOLFO GONZALEZ STAT E W I D E C A PAC I T Y B U I L D I N G C O O R D I N ATO R P E N N SY LVA N I A I M M I G R AT I O N & C I T I Z E N S H I P C OA L I T I O N MYTH VS.
Public Opinion A A P I D ATA. Part of the State of Asian Americans and Pacific Islanders Series
 A A P I D ATA Public Opinion Part of the State of Asian Americans and Pacific Islanders Series By Karthick Ramakrishnan and Farah Z. Ahmad April 23, 2014 Where do Asian Americans and Pacific Islanders,
lived in this land for SF Bay Before European migration million+ Native peoples. Ohlone people who first to U.S = home to 10 Area.
 Before European migration to U.S = home to 10 million+ Native peoples. Ohlone people who first lived in this land for SF Bay Area. A few hundred English Pilgrims, seeking their religious freedom in the
CHAPTER 17. Economic Policymaking CHAPTER OUTLINE
 CHAPTER 17 Economic Policymaking CHAPTER OUTLINE I. Introduction (pp. 547 548) A. Capitalism is an economic system in which individuals and corporations own the principal means of production. B. A mixed
Demographic Changes, Health Disparities, and Tuberculosis
 Demographic Changes, Health Disparities, and Tuberculosis Joan M. Mangan, PhD, MST October 22, 2015 Delivering Culturally Competent Patient Education and Care to Tuberculosis Program Clients Austin, TX
Racial Inequities in Montgomery County
 W A S H I N G T O N A R E A R E S E A R C H I N I T I A T I V E Racial Inequities in Montgomery County Leah Hendey and Lily Posey December 2017 Montgomery County, Maryland, faces a challenge in overcoming
Oxfam Education
 Background notes on inequality for teachers Oxfam Education What do we mean by inequality? In this resource inequality refers to wide differences in a population in terms of their wealth, their income
Documentation and methodology...1
 Table of contents Documentation and methodology...1 Chapter 1 Overview: Policy-driven inequality blocks living-standards growth for low- and middle-income Americans...5 America s vast middle class has
Chapter 10. Resource Markets and the Distribution of Income. Copyright 2011 Pearson Addison-Wesley. All rights reserved.
 Chapter 10 Resource Markets and the Distribution of Income Resource markets differ from markets for consumer goods in several key ways First, the demand for resources comes from firms producing goods and
Plessy versus Ferguson (1896) Jim Crow Laws. Reactions to Brown v Board. Brown versus the Board of Education of Topeka, Kansas (1954)
 Jim Crow Laws. Reactions to Brown v Board. Brown versus the Board of Education of Topeka, Kansas (1954)") Unit II: UNDERSTANDING DOMINANT-MINORITY RELATIONS IN THE UNITED STATES TODAY SOC/SWK 410 Kimberly Baker-Abrams Focus on African Americans Jim Crow Laws series of laws put in place to disenfranchize the
Unit II: UNDERSTANDING DOMINANT-MINORITY RELATIONS IN THE UNITED STATES TODAY SOC/SWK 410 Kimberly Baker-Abrams Focus on African Americans Jim Crow Laws series of laws put in place to disenfranchize the
Ending Poverty is important because, as Nelson Mandela said: Ending Poverty is vital because the world economy is at a crossroads.
 Ending Poverty is important because, as Nelson Mandela said: "Poverty is not an accident...it is man-made and can be removed by the actions of human beings." Ending Poverty is vital because the world economy
4. During the late 1800s, the port of entry for the majority of immigrants was a. Boston b. New York City c. Philadelphia d.
 Chapters 14-18 Presentations Test 1. The cruise of the Great White Fleet showed that a. the Atlantic could be crossed safely. b. Great Britain was a second-rate power. c. the United States was a naval
4/3/2016. Emigrant vs. Immigrant. Civil Rights & Immigration in America. Colonialism to Present. Early Civil Rights Issues
 Civil Rights & Immigration in America Colonialism to Present Emigrant vs. Immigrant An emigrant leaves his or her land to live in another country. The person is emigrating to another country. An immigrant
Jeopardy Q $100 Q $100 Q $100 Q $100 Q $100 Q $200 Q $200 Q $200 Q $200 Q $200 Q $300 Q $300 Q $300 Q $300 Q $300 Q $400 Q $400 Q $400 Q $400 Q $400
 Jeopardy The Social Side of Global II Political Changes of Global II It $ all about the Benjamin$ What happened back in the 19 th Century? The Good Ole Days of the 20 th Century Q $100 Q $200 Q $300 Q
Historical Timeline of Public Education in the US
 Historical Timeline of Public Education in the US 1647 The General Court of the Massachusetts Bay Colony decrees that every town of fifty families should have an elementary school and that every town of
The Largest mass movement in Human History - From 1880 to 1921, a record-setting 23 million immigrants arrived on America s shores in what one
 The Largest mass movement in Human History - From 1880 to 1921, a record-setting 23 million immigrants arrived on America s shores in what one scholar called the largest mass movement in human history.
Public Policy Study Guide
 Name: Date: 1. We Americans live in a world we can no longer dominate, but from which we cannot isolate ourselves. The author or this quotation is saying that the United States should A. become less dependent
The State of Working Wisconsin 2017
 The State of Working Wisconsin 2017 Facts & Figures Facts & Figures Laura Dresser and Joel Rogers INTRODUCTION For more than two decades now, annually, on Labor Day, COWS reports on how working people
DATA PROFILES OF IMMIGRANTS IN THE DISTRICT OF COLUMBIA
 DATA PROFILES OF IMMIGRANTS IN THE DISTRICT OF COLUMBIA LATINO IMMIGRANTS Demographics Economic Opportunity Education Health Housing This is part of a data series on immigrants in the District of Columbia
Look Ahead. Monday (10/10) elearning quiz 5. Wednesday (10/12) 5:45-7:15 PM at Library Annex 410 out-of-class showing of film, Claiming Open Spaces
 elearning quiz 5. Wednesday (10/12) 5:45-7:15 PM at Library Annex 410 out-of-class showing of film, Claiming Open Spaces") Look Ahead Monday (10/10) elearning quiz 5. Wednesday (10/12) 5:45-7:15 PM at Library Annex 410 out-of-class showing of film, Claiming Open Spaces Friday (10/14) Your second essay. Leisure Patterns among
Look Ahead Monday (10/10) elearning quiz 5. Wednesday (10/12) 5:45-7:15 PM at Library Annex 410 out-of-class showing of film, Claiming Open Spaces Friday (10/14) Your second essay. Leisure Patterns among
Regional Data Snapshot
 Regional Data Snapshot Population, Economy & Education Features SET Civic Forum Uwharrie Region, NC Table of Contents 01 Overview 03 Human Capital 02 Demography 04 Labor Force 01 overview Uwharrie Region,
Brazilians. imagine all the people. Brazilians in Boston
 Brazilians imagine all the people Brazilians in Boston imagine all the people is a series of publications produced by the Boston Redevelopment Authority for the Mayor s Office of Immigrant Advancement.
BECOMING A WORLD POWER
 BECOMING A WORLD POWER CHAPTER 10 IMPERIALISM THE PRESSURE TO EXPAND Americans had always sought to expand the size of their nation, and throughout the 19th century they extended their control toward the
Answers to Review Timeline
 Answers to Review Timeline Colonial History 1607 Jamestown 1619 VA House of Burgesses & first African Slaves 1620 Mayflower compact 1636 Harvard 1639 Fundamental Orders of Connecticut 1647 Massachusetts
An Equity Assessment of the. St. Louis Region
 An Equity Assessment of the A Snapshot of the Greater St. Louis 15 counties 2.8 million population 19th largest metropolitan region 1.1 million households 1.4 million workforce $132.07 billion economy
We know that the Latinx community still faces many challenges, in particular the unresolved immigration status of so many in our community.
 1 Ten years ago United Way issued a groundbreaking report on the state of the growing Latinx Community in Dane County. At that time Latinos were the fastest growing racial/ethnic group not only in Dane
DEMOGRAPHIC PROFILE Skagit County, Washington. Prepared by: Skagit Council of Governments 204 West Montgomery Street, Mount Vernon, WA 98273
 DEMOGRAPHIC PROFILE 2013 Skagit County, Washington Prepared by: Skagit Council of Governments 204 West Montgomery Street, Mount Vernon, WA 98273 CONTENTS TABLE OF CONTENTS Introduction... 1 Persons and
Based on our analysis of Census Bureau data, we estimate that there are 6.6 million uninsured illegal
 Memorandum Center for Immigration Studies September 2009 Illegal Immigrants and HR 3200 Estimate of Potential Costs to Taxpayers By Steven A. Camarota Based on our analysis of Census Bureau data, we estimate
Institute for Public Policy and Economic Analysis
 Institute for Public Policy and Economic Analysis The Institute for Public Policy and Economic Analysis at Eastern Washington University will convey university expertise and sponsor research in social,
Immigrants and Urbanization: Immigration. Chapter 15, Section 1
 Immigrants and Urbanization: Immigration Chapter 15, Section 1 United States of America Give me your tired, your poor, your huddled masses yearning to breathe free. The wretched refuse of your teeming
Candidate Questionnaire for Endorsement Request
 Candidate Questionnaire for Endorsement Request Our Revolution seeks to empower the next generation of progressive leaders by inspiring and recruiting progressive candidates to run for offices across the
Chapter 17. The Labor Market and The Distribution of Income. Microeconomics: Principles, Applications, and Tools NINTH EDITION
 Microeconomics: Principles, Applications, and Tools NINTH EDITION Chapter 17 The Labor Market and The Distribution of Income A key factor in a worker s earnings is educational attainment. In 2009, the
Immigration and the U.S. Economy
 Immigration and the U.S. Economy Pia M. Orrenius, Ph.D. Federal Reserve Bank of Dallas June 19, 2007 Mercatus Center, George Mason University Disclaimer: The views expressed herein are those of the presenter;
Selected National Demographic Trends
 Selected National Demographic Trends Tawara D. Goode Director, Georgetown University National Center for Cultural Competence Assistant Professor, Center for Child and Human Development Spring 2016 University
$15. Bigger paychecks, more good jobs, & thriving communities. Why raising the minimum wage is good for everyone in North Carolina.
 Bigger paychecks, more good jobs, & thriving communities March 2019 Why raising the minimum wage is good for everyone in North Carolina By ALLAN FREYER, DIRECTOR A FOUR-PART SERIES FROM $15 per hour by
A Summary of the U.S. House of Representatives Fiscal Year 2013 Budget Resolution
 A Summary of the U.S. House of Representatives Fiscal Year 2013 Budget Resolution Prepared by The New England Council 98 North Washington Street, Suite 201 331 Constitution Avenue, NE Boston, MA 02114
The Racial Dimension of New York s Income Inequality
 The Racial Dimension of New York s Income Inequality Data Brief, March 2017 It is well-known that New York State has one of the highest degrees of income inequality among all fifty states, and that the
CHANGES IN AMERICAN CIVIL SOCIETY AND THE RISE OF POLITICAL EXTREMISM
 CHANGES IN AMERICAN CIVIL SOCIETY AND THE RISE OF POLITICAL EXTREMISM Theda Skocpol Harvard University International Society for Third Sector Research Stockholm, Sweden, June 29, 2016 The Puzzle of Current
Timeline of U.S. Immigration
 Timeline of U.S. Immigration Marcia Drew Hohn, EdD IMMIGRANT STUDENT SUCCESS: Models & Tools for K-12 & Adult Educators Online Workshop The ILC Public Education Institute Malden, MA Settlers in early 1600s:
Latinos in Saratoga County. Trudi Renwick Senior Economist Fiscal Policy Institute April 26, 2008
 Latinos in Saratoga County Trudi Renwick Senior Economist Fiscal Policy Institute April 26, 2008 1 Fiscal Policy Institute set out to take a calm look at the real role of immigrants in New York Working
Understanding Racial Inequity in Alachua County
 Understanding Racial Inequity in Alachua County (January, 2018) Hector H. Sandoval (BEBR) Department of Economics College of Liberal Arts and Sciences University of Florida Understanding Racial Inequity
Beyond Categorical Thinking
 Beyond Categorical Thinking November 2, 2014 Rev. Dr. Jim Sherblom First Parish in Brookline We hold these truths to be self-evident, that all [people] are created equal, that they are endowed by their
New Americans in Houston
 New Americans in Houston A Snapshot of the Demographic and Economic Contributions of Immigrants in the Metro Area POPULATION 6.8M.6M Total population in 06 Immigrant population.% Immigrant share of the
Advancing Equity and Inclusive Growth in San Joaquin Valley: Data for an Equity Policy Agenda
 Advancing Equity and Inclusive Growth in San Joaquin Valley: Data for an Equity Policy Agenda Equity is the Superior Growth Model Image source: Flickr. Regional indicators database Coverage: 150 largest
CHAPTER 10: Fundamentals of International Political Economy
 1. China s economy now ranks as what number in terms of size? a. First b. Second c. Third d. Fourth 2. China s economy has grown by what factor each year since 1980? a. Three b. Five c. Seven d. Ten 3.
The Brookings Institution Metropolitan Policy Program Amy Liu, Deputy Director
 The Brookings Institution Metropolitan Policy Program Amy Liu, Deputy Director Mind the Gap: Reducing Disparities to Improve Regional Competitiveness in the Twin Cities Forum on the Business Response to
Unit V Notes What is Economics? 1. Economics - the study of how limited resources are used to satisfy people's seemingly unlimited wants Resources o
 Unit V Notes What is Economics? 1. Economics - the study of how limited resources are used to satisfy people's seemingly unlimited wants Resources o All natural materials (ex: land & water) o All human
The Great Depression and the New Deal
 The Great Depression and the New Deal 1. In the presidential election of 1932, Franklin D. Roosevelt will defeat Herbert Hoover in a landslide. 2. FDR promised a New Deal for the American people which
Pulling Open the Sticky Door
 Pulling Open the Sticky Door Social Mobility among Latinos in Nebraska Lissette Aliaga-Linares Social Demographer Office of Latino/Latin American Studies (OLLAS) University of Nebraska at Omaha Overview
Chapter 12: Exploring Economic Equality. Understandings of Economic Equality
 Chapter 12: Exploring Economic Equality Understandings of Economic Equality * understandings of economic equality vary and can include the following: Egalitarianism - people should own the means of production
Demographic Data. Comprehensive Plan
 Comprehensive Plan 2010-2030 4 Demographic Data Population and demographics have changed over the past several decades in the City of Elwood. It is important to incorporate these shifts into the planning
THERE ARE NO RICH PEOPLE IN THE WORLD
 THERE ARE NO RICH PEOPLE IN THE WORLD There are no rich people in the world, and there are no poor people. There are just people. The rich may have lots of pieces of green paper that many pretend are worth
FINANCIAL SERVICES AND ASSET DEVELOPMENT FOR IMMIGRANTS
 FINANCIAL SERVICES AND ASSET DEVELOPMENT FOR IMMIGRANTS KEY FACTS > One in five immigrants lives in poverty, or 7.6 million people. 107 > 33% of immigrant children and 26% of U.S. citizen children whose
Is the recession over in New York?
 By James A. Parrott May 10, 2010 Job numbers are up, unemployment is down. Consumer confidence is up. Gross domestic product has increased for three quarters. It sounds like the is behind us and we re
Which statement to you agree with most?
 Which statement to you agree with most? Globalization is generally positive: it increases efficiency, global growth, and therefore global welfare Globalization is generally negative: it destroys indigenous
Meanwhile, the foreign-born population accounted for the remaining 39 percent of the decline in household growth in
 3 Demographic Drivers Since the Great Recession, fewer young adults are forming new households and fewer immigrants are coming to the United States. As a result, the pace of household growth is unusually
1. Define GDP. The market value of all final goods and services produced within a nation in a given time period
 Economics 1. Define GDP. The market value of all final goods and services produced within a nation in a given time period 2. GDP represents the aggregate or the whole economy. 3. List the 4 components