Lao People's Democratic Republic Study for Poverty Profiles of the Asian Region. Final Report
|
|
|
- Stewart Damon Walker
- 5 years ago
- Views:
Transcription
1 Lao People's Democratic Republic Study for Poverty Profiles of the Asian Region Final Report August 2010 JAPAN INTERNATIONAL COOPERATION AGENCY OPMAC Corporation
2 Poverty Indicator Basic data Region (*) Country Year Population, total (millions) Population growth (annual %) GDP, PPP (constant 2007 international $) (billions) GDP per capita, PPP (constant 2007 international $) GDP growth (annual %) Ap Lao PDR , (Source) United Nations Development Programme, Human Development Report 2009 (2009) (Note) * AF: Africa, Ap: Asia and Pacific, CLA: Central and Latin America, ME: Middle-east and Europe Poverty incidence (%) National Rural Urban Poverty Gap Index at $1.25 Poverty Poverty Gap Index (National) Source Survey year Inequality Gini index Year Lao Expenditure and Consumption Survey III 2002/ /03 (Source) Committee for Planning and Investment National Statistics Center and World Bank, Lao PDR Povety Trends 1992/ /03 (2004) (Note) * Data of Poverty Index at $1.25 is for (World Bank, World Development Indicator 2010 (2010)) Remarks (Areas, populations & social groups considered to be vulnerable and Gini index disadvantageous) Not specified.
3 Map of Laos
4 Maps of Social indicators

5 貧困者比率 %( 郡別 )2002/03 年 Poverty Headcount Ratio (%) by District (2002/03) Source: Swiss National Centre of Competence in Research North-South and International Food Policy Research Institute, "The Geography of Poverty and Inequality in the Lao PDR", Figure 5. Map of incidence of poverty of each district

6 貧困ギャップ比率 ( 貧困の深度 )%( 郡別 )2002/03 年 Poverty Gap Ratio (Poverty Depth) (%) by District (2002/03) Source: Swiss National Centre of Competence in Research North-South and International Food Policy Research Institute, "The Geography of Poverty and Inequality in the Lao PDR", Figure 13. Maps of the depth of poverty and severity of poverty for each district
7 二乗貧困ギャップ比率 ( 貧困の重度 )%( 郡別 )2002/03 年 Squared Poverty Gap Ratio (Poverty Severity) % by District (2002/03) Source: Swiss National Centre of Competence in Research North-South and International Food Policy Research Institute, "The Geography of Poverty and Inequality in the Lao PDR", Figure 13. Maps of the depth of poverty and severity of poverty for each district
8
9
10
11
, Map")
12 主要道路ネットワーク Major Raod Newtork Source: World Bank, "Project Appraisal Document for A Road Sector Project", (2010), Map
13
14 Poverty Indicator Map of Laos Maps of Social indicator Table of Contents List of Abbreviations and Acronyms Table of Contents Chapter 1 Income Poverty Analysis Measurement of Income Poverty Source of Data for Poverty Analysis Poverty Line Income Poverty Indicators Poverty Trends at National Level Poverty Trends in Urban and Rural Areas Poverty Trends by Geographical Region and by Location Poverty Trends by Agro-ecological Zone and Topography Poverty Trends by Ethno-Linguistic Group Inequality Indicators Inequality Trends at National Level and by Area Inequality by Region Inequality by Agro-ecological Zone and Topography Inequality by Ethnicity Chapter 2 Non-Income Poverty Analysis Designated Poor Areas and Socially Vulnerable Groups by the Government Vulnerability Analysis Comprehensive Food Security and Vulnerability Analysis Hazard Analysis Chapter 3 Explanatory Factors of Poverty in Laos Domestic Factors National Development and Public Expenditure Industrial Structure and Employment Resources Ethnicity Geopolitical Factors Employment Opportunity and Border Opium Cultivation Factors related to Globalization Remittance Regional Growth in the Greater Mekong Sub-Region Chapter 4 Mechanism of Social Protection Formal Public Social Protection System Social Security Schemes Health Insurance Scheme for Self-Employees and Informal Sector Quasi-formal Social Security System Microfinance Activities by Public Sector and Banking Sector Microfinance Activities by the Non-Banking Sector Micro-insurance Informal Social Security System... 30
15 4.3.1 Informal Health Insurance Informal Finance Chapter 5 Poverty Monitoring MDGs Progress MDG 1: Eradicate Extreme Poverty and Hunger MDG 2: Achieve Universal Primary Education MDG 3: Promote Gender Equality and Empower Women MDG 4: Reduce Child Mortality MDG 5: Improve Maternal Health MDG 6: Combat HIV/AIDS, Malaria and Other Diseases MDG 7: Ensure Environmental Sustainability MDG 8: Develop a Global Partnership for Development Poverty Monitoring System MDG Monitoring Poverty Monitoring Lao Info Appendix Appendix 1: Poverty and Inequality Indicator Appendix 2: Poverty Lines in 1997/98 Appendix 3: List of 72 poor districts Appendix 4: Microfinance at a Glance Annex (1) List of Major Policy Documents (2) List of Major Statistical Surveys (3) List of Major Microfinance Institutions (4) List of Major NGOs (international and national) and CSOs (5) List of Major Socio-economic Research Institutions (6) List of Other References List of Tables and Figures [Table] Table 1-1: Poverty Incidence and Number of Poor in Lao PDR... 2 Table 1-2: Poverty Gap and Severity... 2 Table 1-3: Poverty Incidence by Area... 3 Table 1-4: Number of Poor by Area... 4 Table 1-5: Poverty Gap and Severity by Area... 4 Table 1-6: Poverty Incidence by Region and Province... 5 Table 1-7: Number of Poor by Region... 6 Table 1-8: Poverty Gap and Severity by Region and Province... 7 Table 1-9: Poverty Incidence by Location... 8 Table 1-10: Number of Poor by Location... 9 Table 1-11: Poverty Gap and Severity by Location... 9 Table 1-12: Poverty Status by Agro-ecological Zone Table 1-13: Poverty Incidence by Topography Table 1-14: Number of the Poor by Topography Table 1-15: Poverty Gap and Poverty Severity Ratio by Topography Table 1-16: Poverty Incidence by Ethnicity (2002/03)... 13
16 Table 1-17: Gini Index by Area Table 1-18: Gini Index by Region Table 1-19: Gini Index by Location Table 1-20: Gini Index by Agro-ecological Zone Table 1-21: Gini Index by Topography Table 1-22: Gini Index by Ethnicity Table 2-1: Poverty Criteria Table 2-2: Number and Percentage of Poor Villages and Households by NGPES Poverty Criteria (2003) Table 2-3: Poverty and Poor District Classification by NGPES Table 2-4: Poverty Incidence by Priority Table 2-5: Poverty Gap and Severity by Priority Table 2-6: Gini Index by Priority Table 2-7: Food Insecurity Status of Households in Rural Lao PDR Table 2-8: Prevalence of Child Malnutrition by Ecological Zone (Confidence Interval of 95%) Table 2-9: Child Nutrition Status by Presence of Fragile Land (Slope of more than 16%) 23 Table 2-10: Child Nutrition Status by Ethnicity Table 2-11: UXO Clearance ( ) Table 3-1: Poverty and Sectoral Growth (1992/ /03) Table 3-2: Road Access and Transport Conditions by Province Table 3-3: Eradication of Opium Cultivation by Province (2008) Table 3-4: Incidence of Remittance Table 4-1: Welfare Program for Vulnerable Groups Table 4-2: Regulations for Licensed MFIs Table 5-1: MDGs Progress in the Lao PDR [Figure] Figure 1-1: Map of Poverty Incidence by Province... 6 Figure 1-2: Map of Poverty Incidence by District... 6 Figure 1-3: Maps of Poverty Gap and Severity by District... 8 Figure 1-4: Maps of Agro-ecological Zone Figure 1-5: Lorenz Curve of Lao PDR Figure 1-6: Map of Inequality by Gini Index Figure 2-1: The 72 Districts Identified as Poor Figure 2-2: Food Security Status of Rural Villagers in the Lao PDR, by province Figure 2-4: UXO Contamination Map Figure 2-5: Households at Risk of Food Insecure by Drought Figure 2-6: Drought Prone Areas in Lao PDR Figure 3-1: Public Investment by Province (2002/03) Figure 3-2: Internal Migration Figure 3-3: District Migration Figure 3-4: Percentage of Villages of having Lack of Job (%), (2002/ /08) Figure 3-5: Households Operating Agricultural Land Figure 3-6: Average Size of Agricultural Land per Household Figure 3-7: Vulnerability of households to Restricted Forest Access Figure 3-8: Composition of Villages by Ethno-Linguistic Families Figure 3-9: Human Trafficking Routes of Lao PDR Figure 3-10: Number of Opium Addicts and Prevalence, Northern Lao PDR, Figure 4-1: Microfinance by Sector... 30
17 List of Abbreviations and Acronyms ADB : Asian Development Bank APB : Agriculture Promotion Bank BHN : Basic Human Needs BOL : Bank of the Lao PDR CBHI : Community Based Health Insurance CFSVA : Comprehensive Food Security & Vulnerability Analysis CI : Confidence Interval DOS : Department of Statistics DOTS : Directly Observed Treatment Short Course FAO : Food and Agriculture Organization of the United Nations GMS : Greater Mekong Sub-Region HIV/AIDS : Human Immunodeficiency Virus / Acquired Immune Deficiency Syndrome IFPRI : International Food Policy Research Institute LAOPA : Lao PDR Poverty Assessment Project LECS : Lao Expenditure and Consumption Survey LWU : Lao Women s Union MFI : Microfinance Institution MDGs : Millennium Development Goals MMR : Maternal Mortality Rate MPI : Ministry of Planning and Investment NBCA : National Biodiversity Conservation Areas NGO : Non-Governmental Organization NGPES : National Growth and Poverty Eradication Strategy NLC-RDPR : National Leading Committee for Rural Development and Poverty Reduction NSEDP : National Socio-Economic Development Plan NSC : National Statistics Center PPA : Participatory Poverty Assessment RMFC : Rural and Micro Finance Committee SASS : State Authority of Social Security SCU : Saving and Credit Union SSO : Social Security Organization SIDA : Swedish International Development Agency SOE : State Owned Enterprise UNDP : United Nations Development Programme UNFCCC : United Nations Framework Convention on Climate Change UNFPA : United Nations Population Fund UNIAP : United Nations Inter-Agency Project on Human Trafficking
18 UNICEF : United Nations Children s Fund UNODC : United Nations Office on Drugs and Crime UXO : Unexploded Ordnance UXO Lao : Lao National Unexploded Ordnance Programme VRF : Village Revolving Fund VSB : Village Statistic Book VSCG : Village Savings and Credit Group WB : World Bank WFP : United Nations World Food Programme WHO : World Health Organization
19 Chapter 1 Income Poverty Analysis 1.1 Measurement of Income Poverty Source of Data for Poverty Analysis Poverty Analyses of the Lao PDR are based on the Lao Expenditure and Consumption Surveys (LECS), which are sample surveys to show situations of households in the country. Every five years since 1992/93, four rounds of LECS were conducted by the Department of Statistics (DOS) 1 under the Ministry of Planning and Investment: LECS 1 (1992/93), LECS 2 (1997/98), LECS 3 (2002/03) and LECS 4 (2007/08). In addition, the Population and Housing Census, which is carried out every ten years, is another key source of poverty analysis. The latest census was conducted in Since the results of the latest LECS 4 were released in May 2009, no detailed poverty assessment has been conducted up to now. Therefore, this Study is mainly based on existing poverty assessments from the results of LECS 1 to 3 and the Population and Housing Census Poverty Line In general, the measurement of income poverty is based on a comparison between the level of household income or consumption and the poverty line 2. The poverty line is determined by the minimum requirement deemed necessary to satisfy basic human needs (BHN). Following discussions with the World Bank (WB) and the Swedish International Development Agency (SIDA), the Government endorsed the official poverty lines as part of its National Growth and Poverty Eradication Strategy (NGPES). Under the NGPES, a key national development agenda is to eradicate poverty by There are two kinds of poverty lines: food poverty line and absolute poverty line 3. The food poverty line is estimated by the income needed to purchase a food consumption basket which satisfies the minimum nutritional requirement for surviving 4, whereas the absolute poverty line considers this income plus non-food basic needs, including expenditure on health and education. The poverty lines are adjusted over time by changes in prices of the consumption basket 5 as well as spatial price differences. The national poverty line in 2002/03 was Kip 92,959 (USD 8.79) 6 original poverty lines are shown in Appendix 2. per person per month. The 1 DOS is the former National Statistical Center. 2 See Appendix 1 for a detailed definition of poverty line 3 In NGPES, the poverty line base on both food and non-food consumptions is called as poverty line. In order to avoid confusion, the poverty line to satisfy the minimum food and non-food consumption is called as the absolute poverty line. 4 The standard minimum requirement of calorie intake by WHO and FAO is 2,000 2,400kcal for people in developing countries. The standard level is adjusted by country, age and ethnicity. 5 In the WB report, it is pointed out that the consumption basket should reflect changes in consumption patterns of households during the period from LECS 2 to LECS 3. Since the consumption patterns in LECS 4 had changed even more since the LECS 2 was conducted, it is necessary to reconstruct the poverty lines based on a new consumption basket for poverty analysis based on data of LECS 4. 6 Average exchange rate for 2003 is 1 USD = 10, Kips (International Monetary Fund, International Financial Statistics Yearbook 2009 ) 1
20 Absolute Poverty Line = Minimum food consumption (Food Poverty Line) + Minimum non-food consumption 1.2 Income Poverty Indicators Poverty Trends at National Level At the national level, poverty reduced in the decade between 1992/93 and 2002/03 in the Lao PDR. The food poverty headcount ratio declined from 37.6% in 1992/93 to 22% in 2002/03. For the same period, absolute poverty (hereinafter referred to as poverty incidence ) 7 decreased from 46.0% to 33.5%. The population below the absolute poverty line also decreased from more than 2 million to less than 1.85 million people. The poor population decreased by 10% during the decade. Table 1-1: Poverty Incidence and Number of Poor in Lao PDR 1992/ / /03 Food Poverty (%) Absolute Poverty (%) No. of Poor by Absolute Poverty 2,054,020 1,987,060 1,849,444 Total Population of Lao PDR 4,468,830 5,087,012 5,519,368 (Source) Committee for Planning and Investment National Statistics Center and the World Bank, Lao PDR Poverty Trends 1992/ /3 (2004), p.33, Table 2, p.35, Table 5 and p.41, Table 11 Both the poverty gap and the severity of poverty also improved during the decade. The poverty gap ratio, which shows the gap between the average consumption of the population living below the poverty line and the poverty line, dropped from 11.2% to 8%, indicating that the shortfall of consumption to cover the minimum cost of basic needs by the poor decreased. The poverty severity ratio, which is measured by the squared poverty gap ratio, indicates the inequality of income or consumption amongst the poor. For the period 1992/93 to 1997/98, the poverty severity ratio remained at the same level at 3.9% while the absolute poverty incidence dropped from 46.0% to 39.1%. This implies that the reduction of poverty during this time did not reduce inequality among the poor. However, the poverty severity ratio improved from 3.9% to 2.8% during the period between 1997/98 and 2002/03, implying that the reduction of poverty benefited the poorest. Table 1-2: Poverty Gap and Severity (%) Indicator 1992/ / /03 Poverty Gap Poverty Severity (Source) Committee for Planning and Investment, National Statistics Center and World Bank, Lao PDR Poverty Trends 1992/ /3 (2004), p.36, Table 6 and p.38, Table 8 7 In this report, poverty incidence or the poor mean the absolute poverty headcount ratio or the poor population below the absolute poverty line unless otherwise stated. 2
21 1.2.2 Poverty Trends in Urban and Rural Areas Poverty has gradually fallen in both urban 8 and rural areas of the country, but the magnitude of the decline differs by region. In terms of food poverty, food poverty incidence in rural areas declined significantly from 41.0% in 1992/93 to 22.5% in 2002/03, while in the same period food poverty incidence in urban areas dropped from 26.6% to 20.2%. As a result, the gap in the food poverty incidence between urban and rural areas decreased. However, the gap between rural areas with an all-season road and areas without a all-season road is still significant. In rural areas without an all-season road, the share of the population living below the food poverty line in 2002/03 was 28.4%, which is 10 points higher than the share in rural areas having an all-season road, though it dropped considerably from 47.2% in 1992/93. Absolute poverty decreased in both urban and rural areas as well. Urban poverty incidence declined to less than 20% in 2002/03 from 26.5% in 1992/93. The reduction of poverty in rural areas was more dramatic. The incidence of poverty in rural areas decreased from 51.8% to 37.6% for the same period. In particular, the share of the absolute poor in rural areas without an all-season road declined from 60.4% to 36.2%. Table 1-3: Poverty Incidence by Area (%) 1992/ / /03 Area Food Poverty Food Poverty Food Poverty Poverty Poverty Poverty Urban Rural With all-season road W/O all-season road (Source) Committee for Planning and Investment, National Statistics Center and World Bank, Lao PDR Poverty Trends 1992/ /3 (2004), p.33, Table 2 and p.41, Table 11 Although it is obvious that the majority of the poor inhabit rural areas, the trends in the number of the poor differ by area. The number of urban poor increased in 2002/03 after decreasing between 1992/93 and 1997/98. On the other hand, the total rural poor population decreased in 2002/03 after increasing slightly between 1992/93 and 1997/98. By accessibility of rural villages, the number of the poor in villages with a all-season road slightly increased from million to million for the same period while the number of the poor in villages without a all-season road decreased from 1 million to 0.84 million for the same period. That may be partly because the rural infrastructure development including rural road decreased the number of villages without an all-season road. 8 In Lao PDR, a village that has at least three out of the following five characteristics is classified as an urban village: (1) The village is situated in the municipal vicinity of provinces or districts, or has more than 100 households and a population above 600 people. (2) There is an all-season road. (3) At lease 70 percent of the households use tap water. (4) At lease 70% of the households are electrified. (5) There is a daily market in the village (NSC 2004b) (Committee for Planning and Investment National Statistics Center and World Bank, Lao PDR Poverty Trends 1992/ /3, (2004), p.8) 3
22 Area Table 1-4: Number of Poor by Area 1992/ / /03 % of % of % of No. of Poor total No. of Poor total No. of Poor total population population population Urban 279, , , Rural 1,768, ,799, ,599, With all-season road 728, , , W/O all-season road 1,033, ,223, , (Source) Committee for Planning and Investment National Statistics Center and World Bank, Lao PDR Poverty Trends 1992/ /3 (2004), p.32, Table 1 and p.35, Table 5 The depth and the severity of poverty dropped in both urban and rural areas though the difference between urban and rural areas was still considerable. In 2002/03, the poverty gap and poverty severity ratio in urban areas were 4.1% and 1.3%, respectively, whereas the poverty gap and poverty severity ratio in rural areas was 9.2% and 3.2% respectively. The poverty gap and severity in rural areas without an all-season road is notable: the poverty gap is 12.0% and the poverty severity ratio is 4.4% in 2002/03. This indicates that rural areas without access to an all-season road suffer from lower consumption level far below the poverty line and exhibit serious inequality among the poor. Table 1-5: Poverty Gap and Severity by Area (%) Area 1992/ / /03 Gap Severity Gap Severity Gap Severity Urban Rural With all-season road W/O all-season road (Source) Committee for Planning and Investment National Statistics Center and World Bank, Lao PDR Poverty Trends 1992/ /3 (2004), p.36, Table 6 and p.41, Table Poverty Trends by Geographical Region and by Location (1) Geographical Region and Province By geographical region, there is no significant difference among North, Centre and South. In 2002/03, the poverty incidence of North (37.9%) and Central (35.4%) were higher than the national level for the country, whereas the poverty incidence in the South (32.6%) was slightly lower. However, there are significant gap among the provinces within each region. Vientiane Capital had the lowest poverty headcount ratio in the country. The poverty incidence in the capital decreased from 33.6% in 1992/93 to 16.7% in 2002/03, though this was higher than the ratio of 1997/98 (13.5%). In the North, apart from Xaygnaboury, the poverty headcount ratio dropped in all provinces over the period between 1992/93 and 2002/03. In Xaygnaboury, the poverty incidence increased from 22.4% in 1992/93 to 25.0% in 2002/03 after falling to 17.7% in 1997/98. In Phongsaly and Houa Phanh, the poverty headcount ratio was still more than 50% in 1992/93, though this was a significant fall from more than 70% in 1992/93. For the same period, Bokeo and Louang Namtha experienced significant poverty reduction: the poverty incidence declined from more than 40% to 21-22%. 4
23 In the Central, poverty reduced in all provinces over the decade between 1992/93 and 2002/03, except in the province of Borikhamxay. Although Borikhamxay had a relatively low poverty headcount ratio of 16.6% in 1992/93, this rose to 28.7% in 2002/03. In Xieng Khoang and Savannakhet, more than 40% of population suffered from poverty, although the incidence of poverty dropped from 63% and 53% in the two provinces, respectively. In the South, all provinces had a poverty incidence of more than 40% in 1992/93. Then in Champasak, poverty incidence considerably reduced to 18.4% in 2002/03. On the other hand, in Saravanh, the poverty headcount ratio increased to 54.3% in 2002/03 though it had decreased from 1992/93 to 1997/98. Xékong and Attapeu still had a poverty incidence of more than 40% in 2002/03, although this was considerably lower than the incidence in 1992/93. Table 1-6: Poverty Incidence by Region and Province (%) Area 1992/ / /03 Vientiane Capital North Phongsaly Louang Namtha Oudomxay Bokeo Louang Prabang Houa Phanh Xaygnaboury Central Xieng Khoang Vientiane Borikhamxay Khammuane Savannakhet Xaysomboun South Saravanh Xékong Champasak Attapeu Lao PDR (Source) Committee for Planning and Investment National Statistics Center and World Bank, Lao PDR Poverty Trends 1992/ /3 (2004), p.34, Table 3 The poor population of the country concentrated in the North 9 : 86% of poor inhabited in 2002/03. The size of poor population in North more than doubled over the period between 1992/93 and 2002/03. In the South, the population below the poverty line expanded by more than twice for the same period though it reduced by 30% from the poor population in 1997/98. While the poor population in the country decreased for the decade, the poor population in Vientiane Capital continuously increased by 14%. 9 The poor population in the seven provinces of Huaphanh, Phongsaly, Oudmoxay (in the North), Xiengkhuan and Savannakhet (in the Central), and Attapeu and Saravne ( in the South) accounted for more than 50% of the total poor population despite the fact that their population makes up less than 40% of the country s total. 5

24 Area Table 1-7: Number of Poor by Region 1992/ / /03 % of % of % of No. of Poor total No. of Poor total No. of Poor total population population population Vientiane Capital 175, , , North 734, ,799, ,599, Central 742, , , South 398, ,223, , Lao PDR 2, ,987, ,849, (Source) Committee for Planning and Investment National Statistics Center and World Bank, Lao PDR Poverty Trends 1992/ /3 (2004), p.32, Table 1 and p.35, Table 5 (Source) Swiss National Center of Competence in Research North-South and International Food Policy Research Institute, The Geography of Poverty and Inequality in the Lao PDR, p.24, Figure 3 and p.26, Figure 5 Figure 1-1: Map of Poverty Incidence by Province Figure 1-2: Map of Poverty Incidence by District The poverty gap and severity also differs according to province. In the capital Vientiane, the poverty gap dropped from 7.0% in 1992/93 to 3.4% in 2002/03 while the poverty severity remained at the low level. It is indicated that the disparity of the poor s consumption level from the poverty line decreased and the inequality among the poor was very limited. In the North, four provinces, Louang Namtha, Odomxay, Louang Prabang, and Houa Phanh had poverty gap ratios of more than 10%, though there were improvements from 1992/.93. In those provinces, the poverty severity ratio was also very high. In the Central, in Vientiane Province, the poverty gap and severity ratio deteriorated over the decade though the incidence of poverty declined from 30.7% to 19.0%. The poverty gap in Vientiane Province increased from 6.5% in 1992/93 to 12.3% in 2002/03. It implies that a 6
25 large number of poor households living near the poverty line could move out the poverty but the rest of poor households with more difficult living conditions fell into severe poverty in Vientiane Province. Xaysomnoun, which had a poverty incidence of 30% in 2002/03, also had a high poverty gap and severity ratio. In the South, three provinces, except Champasak, had high poverty gap and severity ratios. These ratios improved in Xékong and Attapeu over the decade, but worsened in Saravanh. Area Table 1-8: Poverty Gap and Severity by Region and Province Poverty Gap 1992/ / /03 Poverty Severity Poverty Gap Poverty Severity Poverty Gap Poverty Severity Vientiane Capital North Phongsaly Louang Namtha Oudomxay Bokeo Louang Prabang Houa Phanh Xaygnaboury Central Xieng Khoang Vientiane Borikhamxay Khammuane Savannakhet Xaysomboun n.a n.a South Saravanh Xékong Champasak Attapeu Lao PDR (Source) Committee for Planning and Investment National Statistics Center and World Bank, Lao PDR Poverty Trends 1992/ /3 (2004), p.37, Table 7 and p.41, Table 11 (%) 7
26 (Source) Swiss National Center of Competence in Research North-South and International Food Policy Research Institute, The Geography of Poverty and Inequality in the Lao PDR, p.26, Figure 13 Figure 1-3: Maps of Poverty Gap and Severity by District (2) Location Inland areas which are non-border districts and Thai border areas have a relatively lower poverty incidence and experienced modest poverty reduction for the period 1992/93 to 2002/03. The most drastic poverty reduction occurred in areas bordering China and Myanmar: the poverty incidence dropped from 49% to 28%. Areas bordering Cambodia also showed reductions in poverty but the poverty headcount ratio was still high at 39.8%. Poverty incidence worsened in areas bordering Vietnam, where they had the highest poverty headcount ratio at 61.6% in 2002/03. Areas bordering Vietnam and Cambodia still had more than 30% of their population suffering from food poverty in 2002/03, while food poverty in other border areas decreased considerably to less than 20%. In Inland areas, the population living below the food poverty line accounted for 21.6%. Table 1-9: Poverty Incidence by Location (%) Area 1992/ / /03 Food Poverty Poverty Food Poverty Poverty Food Poverty Poverty Inland Thai border Urban Rural Vietnamese border North South-Central Chinese-Myanmar border Cambodian border (Source) Committee for Planning and Investment National Statistics Center and World Bank, Lao PDR Poverty Trends1992/ /3 (2004), p.33, Table 2 and p.41, Table 11 (Note) Inland is defined as the areas not having country borders. 8
27 Since most of the population inhabit Inland areas, it has the largest number of poor people (more than 900,000). However the incidence of poverty in these areas is relatively modest. On the other hand, areas bordering Vietnam have quite a significant number of poor people (more than 440,000), although their share of the total population was only 13.2%. Area Table 1-10: Number of Poor by Location No. of Poor 1992/ / /03 No. of No. of Poor Poor % of total population % of total population % of total population Inland 1,185, ,017, , Thai border 372, , , Urban 80, , , Rural 291, , , Vietnamese border 309, , , North 196, , , South-Central 112, , , Chinese-Myanmar border 81, , , Cambodian border 102, , , (Source) Committee for Planning and Investment National Statistics Center and World Bank, Lao PDR Poverty Trends 1992/ /3 (2004), p.32, Table 1 and p.35, Table 5 Areas bordering Thailand, China and Myanmar had low poverty gaps and severity ratios, whereas areas bordering Vietnam had very high poverty gaps and severity ratios. In most areas, the poverty gap and severity ratio improved between 1992/93 and 2002/03. However, the South and Central areas bordering Vietnam witnessed a deteriorating poverty gap and severity over the same period. Area Table 1-11: Poverty Gap and Severity by Location Poverty Gap 1992/ / /03 Poverty Severity Poverty Gap Poverty Severity Poverty Gap Poverty Severity Inland Thai border Urban Rural Vietnamese border North South-Central Chinese-Myanmar border Cambodian border (Source) Committee for Planning and Investment National Statistics Center and World Bank, Lao PDR Poverty Trends 1992/ /3 (2004), p.36, Table 6 and p.41, Table 11 (%) Poverty Trends by Agro-ecological Zone and Topography (1) Agro-ecological Zone By agro-ecological zone, the Bolven Plateau and the Vientiane Plain had the lowest poverty headcount ratio of 15% and 16%, respectively. The Boloven Plateau, including part of 9

28 Saravane, Xekong, and Attapeu provinces in the South, has active cash crop production including coffee, tea and cardamon plantation as well as livestock production. Tourism is also important for the local economy in this zone. Table 1-12: Poverty Status by Agro-ecological Zone Agro-ecological Zone Population Poverty Incidence (%) Vientiane Plain 832, Mekong Corridor 1,870, Northern Lowlands 1,123, Northern Midlands 690, Northern Highlands 537, South-Central Lowlands 257, South-Central Midlands 28, South-Central Highlands 23, Boloven Plateau 126, (Source) Swiss National Center of Competence in Research North-South and International Food Policy Research Institute, The Geography of Poverty and Inequality in the Lao PDR, p.38, Table 8 (Source) World Bnak, Lao PDR: Rural and Agriculture Sector Issues Paper (2006), p.4, Box 1 Figure 1-4: Maps of Agro-ecological Zone The Mekong Corridor and the Northern Lowlands and had modest poverty incidence of 28% and 33%, respectively. The Mekong Corridor includes the banks and floodplains of the Mekong River and the lower alluvial valleys of its tributaries. The villages in this zone have intensive farming for wide range of crops, particulary lowland rice. The agriculture income from cash crops enabled the rural households to move out the poverty. The Northern Lowlands comprises parts of Luang Prabang, Phongsaly, Oudomxay, and Xayabury. Although its landforms are similar to those in the Northern Highlands which are predominantly mountainous, the poverty incidence was much lower than the Northen Midlands and Highlands. In the Northern Midlands and Highlands, which cover the mountain areas of Phongsaly, Luang Namtha, and Bokeo in the extreme northwest, parts of Huaphanh and Xieng Khuang and eatstern parts of Bolikhamxay, the poor population accounted for more than 40%. Despite of the potential for animal husbandry and good soil for farming, the most of rural population in this zone has been facing the poverty due to the predominance of the low productive and subsistence shifting cultivation. In the South-Central Lowlands and Midlands, more than 60% of people lived below the poverty line. The situation in the South-Central Highlands was the most serious: the poverty incidence was 75% which was the highest by ecological zones. The South-Central Highlands includes parts of Khammouane, Savannakhet, Saravane, and Sekong and Attapeu provinces and extends parallel to the Mekong covering the upper valleys of its tributaries and upland areas. The zone is generally characterized by poor acid soils with little potential for productive agriculture. In addition, the high risk of unexploded ordnance (UXO) prevents the cultivation of a large portion of the available land. 10
29 (2) Topography By district slope, the Mostly Flat areas had lower poverty incidence than the Somewhat Steep areas and the Mostly Steep areas. While poverty reduction in the Mostly Flat areas progressed from 42.2% to 27.4% between 1992/93 and 2002/03, the poverty incidence in the Somewhat Steep areas remained at almost the same level around 40%. In the Mostly Steep areas, more than 40% of population still lived below the absolute poverty line in 2002/03, although the poverty incidence dropped from 56.2% in 1992/93. Food poverty declined in all areas by district slope, which classifies districts by proportion of area with significant (greater than 16 ) slopes. The food poverty incidence declined from more than 30% to around 20% for the same period. In the Somewhat Steep areas, the share of population with food poverty decreased to 19.0% though the absolute poverty incidence did not change significantly. By village altitude, the data for 1992/93 and 1997/98 are not available. In 2002/03, villages at lower altitude had a lower absolute poverty incidence compared to villages at higher altitudes: 28.2% in the Lowland, 36.5% in the Midland, and 43.9% in the Upland. The Lowland also had a lower food poverty incidence of 19.1%. On the other hand, the Midland and the Upland had almost the same level of food poverty incidence at around 26%. In the Mostly Flat areas, where most of the population is concentrated, the number of poor people decreased from more than 961,000 in 1992/93 to around 750,000 in 2002/03, while other areas experienced increases in number of poor in 1997/98. The Mostly Steep areas had the largest poor population of more than 850,000, despite the fact that its share of total population was less than those in the Mostly Flat areas. Table 1-13: Poverty Incidence by Topography (%) Topography 1992/ / /03 Food Poverty Poverty Food Poverty Poverty Food Poverty Poverty District Slope* Mostly flat Somewhat steep Mostly steep Village Altitude** Lowland n.a n.a n.a n.a Midland n.a n.a n.a n.a Upland n.a n.a n.a n.a (Source) Committee for Planning and Investment National Statistics Center and World Bank, Lao PDR Poverty Trends 1992/ /3 (2004), p.33, Table 2 and p.41, Table 11 (Note) * Mostly flat : Districts where more than three quarters of the land with a slope of less than 16 degrees Mostly steep : Districts where the share of district total land area with a slope land higher than 16 degrees Somewhat steep : All other districts than Mostly flat and Mostly steep ** Lowland : Terrain at elevations below 200 meters above sea level, including flood plains Midland : mountains and plateaus between 200 and 1,000 meters Upland : mountains and plateaus 1,000 meters or more By village altitude, the Lowland had the largest population living below the poverty line of approximately 900,000. The second largest poor population of around 600,000 was in the Upland, whose share of the total population was only 25%. It implies that poor people are concentrated in the Upland. 11
30 Area District Slope Table 1-14: Number of the Poor by Topography No. of Poor 1992/ / /03 % of total population No. of Poor % of total population No. of Poor % of total population Mostly flat 961, , , Somewhat steep 221, , , Mostly steep 908, , , Village Altitude Lowland n.a n.a n.a n.a 895, Midland n.a n.a n.a n.a 352, Upland n.a n.a n.a n.a 605, (Source) Committee for Planning and Investment National Statistics Center and World Bank, Lao PDR Poverty Trends 1992/ /3 (2004), p.32, Table 1 and p.35, Table 5 Between 1992/93 and 2002/03, the poverty gap and poverty severity ratio declined in all areas classified by district slope. However, the poverty gap and the severity ratio shows a similar pattern, with The mostly Flat areas having a lower poverty gap and severity of 6.2% and 2.0%, respectively compared with the the Somewhat Steep areas and the Mostly Steep areas. Inequality among the poor in those areas was also higher than in the Mostly Flat areas. The poverty gap and severity by village altitude shows the same pattern as those of district slope: villages at higher altitudes had more serious poverty gaps and poverty severity ratios than villages at lower altitudes. Area Table 1-15: Poverty Gap and Poverty Severity Ratio by Topography Poverty Gap 1992/ / /03 Poverty Severity Poverty Gap Poverty Severity Poverty Gap Poverty Severity District Slope Mostly flat Somewhat steep Mostly steep Village Altitude Lowland n.a n.a n.a n.a Midland n.a n.a n.a n.a Upland n.a n.a n.a n.a (Source) Committee for Planning and Investment National Statistics Center and World Bank, Lao PDR Poverty Trends 1992/ /3 (2004), p.36, Table 6 and p.38, Table 8 (%) Poverty Trends by Ethno-Linguistic Group Following international practice, there are four classifications of ethno-linguistic families in the Lao PDR: Lao-Tai (Tai-Kadai); Mon-Khmer (Austro-asiatic); Hmong-Mien (Hmong-Yao, Miao-Yao); and Sino-Tibetan (mostly Tibeto-Burman) ( ) shows a name of linguistic family 12
31 For 2002/03, the Lao-Tai had the lowest poverty incidence at 26%, lower than the national average of poverty incidence. However, as the Lao-Thai make up the largest proportion of the population with more than 3.3 million people, it had the highest number of poor people at 871,000. On the other hand, other ethnic groups, such as Mon-Khmer, Tibeto-Burman and Hmong-Mien, had higher poverty headcount ratios: 50% of Mon-Khmer and 44% of Tibeto-Burman and Hmong-Mien lived in poverty. It was estimated that more than 600,000 of Mon-Khmer and 275,000 of Tibeto-Burman and Hmong-Mien lived in poverty. In addition, approximately 92,000 other ethnic minorities in the country suffered from poverty. Table 1-16: Poverty Incidence by Ethnicity (2002/03) Ethnicity Population Poverty Incidence (%) Lao-Tai (Tai-Kadai) 3,352, Mon-Khmer 1,280, Tibeto-Burman & 626, Hmong-Mien Others 231, Lao PDR 5,490, (Source) Swiss National Center of Competence in Research North-South and International Food Policy Research Institute, The Geography of Poverty and Inequality in the Lao PDR, p.38, Table Inequality Indicators Inequality Trends at National Level and by Area The Lorenz curves (Figure 1-5) indicate that inequality in the Lao PDR did not improved significantly between 1992/93 and 2002/03 although it showed a slight improvement in 1997/98. The Gini Index 11, based on the Lorenz curve 12, worsened slightly from 30% to 35% 13. Looking at the share of total consumption by consumption decile, the share of the lower deciles from the bottom to the 4 th, including the poor, slightly decreased between 1992/93 and 2002/03, while the other deciles kept the same shares. The share of the top decile increased slightly from 26.5% in 1992/93 to 27.4% in 2002/03. The limited changes in inequality for this period suggest that despite considerable poverty reduction, this did not contribute to an improvement in inequality at the national level. Share (%) Bottom Decile 1992/ / /03 45 degree line 2nd 3rd 4th 5th 6th 7th 8th 9th Top Consumption Deciles Decile (Source)Committee for Planning and Investment National Statistics Center and World Bank, Lao PDR Poverty Trends 1992/ /3 (2004), p.34, Table 4 Figure 1-5: Lorenz Curve of Lao PDR 11 Gini index is derived from the Gini coefficient multiplied by See Appendix 1 for a detailed definition of inequality indicators. 13 A Gini Coefficient of larger than 50% indicates severe inequality with a high risk of social instability. 13
32 Inequality in urban areas is more severe than in rural areas. In 2002/03, the Gini Index for urban areas was 34.8%, which was higher than the country average, whereas the indicator for rural areas was 30.3%. Changes in inequality in both urban and rural areas had the same pattern at the national level. Among the Rural areas, the areas without an all-season road had lower inequality with higher poverty incidence than areas with roads. Although accessibility to an all-season road is a key factor to create income opportunities in rural areas in the Table 1-17: Gini Index by Area (%) Area 1992/ / /03 Lao PDR Urban Rural With all-season road W/O all-season road (Source) Committee for Planning and Investment National Statistics Center and World Bank, Lao PDR Poverty Trend 1992/ /3 (2004), p.40, Table 10 country, it can induce unequal distribution of income among the rural population. In other words, in the villages without roads, people have limited opportunities to earn income Inequality by Region By region, Vientiane Capital had the highest Gini Index. Inequality in the capital worsened to 36% in 2002/03 from 29.7% in 1992/93. In the North, inequality also increased from 26.9% to 30.7%, although the Gini Index was the lowest among the regions in 2002/03. In the Central, the Gini Index remained at 31-32%. The South experienced a slight decrease in inequality from 32.3% to 31.4% for the same period. Table 1-18: Gini Index by Region (%) Area 1992/ / /03 Vientiane Capital North Central South (Source) Committee for Planning and Investment National Statistics Center and World Bank, Lao PDR Poverty Trends 1992/ /3 (2004), p.40, Table 10 Table 1-19: Gini Index by Location (%) Area 1992/ / /03 Inland Thai border Urban Rural Vietnamese order North South-Central Chinese-Myanmar border Cambodian border (Source) Committee for Planning and Investment National Statistics Center and World Bank, Lao PDR Poverty Trends 1992/ /3 (2004), p.40, Table 10 14

33 By location, changes in the Gini Index showed different patterns. In the Inland areas, inequality deteriorated from 30.2% in 1992/93 to 34.6% in 1997/98, and did not improve significantly in 2002/03. In the urban areas bordering Thailand, the Gini Index dropped to 31.7% in 2002/03, which is the same level in 1992/93, after significantly deteriorating to more than 40% in 1997/98. Although these areas have a relatively lower poverty incidence, inequality was higher than in other areas. The areas bordering China had a similar experience: starting at 21.1% in 1992/93, it rose to 31.1% in 1997/98 and then fell to 25.9% in 2002/03. These areas had a lower poverty incidence and lower inequality compared to other regions. Among the areas bordering Vietnam, the South-Central areas continuously improved from 36.4% to 25.8% over the decade, while inequality in the Northern areas remained at a lower level around 26%. Despite lower inequality, however, these areas had a relatively high poverty incidence. (Source) Swiss National Center of Competence in Research North-South and International Food Policy Research Institute, The Geography of Poverty and Inequality in the Lao PDR, p.26, Figure 13 Figure 1-6: Map of Inequality by Gini Index The areas bordering Cambodia had the same pattern as the areas bordering Vietnam. The level of inequality in these areas was relatively lower but had a higher poverty incidence. Their inequality worsened slightly from 26.8% in 1992/93 to 28.0% in 2002/ Inequality by Agro-ecological Zone and Topography (1) Agro-ecological Zone By agro-ecological zone, there was no significant difference in the level of inequality. The Boloven Plateau, which had the lowest poverty incidence, had the lowest Gini Index of 27% among the regions. It means that the population in the region suffered from less poverty and inequality. On the other hand, the South-Central zone had lower inequality but a high poverty incidence of more than 60%. In the regions with lower poverty incidence, such as the Vientiane Plain, the Mekong Corridor and the Northern Lowlands, the Gini Indexes were relatively higher than the other zones at 31%. The Northern Midlands and Highlands, which had a Table 1-20: Gini Index by Agro-ecological Zone (%) Agro-ecological Zone Gini Index VientianePlain 31 Mekong Corridor 31 Northern Lowlands 31 Northern Midlands 31 Northern Highlands 32 South-Central Lowlands 29 South-Central Midlands 30 South-Central Highlands 28 Boloven Plateau 27 (Source) Swiss National Center of Competence in Research North-South and International Food Policy Research Institute, The Geography of Poverty and Inequality in the Lao PDR, p.38, Table 8 15
34 poverty incidence of more than 40 %, had also relatively higher Gini Indexes at 31% and 32%, respectively. (2) Topography There was also no considerable difference in inequality in 2002/03 among the areas when classified by topography. The Gini Index of the Mostly Flat areas deteriorated from 31.5% to 33.7% between 1992/93 and 2002/03. In the Mostly Steep areas, inequality slightly worsened from 28.1% to 30.1% over the same period. In the Somewhat Steep areas, the Gini Index sharply increased to 38.5% in 1997/98 from 31.5% in 1992/93, then decreased 31.4% in 2007/08. Table 1-21: Gini Index by Topography (%) Area 1992/ / /03 District Slope Mostly flat Somewhat steep Mostly steep Village Altitude Lowland n.a n.a 33.3 Midland n.a n.a 31.1 Upland n.a n.a 29.4 (Source) Committee for Planning and Investment, National Statistics Center and World Bank, Lao PDR Poverty Trends 1992/ /3 (2004), p.40, Table Inequality by Ethnicity By ethno-linguistic family, there was no significant difference in inequality although there was a significant difference in poverty incidence between the different groups. Inequality amongst the Lao Tai was slightly higher than Mon-Khmer and Tibeto-Burman & Hmong-Mien. Inequality among the other ethnic groups was greater, with a Gini Index of 34%. Table 1-22: Gini Index by Ethnicity (%) Ethnicity Gini Index Lao-Tai (Tai-Kadai) 32 Mon-Khmer 30 Tibeto-Burman & 30 Hmong-Mien Others 34 (Source) Swiss National Center of Competence in Research North-South and International Food Policy Research Institute, The Geography of Poverty and Inequality in the Lao PDR, p.38, Table 8 16
35 Chapter 2 Non-Income Poverty Analysis 2.1 Designated Poor Areas and Socially Vulnerable Groups by the Government In June 2004, the Government of Laos announced the first national poverty reduction strategy, the National Growth and Poverty Eradication Strategy (NGPES). The NGPES sets out poverty criteria to support local authorities to monitor changes in poverty and to better understand the poverty situation at household, village, and district level. The poverty criteria are shown in Table 2-1. At the household level, households which do not have enough income to obtain 16 kg of rice per person per month, are considered as poor. At the village and district level, the poverty criteria are based not only on income level but also access to basic services, such as education, health care, roads and safe water. Table 2-1: Poverty Criteria Poverty Criteria Household Level Income (or the equivalent in kind) of less than Kip 85,000, per person per month (at 2001 prices) Less than Kip 100,000 for urban areas Less than Kip 82,000 for rural areas Village Level Villages where at least 51% of the total households are poor Villages without schools or schools in nearby and accessible villages Villages without dispensaries, traditional medical practitioners or villages requiring over 6 hours of travel to reach a hospital Villages without access to roads (at least trails accessible by cart during the dry season) District Level Districts where over 51% of the villages are poor Districts where over 40% of the villages do not have local or nearby schools Districts where over 40% of the villages do not have a dispensary or pharmacy Districts where over 60% of the villages without an access road Districts where over 40% of the villages do not have safe water (Source) Lao People s Democratic Republic, National Growth and Poverty Eradication Strategy (2004), p.30 (Note) The average exchange rate in 2001 was 1 USD=8, Kips. According to the definition of poor households by NGPES, there were more provinces with a large proportion of poor households in the North and South. In all provinces of the North, with the exception of Xaygnaboury, more than 50% of households were classified as poor. In the Central, there were considerable differences between the provinces. Only 4.4% of households were classified as poor in the capital Vientiane while 71% of households were considered as poor in Boikhamxay. In the South, the share of poor households in Champasak was 19.7% whereas in the rest of the provinces the share was greater than 60%. In Xékong in particular, more than 80% of households were classified as poor. On the other hand, at the village level, the majority of villages in the country were classified as poor according to the definition given in the NGPES. 17
36 North Table 2-2: Number and Percentage of Poor Villages and Households by NGPES Poverty Criteria (2003) Province No. of Poor Villages % of Poor Villages No. of Poor Households % of Poor Households Phongsaly , Louang Namtha , Oudomxay , Bokeo , Louang Prabang , Houa Phanh , Xaygnaboury , Central Vientiane Capital Xieng Khoang , Vientiane , Borikhamxay , Khammuane , Savannakhet , Xaysomboun , South Saravanh , Xékong , Champasak , Attapeu , Total 4, , (Source) Lao People s Democratic Republic, National Growth and Poverty Eradication Strategy (2004), p.31 Based on the classification of poor districts by NGPES, the Government of Laos identified 72 districts as Poor out of the total of 142 districts in the country in As of 2003, the poor population in the 72 districts indentified as Poor exceeded 60 % of the poor population in the country. (Table 2-3) Of the Poor districts, 40 districts in which at least half of the households were poor according to the NGEPS s poverty criteria were classified very poor districts. In addition, another 7 districts were selected in order to ensure a minimum geographical representation of all provinces. Then, in total 47 districts, including 40 very poor districts and additional 7 districts were designated as the First Priority Districts which were the target investment group by the national development programs for The rest 25 were defined as the Second Priority Districts. The target poor population in the First Priority Districts was more than 655,000 according to LECS The Priority Districts are mainly located on the border with Vietnam and the North. This is consistent with the results of the income poverty analysis given in Chapter I. 14 Committee for Planning and Investment, National Statistics Center and World Bank, Lao PDR Poverty Trends 1992/ /03, (2004), p.35, Table 5 18
 Avg. poverty incidence (%) 55 64 23 % of district to total population 37.8 24.3 61.4 % of poor to total poor population 62.2 46.9 37.8 % of poor 50.6-18.")
37 Indicator Table 2-3: Poverty and Poor District Classification by NGPES Poor Districts (72 districts in total) Classification First Priority Districts ( ) (47 districts) Non-Poor (70 districts) Avg. poverty incidence (%) % of district to total population % of poor to total poor population % of poor (Source) Lao People s Democratic Republic, National Growth and Poverty Eradication Strategy (2004), p.32 (Note) The total number of districts as of 2004 was 142. (Source) Lao People s Democratic Republic, National Growth and Poverty Eradication Strategy (2004) Figure 2-1: The 72 Districts Identified as Poor Table 2-4 shows the poverty incidence measured by the absolute poverty line for each category of district defined by the NGPES. A comparison by district priority shows a clear-cut difference in poverty incidence: prioritized districts have more poverty incidence than other districts (First Priority Districts: 51.6%, Second Priority Districts: 40.5%, and Non-Poor Districts: 25.9%). In the First Priority Districts, more than 30% of the population lived below the food poverty line. While poverty incidence continuously declined in the Second Priority 19
38 Districts and the other districts between 1992/93 and 2002/03, the First Priority Districts experienced only limited poverty reduction. The fact indicates that the First Priority District required more public investments in to promote further poverty reduction. Therefore, it can be considered that the targeting of the priority districts by NGPES has been quite rational. Table 2-4: Poverty Incidence by Priority (%) Area 1992/ / /03 Food Poverty Food Poverty Food Poverty Poverty Poverty Poverty First Priority Second Priority Other (Source) Committee for Planning and Investment National Statistics Center and World Bank, Lao PDR Poverty Trends 1992/ /3 (2004), p.33, Table 2 and p.41, Table 11 The poverty gap and poverty severity index in the priority districts were also higher than in the other districts (Table 2-5). While the poverty gap was more than 10% in the priority districts, the ones in the other districts was limited to 5.6%. The poverty severity ratio of the priority districts was % whereas the ones in the other districts was only 1.8%. Furthermore, improvement of poverty gap and severity in the priority districts were limited while the other districts continuously decreased the ratios. Expenditures by the poor are far less than the poverty line and inequality among the poor is in severe situation. In other words, there is a huge gap between the poor who are close to the poverty line and the destitute. Area Table 2-5: Poverty Gap and Severity by Priority Poverty Gap 1992/ / /03 Poverty Severity Poverty Gap Poverty Severity Poverty Gap Poverty Severity First Priority Second Priority Other (Source) Committee for Planning and Investment National Statistics Center and World Bank, Lao PDR Poverty Trends 1992/ /3 (2004), p.36, Table 6 and p.41, Table 11 (%) On the other hand, the districts with higher priority had less inequality (Table 2-6). The Gini Index in the First Priority District was 27.8% in 2002/03 which declined from 29.9% in 1992/93. In the Second Priority District, inequality among the population slightly increased to 31.9% from 29.6% for the same period. In the other districts not prioritized, the Gini Index increased from 30.1% in 1992/93 to 32.5% in 2002/03. Table 2-6: Gini Index by Priority (%) District 1992/ / /03 First Priority Second Priority Other (Source) Committee for Planning and Investment National Statistics Center and World Bank, Lao PDR Poverty Trends 1992/ /3 (2004), p.40, Table 10 20

39 2.2 Vulnerability Analysis Comprehensive Food Security and Vulnerability Analysis (1) Food Security Comprehensive Food Security and Vulnerability Analysis (CFSVA) 15 shows the level of food security by area. There are three level of food security: a. Poor: Almost vegan. Marginal diversity and food with low nutrient density. b. Borderline: Vegetable based diets with marginal and opportunistic meat intake. Borderline diversity and food with nutrient diversity, yet low frequency. c. Acceptable: Balanced food group ratios with meat intake > 3 days/week. Sufficient diversity and potential for adequate nutrient intake through regular consumption of foods with nutrient density. The level of food security is determined by the level of food consumptions considering not only calorie intake but also variety of diet. According to the CFSVA conducted in 2006, the majority of the population in the country lived with food security at the acceptable level, as defined by the United (Source) World Food Programme, Comprehensive Food Security & Vulnerability Analysis, (2006), p.87, Map 1 Figure 2-2: Food Security Status of Rural Villagers in the Lao PDR, by province Nations World Food Programme (WFP). On the other hand, 2% of all households in the country suffered from food insecurity and 11% of households lived at the borderline of food security 16. Seventy percent (70%) of households with poor and borderline food consumption were concentrated in only seven provinces: Oudomxay and Bokeo in the Northern Highlands (28% of poor and 17% of borderline food consumption) Luang Prabang and Houa Phanh in the North Xieng Khong in the Central Saravane and Sekong in the Southern Highlands (22% of poor and 20% of borderline food consumption) 15 The overall objective of a CFSVA is provide information to WFP and other development partners in Lao PDR focusing on food insecurity on how best to programme food assistance. It also aims to improve the country s reports and data sets for detailed secondary data analysis in terms of food security and nutritional status in the country as well as links between food security and factors such as government policies. 16 The estimated average rice intake is 575g per person per day based on data from the LECS 3 (2002/03). The urban population consumes 15% less rice than the rural population. Regional differences in the consumption pattern of food were also found. The people in the North tend to eat more rice than the people in the Central and the South. According to the CFSVA, many households eat non-rice staples, including maize, cassava and other roots and tubers, on a daily basis even in the rice harvest period when they should have enough rice available. 21
40 In some provinces, in particular in the Vientiane Plaine and the Mekong Corridor, the number of households with poor or borderline food consumption is small. The CFSVA report indicates that development level of key village infrastructure affects food insecurity: 49% of food insecure households, including 54% of households with poor food consumption and 48% of households with borderline consumption, live in villages with little or no key infrastructure, compare with 34% of households with acceptable food consumption. Also, the report points out that resettlement causes temporary food insecurity for some villagers: 23% of households living in the village for less than 5 years compared to only 12% of those living for more than 5 years are food insecure. Another factor to affect food security is the source of livelihoods of households. The food insecure households are mainly farmers and unskilled labors. The proportion of households with acceptable food consumption is only 57% for farmers and 10% for unskilled labors. Table 2-7: Food Insecurity Status of Households in Rural Lao PDR Province Level of Food Consumption Poor Borderline Acceptable Total Rural Households % of HHs* No. of HHs % of HHs No. of HHs No. of HHs No. of HHs Lao PDR 2 14, , , ,200 North Phongsaly 4 1, ,400 20,000 24,400 Louang Namtha ,000 17,100 20,400 Oudomxay 4 1, ,200 29,100 35,800 Bokeo 11 2, ,700 12,800 22,000 Louang 2 1, ,900 47,800 57,100 Prabang Houa Phanh ,200 29,700 37,600 Xaygnaboury ,200 42,700 47,500 Central Total Xieng Khoang ,600 21,900 29,300 Vientiane ,000 54,400 56,400 Borikhamxay ,900 28,000 Khammuane ,100 43,800 48,400 Savannakhet ,800 97, ,700 South Total Saravanh 4 2, ,600 33,500 48,100 Xékong 10 1, ,300 7,400 9,700 Champasak ,000 83,100 84,500 Attapeu ,300 14,800 16,300 * HHs = Households (Source) World Food Programme, Comprehensive Food Security & Vulnerability Analysis, (2006), p.86, Table 16. (Note) Food consumption groups are categorized as follows: - Poor: Food Consumption Score (FCS) cut-off point <=21 - Borderline: FCS cut-off-point CS cut-off-point Acceptable: FCS cut-off point > 35 (2) Child Nutrition There are significant differences in nutritional status across the agro-ecological zones. In general, the nutritional status is assessed by the following three dimensions: 22
41 Underweight: low weight for age which is primarily malnutrition caused by the unavailability of adequate food to take sufficient calorie, Stunting: low height for age which is chronic protein-energy malnutrition associated with especially inadequate protein intake and repeated infectious diseases, Wasting: low weight for height which is acute protein-energy malnutrition and infectious diseases. The children in the Vientiane Plain have the best nutritional status. On the other hand, the prevalence of underweight and stunting are very high in the Central & Southern Highlands as well as in the Northern Highlands. The geographical region is closely associated with different concentrations of ethnic groups, although the nature of this relationship requires further study. Table 2-8: Prevalence of Child Malnutrition by Ecological Zone (Confidence Interval of 95%) (%) Agro-ecological zone Underweight Wasting Stunting Vientiane Plain Central & Southern Highlands* Mekong Corridor Northern Highlands Northern Lowlands (Source) World Food Programme, Comprehensive Food Security & Vulnerability Analysis (2006), p.99, Table 18 (Note) * including the Bolaven Plateau By presence of fragile land 17, there is no significant difference in underweight and wasting. However, in the areas with more than 70% of fragile land, children suffer from the highest level of stunting at 54%. Table 2-9: Child Nutrition Status by Presence of Fragile Land (Slope of more than 16%) (%) Sloping Class Underweight Wasting Stunting 0-30% % More than 70% (Source) World Food Programme, Comprehensive Food Security & Vulnerability Analysis (2006), p.99, Table 19 The nutritional status of households belonging to the Lao-Tai family is better than that of other ethno-linguistic families. According to the CFSVA, this is because the majority of Lao-Tai households had sufficient food security despite that 7% of Lao-Tai were food insecure households. Hmong-Mien also had a better nutrition status rather than the other ethnic groups, although 28% of households belonging to Hmong-Mien were food insecure. On the other hand, Mong-Khmer and Tibeto-Burman had a very poor nutritional status of the children due to poorer food security: The prevalence of underweight and stunting among Mong-Khmer were 36% and 54% while 44% of their households were food insecure. Tibeto-Burman had the highest underweight ratio of 39.8% and the highest stunting ratio of 61.9% though food insecure Tibeto-Burman households accounted for 22% of the total number 17 Fragility of land is defined by the degree of slope. The slope with more than 16 degree is considered as fragile land. 23

42 of food insecure households in the country, which was better than the food security status of Mong-Khmer. Most of Mong-Khmer and Tibeto-Burman could neither have sufficient nutrition nor adequate diet, in particular protein. They have limited access to food and nutritional variety due to their low productive subsistence shifting cultivation and remoteness far from the market. Many ethnic groups, in particular those practicing shifting cultivation, substitute or mix rice with maize, roots and tubers, especially in the months before the rice harvest (June-September). It is a coping strategy for some households to make dwindling rice stocks last longer. Table 2-10: Child Nutrition Status by Ethnicity (%) Ethno-linguistic Families Underweight Wasting Stunting Lao-Tai Austro-Asiatic (Mong-Khmer) Sino-Tibetan (Tibeto-Burman) Hmong-Mien (Source) World Food Programme, Comprehensive Food Security & Vulnerability Analysis (2006), p.100, Figure Hazard Analysis (1) Unexploded Ordnance (UXO) The Lao PDR is the most heavily bombed country in the world per capita. During the Indochina war from 1964 to 1973, it is estimated that more than 2.6 million tons of bombs were dropped over an area of 84,000km 2 which account for one third of the country s land. The estimated number of unexploded sub-munitions is 78 million. UXOs were confirmed in 15 provinces which have been affected severely. In particular, the following 8 provinces have suffered from the most severe UXO contamination: Savannakhet, Saravane, Champasack, Attapeu (South), Khammuane, Luang Prabang (Central), Xiengkhuang, and Hauphanh (North). A country-wide survey on the socio-economic impact of UXO 18 reported that 25% of all villages in the country were contaminated by UXO. Unexploded ordnances are believed to be one of cause of poverty. Some of the most UXO-contaminated communities are also the poorest in the country. Since the affected areas represent 50% of all agricultural land, the UXO contamination (Source) Lao National Unexploded Ordnance Programme, 2009 Work Plan Figure 2-4: UXO Contamination Map 18 The survey was carried out for the years 1996 and
43 restricts access to agricultural land and production, causing food shortages. Also, many of the poor and vulnerable groups in remote rural communities face the dilemma of risking life and limb in tampering with UXO, or continuing to live in impoverished conditions. According to the CFSVA, 17% of households living in villages with UXO problems have poor or borderline food consumption against 12% of households in other villages. Since UXO clearance is critical to ensure the safety of the people living in the affected areas and to increase available land for food production as well as other socio-economic activities, the Lao Government established the Lao National Unexploded Ordnance Programme (UXO Lao) 19 with the support of donors, including United Nations Development Programme (UNDP) and United Nations Children s Fund (UNICEF), in UXO clearance activities contribute to the country s poverty eradication strategy. Between 1996 and 2007, UXO Lao destroyed more than 371,000 sub-munitions which account for only 0.47% of the estimated number of UXO in the country. Table 2-11: UXO Clearance ( ) Province Agricultural Land (ha) Others (ha) Total Area (ha) Beneficiaries North Louang Prabang 1, , ,496 Houa Phanh 1, , ,901 Central Xieng Khoang 2, , ,513 Khammuane ,880 Savannakhet 2, , ,393 South Saravanh 1, , ,628 Xékong , ,012 Champasak 1, , ,134 Attapeu , ,518 Total 11, , , ,071,475 (Source) Lao National Unexploded Ordnance Programme, Annual Report (2007 and 2008) (2) Natural Disasters For every year from 1966 to 2002, at least part of the country was affected by drought or flood, or a combination of both. According to CFSVA, it is estimated that 46% of the rural population is vulnerable to drought. The vulnerable population inhabit the lowlands, in particular, in the South and the provinces of Xaygnaboury and Luang Prabang. Most households vulnerable to drought are farmers or agricultural unskilled labors. In addition, it is estimated that around 188,000 households (around 20% of the total households in the country as of 2005 by the Census) are at risk of food insecurity caused by drought. Most of them live in Khammuan, Savannakhet, Vientiane Province (Central), Saravane, Champasak (South), Xaygnaboury (North) (Refer the brown-colored area of Figure 2-5). Flooding is the main natural disaster in the country, both in terms of frequency and consequences. Usually, floods occur from August to September in the Central and Southern parts of the country. Although the annual floods along the Mekong river benefit the people 19 This is a Nationally Executed Project of the Ministry of Labour and Social Welfare and UNDP. 25

 World Food Programme, Comprehensive Food Security & Vulnerability Analysis (2006) Figure 2-5: Households at Risk of Food Insecure by Drought (excluding chronically food insecurity)")
44 through the increase in availability of fish and other aquatic animals, as well as by enriching the soil and thereby possibly increasing rice production, large floods cause damage to assets, including housing, agricultural production and livestock. The number of people affected in each major flood ranged from 2,000 to more than 590,000. All households in flooded areas have a high risk of becoming worse off if they depend on agricultural crop production, livestock production, labor and other activities inside the flooded area. (Source) World Food Programme, Comprehensive Food Security & Vulnerability Analysis (2006) Figure 2-5: Households at Risk of Food Insecure by Drought (excluding chronically food insecurity) Figure 2-6: Drought Prone Areas in Lao PDR 26
45 Chapter 3 Explanatory Factors of Poverty in Laos 3.1 Domestic Factors National Development and Public Expenditure In the early 2000s, the Government of Lao PDR set forth a national development as well as poverty reduction strategy to help it to graduate from the Least Developed Country (LDC) status by 2020, as laid out in the National Socio-Economic Development Plan (NSEDP) and the National Growth and Poverty Eradication Strategy (NGPES). Based on these strategy and plan, the Government shifted public investment programs more towards the Northern Highlands, the Northern Lowlands and the Central-Southern Highlands. Donors supported the Government s strategies and increased their assistance to these areas. The WB report published in pointed out that through both public and donor-funded investment, the number of rural households involved in development projects in those areas increased and is correlated with the reduction of poverty in those areas. Infrastructure investment created better links to markets and social services, and therefore reduced poverty in remote uplands areas Domestic capital Foreign capital Investment Expenditure (Kip billion) Vientian e C. Phongsa Luangna Oudomx Borkeo Luangpr ly mtha ay abang Houapha Xayabou Xiengkh Vientian Borikha n ly ouang e P. mxay Khammo Savanna Saravan Champa Sekong Attapeu Xaysom uan khet sak boun Domestic capital Foreign capital Investment Province (Source) Ministry of Finance, Official Gazette: State Budget Implementation Report FY2002/03 (Note) Reference exchange rate is 1 USD = 10, Kips (period average of 2003, by IMF, International Financial Statistics Yearbook 2009 ) Figure 3-1: Public Investment by Province (2002/03) In terms of food security, a Food Security Strategy has been implemented under the Ministry of Agriculture and Forest from 2000 to While the strategy aimed to boost rice production to meet the caloric needs of the entire population, it did not address associated issues such as malnutrition, lack of dietary diversity and knowledge among the population which affect vulnerability of food and nutritional security On the other hand, although nutritional policies had not been highly prioritized in the Government s agenda, a National Nutrition Policy was adopted in 2008 by the Ministry of Health in cooperation with the Ministry of Health and 20 World Bank, Lao PDR: Rural and Agriculture Sector Issues Paper, (2006) 27
46 other ministries, including the Ministry of Agriculture and Forestry, the Ministry of Education, and the Ministry of Planning and Investment Industrial Structure and Employment (1) Industrial Structure In the Lao PDR, agriculture remains the single largest source of food and income for the rural population, accounting for 50% of GDP and 70% of total employment. However, it is estimated that around 40% of the population involved in agricultural activities are impoverished. According to the WB s poverty assessment, poverty reduction for the decade from 1992/93 to 2002/03 is linked to the growth of non-agriculture sector rather than the growth of agriculture. When the poverty incidence for the two periods of 1992/ /98 and 1997/ /03 are compared, the decline in the first period is larger than the second period. It implies that the higher growth of non-agriculture sector led the faster poverty reduction in urban areas though it slowed down. In other words, the lower growth of the agriculture sector brought about the slower poverty reduction in the rural areas than in urban areas. On the other hand, the non-agriculture sector, such as manufacturing, construction and service sectors, can provide employment opportunities with the people in the urban and peri-urban areas where those industries are located and so far less benefit to the rural population with limited access to such employment opportunities. Table 3-1: Poverty and Sectoral Growth (1992/ /03) Indicator 1992/ / /03 (%) Growth Rate 1992/ / / /03 Poverty Incidence GDP Share Agriculture Non-agriculture Employment Share Agriculture Non-agriculture (Source) World Bank, Lao PDR Poverty Assessment Report Volume II: Main Report, p.19, Table 6 Most rural households operate small plots of farm without irrigation, and most farming is subsistence farming. According to LECS 3, only 23% of grain production in rural areas was sold at market. It suggests that the most agriculture productions are consumed by rural households for their food subsistence. Therefore, those rural households partly or fully engaged in crop production have higher poverty because their limited crop production results in limited income. For the recent years, the contribution to GDP growth has been shifting towards the resource sectors, such as the mining sector (mostly copper and gold) and the power sector. Also it is expected that the exports of the country will be boosted by the implementation of large hydropower plant projects and the further expansion of mining will benefit to the national 21 The policy was prepared with the support of international donors, including FAO, WHO, WHO, UNICEF and WFP. 28

 Employment Opportunities and Internal Migration According to the WB s poverty assessment, triggers for internal migration from rural areas include: improved infrastructure access; rural")


47 economy. Since it can be assumed that the such macroeconomic growth led by the resource sector may enhance the national economic level as well as may contribute to further poverty reduction in the country, it is necessary to analyze changes in poverty incidence after LECS 3 and factors affecting poverty in the country. (2) Employment Opportunities and Internal Migration According to the WB s poverty assessment, triggers for internal migration from rural areas include: improved infrastructure access; rural development policies, including stabilization of shifting cultivation; land reallocation; focal site development; and opium eradication. These policies may have increased vulnerabilities of the rural poor population, which in turn may have forced them to migrate to lowland areas. In addition, urbanization and economic growth in Vientiane Capital, Savannakhet, Pakse, Thakek and Luang Prabang is a driving force for rural-to-urban and upland-to-lowland migration. Such internal migration with remittance, may be contributing to poverty reduction in the North and the highland areas. On the other hand, low levels of formal education and ethnic differences are impediments to rural people considering migration. Internal migration is often from upland to lowland. Rural poor who have limited opportunities to migrate may have fewer chances to move out of poverty. At the same time, differences in opportunities to migrate may increase inequality among the rural population. Village population born in a different district Percentage of village population District net migration in last 12 months (immigrants minus emigrants) Percentage of district population (Source) Swiss National Center of Competence in Research North-South and International Food Policy Research Institute, Socio-economic ATLAS of the Lao PDR, p.43 and p.45 Figure 3-2: Internal Migration Figure 3-3: District Migration Figure 3-4 shows availability of job in villages. The higher percentage of villages with lack of job indicates the higher motivation of villagers for migrating to a place with more income 29
48 opportunities. In some provinces, the share of villages with less opportunities increased, in particular Savannakhet in the Central and Attapeu in the South, which have higher poverty incidence in 2002/ / / % of Villages with Lack of Job Phongsaly Luangnamt Oudomxay ha Borkeo Luangprab ang Houaphan Xayabouly Vientiane C. 2002/ / Province Xiengkhou ang Vientiane P. Borikhamx ay Khammoua Savannakh n et (Source) Ministry of Planning, Department of Statistics, The Households of Lao PDR, LECS 3 (2002/03) and LECS 4 (2007/08) Saravan Champasa k Figure 3-4: Percentage of Villages of having Lack of Job (%), (2002/ /08) Sekong Attapeu On the other hand, while the pressure for internal migration has been expanding, poor road infrastructure and difficult transport conditions in rural villages constrains the mobility of the rural population. In the North, in the most provinces, the majority of the population has to travel on average more than 20kms to the district center by foot. In particular, in Xaygnaboury, which had a poverty incidence of more than 50%, the average distance to district center is approximately 50 km and the main means of transport is the hand tractor. In the Central, people travel km by motorbike or hand tractor to their district center. In the South, the average distance to the district center ranges from 10 to 30 km, but the main means of transport differs from province to province. Region Table 3-2: Road Access and Transport Conditions by Province Average Distance to District Center (km) Motorable Road Availability Score* Main Means of Transport (% of Villages) North Phongsaly Foot (68) Louang Namtha Foot (68) Oudomxay Foot (80) Bokeo Foot (40) Louang Prabang Foot (32) Houa Phanh Foot (60) Xaygnaboury Hand Tractor (52) 30
49 Central Region Average Distance to District Center (km) Motorable Road Availability Score* Main Means of Transport (% of Villages) Xieng Khoang Foot (68) Vientiane Motorbike (50) Borikhamxay Motorbike (20) Khammuane Bicycle (24) Savannakhet Hand Tractor (42) Xaysomboun South Saravanh Hand Tractor (24) Xékong Foot (46) Champasak Motorbike (36) Attapeu Bicycle (60) (Source) World Food Programme, Comprehensive Food Security & Vulnerability Analysis (2006), p.44, Table 4. (Note) * 1= Low access (track and earth roads), 2= Moderate access (gravel/paved and track/earth road), 3= Better access (gravel and paved roads) Resources (1) Land and River The Lao PDR has traditionally been divided into three topographical regions: the Lowland Flood region, the Midlands/Plateau, and the Uplands. The Lowlands have relatively flat land which is suitable for food production and agriculture, making them the most productive areas in the country. The Midlands is less suitable for paddy rice production, but is still suitable for industrial crops such as coffee and fruit, as well as animal husbandry, which bring about cash income opportunities. On the other hand, the Uplands, which cover the largest area of the country, face constraints in food production and agriculture Fragility of land also affects agriculture productivity which is closely linked to household income in rural areas. Land with slopes steeper than 16 degrees is considered fragile land which is unsuitable for intensive and productive agricultural production. Fifty eight percent (58%) of the land in the country can be characterized as fragile land. The presence of fragile land varies across provinces. Champasak and Savannaket have relatively little fragile land at 14% and 15% respectively, whereas provinces in the North, such as Huaphanh, Luang Prabang, Phongsaly, Luang Namatha, Oudomxay and Xiengkhuang, have 75-85% fragile land. The provinces covered by fragile land have limited agricultural production which contributes to poverty and food insecurity in the areas. In addition, the Lao PDR is characterized by the many rivers which traverse the country: 87% of the land is within the Mekong River Basin System which has 28 big tributary rivers. Besides the Mekong Basin, in northeastern areas four other rivers flow to Vietnam and have water throughout the year, even in the dry season. These rivers are an important source of irrigation for more productive agriculture. However, for rice production, only 15% of the total harvested land was irrigated in despite of the abundant water source for irrigation. The limited development of irrigation in the country, in particular, in the northeastern areas, is because of fragile topography. Low agriculture production hinders food security as well as income opportunities, which are 22 The total rice harvested area is 619,950 ha and the irrigated area is 94,072 ha. (Department of Statistics, Ministry of Planning and Investment, Statistical Yearbook 2008 (2009), p.40-41) 31
 23 in 2006 found that the primary cause of poverty identified by villagers is limited access to land to cultivate, which was the same response given for the")

 Swiss National Center of Competence in Research North-South and")
 Forest The Lao PDR also has vast tracts of forested land.")
50 both key factors in determining levels of poverty. The Participatory Poverty Assessment (PPA) 23 in 2006 found that the primary cause of poverty identified by villagers is limited access to land to cultivate, which was the same response given for the last PPA conducted in For example, among the 65 Mon-Khmer villages targeted by the PPA, only 19 villages were cultivating more than an average of 1 ha per household, which is far below the minimum size to obtain rice or staple sufficiently. Households operating agricultural land Percentage of village population Average size of agricultural land Ha per household (Source) Swiss National Center of Competence in Research North-South and International Food Policy Research Institute, Socio-economic ATLAS of the Lao PDR, p.109 and p.111 Figure 3-5: Households Operating Agricultural Land Figure 3-6: Average Size of Agricultural Land per Household (2) Forest The Lao PDR also has vast tracts of forested land. Forest areas still cover up to 25% of land in some Northern provinces and as much as 70% in some Southern provinces. In the country, poverty is linked to environmental conditions because the poor rely disproportionately on the environment, in particular, agricultural biodiversity resources, in order to meet their daily needs. Forests supply the poor with non-timber forest products for consumption, shelter, fuel and also provide a source of income. In the North, the lack of flat land for permanent and stable agricultural cultivation causes the continuous traditional practice of shifting cultivation. In the Central and the South, forested areas have more pressures to expand cultivated land by encroaching lowland farmers because low yield agriculture depending on traditional cultivation. The high dependency on natural 23 A PPA was carried out with the technical assistance of the Asian Development Bank (ADB). It provided a qualitative analysis to complement the quantitative poverty analysis for better understanding of poverty status. 32

51 resources for food security and income generation increases the rate of environmental degradation. Environmental degradation with loss of agricultural biodiversity not only affects food availability and production but also threaten the livelihoods of people. According to the CFSVA, the households affected by a continuous degradation of forest resources, or by reduced access to natural resources, have less access to wild vegetables, fruits, fish, other aquatic animals and wild meat. Overall, it is estimated that around 157,000 households, or 24% of the rural population in the country, would become food insecure if opportunities for fishing, hunting and gathering were limited. Households in the two provinces of Bokeo (North) and Khammuane (Central) are considered to be highly vulnerable because they have more restricted forest access. The other provinces in the North and the South have 21-30% of vulnerability. (Source) World Food Programme, Comprehensive Food Security & Vulnerability Analysis (2006), p.122, Map 4 In order to mitigate the increase in pressures Figure 3-7: Vulnerability of households to on forest areas for cultivation, the Restricted Forest Access Government has been implementing policies (excluding chronically food insecure) to reduce the extent of swidden agriculture. The introduction of National Biodiversity Conservation Areas (NBCA) is also supposed to improve management of natural resources Ethnicity Differences in tradition and culture, as well as differences in where different ethnic groups are geographically located and their primary source of livelihood, are linked to access to economic opportunities and social services. According to the Population and Housing Census 2005 (hereinafter referred to as the 2005 Census ), 43% of all villages are inhabited by only ethno-linguistic family while villages dominated by one ethno-linguistic family accounted for 45% of the total number of villages. On the other hand, only 12% of the villages have a mix of inhabitants with more than two ethno-linguistic families. Therefore, it is important to analyze how ethnic factors may be linked to poverty in the country. Within the four main ethno-linguistic families in the country, there are 49 recognized ethnic groups and some 160 seng or subcategories. In addition, according to the 2005 Census, other ethnic minorities accounted for 0.2% of the total population. According to the 2005 Census, 66% of the population is Lao-Tai. They live in the Mekong Corridor along the Thai border, with relatively good access to markets and economic activities, or in the Northern Lowlands. They are engaged in settled cultivation in rural areas, and formal 33


52 or informal economic activities in urban areas. Since they have more income opportunities and social services than other ethnic groups, the poverty incidence among them is much lower than that of other ethnic groups. Mon-Khmer comprises 24% of the total population. They mainly live in highland areas across the country from North to South. Most of them are engaged in shifting cultivation and are fairly assimilated into Lao-Tai communities due to hundreds of years of interaction. Most mixed villages are comprised of these two families, Lao-Tai and Mon-Khmer. On the other hand, other some Mon-Khmer communities are isolated and engage in hunting and gathering activities in forests. Due to severe living conditions in the highlands and limited access to markets, basic infrastructure and social services, more than half of the Mon-Khmer suffer from poverty. (Source) Swiss National Center of Competence in Research North-South and International Food Policy Research Institute, Socio-economic ATLAS of the Lao PDR, p.89 The Sino-Tibet (Tibeto-Burman) family, including the Akha, Lahu and Sila, is a minority group in the county accounting for 3% of the Figure 3-8: Composition of Villages by Ethno-Linguistic Families country s population. They mainly live in poorly-connected upland areas and are engaged in shifting cultivation. Their challenging living conditions with limited connectivity to market and public services contribute to a high poverty incidence. The Hmong-Mien accounts for 8% of the total population. They also depend on shifting cultivation in the mid- and upland areas in the North. They also face difficult living conditions and consequently experience high levels of poverty. 3.2 Geopolitical Factors Employment Opportunity and Border (1) Labor Migration In Thai border areas, the poverty incidence has been relatively lower than in other border areas and non-border Inland areas. Households living in the Thai border areas have more opportunities to emigrate to Thailand as migrant workers and to receive remittances while there is limited employment or cash earning opportunities within the country. According to the WB s poverty assessment, more substantial migration out of the country appears to take place from richer flood-prone lowlands than from poorer drought-prone areas. Since the areas along 34

53 the Mekong are better connected to the border economy, in particular Thailand, households living in districts along the Thai border receive nearly three times more remittances than other households. Common language and similar traditions are also strong forces for Lao migration to Thailand. It is striking that poverty has also been reduced in the areas along the China-Myanmar border. This is because of dynamic economic growth in the southern region of China, strong demand for agricultural products, and the growth of tourism 24. The rural economy in the country has been opening up and beginning to benefit from trade with dynamic cross-border markets, including cross-border contract farming and commercial plantations, financed by foreign or domestic agro-business. Such economic activities also often include unrecorded informal trade. The greatest challenges persist on areas bordering Vietnam, where a large and increasing number of rural poor live. The main determinants of poverty in these areas are remoteness and inaccessibility on both sides of the border, which hinder the kind of dynamic economic activities found on the China-Myanmar border. (2) Human Trafficking The same factors which encourage labor migration, including improved transport infrastructure and services, stabilization of shifting cultivation, land reallocation and opium eradication, also contribute to human trafficking 25 from the Lao PDR. Human trafficking is closely linked to rising legal and illegal labor migration from the country. The main destination of the victims of human traffickers is Thailand, due to the proximity, similarities in culture and language, and better economic conditions. It is estimated that there may be an additional 80,000 unregistered migrants in Thailand besides the 181,614 registered migrants from the country in The trafficking of Laotians to Myanmar and China for the purposes of buying and selling brides has also been reported. Provinces along the Thai border have the highest rates of migration and official cases of human trafficking. However, there are well-established informal networks that act as safeguards in some areas with high migration. It is estimated (Source) United Nations Inter-Agency Projects on Human Trafficking (UNIAP), Human Trafficking Data Sheet (2008) Figure 3-9: Human Trafficking Routes of Lao PDR 24 The Government of Lao PDR, Millennium Development Goals Progress Report Lao PDR 2008 (2009), p Human trafficking is a serious violation of human rights. It involves the illegal trading of women, children, and men for the purpose of sexual and labor exploitation. (UN Protocol to Prevent, Suppress and Punish Trafficking in Persons, Especially Woman and Children, UN 2000) 35

54 that the number of trafficking cases from rural areas in Laos to Thailand over the last ten years number more than 20,000. Factors which increase the vulnerability of people to trafficking include poverty, lack of education and awareness, lack of employment opportunities, and dysfunctional families. It is estimated that 1.4% of the total Lao migrant workers in Thailand is considered to be at high risk of trafficking Opium Cultivation Opium poppy farmers in the Lao PDR are ethnically diverse and live in remote, mountainous areas. In these upland areas, difficult agricultural and geographic conditions contribute to high poverty incidence. In addition, opium addiction increases the vulnerability and risk of poverty for households with addicts. The estimated total number of opium addicts is 12,680 which are predominantly from the Northern provinces in It accounted for around 1% of the total population in the Northern Provinces. Almost 40% of addicts come from Houaphanh and Phongsaly. Table 3-3: Eradication of Opium Cultivation by Province (2008) (ha) Province Eradicated Area North Total Phongsaly Louang Namtha Oudomxay Bokeo Louang Prabang 47.3 Houa Phanh Xaygnaboury Central Total Xieng Khoang Vientiane 6.27 Borikhamxay (Source) United Nations Office on Drugs and Crime, Opium Poppy Cultivation in South East Asia: Lao PDR, Myanmar, Thailand (2008), p.26, Table 4. (Source) United Nations Office on Drugs and Crime, Opium Poppy Cultivation in South East Asia: Lao PDR, Myanmar, Thailand, p.29, Map 3 Figure 3-10: Number of Opium Addicts and Prevalence, Northern Lao PDR, 2008 The majority of opium poppy cultivation was identified in five provinces in the North. The Government of Lao PDR made a commitment to end opium cultivation in these areas by As a result, a total of 575ha constituting 36% of all cultivated opium poppy, has been destroyed. 36
55 According to the Lao PDR Opium Survey , the most vulnerable former poppy growing communities reorganized their entire agricultural system by intensifying production, such as rubber planting due to the financial assistance by the Alternative Development Funds. This resulted in an improvement in their living standards 27. However, these communities are falling behind the non-opium poppy growing communities in terms of living standards. In the most vulnerable former poppy growing districts, only 41% of former poppy growing households have enough livelihoods assets to cope with the end to opium cultivation. This suggests that 59% of the households have enough livelihoods resources to preserve a minimum standard of living, but not enough to cope with shocks and/or to invest in new alternatives. In other words, those households need additional development support. Furthermore, 15% of them have very poor living standards and are considered at risk of quickly reverting back to poppy cultivation since they subsist day by day, due to their limited access to alternative sources of income. It is estimated that a maximum of 1,400 villages currently need additional development assistance. In response to this situation, the Government of Laos, supported by the United Nations Office on Drugs and Crime (UNODC), has developed a Comprehensive National Drug Control Master Plan ( ), which provides support to families during the critical 3-5 year period after poppy cultivation elimination. 3.3 Factors related to Globalization Remittance According to the CFSVA, 8% of households reported receiving some support in the form of cash transfers or in-kind from friends or relatives living outside the households over the past 12 months, but very few reported receiving support regularly and the majority of them receive support occasionally. Households living in four provinces have a relatively higher incidence of remittances: Saravane, Vientiane, Champasak and Savannakhet. On the other hand, the following five provinces received few remmitances: Phongsaly, Oudomxay, Khammuane, Xekong and Attapeu. Table 3-4: Incidence of Remittance % of Incidence Province 15%=> Saravane (20%) Vientaine (18%) Champasak (17%) Savannakhet (15%) 5%< Phongsaly Oudomxay Khammuane Xekong Attapeu (Source) World Food Programme, Comprehensive Food Security & Vulnerability Analysis (2006), p.59 By ethnicity, Hmong-Mien and Lao-Tai had tighter links and more support from outside, with their incidence of remittance at 15% for Hmong-Mien and 14% for Lao-Tai. On the other hand, Mong-Khmer and Tibeto-Burman households had very low incidence: 3% for Mong-Khmer and 6% for the Tibeto-Burman. The WB s poverty assessment pointed out that remittances from abroad are an important source 26 United Nations Office on Drugs and Crime and Lao National Commission for Drug Control and Supervision jointly conducted the survey. 27 The Lao Opium Survey 2009 shows a case study of alternative income generation activities in former opium poppy cultivating villages in Phongsali province supported by the Phongsali Alternative Development Fund. 37
56 of income to mitigate poverty, though only 3% of households in the country received cash remittances or cash gifts from abroad. There are also differences across the different ethnic groups. While Mon-Khmer and Tibeto-Burman rarely receive funds from abroad, about 9% of Hmong-Mien benefited from overseas remittances since a large number of Hmong-Mien live abroad 28 following their resettlement after the U.S-Vietnam war. Among Hmong-Mien households receiving remittances, poverty incidence went down by almost 80%. Another group benefiting from remittances is Lao-Tai: 3.3% of them received remittances from abroad, mainly from Thailand Regional Growth in the Greater Mekong Sub-Region Despite facing constraints as a landlocked country, the Lao PDR has benefited from growing neighboring economies in the Greater Mekong Sub-Region (GMS). The GMS region experienced rapid economic growth over the last two decades. Areas which were formerly impoverished and remote have changed through expansion, integration, diversification and convergence. The economic growth and expansion of Thailand, which has traditionally had the most developed economy in the GMS region, slowly accelerated economic reform and liberalization in the Lao PDR. Rapid economic growth in Vietnam and the Yunnan Province of China has also stimulated the local economies of the border areas. In particular, it is expected the foreign investments in hydropower projects as well as mining industries from the GMS countries, including China, and the non-gms countries, will boost further growth of the Lao economy. Such macroeconomic growth may contribute to further poverty reduction in the country through reinvestment and redistribution of the economic benefits. 28 The majority of Hmong-Mien abroad live in countries such as Australia, New Zealand, Canada and the United States. In the United States alone, there are more than 180,000 Hmong-Mien. 38
57 Chapter 4 Mechanism of Social Protection 4.1 Formal Public Social Protection System As of August 2009, the total number of persons covered by the formal social protection system was approximately 465,000 29, or 7.82 % of the total population of 6 million in the Lao PDR Social Security Schemes The Ministry of Labor and Social Welfare and the Ministry of Health provide social security schemes, with different systems for specific target populations: civil servants; enterprise employees, and the self-employed including farmers. (1) Social Security Scheme for the Public Sector A pension and social security fund for civil servants started in 1993 with the Decree 178/PM and Implementing Guidelines 2282/ML&SW. It is managed by the Department of Social Security of the Ministry of Labor and Social Welfare. Benefits are provided for civil servants, their spouses and dependants less than 18 years old working for the Party, Government, Mass Organizations, military and police: (i) health care insurance, (ii) work accident compensation, (iii) maternity benefits, (iv) invalidity pensions, (v) old age pensions, (vi) funeral grants, (vii) lump sum survivors benefits, and (viii) pensioners orphans allowances. The Government provides subsidies to secure funds for social security, and civil servants are required to pay 6% of their basic salary on a monthly basis. With the Decree No. 70/PM dated 20 April 2006, reforms to further develop social security schemes for public sector have been promoted. Since 2008, the State Authority of Social Security (SASS), a financial autonomous organization under the guidance of the Ministry of Labor and Social Welfare, has handled the public sector scheme, and benefits are: (i) health insurance, (ii) Child birth benefit and child birth grants, (iii) employment injury and occupational diseases benefits, (iv) invalidity benefits, (v) sickness benefits, (vi) old age pension benefits, (vii) survivors benefits, and (viii) funeral grants. Under the scheme, 8% of civil servants basic salaries is deducted monthly and 8.5% of it is borne by their employers. Currently, 300,000 persons are covered by this social health insurance scheme 30. (2) Social Security Scheme for Enterprises The Social Security Organization (SSO) was established in 2000 under the supervision of the Social Security Agency of the Ministry of Labor and Social Welfare and started operations in June 2001 to handle social security schemes for enterprises. The system is compulsory applied to the state owned enterprises (SOE) and joint and private enterprises employing 10 or more employees as stipulated by the Decree No. 207/PM (23 Dec 1999) 31. Their employees, spouses and children up to the age of 18 are benefited with (i) funeral benefits, (ii) medical care benefits, (iii) sickness benefits, (iv) maternity benefits, (v) employment injury and occupational diseases benefits, (vi) invalidity benefits, (vii) retirement pensions, (viii) survivors benefits, (ix) 29 According to the International Social Security Association, the coverage by the four schemes are the following: SASS: 300,000, SSO: 85,000, CBHI: 65,000, HEF: 15,000 as of August To deal with low compliance and to improve institutional arrangements, a Social Security and Social Health Protection Law is planned to be enacted and phased in from 2015 to 2020 with the nation-wide introduction of the Lao National Social Security System and the National Social Health Protection Fund. Republic (accessed June 2010) 30 Number of government employees was approximately 138,000 in the 2005 Census. 31 Smaller enterprises employing less than 10 employees can also participate voluntarily in the system. 39
58 child allowances, and (x) unemployment benefits. The calculation of contributions or premiums draws on an individual employee s salary or wage. The total contribution rate is 9.5%, of which 5% comes from employer s contributions and another 4.5% from the individual employee based on his or her monthly salary. As of 31 December 2008, 43,058 persons from 493 employment units paid contributions to the Social Security Fund 32. The total number of beneficiaries (including insured persons and their dependents) covered by the scheme was 85, Health Insurance Scheme for Self-Employees and Informal Sector Health insurance is still relatively new to the Lao population. Unlike the social security schemes for public servants and enterprise that compulsory cover their employees, majority of the population: self-employed persons including farmers, their spouses and dependents, and employees in the informal sector, are not benefited by such insurance. According to the 2005 Census, there are 7,000 employers, 1.15 million self-employed, 1.26 million unpaid family workers existing in the country, who are not in the basket that social security scheme has reached yet. Several options have been introduced for those out of the basket. One of them is health insurance package offered by private insurance companies such as a subsidiary from AGF of France 34. Others are community-based options for health insurance: Community Based Health Insurance and Equity. (1) Community Based Health Insurance The Community Based Health Insurance (CBHI) was initiated on a pilot basis 35 by the Community-Based Health Insurance Division under the Department of Planning and Finance of the Ministry of Public Health. The scheme is currently being expanded throughout the country under the Regulation No 723/MoH dated 13 April ,000 people are covered by the CBHI as of August (2) Special fund for the poor With the low percentage of the population covered by health insurance and low prospects for the health insurance scheme to cross-subsidize health care costs, the Health Equity Funds (HEFs) have been piloted to improve the access to and affordability of health care services (including food and transportation costs) for the poor. It is currently funded by bilateral donors and lending banks and implemented by external partners and NGOs. The Ministry of Health stipulates that the funds be used to purchase CBHI membership for low-income families for free services at hospitals. The target group is mainly the very poor. Benefits include medical services, drugs, supplies, laboratory tests, transport, food and soap. Approximately 15,000 people are covered by the HEFs as of August (3) Welfare Policy for Vulnerable Groups Benefits are offered by the Government to particular vulnerable groups as shown in the following Table. 32 Private employees and state enterprise employees reached 120,000 and 20,000 respectively (as of 2005) (accessed June 2010) 34 The subsidiary from AGF of France, was allowed to operate in Sethathirath, Luangphabang and Champasack districts 40
59 Table 4-1: Welfare Program for Vulnerable Groups War victims Target Elderly People and the Disabled The Remote Poor without Food Residents suffered from Natural Calamities Contents War victims are transferred to state-owned houses and land, where they live with their proper ownership. The Government also builds up new villages with new houses for those who do not own houses. It also established centers for people with disabilities in both the central cities and provinces. The Government established a National Policy towards the Elderly. For the disable people, the Decree of the Prime Minister No.18 was issued in June 1995 for the establishment of a National Commission for the Disabled. Food assistance Food Assistance 4.2 Quasi-formal Social Security System Demand for microfinance services in the country is immense. It is partly due to the weakness of the financial sector, which is characterized by weak capitalization, insufficient expertise and a lack of product diversity. People in lower income groups have only a very limited access to adequate financial services such as means for financing investments or emergency funds. Rural households, which make up 80% of all households and 90% of poor households, are particularly poorly served by the financial sector and have unsatisfied demand for credit that amounts to USD 500 million Microfinance Activities by Public Sector and Banking Sector Government projects and mass organizations are still the major players of microfinance activities in the country, providing 80% of all microfinance loans. Commercial banks provide loans to the lower segment, making up an estimated 15% of the total amount of microfinance lending. Among mass organizations, Lao Women s Union (LWU) is the largest recipient of funds from NGOs, government and foreign donors, and approximately over 200,000 of their members are the beneficiaries of microfinance. The Government has given the Agriculture Promotion Bank (APB), a state-owned commercial bank (SOCB), the responsibility to support rural economic development using subsidized, targeted lending and group guarantee lending technology, and until recently, the APB was the only bank involved in microfinance in the country. The APB has one of the largest networks with branch offices in each of the 17 provinces and 46 service units. As of the end of 2004, out of 120,000 households (15% of the population) with access to the APB, 40,000 (5% of the population) had access to the APB s microfinance initiatives 36. Since the promulgation of the Law on the Promotion of Foreign Investment (2005) and the improvement of the Law on Commercial Banks (2007), new commercial banking licenses have been issued, and some newly created banks such as ACLEDA Bank Lao Ltd. 37, Phongsavanh 36 (accessed June 2010) 37 ACLEDA was originally established in January 1993 as a national NGO in Cambodia or micro and small enterprises development and credit. It obtained a license as a commercial bank in 2003 with more funding options to expand microfinance business nationwide. As of the end of 2008 it has a loan portfolio of USD 590 million to more than 253,186 borrowing customers. ACLEDA Bank established its first international subsidiary commercial bank in 41
60 Bank and Indochina Bank are expanding their outreach with experience and expertise in delivering financial services to the lower segment. As part of its strategy to alleviate poverty, the Government has identified 47 districts out of 142, as mentioned in the Chapter 2, that are considered the poorest and in greatest need of assistance. In the said districts, subsidized targeted lending is used as part of poverty reduction program, financed from the state budget. For this purpose, village revolving funds (VRF) are created (as described below) by the National Leading Committee for Rural Development and Poverty Reduction (NLC-PDRP), which is part of the Prime Minister s Office. The Government also established the Rural and Micro Finance Committee (RMFC) under the Bank of the Lao PDR (BOL) to assess the rural and microfinance industry, formulate policy statements 38, and develop action plans for the implementation of reform programs Microfinance Activities by the Non-Banking Sector (1) Regulation and Licensing of Microfinance Institute It is world-widely promoted to regulate and license organizations dealing with microfinance activities as Microfinance Institutions (MFIs), and the Lao PDR is not an exception. The Regulations on microfinance 40 have been introduced as of the end of 2008 covering (i) Deposit-Taking MFI (five organizations), (ii) Savings and Credit Unions (SCUs) (11 member-owned microfinance providers), and (iii) Non-Deposit Taking MFI (eight organizations). Deposit-taking MFIs and SCUs have received 2 million US dollars in about 13,000 savings accounts, and 7,000 outstanding loans with a total portfolio of around 2 million US dollars as of the end of According to the Regulation For Non-Deposit Taking Microfinance Institutions No. 02/BOL (dated 20 Jun 2008), any existing, new state, international organization, group or enterprise carrying out microfinance activities either solely or as part of its overall activities, including village banks, savings groups, village funds, development funds and others, are required to register under the Regulation. Approximately 1,000 village savings and credit groups (VSCG) and 4,000 village revolving funds (VRF) and all others undertaking MF activities are therefore obliged to register as non-deposit taking MFIs, although the majority of them have not yet done so. VSCG and VRF have served 85% of the 206,000 existing MF clients and provided 72% of total loan amounts disbursed in the rural and microfinance segment. Total outstanding loans amounted to 20 million US dollars for 100,000 borrowers (as of 2006). The Regulation also stipulates that non-deposit taking MFIs generating annual revenues of more than 1 billion kips shall be required to convert to a deposit-taking MFI or a SCU by applying for a license. The Lao PDR, with its headquarters in Vientiane Capital and later had two more branches in Savannakhet and Champasak. 38 Policy Statement for the Development Of Sustainable Rural and Micro Finance Sector by Rural and Micro Finance Committee (RMFC), Bank of the Lao PDR (Notice No. 1760/PMO Dec. 17, 2003). (accessed June 2010) 39 Action Plan of Rural Finance Sector Development Program (March 2007). (accessed June 2010) 40 Regulation For Non-Deposit Taking Microfinance Institutions No. 02/BOL (20 Jun 2008), Regulation For Savings and Credit Unions No. 03/BOL (03 Jun 2008), Regulation For Deposit-Taking MFIs, No. 04/BOL (20 Jun 2008) 42
61 Deposit License Lending limits Initial organization volume and deposits Minimum initial capital Reporting and inspection Table 4-2: Regulations for Licensed MFIs Deposit Taking MFI Allowed to take deposits from the general public Kip 10 million (USD 1,150) per client The scope to borrow externally as a basis for funding is limited to 30% of its capital Savings and Credit Unions (SCU) Allowed to take deposits only within their member group Lend only within their member group - Minimum of two hundred fifty (250) members and voluntary deposits of Kip 300 million - Kip 1 billion (USD 115,000) Kip 100 million - Strictly regulated and monitored through monthly off-site reports and six monthly on-site inspections by BOL s MF division Strictly regulated and monitored through monthly off-site reports and six monthly on-site inspections by BOL s MF division. Non-deposit taking MFI Allowed to accept and receive voluntary deposits but not exceeding Kip 200 million Kip 10 million (USD 1,150) per client - An income statement and a balance sheet should be submitted annually, using a prescribed Chart of Accounts (COA). (Source) Developed from data on (accessed June 2010). All licensed MF providers operate in an urban or semi-urban setting, with relatively easy access to markets, good infrastructure, high monetary income and population density. They face difficulty in meeting the needs of the remote poor, whereas the Savings Institute of the Lao Postal Service has succeeded in doing so with 120 post offices spread throughout the country and money transferring service with smaller commission cost. As of the end of 2007, it had some 12,000 savings accounts with accumulated savings totaling 2.8 million US dollars and 3,850 outstanding loans totaling 2.4 million US dollars 41. (2) Characteristics of Microfinance Activities Taking a look at how microfinance is used by region, number of borrowers in the Central Region, especially Vientiane Capital, is slightly higher than in the North, and much higher than in the South. People in the Central Region have better market access and access to microfinance services than in other regions. In Vientiane Capital and Khammuane there found more service providers and microfinance clients compared to the number of the poor household. Whereas the fact that service providers outreach in Houa Phanh in the Northern Region, for instance, is relatively small although the mountainous province bordering Vietnam has numerous numbers of poor households (See the Appendix 2). The reasons behind such facts are (i) it is not financially feasible for MFIs to open their branches and explore in remote, mountainous areas with low population density, and (ii) MFIs do not have sufficient skilled manpower, do not have a lot of training opportunities, and their skilled staff do not wish to stay in remote areas for long-term. As per the size of lending, it is also high in the Central Region, at about three times higher than 41 The Savings Institute of the Lao Postal Savings was established and licensed before the issuance of the MF regulations, is a deposit taking MFI that is allowed to lend amounts up to Kip 20 million (USD 2,300). In relation to savings and loan products, consists of civil servants, salaried employees of the government. Loans are provided as a percentage of a year s salary and with a salary guarantee as collateral. 43
62 in the Southern Region. There are numerous economically active provinces in the Central Region including Vientiane Capital, and they use microfinance more often with larger amount for their trade and commerce, and their livelihood improvement. It shows that depositors in the Central Region are more active, particularly females. This could be explained by the fact that mass organizations such as LWU are more active there, and female groups can easily find day-to-day credit needs 42. Throughout the country, the number of depositors surpasses that of borrowers, while the amount of deposit is much lower than that of loan. Non-Deposit Taking MFIs, VSCGs and VRFs do not actively collect deposits (or collect minimum amount of compulsory deposits), and they prioritize in meeting the credit needs. And the nature of group lending limits number of borrowers in order to ensure repayment by selecting specific members to receive credit among all members. (3) Purpose of borrowing microfinance As for how loans are used, nearly 70% of borrowers use the loans for agriculture, livestock and fisheries. In second place, nearly 20% of loans are used to support trade and small shops. Except in urban areas like Vientiane Capital, people tend to use microfinance for their main products, which suggests that microfinance is vital to generate main incomes and sustain their livelihoods. Microfinance by sector is shown in the Appendix % 18.2% 0.8% 0.1% 0.1% 1.4% 0.4% 0.4% 2.1% 69.7% Agriculture, Livestock, Fisheries: Trade, Small Shop: Handicraft, Weaving: Services: Food Processing: Health: Education: Accident: Social and Festival: Other: (Source) Committee for Planning and Investment, National Economic Research Institute (2006). Rural & Microfinance Statistics in the Lao PDR Figure 4-1: Microfinance by Sector Micro-insurance Insurance products are not generally offered, but insurance for the outstanding principal or costs for a funeral is available from two MFIs such as VCSGs 43. Needs varies from health, funerals, marriage, housing, and education. 42 The amount of deposit however does not show a big difference by gender. 43 The Foundation for Developoment Cooperation and The Banking With the Poor Network (2010). Microfinance Industry Report Lao People s Democratic Republic. 44
63 4.3 Informal Social Security System Informal Health Insurance Apart from the Community Based Health Insurance piloted by the Ministry of Health, many Lao villages have a mutual fund that can be used to obtain small loans for starting or expanding a home business. Most of these village funds are also used for major health care expenses. This is evidence of an informal, village-based, health insurance through mass organizations and village authorities, but little information is available about its workings and how it is used for health expenses Informal Finance Informal finance has provided services for savings and loans where banks, formal and semi-formal microfinance providers have failed. Some 33% of households have borrowed from friends, family or money lenders, with the latter at interest rates as high as 100% to 200% per annum 45. However, informal finance eventually offers low transaction costs in the form of convenient locations, low collateral requirements and simple loan procedures. VSCG emerged from such village level activities. The widely use of informal finance in the country is explained by the lack of familiarity with the formal banking system and the non-economic costs specific to cultural settings. Entering a bank or even a microfinance institution is still considered as something for the upper class, making the poor feel too awkward to use services that would otherwise be available to them. Instead, the certainty that a loan will be made is seen as highly important, as a refusal would be seen as a huge loss of face within the local culture. The poorer household are more likely to use loans for emergency, rather than productive, reasons. 44 Dr. Souraxay Phrommala Nioph, MOH, Lao PDR, COUNTRY REPORT The 4th ASEAN & Japan High Level Officials Meeting on Caring Societies: Support to vulnerable people in welfare and medical services Collaboration of social welfare and health services, and development of human resources August 2006, Tokyo, Japan 45 The Foundation for Development Cooperation and the Banking With the Poor Network (2010). Lao People s Democratic Republic Microfinance Industry Report 45
64
65 Chapter 5 Poverty Monitoring 5.1 MDGs Progress The most recent progress on MDGs in the Lao PDR was reported by the Millennium Development Goals (MDG) Progress Report for the Lao PDR (2008) (hereinafter referred to as the Progress Report ), which was jointly prepared by the Government of the Lao PDR and the agencies of the United Nations. In this section, progress of the Government in meeting the MDGs is presented, based on the Progress Report and the MDGs country table prepared by WB MDG 1: Eradicate Extreme Poverty and Hunger Since poverty eradication is at the center of the Government s development agenda in NGPES and NSEDP, the Government is strongly committed to it. As mentioned in Chapter 1, poverty declined by more than 30 percentage points during the period between 1992/93 and 2002/03. Although the country achieved significant progress in poverty reduction for the period, there are still substantial differences across provinces and regions. Also, as mentioned in Chapters 1 and 2, patterns of poverty vary among different ethnic groups. Economic growth during the period contributed to poverty reduction in the country. However, growth did not equally benefit all provinces and regions. In addition, food insecurity is still a critical issue for the country since policies on food security and nutrition have been a lower priority in the past. While it is projected that the MDG target of poverty reduction will be achieved, the target of reducing hunger which is measured by the prevalence of malnutrition under 5-years children is unlikely to be achieved. For improvement of nutritional status of the country, the Ministry of Health developed the National Nutrition Policy for 2020 under the cooperation with other key ministries, such as Ministry of Agriculture, Ministry of Education, Ministry of Planning and Investment and development partners, such as Food and Agriculture Organization of the United Nations (FAO), World Health Organization (WHO), United Nations Children s Fund (UNICEF) and WFP MDG 2: Achieve Universal Primary Education It is expected that the country will achieve the targeted primary enrollment rates of MDG 2 by 2015 since education is one of the better-performing sectors. In particular, indicators on primary education show a continuous path of progress towards universal education. In 2008, the net enrollment rate of the country reached 86%. However, there are still differences in primary enrollment rates between urban and rural areas, as well as among ethnic groups. The enrollment rates are higher among children in urban areas than in rural areas. In rural areas, non-lao Tai children have lower enrollment rates than Lao-Tai children. The differences can be attributed to disparities in household spending on education 46. In terms of other indicators, including literacy and primary completion rates, progress has been limited. These targets are therefore unlikely to be achieved by In order to promote access to basic education among the people in the country, the Ministry of Education, with technical assistance from Asian Development Bank (ADB) and the Australian Agency for International Development (AusAID), developed a 10-year Educational Sector 46 The MDG Progress Report 2008, p.32 47
66 Development Framework (ESDF) for MDG 3: Promote Gender Equality and Empower Women The achievement of MDG 3 by 2015 seems unlikely. The ratio of females to males enrolled in primary school improved to 90% in 2008 and is expected to be achieved by 2015, but the gender equality in higher education is unlikely to be achieved. There are also differences in gender equality in education across urban/rural areas and ethnic groups. In urban areas, there are limited gaps in the net primary enrollment rate between males and females for all ethnic groups. Females tend to have higher enrollment rates than males amongst the Lao-Tai and Tibeto-Burman families. In rural areas, Lao-Tai do not have much difference since both males and females have more than 80% enrollment rates in primary education. On the other hand, the female net primary enrollment rates of Mon-Khmer and Mhong-Mien are much less than the males enrollment rates, which are more than 60%. For Tibeto-Burman families, the female enrollment rate is only 32.7%, while the male rate is also low at 38.7%. In 2008, the proportion of seats held by women in the national parliament was only 25%. For further promotion of gender equality and empowerment of women, the National Commission for Advancement of Women (NCAW) prepare a national policy plan on the advancement of women besides the agenda for gender equality in the NSEDP MDG 4: Reduce Child Mortality Indicators on the reduction in child mortality significantly improved. The under-five mortality rate dramatically dropped from 101 per 1,000 in 2000 to 70 in The infant mortality rate also continuously decreased from 70 per 1,000 live births in 2000 to 56 in Therefore, it is expected that the target of 49 deaths per 1,000 live births will be achieved by The overall improvement can be attributed to the availability of vaccinations to children under five years of age. However, the immunization rate has remained at a low level of between 40-50%, far below the national target of 90%. In particular, there has been little success in delivering full immunization to children in remote communities, although the Government implemented an Expanded Programme on Immunization Multiple Year Plan. Thus, it can be assumed that there are regional disparities in the improvement of child health in the country. For the further improvement of child health, the Government established the National Commission for Mothers and Children and incorporated the 12 strategic programmes for eradicating poverty in the health sector under the NGPES into the NSEDP , such as child health promotion and immunization programs MDG 5: Improve Maternal Health The Government set the targets on the following indicators of MDG 5: adolescent fertility rate, births attended by skilled health staff, and maternal mortality rate (MMR). 48
67 The adolescent fertility rate 47 gradually decreased from 51 per 1,000 women aged in 2000 and to 37 in However, the rate in 2007 is far from the target by 2010 which is 17. The share of births attended by skilled health staff has not significantly improved. The rate increased from 17 in 2000 to 20 in 2006 which is far below the target of 50%. The reduction in maternal mortality has also posed to be a challenge. Although MMR dropped from 530 per 100,000 live births to 405 for the period between 2000 and 2005, it is very difficult to achieve the target of 260 by Also, large disparities remain between urban and rural areas since the decline in MMR occurs mainly in urban areas. In rural areas, the high rate of home deliveries without skilled care may contribute to the both higher MMR and rates of neonatal mortality 48. The major causes of maternal mortality are hemorrhage, obstructed labor, pregnancy-induced hypertension and sepsis. In addition, for poor women, there is a higher rate of risk depending on the availability and quality of health care, female education, geographic accessibility and poverty. In particular, poverty affects maternal health through food insecurity and malnutrition. The Government released the National Reproductive Health Policy in January 2005 to enhance efforts for improvement of maternal and child health MDG 6: Combat HIV/AIDS, Malaria and Other Diseases Since the prevalence of HIV/AIDS in the country has been limited, the target for combating HIV/AIDS have already been achieved before The MDG target on malaria prevention is also expected to be reached thanks to the continuous efforts by the Government with donor support. Although malaria has consistently been among the three major causes of morbidity and mortality in the country, as of 2007, village-based interventions with bed nets and early diagnosis and treatment had reached almost 8,000 villages nationwide. The prevalence of tuberculosis (TB) has been considerably reduced as well. The two MDG targets on tuberculosis were already achieved in Under DOTS (Directly Observed Treatment Short Course) 49, 72% of cases were detected by 2005 compared to the MDG target of 70%. Of these cases detected, the proportion of cases cured was 90%, which is higher than the MDG target of 85%. However, the prevalence level of the country still remains high at 306 persons per 100,000 in 2005, in spite of the fact that the TB National Programme reaches all provinces and districts. For combating HIV/AIDS, the National Committee for the Control AIDS (NCCA), which is a muti-sectoral body chaired by the Minister of Health, developed and launched the National Strategic and Action Plan (NSAP) on HIV/AIDS/STI In terms of Malaria, since the Lao National Malaria Control Programme started in 1980, the Government continuously addressed the malaria control through the National Policy for Malaria Control as well as the Malaria Strategic Plan. Also, the Government tackled TB by several national programmes, including the Ntational TB Policy and the TB National Programme. 47 The adolescent birth rate is measured as the total number of live births during one year by women aged to the number of women of that particular age group in the same year. The rate is expressed per 1, According to the Lao Reproductive Health Survey 2005, approximately 90% of rural women deliver at home while 50% of urban women do. 49 DOTS is a recommended prevention strategy for tuberculosis by WHO. 49
68 5.1.7 MDG 7: Ensure Environmental Sustainability As the Lao PDR is a signatory of the United Nations Framework Convention on Climate Change (UNFCCC), the Government has committed to a target on preserving the proportion of land area covered by forests. The country needs to carefully manage natural resources, including forests, and to manage agriculture production in a sustainable way. In order to meet its obligations under UNFCCC, the Government has been taking measures to reduce swidden agriculture. In terms of access to safe drinking water, the proportion of population with access to a safe source of water increased considerably from 28% to 74% for the period from 1990 to 2007, compared to the target of 80%. Although the target is expected to be achieved by 2015, there are considerable differences across provinces. More remote provinces and districts with poor roads tend to have lower coverage than provinces and districts with access to major national roads. Access to improved sanitation facilities varies more acutely between different regions and areas. There is a significant gap between urban and rural areas. More than 80% of the urban population has access to improved sanitation facilities as compared with less than 50% of the rural population. It seems unlikely that the Government will achieve the target of 60% by MDG 8: Develop a Global Partnership for Development The Government of Lao PDR has developed locally relevant indicators and targets that are both useful and possible to report on consistently over time. In terms of market access, there are four indicators, including average tariff imposed on exports to developed markets and border costs. Also, indicators related to ODA have been monitored. The targets related to information technologies, such as telephone lines, cellular subscribers, internet users, and access to radio and television, have improved gradually since 2000 because the Government is committed to investment in computer technology and in facilitating access to the Internet, particularly in remote and poor areas. These are likely to further improve as they are covered by the NSEDP
69 Goal 1: Eradicate extreme poverty and hunger Table 5-1: MDGs Progress in the Lao PDR MDGs Indicator Target 2015 (National) Progress (National) 1.1 Employment to population ratio, 15+, total (%) " 78.2" 78 no target on track 1.2 Employment to population ratio, ages 15-24, total (%) target under consideration on track 1.3 GDP per person employed (annual % growth) no target on track 1.4 Income share held by lowest 20% 8.6 8' target under consideration 1.5 Malnutrition prevalence, weight for age (% of children under 5) '.. 37' ** seriously off track 1.6 Poverty gap at $1.25 a day (PPP) (%) on track 1.7 Poverty headcount ratio at $1.25 a day (PPP) (% of population) on track 1.8 Poverty gap at national poverty line (%) 12 8' on track 1.9 Poverty headcount ratio below national poverty line (% of population) 48 33' on track 1.10 Prevalence of undernourishment (% of population) 31** ** seriously off track 1.11 Vulnerable employment, total (% of total employment) no target Goal 2: Achieve universal primary education 2.1 Literacy rate, youth female (% of females ages 15-24) * off track 2.2 Literacy rate, youth male (% of males ages 15-24) off track 2.3 Persistence to last grade of primary, total (% of cohort) * off track 2.4 Primary completion rate, total (% of relevant age group) off track 2.5 Total enrollment, primary (% net) " 86.3" on track, satisfactory Goal 3: Promote gender equality and empower women 3.1 Proportion of seats held by women in national parliaments (%) " 25.2" 25 no target off track 3.2 Ratio of female to male enrollments in tertiary education ' off track 3.3 Ratio of female to male primary enrollment ' on track 3.4 Ratio of female to male secondary enrollment ' off track 3.5 Share of women employed in the nonagricultural sector (% of total nonagricultural employment) Goal 4: Reduce child mortality 4.1 Immunization, measles (% of children ages months) 42 60' 4.2 Mortality rate, infant (per 1,000 live births) 77 82' 4.3 Mortality rate, under-5 (per 1,000) ' Goal 5: Improve maternal health 38** no target off track 41 69' 62 70' 79 98' off track on track on track 5.1 Adolescent fertility rate (births per 1,000 women ages 15-19) off track 5.2 Births attended by skilled health staff (% of total) 17' 23' on track 5.3 Contraceptive prevalence (% of women ages 15-49) no target 5.4 Maternal mortality ratio (modeled estimate, per 100,000 live births) 5.5 Pregnant women receiving prenatal care (%) 29 21' 5.6 Unmet need for contraception (% of married women ages 15-49) Goal 6: Combat HIV/AIDS, malaria, and other diseases 6.1 Children with fever receiving antimalarial drugs (% of children under age 5 with fever) 6.2 Condom use, population ages 15-24, female (% of females ages 15-24) 6.3 Condom use, population ages 15-24, male (% of males ages 15-24) 530' ' off track 28.5' 39.3*.... no target potentially no target on track 9 8.2* no target lack of data no target lack of data no target lack of data 6.4 Preverance and death rates associated with tuberculosis on track 51
70 MDGs Indicator Target 2015 (National) Progress (National) 6.5 Prevalence of HIV, female (% ages 15-24) <5 on track 6.6 Prevalence of HIV, male (% ages 15-24) <5 on track 6.7 Prevalence of HIV, total (% of population ages 15-49) <1 on track 6.8 Tuberculosis cases detected under DOTS (%) 40 42' on track 6.9 Death rated associated with malaria (per 100,000 population) on track 6.10 Proportion of children under 5 sleeping under bed nets achieved 6.11 Proportion of tuberculosis cases cured under DOTS achieved Goal 7: Ensure environmental sustainability 7.1 CO2 emissions (kg per PPP $ of GDP) 0.13" ".. no target 7.2 CO2 emissions (metric tons per capita) ' 0.24".... no target 7.3 Forest area (% of land area) 42' under consideration 7.4 Improved sanitation facilities (% of rural population with access) 7.5 Improved sanitation facilities (% of urban population with access) off track 14" off track 57" * on track 7.6 Improved water source (% of rural population with access) 39" off track 7.7 Improved water source (% of urban population with access) 76" * 7.8 Marine protected areas, (% of surface area) not relevant 7.9 Nationally protected areas (% of total land area) no target Goal 8: Develop a global partnership for development 8.1 Aid per capita (current USD) ' 8.2 Debt service (PPG and IMF only, % of exports, excluding workers' remittances) no target no target 8.3 Internet users (per 100 people) no target 8.4 Mobile cellular subscriptions (per 100 people) ' 8.5 Telephone lines (per 100 people) 1 0.7' 2 1.5' no target no target on track (Source) World Bank, Country Table ( as of June 2010) and World Development Indicators data base ( as of June 2010) (Note) ' Data source: the Government of the Lao PDR and the United Nations, Millennium Development Goals: Progress Report Lao PDR 2008 (2008) " Data source: United Nations Statistic Division, MDG Info 2009 ( as of June 2010) * Data source: Department of Statistics and UNICEF, Lao PDR Multiple Indicator Cluster Survey 2006 (2008) ** Data source: the Government of the Lao PDR and the United Nations, Millennium Development Goals: Progress Report Lao PDR 2004 (2004) 52
71 5.2 Poverty Monitoring System MDG Monitoring Progress on the MDGs is jointly monitored by the National Technical Working Group and the UN Theme Groups under the guidance of the National Supervisory Committee on MDGs. The MDG Progress Report 2008 is based on the existing database, including LECS 3, the Population Census 2005, the Multiple Indicator Cluster Survey (2006), the Lao Reproductive Health Survey (2005) and Economic Census In 2007, the technical working group revised the MDG monitoring framework to include new targets and corresponding indicators. The Government of Lao PDR, along with international partners, reviewed the new targets and indicators and decided which were relevant to Laos. The Population and Housing Census have been conducted every ten years: 1985, 1995 and The past three censuses are comparable because of consistency in the general design and content, including the questionnaire. The implementation of the census is a collaborative effort of government offices with the Department of Statistics (DOS) as the coordinating unit. The Swedish International Development Agency (SIDA) provided financial and technical assistance to the Census process through the Department of Statistics. LECS is a large sample survey undertaken every 5 years: 1992/93, 1997/98, 2002/03 and 2007/08. With the exception of LECS 1, the number of sample villages normally ranges between 450 and 540, while the number of sample households is between 8,000 and 8,900. LECS provides key data on the living situation of households, and serves as the main source for poverty assessment at the national and sub-national level, including by province. However, the World Bank report on poverty trends 50 has pointed out that LECS is representative at province level not representative at the district level. Therefore, it is not possible to analyze poverty status at the district level without using an estimation technique for smaller areas. Since DOS does not have enough capacity in the areas of finance and human resources, it will be difficult to conduct data collection, processing and analysis activities without donor support Poverty Monitoring In order to support implementation and operationalization of NSEDP, Sector Working Groups were established in health, gender and HIV/AIDS; education and gender; infrastructure; macroeconomic issues and private sector development; agriculture; rural development and natural resources management; governance; drug prevention; and mine action. For monitoring progress on the NSEDP, including poverty reduction, there are two systems under different government authorities. One monitoring system is based on the Village Statistic Book (VSB) which is managed by the DOS under the Ministry of Planning and Investment (MPI). The VSB contains 250 indicators which are collected at the village level. The data related to the 250 indicators is collected annually by villages and submitted to the MPI through the Kumban (village cluster), District Planning Office and Provincial Planning Department. The 250 indicators are reviewed every 5 years. The VSB-based monitoring system has been supported by UNDP. 50 Committee for National Planning and Investment, National Statistics Center and World Bank, Lao PDR Poverty Trends 1992/ /03 (2006) 53
72 Another poverty monitoring system is controlled by the National Leading Committee for Rural Development and Poverty Reduction (NLC-RDPR), which is under the Prime Minister s Office. NLC-RDPR also collects data based on a poverty monitoring form. Most items of data collected by the NLC-RDPR are duplicates of the VSB. On the other hand, some key data indicators, such as for the poverty monitoring form, including poor household, are defined differently from the VSB. Besides the two monitoring system, other ministries, including education, health and agriculture, and the Party also collect similar data from villages or Kumban. It means that villages and Kumban are required to collect almost 1,000 data. Such data collection activities impose a heavy burden on village and Kumban administrations, and their capacity is also limited. On the other hand, the lack of feedback on results of surveys to villages and Kumban limits the effective use of monitoring results in villages and Kumban Lao Info Lao Info is a common indicator database system which provides a statistical tool for monitoring MDGs and is a key data source for NGPES and NSEDP as well as other national development frameworks. It includes data from the national census, surveys, and government reporting systems and provides easy access to indicators organized by sector, goal, theme, source, institution or convention. With the assistance of UNDP, UNICEF and UNFPA, the database system was developed to promote and encourage a dialogue among development partners. By using the database system, users can process tables, graphs as well as maps for planning, monitoring, and evaluation at the national and sub-national level. The first system was released as Lao Info Version 4.1 in An updated version of Lao Info version 5.1 is currently available by CD-ROM Although the UN agencies such as UNDP, UNICEF and UNFPA, appeal the advantages of this database, such as a user-friendly system, it is not utilized by the government authorities and donors. In fact, it is not so user-friendly for users who are not familiar with this database system. Also the limited variety of statistical data as well as timing of update are issues for dissemination of the database among the stakeholders. 54
73 Appendices
74 (1) Poverty Indicator Term Appendix 1: Poverty and Inequality Indicator Explanation Poverty Line Relative poverty lines These are defined in relation to the overall distribution of income or consumption in a country. The relative poverty indicates the people who are relatively poor compared to the majority of the population. The relative poverty lines, for example, could be set at 50% of the country s mean income or consumption. Then, the people, who have income or consumption below the relative poverty line, can be classified as the relative poor. Absolute poverty lines These are anchored in some absolute standard of what households should be absolute to count on in order to meet their basic needs. For monetary measures, the absolute poverty lines are often based on estimates of the cost of basic food needs, that is the cost of a nutritional basket considered minimal for the health of a typical family, to which a provision is added for nonfood needs. The minimal requirement of calorie intake is adjusted by age, gender, weight and temperature. P0: Poverty Headcount Index/ Poverty Incidence P1: Poverty Gap Index/ Poverty Depth Proportion of the population living below the poverty line. The most widely used measure to show the size of poverty. It is simple to construct and easy to understand but it does not take and the living standard of the poor population and the intensity of poverty into account. q HCI N q: Number of Poor N: Total Population The average income or consumption shortfall compared to the poverty line across the whole population. It is obtained by adding up all the shortfalls of the poor (assuming that the non-poor have a shortfall of zero) and dividing by the total population. In the case that the poverty line is constant, the increase in the shortfall of the poor leads the higher poverty gap index. The index can be considered as the minimum cost of eliminating poverty because it shows how much would have to be transferred to the poor to bring their income or expenditure to the poverty line. 1 PGI N q i 1 z yi ( ) z N: Total Population z: Poverty Line y: Individual Income or Consumption P2: Squared Poverty Gap Index/ Poverty Severity) A weighted sum of poverty gaps (as a proportion of the poverty line), where the weights are the proportionate poverty gaps themselves. The index shows poverty severity which is inequality among the poor because a higher weight is placed on those households further away from the poverty line. In the case that the poverty line is constant, more unequal income or consumption distribution among the poor leads the higher poverty severity. N: Total Population z: Poverty Line y: Individual Income or Consumption 1 q z yi 2 SPI ( ) N z i 1 A1-1
75 (2) Inequality Indicator Term Gini coefficient and Lorenz Curve Explanation Gini Coefficient shows the disparity of income or consumption distribution from the completely equal distribution in a economy. It is based on the Lorenz curve, a cumulative frequency curve the compares the distribution a specific variable (for example, income) with the uniform distribution that represents equality. Gini Coefficient varies between 0, which reflects complete equality, and 1, which indicates complete inequality (one person or one household has all the income or consumption; all others have none) Theil index The index is obtained by the proportion of the individual income to the mean income per person and the proportion of the individual income to the total income. The index varies between 0, which represents an equal distribution among the total population, and 1, which represents complete unequally distribution among the total population. Z 1 1 n n i 1 yi log y yi y n: Total Population yi: Individual Income y : The Mean Income per capita The Theil Index has the advantage of being additive across different subgroups or regions in the country, then enables to understand attribution of each subgroup to the total inequality in the country. I (Total Inequality)=Iw (Inequality within subgroup) +Ib (Inequality among the subgroups) (Reference) World Bank, Poverty Reduction Strategy Paper (PRSP) Sourcebook, (2004) World Bank, Handbook on Poverty + Inequality, (2009) A1-2
76 Appendix 2: Poverty Lines in 1997/98 Area Urban Rural Whole Food Poverty Line (per capita per month) Lao PDR 19,270 14,407 15,218 Vientiane Capital 20,504 17,589 19,422 North 18,016 13,783 14,197 Central 19,042 14,677 15,214 South 17,316 14,170 15,214 Absolute Poverty Line (per capita per month) Lao PDR 23,902 18,239 19,184 Vientiane Capital 24,802 21,768 23,676 North 23,749 18,070 18,626 Central 23,637 18,264 18,925 South 21,493 17,644 19,184 (Source) Kakwani, N., et al., Poverty in Lao PDR (2001), p.26, Annex Table 4 and p.28, Annex Table 5. (Note) The annual average exchange rate was 1 USD = 3, in A2-1

77 Appendix 3: List of 72 poor districts A3-1
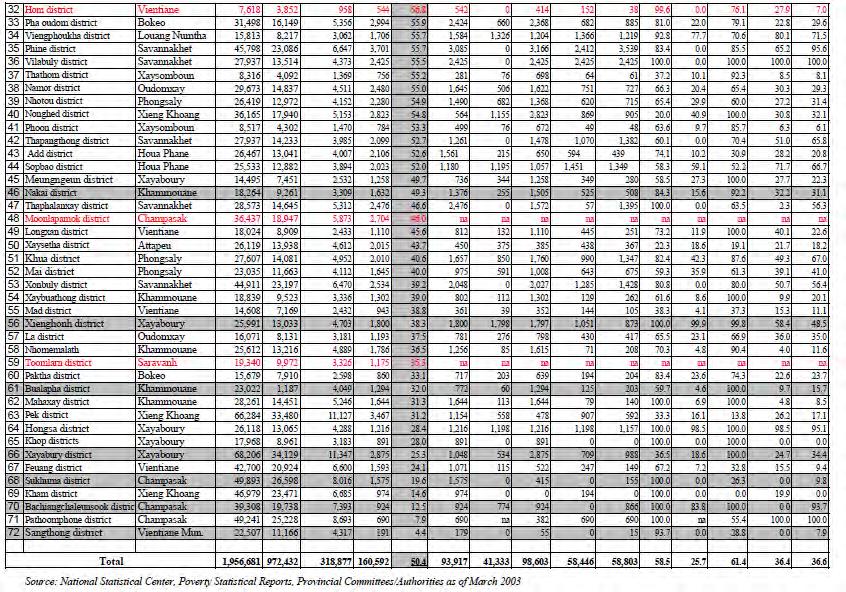
78 A3-2
SOCIAL SYSTEMS BASELINE ASSESSMENT
 Regional Workshop on SEA Baseline Assessment SOCIAL SYSTEMS BASELINE ASSESSMENT 27-28 January, 2010 in Phnom Penh, Cambodia SOCIAL SYSTEMS Key Issues 1. Poverty, Ethnic Groups & Livelihoods 2. Health &
Poverty Profile in Lao PDR
 Public Disclosure Authorized Public Disclosure Authorized Public Disclosure Authorized Public Disclosure Authorized 100120 Poverty Profile in Lao PDR Poverty Report for the Lao Consumption and Expenditure
Laos: Ethno-linguistic Diversity and Disadvantage
 Laos: Ethno-linguistic Diversity and Disadvantage Elizabeth M. King Dominique van de Walle World Bank December 2010 1 The Lao People s Democratic Laos is one of the poorest countries in Southeast Asia
Greater Mekong Subregion: Northern Economic Corridor Project Lao PDR. Summary Social Action Plan
 Greater Mekong Subregion: Northern Economic Corridor Project Lao PDR A. Introduction Summary Social Action Plan 1. The Northern Economic Corridor (the Project) passes through about 90 villages, all except
Statistical Yearbook. for Asia and the Pacific
 Statistical Yearbook for Asia and the Pacific 2015 Statistical Yearbook for Asia and the Pacific 2015 Sustainable Development Goal 1 End poverty in all its forms everywhere 1.1 Poverty trends...1 1.2 Data
LAO Ethnic Minority Development Framework for Forest Plantation Development Project This is not a Board Approved Document
 LAO 31344 Ethnic Minority Development Framework for Forest Plantation Development Project This is not a Board Approved Document August 2005 I. Introduction 1. In Lao PDR all people are considered equal,
vi. rising InequalIty with high growth and falling Poverty
 43 vi. rising InequalIty with high growth and falling Poverty Inequality is on the rise in several countries in East Asia, most notably in China. The good news is that poverty declined rapidly at the same
HOUSEHOLD LEVEL WELFARE IMPACTS
 CHAPTER 4 HOUSEHOLD LEVEL WELFARE IMPACTS The household level analysis of Cambodia uses the national household dataset, the Cambodia Socio Economic Survey (CSES) 1 of 2004. The CSES 2004 survey covers
Poverty in the Third World
 11. World Poverty Poverty in the Third World Human Poverty Index Poverty and Economic Growth Free Market and the Growth Foreign Aid Millennium Development Goals Poverty in the Third World Subsistence definitions
Republic of Kosovo Study for Poverty Profile in European Region. Final Report
 Republic of Study for Poverty Profile in European Region Final Report October 2010 JAPAN INTERNATIONAL COOPERATION AGENCY OPMAC Corporation Poverty Indicator Basic data Region (*) Country Year Population,
Contents. List of Figures List of Maps List of Tables List of Contributors. 1. Introduction 1 Gillette H. Hall and Harry Anthony Patrinos
 Contents List of Figures List of Maps List of Tables List of Contributors page vii ix x xv 1. Introduction 1 Gillette H. Hall and Harry Anthony Patrinos 2. Indigenous Peoples and Development Goals: A Global
Poverty Assessment of Ethnic Minorities in Vietnam
 MPRA Munich Personal RePEc Archive Poverty Assessment of Ethnic Minorities in Vietnam Chau Le and Cuong Nguyen and Thu Phung and Tung Phung 20 May 2014 Online at https://mpra.ub.uni-muenchen.de/70090/
Poverty in Lao PDR. N. KAKWANI, BOUNTHAVY SISOUPHANHTHONG, PHONESALY SOUKSAVATH, and BRENT DARK. Asia and Pacific Forum on Poverty
 The views expressed in this paper are those of the authors and do not necessarily reflect the views or policies of the Asian Development Bank. The Asian Development Bank does not guarantee the accuracy
Number of Countries with Data
 By Hafiz A. Pasha WHAT IS THE EXTENT OF SOUTH ASIA S PROGRESS ON THE MDGs? WHAT FACTORS HAVE DETERMINED THE RATE OF PROGRESS? WHAT HAS BEEN THE EXTENT OF INCLUSIVE GROWTH IN SOUTH ASIA? WHAT SHOULD BE
Poverty Profile. Executive Summary. Kingdom of Thailand
 Poverty Profile Executive Summary Kingdom of Thailand February 2001 Japan Bank for International Cooperation Chapter 1 Poverty in Thailand 1-1 Poverty Line The definition of poverty and methods for calculating
Poverty profile and social protection strategy for the mountainous regions of Western Nepal
 October 2014 Karnali Employment Programme Technical Assistance Poverty profile and social protection strategy for the mountainous regions of Western Nepal Policy Note Introduction This policy note presents
The Trends of Income Inequality and Poverty and a Profile of
 http://www.info.tdri.or.th/library/quarterly/text/d90_3.htm Page 1 of 6 Published in TDRI Quarterly Review Vol. 5 No. 4 December 1990, pp. 14-19 Editor: Nancy Conklin The Trends of Income Inequality and
Trade, Growth and Poverty in the context of Lao PDR
 Trade, Growth and Poverty in the context of Lao PDR Dr. Yan Wang Senior Economist The World Bank Ywang2@worldbank.Org Prepared for the joint workshop on Lao PDR: Trade and The Integrated Framework Vientiane
ARMENIA COMPREHENSIVE FOOD SECURITY, VULNERABILITY ANALYSIS (CFSVA) UPDATE 2017
 UPDATE 2017") ARMENIA COMPREHENSIVE FOOD SECURITY, VULNERABILITY ANALYSIS (CFSVA) UPDATE 2017 SOCIO-ECONOMIC TRENDS The Armenia Comprehensive Food Security, Vulnerability Analysis (CFSVA) Update presents the current
ARMENIA COMPREHENSIVE FOOD SECURITY, VULNERABILITY ANALYSIS (CFSVA) UPDATE 2017 SOCIO-ECONOMIC TRENDS The Armenia Comprehensive Food Security, Vulnerability Analysis (CFSVA) Update presents the current
INCLUSIVE GROWTH AND POLICIES: THE ASIAN EXPERIENCE. Thangavel Palanivel Chief Economist for Asia-Pacific UNDP, New York
 INCLUSIVE GROWTH AND POLICIES: THE ASIAN EXPERIENCE Thangavel Palanivel Chief Economist for Asia-Pacific UNDP, New York Growth is Inclusive When It takes place in sectors in which the poor work (e.g.,
COUNTRY REPORT OF THE ASEAN ASSESSMENT ON THE SOCIAL IMPACT OF THE GLOBAL FINANCIAL CRISIS: LAO PDR
 COUNTRY REPORT OF THE ASEAN ASSESSMENT ON THE SOCIAL IMPACT OF THE GLOBAL FINANCIAL CRISIS: LAO PDR with the support of: This volume is a product resulting from a project jointly implemented by the staff
Climate Change Vulnerability Mapping for the Greater Mekong Sub-region
 CMU J. Nat. Sci. (2017) Vol. 16(3) 165 Climate Change Vulnerability Mapping for the Greater Mekong Sub-region Kittiwet Kuntiyawichai 1*, Vichian Plermkamon 1, Ramasamy Jayakumar 2 and Quan Van Dau 1 1
THAILAND SYSTEMATIC COUNTRY DIAGNOSTIC Public Engagement
 THAILAND SYSTEMATIC COUNTRY DIAGNOSTIC Public Engagement March 2016 Contents 1. Objectives of the Engagement 2. Systematic Country Diagnostic (SCD) 3. Country Context 4. Growth Story 5. Poverty Story 6.
Role of Cooperatives in Poverty Reduction. Shankar Sharma National Cooperatives Workshop January 5, 2017
 Role of Cooperatives in Poverty Reduction Shankar Sharma National Cooperatives Workshop January 5, 2017 Definition Nepal uses an absolute poverty line, based on the food expenditure needed to fulfil a
Tourism, Poverty and Taxation: A Case of Thailand
 Tourism, Poverty and Taxation: A Case of Thailand Conference on Integrated Development of Sustainable Tourism for the GMS 2007: A Comparison of GMS Logistics System Phousi Hotel, Luang Prabang, Lao PDR
Human Development Indices and Indicators: Viet Nam s 2018 Statistical updates
 1 Human Development Indices and Indicators: s 2018 Statistical updates Introduction Human Development Indices and Indicators: 2018 Statistical update, released by UNDP Human Development Report Office on
Poverty and Inequality
 Chapter 4 Poverty and Inequality Problems and Policies: Domestic After completing this chapter, you will be able to 1. Measure poverty across countries using different approaches and explain how poverty
EUROPEAN COMMISSION DIRECTORATE-GENERAL FOR HUMANITARIAN AID - ECHO. Humanitarian Aid Decision
 EUROPEAN COMMISSION DIRECTORATE-GENERAL FOR HUMANITARIAN AID - ECHO Humanitarian Aid Decision 23 02 01 Title: Humanitarian aid in favour of vulnerable marginalised groups in Laos. Location of operation:
Fertility decline in a village in Laos
 Fertility decline in a village in Laos Shinichi Takahashi Kobe University, Kobe, Japan Tel & Fax: +81-78-803-6847 E-mail: takahashi@econ.kobe-u.ac.jp 1. Introduction Laos is one of the countries keeping
evsjv `k cwimsl vb ey iv BANGLADESH BUREAU OF STATISTICS Statistics Division, Ministry of Planning
 PRELIMINARY REPORT ON HOUSEHOLD INCOME & EXPENDITURE SURVEY-2010 June, 2011 evsjv `k cwimsl vb ey iv BANGLADESH BUREAU OF STATISTICS Statistics Division, Ministry of Planning Household Income and Expenditure
Goal 1: Eradicate Extreme Poverty and Hunger
 59 In 15 economies of the Asia and Pacific region, including some of the most populous, more than 10% of the population live on less than $1 a day. In 20 economies, again including some of the most populous,
Or7. The Millennium Development Goals Report
 Or7 The Millennium Development Goals Report 2009 1 Goal 1 Eradicate extreme poverty and hunger Target 1.A Halve, between 1990 and 2015, the proportion of people whose income is less than one dollar a day
Indonesia: Enhanced Water Security Investment Project
 Initial Poverty and Social Analysis March 2018 Indonesia: Enhanced Water Security Investment Project This document is being disclosed to the public in accordance with ADB s Public Communications Policy
Asia and the Pacific s Perspectives on the Post-2015 Development Agenda
 Ver: 2 Asia and the Pacific s Perspectives on the Post-2015 Development Agenda Dr. Noeleen Heyzer Executive Secretary United Nations Economic and Social Commission for Asia and the Pacific (ESCAP) Bangkok
CAMBODIA SYSTEMATIC COUNTRY DIAGNOSTIC Public Engagement
 CAMBODIA SYSTEMATIC COUNTRY DIAGNOSTIC Public Engagement Nov Dec 2016 Contents Objectives of the Engagement Country Context Main research questions I. What are the challenges to sustaining economic growth?
CEMA. Poverty of Ethnic Minorities in Viet Nam: Situation and Challenges in Programme 135 Phase II Communes,
 CEMA Poverty of Ethnic Minorities in Viet Nam: Situation and Challenges in Programme 135 Phase II Communes, 2006-07 Hanoi, 12-2011 Table of Contents Executive Summary... 5 Introduction... 9 Chapter 1.
Center for Excellence in Disaster Management & Humanitarian Assistance
 2 Center for Excellence in Disaster Management & Humanitarian Assistance Table of Contents Welcome - Note from the Director 7 About the Center for Excellence in Disaster Management & Humanitarian Assistance
Ghana Lower-middle income Sub-Saharan Africa (developing only) Source: World Development Indicators (WDI) database.
 Source: World Development Indicators (WDI) database.") Knowledge for Development Ghana in Brief October 215 Poverty and Equity Global Practice Overview Poverty Reduction in Ghana Progress and Challenges A tale of success Ghana has posted a strong growth performance
Knowledge for Development Ghana in Brief October 215 Poverty and Equity Global Practice Overview Poverty Reduction in Ghana Progress and Challenges A tale of success Ghana has posted a strong growth performance
Poverty Profile. Executive Summary. Malaysia
 Poverty Profile Executive Summary Malaysia February 2001 Japan Bank for International Cooperation Chapter 1 Poverty in Malaysia 1-1 Poverty Line Malaysia s poverty line, called Poverty Line Income (PLI),
: Sustainable Development (SD) : Measures to eradicate extreme poverty in developing nations : Lara Gieringer :
 : Measures to eradicate extreme poverty in developing nations : Lara Gieringer :") Committee Topic Chair E-mail : Sustainable Development (SD) : Measures to eradicate extreme poverty in developing nations : Lara Gieringer : lara.gieringer@std.itugvo.k12.tr Introduction about the committee:
Committee Topic Chair E-mail : Sustainable Development (SD) : Measures to eradicate extreme poverty in developing nations : Lara Gieringer : lara.gieringer@std.itugvo.k12.tr Introduction about the committee:
LAO PEOPLE S DEMOCRATIC REPUBLIC Report on Implementation of the Brussels Programme of Action for the Least Developed Countries ( )
") LAO PEOPLE S DEMOCRATIC REPUBLIC Report on Implementation of the Brussels Programme of Action for the Least Developed Countries (2001-2010) Introduction In order to implement the Brussels Programme of
LAO PEOPLE S DEMOCRATIC REPUBLIC Report on Implementation of the Brussels Programme of Action for the Least Developed Countries (2001-2010) Introduction In order to implement the Brussels Programme of
Halve, between 1990 and 2015, the proportion of people whose income is less than $1 a day
 6 GOAL 1 THE POVERTY GOAL Goal 1 Target 1 Indicators Target 2 Indicators Eradicate extreme poverty and hunger Halve, between 1990 and 2015, the proportion of people whose income is less than $1 a day Proportion
Urbanization processes
 Urbanization processes in the Lao PDR Processes, challenges and opportunities Final report, 19.11.2018 Prepared by the Centre for Development and Environment University of Bern, Switzerland Commissioned
The Cambodia, Lao PDR, and Vietnam (CLV) Development Triangle Opportunities, Challenges and Options for Future
 Development Triangle Opportunities, Challenges and Options for Future") Policy Brief Hanoi Resource Centre 3/2007 The Cambodia, Lao PDR, and Vietnam (CLV) Development Triangle Opportunities, Challenges and Options for Future Bhoj Raj Khanal* and Wilairat Tongsiri** Background
Policy Brief Hanoi Resource Centre 3/2007 The Cambodia, Lao PDR, and Vietnam (CLV) Development Triangle Opportunities, Challenges and Options for Future Bhoj Raj Khanal* and Wilairat Tongsiri** Background
Household Income inequality in Ghana: a decomposition analysis
 Household Income inequality in Ghana: a decomposition analysis Jacob Novignon 1 Department of Economics, University of Ibadan, Ibadan-Nigeria Email: nonjake@gmail.com Mobile: +233242586462 and Genevieve
Towards a Well-Coordinated National Statistical System in Support of Sustainable Development Goals (SDGs) National Institute of Statistics of Cambodia
 National Institute of Statistics of Cambodia") Towards a Well-Coordinated National Statistical System in Support of Sustainable Development Goals (SDGs) National Institute of Statistics of Cambodia Mission of NIS The mission of the National Institute
Towards a Well-Coordinated National Statistical System in Support of Sustainable Development Goals (SDGs) National Institute of Statistics of Cambodia Mission of NIS The mission of the National Institute
Quantitative Analysis of Rural Poverty in Nigeria
 NIGERIA STRATEGY SUPPORT PROGRAM Brief No. 17 Quantitative Analysis of Rural Poverty in Nigeria Bolarin Omonona In spite of Nigeria s abundant natural and human resource endowment, poverty remains pervasive,
POVERTY AND INEQUALITY IN SOUTH WEST BENGAL: AN OVERVIEW
 Jharkhand Journal of Social Development, Vol. V, No.1 & 2, 2013 ISSN 0974 651x POVERTY AND INEQUALITY IN SOUTH WEST BENGAL: AN OVERVIEW Rajarshi Majumder Associate Professor, Department of Economics, University
The Challenge of Inclusive Growth: Making Growth Work for the Poor
 2015/FDM2/004 Session: 1 The Challenge of Inclusive Growth: Making Growth Work for the Poor Purpose: Information Submitted by: World Bank Group Finance and Central Bank Deputies Meeting Cebu, Philippines
1. Economic Situations and Trends
 1. Economic Situations and Trends 1.1 Economic Growth Over the three decades before 1997, the average annual economic growth was higher than 7% and the gross domestic product (GDP) per capita increased
Under-five chronic malnutrition rate is critical (43%) and acute malnutrition rate is high (9%) with some areas above the critical thresholds.
 and acute malnutrition rate is high (9%) with some areas above the critical thresholds.") May 2014 Fighting Hunger Worldwide Democratic Republic of Congo: is economic recovery benefiting the vulnerable? Special Focus DRC DRC Economic growth has been moderately high in DRC over the last decade,
May 2014 Fighting Hunger Worldwide Democratic Republic of Congo: is economic recovery benefiting the vulnerable? Special Focus DRC DRC Economic growth has been moderately high in DRC over the last decade,
Poverty, Livelihoods, and Access to Basic Services in Ghana
 Poverty, Livelihoods, and Access to Basic Services in Ghana Joint presentation on Shared Growth in Ghana (Part II) by Zeljko Bogetic and Quentin Wodon Presentation based on a paper by Harold Coulombe and
TRADE FACILITATION AND MICROFINANCE FOR POVERTY REDUCTION IN THE GMS: THE CASE STUDY OF THAILAND
 TRADE FACILITATION AND MICROFINANCE FOR POVERTY REDUCTION IN THE GMS: THE CASE STUDY OF THAILAND Asia Pacific Trade Facilitation Forum 2013 Beijing, China September 12, 2013 Assist.Prof. Kornkarun Cheewatrakoolpong
OIC/COMCEC-FC/32-16/D(5) POVERTY CCO BRIEF ON POVERTY ALLEVIATION
 POVERTY CCO BRIEF ON POVERTY ALLEVIATION") OIC/COMCEC-FC/32-16/D(5) POVERTY CCO BRIEF ON POVERTY ALLEVIATION COMCEC COORDINATION OFFICE October 2017 1990 1991 1992 1993 1994 1995 1996 1997 1998 1999 2000 2001 2002 2003 2004 2005 2006 2007 2008
OIC/COMCEC-FC/32-16/D(5) POVERTY CCO BRIEF ON POVERTY ALLEVIATION COMCEC COORDINATION OFFICE October 2017 1990 1991 1992 1993 1994 1995 1996 1997 1998 1999 2000 2001 2002 2003 2004 2005 2006 2007 2008
Inequality of Outcomes
 USD Inequality of Outcomes 1. Introduction Economic inequality generally refers to the disproportionate distribution of income, assets or wealth among households in a society. However, the overall welfare
Assessing Poverty Outreach of Microfinance Institutions in Cambodia - A Case Study of AMK
 Research article erd Assessing Poverty Outreach of Microfinance Institutions in Cambodia - A Case Study of AMK THUN VATHANA Angkor Mikroheranhvatho Kampuchea (AMK) Co. Ltd., Phnom Penh, Cambodia Email:
Acute Food Insecurity Situation Overview
 TAJIKISTAN Acute Food Insecurity Situation Overview Created on 31/05/2016 Aggregate Numbers Key Findings and Issues Overall, an estimated 12% of the population (about 715,000 people) in rural areas are
1400 hrs 14 June The Millennium Development Goals (MDGs): The Role of Governments and Public Service Notes for Discussion
: The Role of Governments and Public Service Notes for Discussion") 1400 hrs 14 June 2010 Slide I The Millennium Development Goals (MDGs): The Role of Governments and Public Service Notes for Discussion I The Purpose of this Presentation is to review progress in the Achievement
1400 hrs 14 June 2010 Slide I The Millennium Development Goals (MDGs): The Role of Governments and Public Service Notes for Discussion I The Purpose of this Presentation is to review progress in the Achievement
United Nations Development Assistance Framework
 United Nations SRI LANKA United Nations Development Assistance Framework UN Photo / Evan Schneider UN / Neomi UN Photo / Martine Perret UNICEF UNITED NATIONS IN SRI LANKA Working together for greater impact
Poverty of the Ethnic Minorities in Vietnam: Situation and Challenges from the Poorest Communes
 MPRA Munich Personal RePEc Archive Poverty of the Ethnic Minorities in Vietnam: Situation and Challenges from the Poorest Communes Hung Pham Thai and Trung Le Dang and Cuong Nguyen Viet 20. December 2010
MDG s in Asia and the Pacific
 Workshop on MDG Monitoring: 2015 and beyond MDG s in Asia and the Pacific 9-13 July, 2012 Bangkok, Thailand 1 Introduction Introduction Progress assessment UN MDG Indicators database Asia-Pacific Regional
GROWTH OF SCHEDULED CASTE POPULATION
 CHAPTER NO. 4 GROWTH OF SCHEDULED CASTE POPULATION 4.1 INTRODUCTION 4.2 TREND IN GROWTH OF SCHEDULED CASTE POPULATION 4.2.1 TAHSIL WISE GROWTH RATE OF SCHEDULED CASTE POPULATION 4.2.2 TAHSIL WISE MALE
How Have the World s Poorest Fared since the Early 1980s?
 Public Disclosure Authorized How Have the World s Poorest Fared since the Early 1980s? Public Disclosure Authorized Public Disclosure Authorized Public Disclosure Authorized Shaohua Chen Martin Ravallion
Economic and Social Council
 United Nations Economic and Social Council Distr.: Limited 12 July 2006 Original: English For action United Nations Children s Fund Executive Board Second regular session 2006 6-8 September 2006 Item 4
Case Study on Youth Issues: Philippines
 Case Study on Youth Issues: Philippines Introduction The Philippines has one of the largest populations of the ASEAN member states, with 105 million inhabitants, surpassed only by Indonesia. It also has
Pro-Poor Growth, Poverty and Inequality in Rural Vietnam
 Pro-Poor Growth, Poverty and Inequality in Rural Vietnam RDMA REGIONAL EVALUATION SUMMIT, SESSION 2 SEPTEMBER 2013 This document was produced for review by the United States Agency for International Development.
EXECUTIVE SUMMARY. Shuji Uchikawa
 EXECUTIVE SUMMARY Shuji Uchikawa ASEAN member countries agreed to establish the ASEAN Economic Community by 2015 and transform ASEAN into a region with free movement of goods, services, investment, skilled
POLICY OPTIONS AND CHALLENGES FOR DEVELOPING ASIA PERSPECTIVES FROM THE IMF AND ASIA APRIL 19-20, 2007 TOKYO
 POLICY OPTIONS AND CHALLENGES FOR DEVELOPING ASIA PERSPECTIVES FROM THE IMF AND ASIA APRIL 19-20, 2007 TOKYO RISING INEQUALITY AND POLARIZATION IN ASIA ERIK LUETH INTERNATIONAL MONETARY FUND Paper presented
OIC/COMCEC/32-16/D(39) CCO BRIEF ON POVERTY ALLEVIATION
 CCO BRIEF ON POVERTY ALLEVIATION") OIC/COMCEC-FC/32-16/D(5) POVERTY OIC/COMCEC/32-16/D(39) CCO BRIEF ON POVERTY ALLEVIATION COMCEC COORDINATION OFFICE November 2016 CCO BRIEF ON POVERTY ALLEVIATION Poverty is defined as the lack of sufficient
OIC/COMCEC-FC/32-16/D(5) POVERTY OIC/COMCEC/32-16/D(39) CCO BRIEF ON POVERTY ALLEVIATION COMCEC COORDINATION OFFICE November 2016 CCO BRIEF ON POVERTY ALLEVIATION Poverty is defined as the lack of sufficient
China s (Uneven) Progress Against Poverty. Martin Ravallion and Shaohua Chen Development Research Group, World Bank
 Progress Against Poverty. Martin Ravallion and Shaohua Chen Development Research Group, World Bank") China s (Uneven) Progress Against Poverty Martin Ravallion and Shaohua Chen Development Research Group, World Bank 1 Around 1980 China had one of the highest poverty rates in the world We estimate that
China s (Uneven) Progress Against Poverty Martin Ravallion and Shaohua Chen Development Research Group, World Bank 1 Around 1980 China had one of the highest poverty rates in the world We estimate that
Inequality in Indonesia: Trends, drivers, policies
 Inequality in Indonesia: Trends, drivers, policies Taufik Indrakesuma & Bambang Suharnoko Sjahrir World Bank Presented at ILO Country Level Consultation Hotel Borobudur, Jakarta 24 February 2015 Indonesia
Keywords: Economic Geography, Poverty, Income, Inequality, Turkey
 SPATIAL CHARACTERISTICS AND GEOGRAPHICAL DETERMINANTS OF INCOME POVERTY IN TURKEY Öznur Akgiş Erdal Karakaş Bilecik Şeyh Edebali University, Department of Geography, Turkey DOI: http://dx.doi.org/10.18509/gbp.2017.34
End poverty in all its forms everywhere
 End poverty in all its forms everywhere OUTLOOK Countries in Asia and the Pacific have made important progress in reducing income poverty, and eradicating it is within reach. The primary challenge is to
Souphalack Bounpadith
 Assessing the poverty impact of internal resettlement programs on the ethnic minorities in Lao PDR By Souphalack Bounpadith A thesis submitted to Victoria University of Wellington in fulfillment of the
Present by Mr. Manothong VONGSAY Deputy Director General of Investment Promotion Department Ministry of Planning and Investment Seoul, 20 June 2012
 Present by Mr. Manothong VONGSAY Deputy Director General of Investment Promotion Department Ministry of Planning and Investment Seoul, 20 June 2012 1. Country snapshot 2. Why invest in Lao PDR 3. New Features
RESETTLEMENT AND COMMUNITY DEVELOPMENT PLAN
 LAO PEOPLE S DEMOCRATIC REPUBLIC Ministry of Communication, Transport, Post and Construction ROADS FOR RURAL DEVELOPMENT PROJECT (ADB TA-3756-LAO) RESETTLEMENT AND COMMUNITY DEVELOPMENT PLAN SAYABURI HONGSA
MIGRATION AND URBANIZATION IN VIET NAM
 GENERAL STATISTICS OFFICE THE 2014 VIET NAM INTERCENSAL POPULATION AND HOUSING SURVEY UNITED NATIONS POPULATION FUND THE 2014 VIET NAM INTERCENSAL POPULATION AND HOUSING SURVEY MIGRATION AND URBANIZATION
DRIVERS OF DEMOGRAPHIC CHANGE AND HOW THEY AFFECT THE PROVISION OF EDUCATION
 DRIVERS OF DEMOGRAPHIC CHANGE AND HOW THEY AFFECT THE PROVISION OF EDUCATION This paper provides an overview of the different demographic drivers that determine population trends. It explains how the demographic
Poverty Status in Afghanistan
 Poverty Status in Afghanistan Based on the National Risk and Vulnerability Assessment (NRVA) 2007-2008 July 2010 A Joint report of the Islamic Republic of Afghanistan Ministry of Economy and the World
Thailand: Principles and Philosophy of South-South Collaboration
 Thailand: Principles and Philosophy of South-South Collaboration Prepared for: The High Level Meeting on International Collaboration for Children s Rights in the Asia and Pacific Region, Beijing P.R. China,
UNDERSTANDING TRADE, DEVELOPMENT, AND POVERTY REDUCTION
 ` UNDERSTANDING TRADE, DEVELOPMENT, AND POVERTY REDUCTION ECONOMIC INSTITUTE of CAMBODIA What Does This Handbook Talk About? Introduction Defining Trade Defining Development Defining Poverty Reduction
Issues, Threats and responses Vanessa Tobin UNICEF Representative Philippines
 Impact of the Economic Crisis on Children in Asia and the Philippines Issues, Threats and responses Vanessa Tobin UNICEF Representative Philippines Lessons learn from 1997 crisis Globalization has both
Poverty Data Disaggregation: Experiences and Suggestions of China. Wang Pingping Department of Household Surveys of National Bureau of China (NBS)
") Poverty Data Disaggregation: Experiences and Suggestions of China Wang Pingping Department of Household Surveys of National Bureau of China (NBS) Disaggregated poverty data is important for most of the
Poverty Data Disaggregation: Experiences and Suggestions of China Wang Pingping Department of Household Surveys of National Bureau of China (NBS) Disaggregated poverty data is important for most of the
Monitoring Country Progress in Pakistan
 Monitoring Country Progress in Pakistan Program Office OAPA & USAID/Pakistan U.S. Agency for International Development Pakistan Institute for Development Economics September, 21 st, 211 Economic Reforms
Youth labour market overview
 1 Youth labour market overview With 1.35 billion people, China has the largest population in the world and a total working age population of 937 million. For historical and political reasons, full employment
Yemen UNDAF PRIORITY AREA 1: Inclusive and diversified economic growth. (UNDP, FAO, IFAD, ILO, UNIDO)
") NATIONAL DEVELOPMENT PRIORITY: Economic diversification through stimulation of non-oil economic growth. Yemen UNDAF PRIORITY AREA 1: Inclusive and diversified economic growth. (UNDP, FAO, IFAD, ILO, UNIDO)
NATIONAL DEVELOPMENT PRIORITY: Economic diversification through stimulation of non-oil economic growth. Yemen UNDAF PRIORITY AREA 1: Inclusive and diversified economic growth. (UNDP, FAO, IFAD, ILO, UNIDO)
3. Similarities and differences between Thai culture and the cultures of Southeast Asia
 3. Similarities and differences between Thai culture and the cultures of Southeast Asia Thai society consists in a variety of people from different cultures who came to live together in what is today the
THE INDICATORS FOR SUSTAINABLE DEVELOPMENT:
 JULY 6, 2018 THE INDICATORS FOR SUSTAINABLE DEVELOPMENT: GENERAL FRAMEWORK 1.1 The Sustainable Development Goals (SDGs) On 25 September 2015, the UN-Assembly General adopted the 2030 Agenda for sustainable
ANALYSIS OF POVERTY TRENDS IN GHANA. Victor Oses, Research Department, Bank of Ghana
 ANALYSIS OF POVERTY TRENDS IN GHANA Victor Oses, Research Department, Bank of Ghana ABSTRACT: The definition of poverty differs across regions and localities in reference to traditions and what society
FOOD SECURITY MONITORING, TAJIKISTAN
 Fighting Hunger Worldwide BULLETIN February 2017 ISSUE 18 Tajikistan Food Security Monitoring Highlights The food security situation presents expected seasonal variation better in December after the harvest,
Outline: Poverty, Inequality, and Development
 1 Poverty, Inequality, and Development Outline: Measurement of Poverty and Inequality Economic characteristics of poverty groups Why is inequality a problem? Relationship between growth and inequality
Increasing Access to Health Services for those living in Border Areas in the GMS
 International Organization for Migration (IOM) Increasing Access to Health Services for those living in Border Areas in the GMS WHO Bi-regional Meeting on Healthy Borders in the Greater Mekong Sub-region
ASIAN DEVELOPMENT BANK
 ASIAN DEVELOPMENT BANK TAR: REG 37667 TECHNICAL ASSISTANCE (Financed by the Poverty Reduction Cooperation Fund) FOR PREVENTING THE TRAFFICKING OF WOMEN AND CHILDREN AND PROMOTING SAFE MIGRATION IN THE
Chapter 2 Overview of Sudanese Economy and the Status of ICT in Sudan
 Chapter 2 Overview of Sudanese Economy and the Status of ICT in Sudan 2.1 Introduction This chapter provides a general overview of the socio-economic characteristics of the Sudanese economy and explains
Migrant Labor Context of Lao PDR
 Migrant Labor Context of Lao PDR Dr Khamsay Chanthavysouk MD, MSc of TM Head of Statistic, Planning & Research Division National Mother and Child Hospital Overview of Migrant Labor Context Politic : Socialist
Abbreviations 2. List of Graphs, Maps, and Tables Demographic trends Marital and fertility trends 11
 CONTENTS Abbreviations 2 List of Graphs, Maps, and Tables 3 Introduction 5 1. Demographic trends 7 2. Marital and fertility trends 11 3. Literacy, education and training 20 4. Migration 25 5. Labour force
KNOWLEDGE BOOSTERS. An intense training of key advocates on effective awareness raising
 LAO PDR Proven Practices for Human Trafficking Prevention in the Greater Mekong Sub-region Subregion KNOWLEDGE BOOSTERS An intense training of key advocates on effective awareness raising THE PROVEN PRACTICE:
Decent Work and Sustainable Development Goals Baseline Indicators 1
 Decent Work and Sustainable Development Goals Baseline Indicators 1 May 2018 In September 2015, the 193 Member States of the United Nations, including Myanmar, adopted the landmark 2030 Sustainable Development
Violation of Refugee Rights and Migration in India
 International Journal of Research in Social Sciences Vol. 7 Issue 5, May 2017, ISSN: 2249-2496 Impact Factor: 7.081 Journal Homepage: Double-Blind Peer Reviewed Refereed Open Access International Journal
1. Summary Our concerns about the ending of the Burundi programme are:
 SUBMISSION FROM ANGLICAN ALLIANCE AND ANGLICAN CHURCH OF BURUNDI TO UK INTERNATIONAL DEVELOPMENT SELECT COMMITTEE INQUIRY ON DECISIONS ON DFID FUNDING FOR BURUNDI. 1. Summary 1.1 This submission sets out;