Republic of Kosovo Study for Poverty Profile in European Region. Final Report
|
|
|
- Irene Bryan
- 5 years ago
- Views:
Transcription
1 Republic of Study for Poverty Profile in European Region Final Report October 2010 JAPAN INTERNATIONAL COOPERATION AGENCY OPMAC Corporation
2
3 Poverty Indicator Basic data Region (*) Country Year Population, total (millions) Population growth (annual %) GNI, PPP (current international $) (billions) GNI per capita, PPP (current international $) GDP growth (annual %) ME ** , (current US$) (Source) World Bank, at a glance (WB website: as of August 2010) (Note) * AF: Africa, Ap: Asia and Pacific, CLA: Central and Latin America, ME: Middle-east and Europe ** All data for are estimates Poverty incidence (%) National Rural Urban Poverty Gap Index at $1.25 Poverty Poverty Gap Index (National) Source Survey year Inequality Gini index Year Household Budget Survey 2005/ / /06 (Source) World Bank, Poverty Assessment (2007) Remarks (Areas, populations & social groups considered to be vulnerable and Gini index disadvantageous) Not specified In Republic of, there is no data available on demography reflecting changes after the last general population census in Therefore, statistical analyses on socio-economic conditions of households by region in this report are based on estimations. For more precise and reliable statistical analyses on poverty by region require results of the next population census.
4
, Statistical Atlas 2008 (2008), p.")
5 Map of (Source) Statistical Office of (SOK), Statistical Atlas 2008 (2008), p.8
6
7 Maps of Social indicators
8
9
10
, 2006/2007 Source: Statistical Office of, \"Statistical ATLAS 2008\"")
11 小学校出席率 %( 地方自治体 )2006/2007 年 Participation of students of the elementary education in the number of inhabitants by Municipality (%), 2006/2007 Source: Statistical Office of, "Statistical ATLAS 2008" (2008), p41
12
13 Poverty Indicator Map of Maps of Social indicators Table of Contents List of Abbreviations and Acronyms What is Poverty? Table of Contents Chapter 1 Income Poverty Analysis Measurement of Income Poverty Source of Data for Poverty Analysis Poverty Line Income Poverty Indicators Poverty Trends at National Level Poverty Trends in Urban and Rural Areas Poverty Trends by Region Poverty Trends by Socio-economic Characteristic Inequality Indicators Gini Coefficient and Consumption Distribution Thiel Index... 8 Chapter 2 Non-Income Poverty Analysis Designated Poor Areas and Socially Vulnerable Groups by the Government Vulnerability Analysis Vulnerability Groups at Risk of Social Exclusion Human Development Index and Human Poverty Index Basic Human Needs Chapter 3 Explanatory Factors of Poverty in Domestic Factors National Development and Public Expenditure Industrial Structure and Employment Agriculture Productivity Geopolitical Factors Labor Migration and Remittance Displaced Persons and Internal Displaced Persons (IDPs) Factors related to Globalization Impacts of the world recession Chapter 4 Mechanism of Social Protection Formal Public Social Security System Pension Health protection Social Assistance Social assistance for war victims and war invalids Quasi-formal Social Security Informal Social Security System Chapter 5 Poverty Monitoring MDGs Progress... 41
14 5.1.1 MDG 1: Eradicate extreme poverty and reduce the risk of social exclusion MDG 2: Achieve high quality basic universal education MDG 3: Promote gender equality and empower women MDG 4: Reduce child mortality MDG 5: Improve maternal health MDG 6: Combat HIV/AIDS and Tuberculosis MDG 7: Ensure sustainable environment development MDG 8: Develop a Global Partnership for Development MDG 9: Improve governance for all citizens and especially for most disadvantaged groups Poverty Monitoring System MDG Monitoring Issues on Statistical Data Appendix Appendix 1: Poverty and Inequality Indicator Appendix 2: Midterm Expenditure Framework (MTEF) Financing Proposal Annex (1) List of Major Policy Documents (2) List of Major Statistical Surveys and Reports (3) List of Major Microfinance Institutions (4) List of Major NGOs (international and national) and CSOs (5) List of Major Socio-economic Research Institutions (6) List of Other References
15 List of Tables and Figure [Table] Table 1-1: Poverty Lines for (per month per person)... 2 Table 1-2: Poverty Status in... 2 Table 1-3: Income Poverty Trends and Distribution in... 3 Table 1-4: Poverty Incidence by Region... 4 Table 1-5: Poverty Incidence and Education... 4 Table 1-6: Poverty Incidence by Employment Status... 5 Table 1-7: Poverty Incidence by Main Activity... 6 Table 1-8: Poverty Incidence and Migration/Remittance... 6 Table 1-9: Poverty Incidence by Ethnicity of the Household Head... 7 Table 1-10: Inequality Status in... 8 Table 2-1: HDI and HPI in (2004) Table 2-2: Net Enrollment Rates (2005/06) Table 2-3: Access to Basic Services (2005/06) Table 3-1: Total Disbursement of Pension and Social Assistance Program Table 3-2: Number of the employees and average monthly salary by economic activities 21 Table 3-3: Real mean monthly wages of per-diem workers Table 3-4 Employment and Education (2005/06) Table 3-5: Migration and Remittances (2005) Table 3-6: Returnees by sending countries Table 4-1: Pensioners receiving basic state pension Table 4-2: Amount of Basic Pension and Expenditure Table 4-3: Coverage of Pensions in Total Population Table 4-4: Number of Recipients of Social Assistance Table 4-5: Number of Social Assistance Beneficiaries and Amount of Benefit, December Table 4-6: Targeting of Social Assistance (% of individuals) Table 4-7: Coverage of Social Assistance (% of individuals) Table 4-8: Under-coverage and Leakage of Social Assistance Table 5-1: MDGs Progress in Table 5-2: Data collection surveys for poverty monitoring [Figure] Figure 1-1: Thiel Index (2003/04 and 2005/06)... 9 Figure 2-1: Human Development Index by Municipality Figure 3-1: Policy Priorities in Figure 3-2: Budget Proportion from 2010 to 2012 by Priority Sector Figure 3-3: GDP share by sector (2007) Figure 4-1: KPST Share Price since Inception... 30
16
17 List of Abbreviations and Acronyms AVR : Assisted Voluntary Returns CSW : Centers for Social Work EC : European Commission ES : Employment Service ESPIG : Economic Strategy and Project Identification Group EU : European Union FDI : Foreign Direct Investment GE : Generalized Entropy GDP : Gross Domestic Product HBS : Household Budget Survey HDI : Human Development Index HPI : Human Poverty Index IDP : Internal Displaced Person ILO : International Labor Organization IMF : International Monetary Fund IMR : Infant Mortality Rate IOM : International Organization of Migration IPEC : International Programme on the Elimination of Child Labour KLA : Liberation Army KPST : Pension Saving Trust MCR : Ministry for Communities and Return MDGs : Millennium Development Goals MLSW : Ministry of Labor and Social Welfare MMR : Maternal Mortality Rate NGO : Non-Governmental Organization RAE : Roma, Ashkali, and Egyptian SBA : Stand-By Arrangement SIDA : Swedish International Development Cooperation Agency SOK : Statistical Office of TB : Tuberculosis TMK : Protection Corps (Albanian : Trupat e Mbrojtjes së Kosovës) UNDP : United Nations Development Programme UNHCR : United Nations High Commissioner for Refugees UNICEF : United Nations Children s Fund UNMIK : United Nations Interim Administration Mission in UNSC : United Nations Security Council USAID : United States Agency for International Development WB : World Bank
18
19 What is Poverty? The JICA Thematic Guidelines: Poverty Reduction 1, which was revised in 2009, mention concepts and definitions of poverty. From the practical point of view, the international society has been attempting to measure poverty based on different concepts of poverty as below, which produce different results of measurements or analyses. Absolute Poverty: the income or consumption status of household which cannot afford the minimum calorie intake for surviving and the other basic human needs, Relative Poverty: the income or consumption status of household which is lower than the majority of population in a country or in a region. People excluded from the general improvement of living standards taking into account social and cultural factors, Human Poverty: Denied opportunities and choices to have decent standard of living and constraints against moving out of poverty, Social Exclusion: Deprived rights for solidarity and coexistence. This poverty profile reviews poverty situations in by focusing on income poverty and non-income poverty taking into account the concepts and definitions of poverty mentioned above. 1 Please refer to the Chapter 1, Section 1-2 of the JICA s Thematic Guideline for Poverty Reduction. As mentioned in the Chapter 2, Section 2-2 in the Guideline, JICA focuses on capabilities for self-fulfillment and human security and recognizes that poverty closely links to discrimination and social exclusion. Then, JICA defines poverty as: a condition where the people are deprived of opportunities to manifest their capabilities to have the basic human life, and in addition, where the people excluded from the society or the development process.
20
21 Chapter 1 Income Poverty Analysis 1.1 Measurement of Income Poverty Source of Data for Poverty Analysis The main source of data for poverty analysis is a series of the Household Budget Surveys (HBS) 2 which is a core survey of the Statistical Office of (SOK). The World Bank (WB) conducted a poverty assessment 3 ( the WB Poverty Assessment ) to analyze changes between 2002/03 and 2005/06. However, there are some issues to be considered before using the HBS data for poverty analysis. The most critical issue is the large sampling errors in the HBSs due to the absence of a reliable updated census since Although there have been large and dynamic demographic changes in since the last census conducted in 1981, no reliable baseline data 4 is available to reflect the current situation in the country. It is highly possible that the sample surveys, including HBSs, contain fatal statistical biases. In addition, the data collection methodology and questionnaire design of the HBS, including a list of data items to be collected, changed after the first HBS of 2002/03. In general, it is necessary for income poverty analysis of developing country to estimate an income level based on consumption data because of difficulty to collect reliable data on income in developing countries. It is same as in. However, besides the first HBS, no comparable quantifiable data on consumption, such as consumption items, volume and amount, is available though they are key variables for income poverty analysis. Therefore, it is noted that there are statistical limitations on income poverty analysis based on the HBS data 5 and this presents a real difficulty in understanding the real situation of poverty in Poverty Line For analyzing poverty trends in, WB established an absolute poverty line in the WB Poverty Assessment. The food poverty line is an estimated cost of food consumption to satisfy the per person minimum calorie requirement of 2,100kcal. The absolute poverty line is a total estimated cost of minimum consumption to satisfy basic human needs, including not only food but also clothing, housing, education, health and so on. Absolute Poverty Line 6 = Minimum requirement of food consumption (Food Poverty Line) + Minimum requirement of non-food consumption 2 Swedish International Development Cooperation Agency (SIDA) provided technical and financial assistances for implementation of the HBSs. 3 World Bank, Poverty Assessment Volume I: Accelerating Inclusive Growth to Reduce Widespread Poverty (2007) 4 According to the estimation by WB, the population of is around 2 million. However, there are different poverty estimations which indicate the range of population size in the country from 2 million to 2.6 million. Such different estimated population size can bring about different estimated levels of socio-economic indicators for the country. 5 For details of problems of data comparability of HBS, please refer to the WB report of Poverty Assessment Volume II: Estimating Trends from Non-comparable Data (2007). 6 The WB poverty assessment uses the Complete Poverty Line instead of the Absolute Poverty Line. For the JICA Poverty Profiles, the word of Absolute Poverty Line is used. 1
22 There is no significant difference between the poverty lines for 2003/04 and for 2005/06 though the poverty lines for 2005/06 are slightly lower than the ones for 2003/04 (Table 1-1). The food poverty line is around 22 EUR per month per person and the complete poverty line is around EUR per month per person. Table 1-1: Poverty Lines for (per month per person) HBS Food Poverty Line Absolute Poverty Line HBS 2003/ EUR EUR HBS 2005/ EUR EUR (Source) World Bank, Poverty Assessment Volume II: Estimating Trends from Non-comparable Data (2007), p.21, Table Income Poverty Indicators Poverty Trends at National Level Due to the practical problems concerning HBS data, the poverty indictors based on them do not necessarily reflect real changes in the poverty status of during the period between 2002/03 to 2005/06. However, those indicators show some facts of poverty in the country (Table 1-2). According to the WB poverty assessment, the poverty headcount ratio (poverty incidence) 7, which shows the share of population living under the absolute poverty line, is 43.5% (2003/04) and 45.1% (2005/06). The food poverty incidence, which is the fraction of the population living under the food poverty line, was 13.6% in 2003/04 and 16.7% in 2005/06. Taking the issue of statistical bias in to account, it appears that there was little change in absolute and food poverty incidences between the two HBSs. Table 1-2: Poverty Status in (%) Indicator Rural Urban 2003/ / / / / /06 Poverty Incidence Food Poverty Poverty Poverty Gap Poverty Poverty Severity Poverty (Source) World Bank, Poverty Assessment Volume I: Accelerating Inclusive Growth to Reduce Widespread Poverty (2007), Annex A, Table A.9 and Annex B, Table B.1 The poverty gap (Depth of Poverty) shows sensitivity of the distance of the level of consumption by the poor from the poverty line. It is measured by the fraction of the average per capita consumption of the poor against the poverty line. The poverty gap ratio for the same periods in is 12% to 13%. It means that the disparity of consumption of the poor 7 In this report, the poverty incidence or the poor mean the absolute poverty incidence or the poor population living below the absolute poverty lines unless otherwise stated. 2
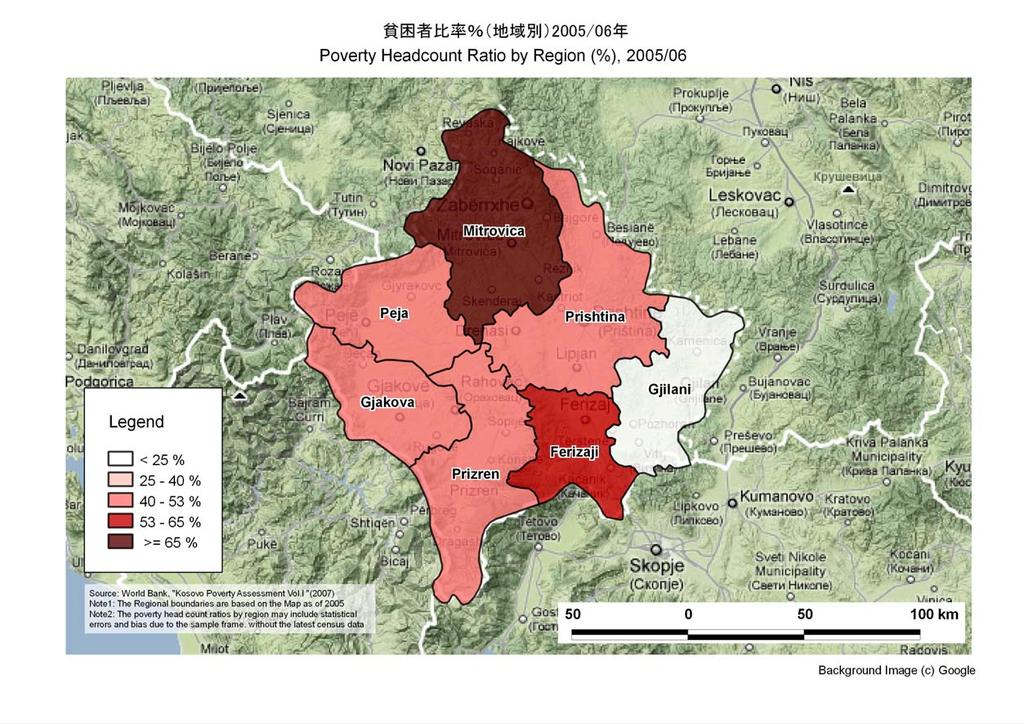
23 population from the poverty line was 12% to 13%. The poverty severity measures the inequality in distribution of consumption among the poor which is estimated by the squared poverty gap ratio. In for the same period, poverty severity was estimated at approximately 5%. This means that the inequality among the poor in the country is limited Poverty Trends in Urban and Rural Areas Table 1-3 shows the poverty incidences and the size of the poor populations in rural and urban areas. In, there is a large regional gap in poverty incidence between the rural and the urban areas. In 2005/06, around a half of the rural population were in poverty while less than 40% of the urban population was in poverty. Although no change in the poverty incidence of the country is observed, it is probable that the rural poverty incidence increased from 2003/04 to 2005/06 and the urban poverty incidence decreased over the same period. Moreover the size of the poor population is greater in the rural areas than in the urban areas. About 70% of the poor inhabit the rural areas of the country while the remaining 30% inhabit the urban areas. However, due to the lack of a recent population census, it is unclear how large the rural population is now. It is possible that the migration from rural areas to outside of the country has been significant and has reduced the size of the rural population, but no data on migration is available. According to the WB poverty assessment, about 1 in 5 Kosovars report having at least one member who is a migrant abroad, and 70% of the total number of migrants are from rural areas (for further details of migration, refer to 3.2.1) Table 1-3: Income Poverty Trends and Distribution in (%) Indicator 2003/ /06 Poverty Headcount ratio Rural Urban Distribution of Poor Population Rural Urban (Source) World Bank, Poverty Assessment Volume I: Accelerating Inclusive Growth to Reduce Widespread Poverty (2007), Annex B, Table B.1 and Table B Poverty Trends by Region In, poverty incidence varies greatly across regions (Table 1-4). The region having the highest poverty incidence is Mitrovica: 59.0% in 2003/04 and 69.7% in 2005/06. It is likely that Mitrovica has a larger share of rural population (exceeding 70% of the total population in the region) and a majority of non-albanian ethnic groups, including mainly ethnic Serbs. Ferizaj and Gjakova had also a higher poverty incidence than the national average: 54.4% in Ferizaj and 45.3% in Gjakova in 2005/06. On the other hand, Cjilani had the lowest poverty incidence of 23.5% in 2005/06 which decreased from 32.5% in 2003/04. Cjilani was used to be one of foremost industrial areas in before the conflict. Even now, private companies have business activities in the region. 3
24 In 2007, European Reconstruction Agency (EAR) 8 established a business incubator in the town of Cjilani. Prishtina, which has the capital city of the country, had the second lowest poverty incidence of 34.3% in 2003/04 but it increased to 40.6% in 2005/06. Table 1-4: Poverty Incidence by Region (%) Region 2003/ /06 Gjakova Cjilani Mitrovica Peja Prizreni Prishtina Ferizaj Total (Source) World Bank, Poverty Assessment Volume I: Accelerating Inclusive Growth to Reduce Widespread Poverty (2007), p.20, Table Poverty Trends by Socio-economic Characteristic (1) Education The lower educational attainment of household heads induces a higher poverty incidence among the households in (Table 1-5). Also, the poverty incidence of households headed by the persons with educational attainment lower than primary level were much higher than the poverty incidence of households headed by the persons with higher education. The poverty incidence of households headed by persons with uncompleted primary education was more than 60% in 2005/06. For the households headed by persons with completed primary education, the poverty incidence was more than 50%. The lowest poverty incidence among the sup-groups by the educational attainment of household head was for the households headed by persons with completed University or higher education. Less than 20% of household heads with higher education fell into poverty. Table 1-5: Poverty Incidence and Education (%) Educational Level of Household Head 2003/ /06 Uncompleted primary school Primary Secondary Vocational University or higher (Source) World Bank, Poverty Assessment Volume I: Accelerating Inclusive Growth to Reduce Widespread Poverty (2007), p.46, Annex B, Table B.10 8 EAR is an implementation body of assistance programs for Serbia,, Montenegro and Macedonia by European Union (EU). It was established in 2000 for the time limit of 5 years, but its activities were extended to
25 (2) Employment Status and Sector By employment status, the poverty incidence of households headed by an unemployed person was higher than the poverty incidence of households headed by an employed person (Table 1-6). 58.6% of the households headed by the unemployed lived below the poverty line. In 2005/06, the unemployment rate of the poor was about 50%. It implies, not surprisingly, that unemployment leads to a higher risk for households to fall into poverty. But it does not mean that all the households with unemployed heads of households are poor, nor that all the households with household heads in employment are free of poverty. The WB poverty assessment (2007) pointed out that about 70% of all the poor are either employed (salaried or self-employed) or inactive. Among the employed, the households headed by a per-diem worker had the highest poverty incidence of 60.8%. According to the WB Poverty Assessment, per-diem workers may be casual workers who are paid a wage for specific task. The poverty incidence of housekeepers was also high as 53.6%. Although many females may be engaged in housekeeping, there was no significant difference in poverty incidence between female headed households (49%) and male headed households (44.8%). The poverty incidences of households headed by the economically inactive are also relatively high: 47.5% for the retired and the disabled; 48.5% for the others including students. The households headed by employer had the lowest poverty incidence of 18.4%. Also the households headed by other self-employed not including farmer had lower poverty incidence of 29.6%. Table 1-6: Poverty Incidence by Employment Status Employment Status 2005/06 Employer 18.4 Employed with salary 35.8 Per-diem worker 60.8 Self-employed (not including farmer) 29.6 Self-employed, agriculture 42.6 Retired/disabled 47.5 Unemployed 58.6 Housekeeper 53.6 (Source) World Bank, Poverty Assessment Volume I: Accelerating Inclusive Growth to Reduce Widespread Poverty (2007), p.47, Table B.11 (%) By sector (Table 1-7), the self-employed in the mining and construction sector had the highest poverty incidence of 51.9%. It suggests that the more than half of the self-employed in those sectors were living below the poverty line. Although rural poverty may be a significant issue, the poverty incidence for subsistence farmers was 42.6%, which was lower than the national level. The relatively lower poverty incidence of subsistence farmers may be due to having another source of income, such as from remittances, as mentioned above. 5
26 Table 1-7: Poverty Incidence by Main Activity Main Activity 2005/06 Self-employed, agriculture 42.6 Self-employed, mining/construction 51.9 Self-employed, trade 37.5 Self-employed, other 41.3 Wage earner, professional 27.5 Wage earner, manufacturing 42.3 Wage earner, other 36.6 Non active 48.5 (Source) World Bank, Poverty Assessment Volume I: Accelerating Inclusive Growth to Reduce Widespread Poverty (2007), p.47, Table B.12 (%) (3) Migration and Remittance According to the estimation by the WB Poverty Assessment, the households having migrant worker or receiving remittances had lower poverty incidences than the poverty incidence of the country (Table 1-8). The poverty incidence for the households having migrant worker and receiving remittance were 30.4% and 29.8%, respectively. However, there are regional gaps in poverty incidence by migration and remittances between urban and rural areas. In rural areas, the poverty incidence for the households with migrant worker and remittances were 27.3% and 25.7%, respectively. These poverty incidences were much lower than the rural poverty incidence of 49.2%. Therefore, it is obvious that migrant worker and remittances reduce poverty risk in rural areas. On the other hand, in urban areas, the both households with migrant workers and remittances had higher poverty incidence than the urban poverty incidence of 37.4%. 38% of households with migrant workers and 40.6% of households with remittances were living below the poverty line. It is suggested that the rural households can relatively easily to compensate for the shortfall from the poverty line by revenues from the migrant worker or remittances due to the lower consumption level in rural areas. Therefore, the rural poor households with migrant worker or remittances may enable to move out of the poverty. On the other hand, since the consumption level is higher in urban areas, it can be difficult for the urban poor households to obtain enough level of consumptions in order to fulfill the poverty line only by revenues from migrant workers or remittances. Or, the most of migrant workers from urban areas may be from the lower income households. Therefore, they probably cannot have a work with sufficient wage to satisfy the poverty line even as a migrant worker abroad. According to the WB poverty assessment, more than 70% of households receiving remittances inhabited in rural areas. In addition, the fractions of households with remittances in Mitrovica and in Prizreni were more than 20%, respectively, which were higher than the other regions. Table 1-8: Poverty Incidence and Migration/Remittance (%) % of the Households with Migrant Worker below the Poverty Line % of the Households with Remittance below the Poverty Line Poverty Incidence Urban Rural (Source) World Bank, Poverty Assessment Volume I: Accelerating Inclusive Growth to Reduce Widespread Poverty (2007), p70, Table D.2 6
27 (4) Ethnicity According to the WB poverty assessment, regarding poverty incidence by ethnicity, it is difficult to draw implications because of the concerns about data quality 9. Table 1-9 shows the poverty headcount ratios by ethnicity in 2003/04 and 2005/06. However, the considerable disparities in the indicators between 2003/04 and 2005/06 are observed despite of there being no change in poverty incidence of household headed by Kosovan Albanian and other ethnic groups across these two survey years. On the other hand, poverty incidence for the households headed by Kosovan Serb by both absolute and food poverty lines dramatically increased from 2003/04 to 2005/06. The food poverty incidence of Kosovan Serb increased from 43.5% in 2003/04 to 81.8% in 2005/06. However, it is unlikely because of no specific factors to expand the food poverty among the Serbian households for that period 10. Table 1-9: Poverty Incidence by Ethnicity of the Household Head Ethnicity Food Poverty Absolute Poverty 2003/ / / /06 Kosovan Albanian Kosovan Serb Other (Source) World Bank, Poverty Assessment Volume I: Accelerating Inclusive Growth to Reduce Widespread Poverty (2007), p.20, Table 3.4 The WB poverty assessment mentioned the three hypotheses for such unusual deteriorating poverty among the Kosovan Serb households. The first is that Kosovan Serb areas have become enclaves, isolated economies. The second is that many better off Serbian households have left for the Republic of Serbia and those left behind are mostly the very poor. The third is the possibility that the data qualities from mostly Kosovan Serb statistical areas are poor because the Statistical office does not have much control over the enumerators in the Kosovan Serbareas. The estimated wage level (2002 price) by the WB poverty assessment based on the HBS data indicates no gap with the wage level between Kosovan Serb and other ethnic groups. The average wage of Kosovan Serb was EUR per month in 2005/06, which decreased from EUR, is almost same as the average wage of EUR for the other groups. Therefore, the third one is quite possible to apply. 1.3 Inequality Indicators Gini Coefficient and Consumption Distribution Gini coefficient, which measures inequality of consumption distribution among the consumption groups, vary between 0 and 1, with 0 representing an equal distribution and a higher value representing a higher level of inequality. All the Gini Coefficient increased from 0.27 to 0.3 in for the period between 2003/04 9 The ethnic issues are very sensitive for the Government of as well as the neighboring countries, including Serbia. Therefore, it may be difficult to collect detailed data and information related ethnicity. 10 There are many discussions on whether Serbians in are poor or not. Some development partners in mentioned that they may not be so poor because of remittance as well as social benefits from the Serbian Government for. 7
28 and 2005/06, which indicates a slight increase in inequality. It is mainly due to the increase in the rural inequality. While the Gini Coefficient for the urban areas remained at the same level of 0.31 over the period, the Gini Coefficient for the rural areas went up from 0.25 to The consumption share by consumption group also showed the deterioration of inequality in the country (Table 1-10). By decile, the population can be classified into 10 consumption groups from the top 10% group to the bottom 10% group. Since the poverty incidence of is around 45%, the consumption groups from the bottom 10% to the bottom 50% can be considered as the poor. In particular, the bottom 10% can be considered as the poorest. The p90/p10 ratio, which is the proportion of the consumption share by the top 10% decile (p90) to the share by the bottom 10% decile (p10), expanded to 3.96 in 2005/06 from 3.33 in 2003/04. By quartile, there are 4 consumption groups from the top 25% to the bottom 25%. The bottom 25% and the bottom 50% groups can be considered as the poor. The p75/p25 ratio, which is the proportion of the consumption share by the top 25% (p75) to the share by the bottom 25% (p25) (p75/p25) also expanded to 1.97 in 2005/06 from 1.89 in 2003/04. Since the p90/p10 ratio is larger than the p75/p25 ratio, the deterioration of inequality in the country may be mainly attributed to the expansion of consumption gap between the top consumption group and the poorest. In particular, in rural areas, the gap between the top and the poorest consumption groups was considerable. The deteriorated p90/p10 ratio in rural areas, which worsened from 3.09 in 2003/04 to 3.68 in 2005/06, may lead the widening inequality in the country. Indicator Percentile Ratio Table 1-10: Inequality Status in Rural Urban Total 2003/ / / / / /06 p90/p p75/p Gini Coefficient (Source) World Bank, Poverty Assessment Volume I: Accelerating Inclusive Growth to Reduce Widespread Poverty (2007), p.12, Table Thiel Index The Thiel Index (Figure 1-1) is also a inequality indicator, which shows the weighted average of inequality within subgroups as well as inequality among those subgroups. The overall Thiel Index can be disaggregated into the intra-regional (or group) and inter-regional (or group) attributions. This can serve as a helpful tool for the analysis of regional inequality as it suggests the relative importance of spatial dimension of inequality. The overall Thiel index, which deteriorated from 0.38 to 0.45 for the same period, shows the expansion of inequality in. The inequality within urban areas (0.17) was the largest attribution to the overall inequality of the country. On the other hand, the inequality within rural areas was attributed to the deterioration of the overall inequality for the period from 2003/04 to 2005/06. The Theil Index within rural areas went up from 0.1 in 2003/04 to 0.14 in 2005/06. While the inequality within urban areas slightly increased from 0.16 to 0.17, the inequality between urban and rural areas 8
29 worsened from 0.12 to Therefore, the urban and rural gap also contributed to the deterioration of overall inequality. The WB poverty assessment (2007) pointed out that shortfalls of income have been compensated by the remittances from family members who are migrants abroad. On the other hand, households without migrants cannot have additional income from remittances and therefore tend to have a higher poverty incidence than households with migrants. Although remittances increased the incomes of households in rural areas and may have reduced rural poverty, it may also have accelerated the differences in income levels between the better-off household receiving remittances and the worse-off households without remittances in rural areas Theil Index Within Region Within Urban Within Rural / /06 Year (Source) World Bank, Poverty Assessment Volume I: Accelerating Inclusive Growth to Reduce Widespread Poverty (2007), p.12, Table 2.3 Figure 1-1: Thiel Index (2003/04 and 2005/06) 9
30
31 Chapter 2 Non-Income Poverty Analysis 2.1 Designated Poor Areas and Socially Vulnerable Groups by the Government There is no officially designated poor area in, geographically or administratively. However, the Government of provides social assistance benefit targeted to the poor (living below the absolute poverty line) and the extreme poor (living below the food poverty line). It was introduced in 2002 and revised in December The amount of benefit is based on the amount of the food poverty line, which is adjusted every year. The two categories of eligibility to receive the social assistance benefit: Families without resources where no one is capable of work, or expected to make themselves available for work (single mothers, children under 15 years or schooling and under 18 years), Families with at least one child under 5 or caring for an orphan under 15 years. Under the second category, additional members of the household who are capable of working are not eligible as they are required to register as unemployed. Furthermore, eligible families cannot possess income generating assets that exceed 0.5 hectares of land. The eligible families can receive the amount of difference between the income and the benefit in the case they have income which should be lower than the amount of benefit. Therefore, the only families which are eligible for any one of categories above, and have income below the food poverty line, can receive the social assistance benefit. According to the WB poverty assessment (2007), the distribution of recipients, which is beneficiary incidence, shows that the social assistance benefit program was well-targeted. By consumption quintile, the bottom 20% and the bottom 40% groups, which can be considered as the poor, accounted for over the 70% of the recipients of the social benefit. The simulation by WB also indicates that the poverty incidence without social benefit may be higher than the current poverty incidence. While the needs for such pro-poor social protection programs will increase, there are budget constraints to expand such social protection programs in order to meet the needs. Therefore, for prioritizing the poor, it is necessary to more well-defined targeting and more efficient management of the existing social protection programs. Details of the social assistance program in will be discussed in the Chapter Vulnerability Analysis Vulnerability Groups at Risk of Social Exclusion Among the European Union (EU) member countries, social inclusion, rather than poverty reduction, is a main agenda to be addressed by national strategies and programs. Social inclusion challenges policy makers to eliminate discrimination economically, politically and socially and to integrate marginalized groups in the society. The European Commission (EC) conducted an assessment of Social Protection and Social Inclusion in (2008). In this study report, four groups are indentified as vulnerable groups at high risk of poverty and exclusion. 11
32 (1) Child Labor Child labor is a major factor for social exclusion of children in, in particular in rural areas. Traditionally, child labor has been regarded as acceptable within cultural and social norms and as a means to integrate children into family and kinship networks. However, currently, children are also exposed to many forms of paid or unpaid work in the country. According to the survey by the Ministry of Education, Science and Technology in , 89% of the respondent children declared that they know children of their age who carry out some kind of labor. 78% percent of them state that their economic situation is the main reason for child labor. According to United Nations Children s Fund (UNICEF) Situation Analysis of Children and Women in, 3,461 children were either suspected or victims of criminal activities between 2000 and In terms of human trafficking these are low numbers, but they have been increasing over past years. The International Programme on the Elimination of Child Labour (IPEC) reported that only 40 or so official victims of child trafficking are being supported. Another reason for the social exclusion of children is a lack of birth certification and birth registration. Due to the lack of official certification and registration, children are excluded from social welfare provision as well as from social services such as education and health care. This affects Roma children in particular. (2) Women Women in have serious disadvantages in various dimensions. Economically, the labor participation rate of women is only 35% which is the lowest level in Europe. In addition, the unemployment rate for women is considerably higher than for men: 69% for women and 40% for men. The educational attainment of women is also considerably lower than of men. In particular in rural areas, the backwardness of the educational level of women is serious: 26% of women aged are considered relatively illiterate. (3) People with Disabilities It is estimated that around 150,000 person with disabilities in live in poverty, isolation and stigma. The majority of them are excluded. In general, awareness of disabilities issues is very low. Therefore, people with disabilities are often hidden away within the family home. There is a general anti-discrimination law to protect disabled persons, but its implementation is too weak to provide effective social assistance to them. (4) Ethnic Minorities The issue of minorities and poverty is a critical consideration for the country although no reliable data exists. Although considerable political attention has been given to the Serb minorities, the social exclusion of other minorities, such as the Turks, Bosniaks, Gorani and the Roma, is often overlooked. In particular, the Roma are a group of people facing tremendous exclusion historically. Poverty has been inherited from generation to generation and has been exacerbated by discrimination at school, in employment and in accessing public services Human Development Index and Human Poverty Index There is no updated analysis on vulnerability of the population in after the Human 11 The survey covered 334 school children of all ethnic groups. 12
33 Development Report in The Human Development Index (HDI) measures the level of human development which is composed of multiple factors, including life expectancy at birth, adult literacy, enrollment rate, and income per capita. The higher HDI indicates the higher achievement of human development. The HDI of in 2004 is HDIs of other countries in the Central European region, such as Albania and Bosnia and Herzegovina as of 2007 were over 0.8. Therefore, the progress of human development in is behind compared with those countries. Table 2-1: HDI and HPI in (2004) Category HDI HPI-1 HPI-2 Ethnicity Kosovan Albanian Kosovan Serb RAE (Roma, Ashkali and Egyptian) Others Rural/Urban Rural Urban Reference (2007) Bosnia and Herzegovina * Albania ** Serbia (Source) United Nations Development Programme, (UNDP) Human Development Report 2004 (2004), Annex II, p.110, Table A1, p.111, Table A2, and p.112, Table A3, and Human Development Report 2009 (2009) (Note) * HPI-2 for Bosnia and Herzegovina is a figure in (UNDP, National Human Development Report 2009: Social Capital in Bosnia and Herzegovina (2009)) ** HPI-2 for Albania is a figure in (UNDP, Pro-Poor Women Policies and Development in Albania (2005)) The HDI of the rural areas is which is lower than the country average, while the HDI of the urban areas reached 0.7, which is above the country average. Among the ethnic groups, there are disparities in HDI. Albanian and Serb people have higher HDI than the country average, but the group of Roma, Ashkali and Egyptian (RAE) has lower HDI of which was far below the country average. The Human Poverty Index (HPI), which measures a level of poverty from dimensions of human development. The higher HPI indicates the severe deprivation of the dimensions of human poverty. The HPI-1, which is used for measuring human poverty in developing countries, is 9.66 for which is much higher than the neighboring countries: Bosnia and Herzegovina (2.8), Albania (4.0) and Serbia (3.1), as of The HPI-2, which is for selected OECD countries, is for. The HPI-2 of is also considerably higher than Bosnia and Herzegovina (16.2 in 2008) and Albania (9.48 in 2005) By region in the country, the HPIs of the rural area is higher than the HPIs of the urban area. As mentioned in the Chapter I, the rural poor suffer from poverty in both economic and social dimensions. 13
 and Serb (22.77).")
34 Regarding the ethnicity, the group of RAE has higher HPIs than the average as well as the other ethnic groups. For RAE, HPI-1 is and HPI-2 is The other ethnic groups also have higher HPI-2 of 40.87, which is higher than Albanian (37.65) and Serb (22.77). RAE and other ethnic groups face more severe economic and social conditions than Albanian and Serb. High HDI ( ) Medium HDI ( ) Low HDI ( ) (Source) United Nations Development Programme, Human Development Report 2004, p.37, Figure 2-1: Human Development Index by Municipality The HDI of Serbs is above Albanians, the HPI is reversed. This indicates that Serbs have higher levels of some prerequisites of development such as educational attainment Basic Human Needs (1) Education The analysis on education and poverty level shows that income poverty is closely related to educational level. For primary education, there is a smaller difference in the net enrollment rate between the total population and the poor. But for the secondary and the tertiary education, the net enrollment rates of the poor are lower than of the total population. 14
35 The enrollment rates by consumption quintile indicate the same tendency. As mentioned above, the 1 st and 2 nd quintile, which are bottom 20% and 40% consumption group, can be considered as the poor in. While the difference in primary education between the lower and higher quintiles is relatively small, the lower quintiles have lower enrollment rates than the higher quintiles for secondary and tertiary education. For primary education, the enrollment rate for the 1 st quintile as the poorest and the 4 th and 5 th quintiles are 83.3% and 91.5%, respectively. However, only 12.9% of the 1 st quintile ( the poorest ) has tertiary education, while 27.4% of the 5 th quintile does. The fact can be interpreted in two ways. One is that the poor population has a limited access to higher education due to their financial constraints. The other one is that the limited educational attainment constrains income opportunities and becomes one of determinants of poverty. It is probable that poverty and education mutually affect on the living standards of the people. Table 2-2: Net Enrollment Rates (2005/06) Primary Secondary Tertiary Total Poor Quintile 1st quintile (bottom 20%) nd quintile (bottom 40%) rd quintile (bottom 60%) th quintile (top 40%) th quintile (top 20%) (Source) World Bank, Poverty Assessment Volume I: Accelerating Inclusive Growth to Reduce Widespread Poverty (2007), Appendix B. p.50-51, Table B25, B.27 and B.28 (%) (2) Basic Service Access to basic services is another dimension to analyze poverty in terms of living standards. In terms of access to electricity, there is no significant gap between the total population and the poor population, nor is there any difference between the consumption quintiles. 97.5% of the poor had access electricity while 97.9% of the entire population did. The share of population with access to electricity by the 1 st and 2 nd quintiles were 96.8% and 98.1%, respectively, whereas 99.4% of the 5 th quintile group had access to electricity. Also there is no significant difference in access to electricity between the urban and the rural areas. The share of rural population with access to electricity was 97.1% which is almost same level of the country. By consumption quintile in rural areas, there is no significant difference between the top and the bottom quintile: 95.9% for the 1 st quintile (bottom 20%) and 98.9% for the 5 th quintile (top 20%). However, in HBS, access to electricity is defined by the percentage of people living in dwelling with electricity, which does not necessarily mean that the people always have stable electricity. As the WB poverty assessment pointed out, there are well-known problems of inadequate power supply, in particular, during periods of peak demand. Therefore, there is possibility that quality of life may be harmed by unstable power supply in some regions. Regarding access to water, there are larger disparities between the total population and the poor and among the consumption quintiles. While 83.9% of the total population lives in dwellings with an indoor water tap, only 75.5% of the poor have access to indoor tapped water within their 15
36 dwellings. At the same time, 96% of the 5th quintile (top 20%) has access to water, while less than 70% of the 1st quintile (bottom 20%) has access to water. In addition, the rural population has limited access to indoor tapped water within their dwellings. Only 69.4% of the rural poor population lives in dwellings with an indoor water tap. The percentage of the 1 st quintile of the rural areas with access to tapped water is even lower: only 61%. The WB poverty assessment also pointed out the differences in the quality of water supply between rural and urban areas, due to bacteriological or chemical contamination. Considering those facts, income poverty may constrain access to basic services, in particular, safe water, which affect health status of the people. In other words, the poor population, especially in the rural area, suffers from the worse living conditions that the country average. Table 2-3: Access to Basic Services (2005/06) Access to Water* Electricity** Total Rural Total Rural Total Poor Quintiles 1st quintile (bottom 20%) nd quintile (bottom 40%) rd quintile (bottom 60%) th quintile (top 40%) th quintile (top 20%) (Source) World Bank, Poverty Assessment Volume I: Accelerating Inclusive Growth to Reduce Widespread Poverty (2007), Appendix B. p.52-53, Table B29, B.30 and B.31 (Note) * Access to safe water is defined by the percentage of people living in dwellings with indoor water tap ** Access to electricity is defined by the percentage of people living in dwelling with electricity (%) 16
37 Chapter 3 Explanatory Factors of Poverty in 3.1 Domestic Factors The Government of is developing a series of National Strategies, although a comprehensive national development strategy has not yet been developed. The Government of established an Economic Strategy and Project Identification Group (hereinafter referred to as ESPIG) with key donors and ministries for the preparation of the development strategy. First of all, they started preparing a nation-wide population census planned 2011, followed by further work to establish a solid basis for all economic statistics and analysis National Development and Public Expenditure In this section, the implementation of government finance will be reviewed mainly according to Program of the Government of Republic of , Midterm Expenditure Framework , the Budget of the Republic of for the year 2010, and other economic statistics provided by the Statistical Office of (SOK). The government has four pillars for prioritized areas in the Program of the Government of Republic of : 1) Economic Growth, 2) Status Implementation, 3) Good Governance, and 4) Mitigation of Poverty and Social Stability. Among these priorities, the government especially focused on economic development so that it will decrease the level of unemployment, improve social conditions and mitigate poverty. In order to achieve these, an increase in productivity is the first issue to be solved through investments in the energy sector, physical infrastructure, especially roads and railways, education, rule of law, the development of the financial market and fiscal policies. In addition, the government aims at the improvement of pensions and other social transfers and the health system, in order to mitigate poverty and assure social stability. 12 For further information on development of the national strategy, please refer to Towards a Development Plan The state of the economy and possible ways forward-, ESPIG Policy paper No.1, Pristina, August
38 An Economically Sustainable, being a multi-ethnic State on its Path to European Integration and meeting the Highest Stands of Accountability and Transparency Economic Growth Implementation of Status settlement Good Governance Poverty alleviation and Social stability Infrastructure Decentralization Public Administration Reform Pensions and other social transfers Rule of law Security Public Financial Management Health Education New institutions Corruption Agriculture Minorities Improving Execution of capital spending Fiscal policies Financial sector (Source) Ministry of Economy and Finance, Midterm Expenditure Framework , p.7 Figure 3-1: Policy Priorities in In accordance with these priorities, the government determined the allocation of the budget and it presented the midterm expenditure framework as shown in Appendix 2. The budget for priority sectors accounts for around 65% out of total budget from 2010 to Out of which, sector of economic growth including the education sector makes up 16%, and the sector of social welfare and health makes up 22%. The budget for poverty reduction and the social sector such as education, social welfare and health will account for more than a third if the budget is executed as planned (Figure 3-2). In, the budget for the municipalities is 285 million EUR in 2010, of which 230 million EUR is the central fiscal transfer and 50 million EUR are own resources. The general grant can be used at the discretion of the local authorities. 18
39 36.1% 35% 14.8% 15% 6% 6.4% 12% 12.3% Sector of economic growth Sector of Education and Culture Sector of Rule of Order and Law Sector of Social Welfare and Health Other Priority Sectors 10.7% 11% 20.9% 21% Others (Source) Study Team calculation based on MTEF Figure 3-2: Budget Proportion from 2010 to 2012 by Priority Sector For the compensation of fiscal deficit and the stabilization of macro economy, the Government of requested International Monetary Fund (IMF) 13 for a Stand-By Arrangement (SBA), negotiated in May 2010 and concluded the loan agreement in July In the process of the negotiation with IMF on SBA, the Government of was required to reduce the budget for 2010 as a part of the conditionality. The final revised budget is not disclosed yet, but according to the officials in Ministry of Economy and Finance 14, the major project of the government is to build a new highway to Albania, costing an estimated 1 billion EUR. This highway project is very important for society from the aspects of job-creation and income-generation. Thus the Government of considers it is inevitable for the project to secure the budget. In addition a pay increase has been agreed for public sector workers. The government aims to preserve spending on education, health and agriculture. The burden of the cuts will therefore fall on other ministries, including other areas of transport such as local roads maintenance. In terms of budget for social welfare, over 75% of the social protection system is devoted to pensions (as will be described in detail in Chapter 4) and social assistance benefits, according to the Poverty Assessment done by the WB. Table 3-1 shows the evolution of total benefits based on disbursement amounts. Table 3-1: Total Disbursement of Pension and Social Assistance Program (thousand EUR) Indicator Pension Official figures 49,495 61,572 84,711 86,268 89,450 HBS estimates 67,799 68,277 70,052 72,788 Social Assistance Official figures 32,293 32,217 32,480 HBS estimates 19,615 26,323 34,880 33,048 (Source) World Bank, Poverty Assessment Volume I: Accelerating Inclusive Growth to Reduce Widespread Poverty (2007), p.28, Table became the IMF s 186th member in June Interview with Director of Budget Department, Ministry of Economy and Finance, dated on June 4th,
40 There are two types of financial flows regarding the budget for the education sector and the health sector: one goes directly from Ministry of Education or Ministry of Health to municipalities in the form of budget allocation and the other goes to municipalities in the form of grant from the government. One tenth (10%) of the budget is allocated to the municipalities, and in addition there is an education grant and a health grant. The education and health grants themselves must be spent on those two sectors Industrial Structure and Employment As of 2007, the largest proportion to GDP was public administration and defense sector (13.2%). In the economy sector excluding public administration and defense, real estate and business services is large with 12.4%, followed by agriculture sector (12.0%), industry, energy and water supply (11.2%) and construction sector (10%). 1% 3% 2% 17% 12% 1% 11% 13% 10% 12% 4% 4% 1% 9% Agriculture & Fishing Mining Industry, energy & water supply Construction Wholesale & retail trade Hotels & restaurants Transport, storage & communication Financial intermediation Real estate & business services Public administration & defence Education Health & Social Work Community, social & perdonal services Taxes on products (Source) World Bank, : Unlocking Growth Potential: Strategies, Policies, Actions (2010), p.4, Table 3 Figure 3-3: GDP share by sector (2007) Looking at the employment, the total number of the employees in 2005 was 72,185 persons (Table 3-2). The following sectors, agriculture, forestry, fishing, finance and public administration are not included in this figure so that it does not cover all of the economic sectors. In terms of structure of the employees by economic activities (Table 3-2), the largest part accounts for trade sector with 26.7%. The trade sector in is characterized by a large number of small enterprises with a small number of the employees, and they are mainly family businesses with only one person employed 15. The average monthly salary of the trade sector is 279 EUR, at the same level of the average monthly salary in total (281 EUR). Regarding the poverty headcount ratio by sector, the ratio of the self-employed workers in the trade sector is 37.5% and it can be said that the poverty risk is not so high for the workers in the trade sector. 15 SOK, 2008, Economic Statistics Structural Business Survey 2005, p.11 20
41 Table 3-2: Number of the employees and average monthly salary by economic activities Activity No. of the employees % Wages and salaries (in 000 EUR) Monthly average salary Mining 3, , Industry 8, , Energy 9, , Construction 5, , Trade 19, , Hotels and restaurants 9, , Transport, post and telecommunications 7, , Businesses services 4, , Other services 3, , Total 72, ,890* 281 (Source) Statistical Office of, Economic Statistics Structural Business Survey 2005 (2008), p.11 and 12 (Note) *: According to the statistical data from SOK, this figure is EUR 243,530,000. Turning next to the average salary 16, the highest is in transport, post and telecommunication and the lowest in hotels and restaurants. The gap between the highest average salary and the lowest is more than 3.5 times. The average monthly salary in the mining sector is low level with 188 EUR and it can be considered that the wage level may affect the poverty risk. The wage level of per-diem workers that is the highest poverty headcount ratio among all groups by employment status fell much below the average in total and it was 153.5Euro in 2005/06. Moreover, real mean monthly wages reported by wage earners in the household remained unchanged between 2002/03 and 2005/06 while the average wage in the per-diem workers drastically decreased. As the sample is limited 17, there is controversy whether these data reflects accurately the actual status but it could be a factor of high poverty headcount ratio of the per-diem workers that their wage level is far below the average wage in total. Table 3-3: Real mean monthly wages of per-diem workers (EUR) 2002/ / / /06 Total Per-diem worker (Source) World Bank, Poverty Assessment Volume I: Accelerating Inclusive Growth to Reduce Widespread Poverty (2007), p.5, Table 1.4 Regarding the relation between employment status by education level (Table 3-4), the employment status differ depending on the education level completed. Around 70% of people with vocational and tertiary education are salaried employees, which poverty incidence is relatively low at 35.8%. 43.8% of people with primary education and 55.2% with uncompleted primary education are housekeepers, which poverty incidence is high at 53.6%. This shows that the lower educated have higher risk of poverty incidence because they have less pay. The unemployed accounts for 41.1% in secondary education and 32.1% in primary education, 16 It is calculated by dividing the gross salaries, which is considered the part of pension that the owner pays for the employee, and daily pays for entire year, for the employed number and 12 months of the year. 17 For example, the samples for the per-diem workers in 2002/03 were 60 and 243 in 2005/06. 21
42 and its is higher in comparison with tertiary educated individuals. The poverty incidence of the unemployed is high at 58.6%. Therefore, it indicates that the individuals with lower educated than secondary education have high risk of unemployment, so that hey have high risk of poverty. Table 3-4 Employment and Education (2005/06) (%) Uncompleted primary Primary Secondary Vocational Tertiary Employer Salaried employee Subsistence farmer Per-diem worker unemployed housekeeper Other Total (Source) World Bank, Poverty Assessment Volume I: Accelerating Inclusive Growth to Reduce Widespread Poverty (2007), p.20, Table Agriculture Productivity According to the WB poverty assessment (2007), the agriculture is a key economic sector for rural households, though it is not sure how large a fraction of the poor in the country lives in rural areas. As of 2004, the share of the agriculture sector accounted for 25% of the total Gross Domestic Product (GDP) and 16% of the total value of exports, and 25-35% of the total employment. However, according to the latest WB report 18, the GDP share of agriculture reduced to 12% in 2007 (Figure 3-3). Sluggish agriculture growth is partly because of the war damage such as destruction of infrastructure, machinery and livestock and loss of traditional export markets. Although the total size of cultivated land remained stable, the low productivity of agriculture hampered its growth. The low productive agriculture is associated with the small size subsistence-based farming and absence of advisory services. According to the WB Poverty Assessment, the poverty incidence of farmers is 42.6%, at the same level of total poverty incidence. However, it does not mean the income of farmers is higher than groups engaged on other sectors with high poverty incidence. As mentioned before, more than 70% of the households with remittance live in rural area. It indicates that it is difficult to earn a living only by their agricultural income. In fact, the poverty incidence of the household with remittance in rural area is low at the 20% level. It is highly possible that these households push the total poverty incidence in rural area down. Therefore, the economic growth through improvement of agricultural productivity is a key issue for poverty reduction in rural area. Land ownership can be a determinant of poverty. According to the Agriculture Household Surveys in 2004 and 2005, around 65% of farms may have less than 3 hectors. Most of smaller farmers reported that 70% of their agriculture outputs are devoted to their household needs. According to the WB poverty assessment (2007), the poverty incidence of landless was 18 World Bank, : Unlocking Growth Potential: Strategies, Policies, Actions (2010) 22
43 64% in 2005/06 while 47.8% of the land owner lived below the poverty line. The individuals without land in rural area have very high risk of poverty, while even if they have land, where productivity is low and they can run only subsistence farming, their poverty risk is also high. 3.2 Geopolitical Factors Labor Migration and Remittance There are three phases in trends of emigration from to other countries, in particular European countries, since 1990s. The first wave of emigration in 1990s 19 was caused by security reason in or former Yugoslavia. The emigrants, who were forced to move to outside of countries, were treated as refugees at that time. They themselves did not have strong intention to send money back home in. In the second phase, when the major combat operation occurred over the independence of, however, the emigrants had intention to work abroad and almost exclusively remitted. As the security situation in has been stable and European countries started to assist s development, many emigrants chose to return and/or repatriated to and regular migration became severely restricted. Now, in the third phase, a few emigrants have chance to live abroad through family reunion scheme. The number of migrants from is estimated at around 400, Approximately 71.3% of the migrants are from rural area and 28.7% from urban areas. Most of the migrants (99%) are ethnic Albanians reflecting the demographic position. Regionally, there are many migrants from Mitrovica, Prizren and Gjakove and the proportions are 20.6%, 18.1% and 17.1%, respectively (Table 3-5). Table 3-5: Migration and Remittances (2005) (%) Indicator Migrant Remittances Poverty Incidence % of population Urban/Rural Distribution Urban Rural Ethnic Area Distribution Albanian area Serb area Regional Distribution Gjakova Cjilani There was an earlier wave during the 1970s and 1980s when Kosovers from former Yugoslavia went to work abroad without the restrictions currently imposed on them, i.e. they did not need a visa at that time. 20 World Bank, Poverty Assessment Volume I: Accelerating Inclusive Growth to Reduce Widespread Poverty (2007), pp
44 Indicator Migrant Remittances Mitrovica Peja Prizreni Prishtina Ferizaji Total (Source) World Bank, Poverty Assessment Volume I: Accelerating Inclusive Growth to Reduce Widespread Poverty (2007), p.32, Table 4.4 and Appendix D, TableD.1 The impact of the remittance on poverty will be mentioned in chapter Displaced Persons and Internal Displaced Persons (IDPs) The displaced persons from live in Serbia, Montenegro and Macedonia. There are 1,722 displaced persons living in Macedonia, mainly from RAE communities. A further 11,000 displaced persons live in Montenegro. The numbers living in Serbia are disputed. According to United Nations High Commission for Refuges (UNHCR), there are around 200,000. In 1981, 10% of the population of was ethnic Serb. Now it is estimated that there are just 100,000 Serbians living in (perhaps 5% of the population) 21. The displaced persons started to return just after the end of fighting in As of the end of May 2010, 196,211 persons had returned to. More than half of the displaced persons came back from Germany (43.2%) and Switzerland (17.5%) in cumulative total. According to the survey conducted by United Nations High Commission for Refuges (UNHCR) in mid 2005, there were 19,488 IDPs within territory 22. The main problem according to the Ministry of Communities and Returns is employment. Only a small number of returnees has a job. Returnees are assisted with an assistance package, basic housing reconstruction assistance, six months of food items, basic furniture sets, a cash grant of 2,000 EUR, training in business start-up, and a job-placement scheme. However, many returnees do not trust the private sector to retain them in employment after the job subsidy comes to an end. They therefore prefer to get a job in the public sector. In some areas, returnees get their former land back, but in many areas they do not have access to their land as it is occupied by Albanians and they cannot recover their livelihoods Interview with Ministry of Communities and Returns on June 7, The figure is estimated by UNHCR. 23 Interview with Ministry of Communities and Returns on June 7,
45 Sending Country Table 3-6: Returnees by sending countries (end of May) Cumulative Total total % Albania 7, , Australia 3, , Austria 3,435 1, , Belgium 1,099 2, , Bosnia & H. 2, , Bulgaria Canada 1, , Croatia Czech R Denmark 1,278 1, , Finland France 2, , FYROM 5, , Germany 18,408 55,140 4,756 1,810 1, , Greece Hungary , Iceland Ireland , Israel Italy Japan Luxemburg Lithuania Malta Montenegro Netherlands 2, , New Zealand Norway 3,664 1,705 1, , Poland Portugal 1, , Romania Slovakia Slovenia 1, , Spain 1, , Sweden 1,555 1, , Switzerland 15,997 17, , Turkey 2, , UK 1,426 2, , Uruguay USA 2, , Total 87,156 87,416 6,989 2,621 2,530 1,694 1,485 1,383 1,274 1,068 1, , (Source) International Organization of Migration (IOM) Pristina/ : Comparative Statistics of AVR (assisted voluntary returns) Returnees by Sending Countries 3.3 Factors related to Globalization Impacts of the world recession The global recession affected a limited part of the economy and did not directly affect the poverty status in the country. The country is fairly isolated from the world economy, with low exports and limited Foreign Direct Investment (FDI), most of which was financed by the Diaspora. In addition banks are financed entirely from domestic deposits and they are not active in the international financial market so that it shows no significant effect of the recent trend in the international financial market on the banks Banks were sending money out of the country, so the Central Bank issued a new regulation that foreign banks could only remit a maximum of 50 million EUR to their mother banks in Austria and other countries. 25
46 However, the remittances to from workers abroad and emigrants are influenced by global economic crisis. Remittances to declined by 16% in 2008 over the previous year. However, there is no evidence that those workers and emigrants are forced to be deported because of the economic crisis. Emigration from is more stable from the aspects of number as well as status in the countries where they emigrated. It has a longer history from the period of the former Yugoslav state. About 80% of the emigrants in Germany and Switzerland have citizenship status Emigration was forbidden from Albania under the communist regime and migration from Albania to Greece in contrast has a temporary nature. (Interview with the Word Bank on June 7, 2010) 26
47 Chapter 4 Mechanism of Social Protection 4.1 Formal Public Social Security System At present, does not have the full range of social security schemes. There is no unemployment insurance scheme, maternity benefits scheme or family benefits scheme for children. An important feature of the social security system in is the existence of parallel institutions for the Serb minority for the provision of health services, education services and social security, financed from Belgrade Pension Target/Eligibility Scheme Responsible Organization Source of Fund Coverage First pillar: elderly over 65 Second pillar: all employed persons Third pillar no restrictions Three pillar system. First pillar is publicly managed non-contributory flat-rate scheme; second pillar is privately managed, compulsory contribution, defined benefit scheme; third pillar is supplementary voluntary scheme. First Pillar - Supervising: Ministry of Labor and Social Welfare; Implementing Agency: Department of Pension Administration, Ministry of Labor and Social Welfare Second Pillar - Supervising Tax Administration; Implementing: Savings Pension Trust Third Pillar - Supervising: Central Bank of the Republic of ; Implementing: Enterprises First Pillar: Government budget Second Pillar: Contributions on wages and salaries Third Pillar: Voluntary contributions All people aged over 65 receive the basic flat rate state pension; the second pillar covers 58% of the working population For the distribution of the basic state pensions by income group, and by region (rural/ urban), see table 4.3 below. Pension reform was the subject of the first law approved by the first post-war Kosovan parliament that was elected in July Although has a favorable ratio between the working age population and pensioners, there is an unfavorable ratio between pension contributors and pensioners because of the high rate of unemployment estimated at about 50%. Although the share of those older than 65 years in the overall population is relatively low at 6%, future demographic change will place increased pressure on the pension system. The WB and United States Agency for International Development (USAID) have assisted the provisional government in setting up a three pillar pension system. First Pillar The first pillar is a publicly-managed non-contributory scheme. It provides a flat rate pension of 40 EUR to all citizens resident in aged over 65, equivalent to 16% of the average monthly wage, financed out of the government budget. This basic pension scheme is administered by the Pension Administration, which is under the authority of the Ministry of 26 Regulation 2001/35 On the Pension System in provides the basic legislative framework of the current pension system in. This regulation was amended in 2005 by Regulation 2005/20. 27
48 Labor and Social Welfare. In December 2008, a total of 138,847 persons or 6.4 per cent of the population received this benefit. Table 4-1: Pensioners receiving basic state pension Indicator Number of pensioners 127, , ,847 Pensioners/population Budget transfer (% GDP) (Source) International Labour Organization (ILO), Profile of the Social Security System in (within the meaning of United Nations Security Council (UNSC) Resolution 1244 [1999]) (2010), p. 23, Table 8 The basic pension has not been indexed and remains the same since 2004, and consequently the real value has fallen from 32% of GDP per capita in 2006 to 29% of GDP per capita in Table 4-2: Amount of Basic Pension and Expenditure Indicator Basic pension (EUR/year) GDP per capita (EUR/year) 1,520 1,612 1,674 Pension/GDP per capita 32% 30% 29% (Source) ILO Profile of the Social Security System in (within the meaning of UNSC Resolution 1244 [1999]) (2010), p. 22, Table 7 A basic invalidity pension of 45 EUR per month is paid to totally disabled people between 18 and 64 years of age, who do not receive a veteran s pension or social assistance benefits. In April 2009, 0.9% of the population received this benefit. An additional pension scheme (the Favourable Pension Insurance Scheme ) was introduced in 2008 which provides an additional 35 EUR per month for those over 65 years of age who can prove that they had been pensioners or paid contributions for at least 15 years under the former Yugoslav system. It is estimated that nearly 20% of all old-age pensioners were in receipt of this pension in January A further additional pension scheme for members of the Protection Corps (TMK) was introduced in January 2009, funded by transfers from the general budget of. The eligibility conditions for receiving benefits are: (i) reaching 50 years of age (early retirement from 45 years of age), (ii) at least five years service in the TMK and (iii) being an active member of the TMK when the TMK dissolution law came into force. The pension is 70% of the average net wage over the previous three years (the early retirement pension is 50%). Following the death of a pensioner, survivor s pensions are 60% of the pension amount for spouses and 20% for children. In April 2009, the average monthly benefit was 168 EUR. In 2004, a provisional scheme was introduced for the workers who had been laid off from the Trepça mining complex at the end of the war in Recipients must be (i) aged 27 The Trepca mining complex was once the largest company in and was one of the largest producers of lead and zinc in former Yugoslavia. Its physical assets are located in northern, some in the Serb inhabited northern Mitrovica area, and some in the Albanian inhabited southern Mitrovica area. At its peak in 1998 it employed about 23,000 workers, but by 1995 employment had fallen to 7,000, and is today just 2,500. The company is under state ownership, but the ownership is disputed by Serbia which claims ownership over the company. A large investment would be needed to restore the mine which has the potential to support employment and the local economy in Mitrovica. 28
49 between 50 and 65 years, (ii) have worked for the enterprise for 10 years or more, (iii) not currently employed or self-employed and (iv) not receiving other social assistance. The benefit amount is 80 EUR per month, and is co-financed by the general budget (50 EUR) and by enterprises (30 EUR). Benefit ceases when the recipient reaches 65 years of age. In April 2009, around 4,100 persons received benefits from the scheme. Second Pillar The second pillar of the pension system was introduced in August 2002 for public sector employees and workers in socially-owned enterprises, and was extended to all workers in As a fully funded system, the savings in individual accounts are invested. 28 Currently there are 291,000 active members, of which 13,700 are of Serbian ethnicity, the majority being Albanian. Workers individual pension accounts are administered by the Pension Saving Trust (KPST) 29. There has been an annual increase of 12% in the inflow of contributions, partly due to improved tax administration. Tax rates have fallen, and so many firms have been attracted into the formal economy from the informal sector, leading to an increase in contribution payments. The second pillar is a defined-contribution scheme which is fully funded through a 5% payroll contribution on gross wages of employees, and a 5% contribution from employers. The replacement rate on full contributions over a 40 year payment history is expected to be about 80%, assuming a 4% return on investment. An employee on average wages would contribute about 20 EUR per month. This is not enough to guarantee a satisfactory pension, significantly above the basic state pension of 40 EUR per month. Employees may opt to increase their contribution to 15%. The collection of contributions is carried out by the Tax Administration through the banking system and the scheme therefore has low management costs. Public sector employees make regular contributions, but the contributions from the private sector are not always paid and in 2009 about 16,000 people stopped contributing to the scheme. Private sector employers sometimes declare only the minimum wage in order to reduce their contributions, a practice which will adversely affect future pensions of their employees. Self-employed persons can also contribute to the scheme, paying 7.80 EUR per month. The second pillar pension scheme is not comprehensive, and various social groups are under-represented. Women are under-represented in the second pillar pension scheme, as only 28% of the contributors are female 30. Relatively few migrant workers contribute to the second pillar pension scheme, as they usually have better pension options in the countries where they work. Serbian employees working in parallel Serbian government institutions in the ethnic enclaves in, such as local administrations, schools, and hospitals, are paid from the Serbian government budget, and are therefore not members of the second pillar pension scheme 31. Since there is a large informal economy, many workers whose employers are not 28 The collection of contributions started on August 2002 and all the funds have been invested abroad since March Opened in August 2002 for employees of government, state and socially-owned enterprises, this was become mandatory for all workers in The Border of Governing the Pension Saving Trust has 7 members, 4 professionals, 1 representative of the Employers, (Chamber of Commerce), 1 representative of the Employees, (Union of the Independent Trade Unions), and 1 from United Nations Interim Administration Mission in (UNMIK). 30 A higher proportion among the under 30 years old (33%) 31 This scheme was established in 2003, and pays salaries that are 50% higher than salaries for equivalent work in Serbia. For example a teacher in a Serbian school in may receive about 600 EUR per month, compared to a teacher s salary of about 400 EUR per month in Serbia. The bonus scheme covers 45,000 Serbian employees of the Serbian parallel institutions in the ethnic enclaves and in northern, a region that is de facto autonomous and administered from Serbia. The Serbian government pays 26 billion dinars per annum for these salaries (252 million EUR). These employees will receive their pensions from the Serbian pension system. 29

50 registered with the Tax Administration (TA), or who are not declared to the TA, do not belong to the scheme. It is estimated that in 2006, only 21% of the working age population or 58% of the labor force population, excluding non-economically active population such as students and the retired persons, belonged to the Second Pillar scheme. The KPST manages to ensure that management fees are very low. There is a 0.8% annual management fee 32, and there are no entry charges, which are paid by the government. The assets of the pension fund are mainly held abroad in mutual investment funds managed by a number of foreign banks 33. In 2010 for the first time the Board of KPST invested 10 million EUR in the NKB bank within. By mid-year 2009 the total amount invested had reached 345 EUR million, equivalent to 1,206 EUR per person. The value of the Fund has fallen due to the global financial crisis impact on share prices. About 10% of the Fund is invested in banks in in savings accounts. As soon as the government issues its own securities (T-bills) the Fund will invest in those in order to diversify its assets. Due to the global financial crisis the share price of the investments held abroad dropped sharply, losing all their gains since the opening of the Fund, so that the effective rate of return on contributions since the inception of the was zero per cent. In 2008 the KPST made a paper loss of 92 million EUR compared to an inflow of new contributions of 71 million EUR. (Source) KPST website ( trusti.org/ as of September 2010) Figure 4-1: KPST Share Price since Inception Third Pillar The third pillar consists of six small occupational schemes based on the contributions of individuals and employers to provide their employees with an individual supplementary pension. They are licensed and supervised by the Central Bank of the Republic of. (1) Coverage by group, by geographical region The coverage of the population by pensions is relatively low owing to the youthful demography of the country. In 2005/6 just 6.4% of the population was a pensioner, with an even 32 The asset management fee was reduced from 1% to 0.9% in 2008, and further to 0.8% in January These are the ABN-AMRO bank and the Vanguard investment fund. The funds are invested in money market funds based in Brussels including Vanguard Global Stock Index Fund managed by Vanguard Investments, and into actively managed fixed income funds managed by Schroders and ECM and some other companies. 30
Poverty in the Third World
 11. World Poverty Poverty in the Third World Human Poverty Index Poverty and Economic Growth Free Market and the Growth Foreign Aid Millennium Development Goals Poverty in the Third World Subsistence definitions
Poverty and Shared Prosperity in Moldova: Progress and Prospects. June 16, 2016
 Poverty and Shared Prosperity in Moldova: Progress and Prospects June 16, 2016 Overview Moldova experienced rapid economic growth, accompanied by significant progress in poverty reduction and shared prosperity.
The Trends of Income Inequality and Poverty and a Profile of
 http://www.info.tdri.or.th/library/quarterly/text/d90_3.htm Page 1 of 6 Published in TDRI Quarterly Review Vol. 5 No. 4 December 1990, pp. 14-19 Editor: Nancy Conklin The Trends of Income Inequality and
II. Roma Poverty and Welfare in Serbia and Montenegro
 II. Poverty and Welfare in Serbia and Montenegro 10. Poverty has many dimensions including income poverty and non-income poverty, with non-income poverty affecting for example an individual s education,
Mr. Ali Ahmadov Deputy Prime Minister of the Republic of Azerbaijan, Chairman of the National Coordination Council for Sustainable Development
 Mr. Ali Ahmadov Deputy Prime Minister of the Republic of Azerbaijan, Chairman of the National Coordination Council for Sustainable Development 2 Azerbaijan joined the Millennium Declaration in 2000. To
MEDIUM-TERM REPORT. Government of Montenegro ON MILLENNIUM DEVELOPMENT GOALS IN MONTENEGRO
 MEDIUM-TERM REPORT Government of Montenegro ON MILLENNIUM DEVELOPMENT GOALS IN MONTENEGRO 1 Medium-term report on millennium development goals in Montenegro Introductory notes from the Ministry of Foreign
Overview of standards for data disaggregation
 Read me first: Overview of for data disaggregation This document gives an overview of possible and existing, thoughts and ideas on data disaggregation, as well as questions arising during the work on this
OIC/COMCEC/32-16/D(39) CCO BRIEF ON POVERTY ALLEVIATION
 CCO BRIEF ON POVERTY ALLEVIATION") OIC/COMCEC-FC/32-16/D(5) POVERTY OIC/COMCEC/32-16/D(39) CCO BRIEF ON POVERTY ALLEVIATION COMCEC COORDINATION OFFICE November 2016 CCO BRIEF ON POVERTY ALLEVIATION Poverty is defined as the lack of sufficient
OIC/COMCEC-FC/32-16/D(5) POVERTY OIC/COMCEC/32-16/D(39) CCO BRIEF ON POVERTY ALLEVIATION COMCEC COORDINATION OFFICE November 2016 CCO BRIEF ON POVERTY ALLEVIATION Poverty is defined as the lack of sufficient
Halve, between 1990 and 2015, the proportion of people whose income is less than $1 a day
 6 GOAL 1 THE POVERTY GOAL Goal 1 Target 1 Indicators Target 2 Indicators Eradicate extreme poverty and hunger Halve, between 1990 and 2015, the proportion of people whose income is less than $1 a day Proportion
THE LABOR MARKET IN KOSOVO AND NEIGHBOURING COUNTRIES
 International Journal of Economics, Commerce and Management United Kingdom Vol. III, Issue 12, December 2015 http://ijecm.co.uk/ ISSN 2348 0386 THE LABOR MARKET IN KOSOVO AND NEIGHBOURING COUNTRIES Artan
evsjv `k cwimsl vb ey iv BANGLADESH BUREAU OF STATISTICS Statistics Division, Ministry of Planning
 PRELIMINARY REPORT ON HOUSEHOLD INCOME & EXPENDITURE SURVEY-2010 June, 2011 evsjv `k cwimsl vb ey iv BANGLADESH BUREAU OF STATISTICS Statistics Division, Ministry of Planning Household Income and Expenditure
Poverty Profile. Executive Summary. Kingdom of Thailand
 Poverty Profile Executive Summary Kingdom of Thailand February 2001 Japan Bank for International Cooperation Chapter 1 Poverty in Thailand 1-1 Poverty Line The definition of poverty and methods for calculating
Albania. HDI values and rank changes in the 2013 Human Development Report
 Human Development Report 2013 The Rise of the South: Human Progress in a Diverse World Explanatory note on 2013 HDR composite indices Albania HDI values and rank changes in the 2013 Human Development Report
GLOBALIZATION, DEVELOPMENT AND POVERTY REDUCTION: THEIR SOCIAL AND GENDER DIMENSIONS
 TALKING POINTS FOR THE EXECUTIVE SECRETARY ROUNDTABLE 1: GLOBALIZATION, DEVELOPMENT AND POVERTY REDUCTION: THEIR SOCIAL AND GENDER DIMENSIONS Distinguished delegates, Ladies and gentlemen: I am pleased
ANNEX 1: Human Development Indicators for Bosnia & Herzegovina. Prepared by Maida Fetahagić
 ANNEX 1: Human Development Indicators for Bosnia & Herzegovina Prepared by Maida Fetahagić Sarajevo, April 2013 1 TABLE OF CONTENTS 1 Introduction... 2 2 Improving the measurement of Human Development...
Explanatory note on the 2014 Human Development Report composite indices. Belarus. HDI values and rank changes in the 2014 Human Development Report
 Human Development Report 2014 Sustaining Human Progress: Reducing Vulnerabilities and Building Resilience Explanatory note on the 2014 Human Development Report composite indices Belarus HDI values and
Poverty profile and social protection strategy for the mountainous regions of Western Nepal
 October 2014 Karnali Employment Programme Technical Assistance Poverty profile and social protection strategy for the mountainous regions of Western Nepal Policy Note Introduction This policy note presents
Case Study on Youth Issues: Philippines
 Case Study on Youth Issues: Philippines Introduction The Philippines has one of the largest populations of the ASEAN member states, with 105 million inhabitants, surpassed only by Indonesia. It also has
Kosovo Poverty Assessment
 Report No. 39737-XK Kosovo Poverty Assessment Volume I: Accelerating Inclusive Growth to Reduce Widespread Poverty October 3, 2007 Poverty Reduction and Economic Management Unit Europe and Central Asia
Inclusion and Gender Equality in China
 Inclusion and Gender Equality in China 12 June 2017 Disclaimer: The views expressed in this publication are those of the authors and do not necessarily reflect the views and policies of the Asian Development
Chapter 2 Overview of Sudanese Economy and the Status of ICT in Sudan
 Chapter 2 Overview of Sudanese Economy and the Status of ICT in Sudan 2.1 Introduction This chapter provides a general overview of the socio-economic characteristics of the Sudanese economy and explains
Sri Lanka. Country coverage and the methodology of the Statistical Annex of the 2015 HDR
 Human Development Report 2015 Work for human development Briefing note for countries on the 2015 Human Development Report Sri Lanka Introduction The 2015 Human Development Report (HDR) Work for Human Development
Economic and Social Council
 United Nations Economic and Social Council Distr.: General 27 December 2001 E/CN.3/2002/27 Original: English Statistical Commission Thirty-third session 5-8 March 2002 Item 7 (f) of the provisional agenda*
Gender in the South Caucasus: A Snapshot of Key Issues and Indicators 1
 Public Disclosure Authorized Public Disclosure Authorized Gender in the South Caucasus: A Snapshot of Key Issues and Indicators 1 Armenia, Azerbaijan and Georgia have made progress in many gender-related
IMPROVING THE QUALITY OF DATA USED FOR INDICATORS FOR THE MILLENNIUM DEVELOPMENT GOALS AND TARGETS
 Committee for the Coordination of Statistical Activities SA/2003/17 Second session 2 September 2003 Geneva, 8-10 September 2003 Item 10(e) of the Provisional Agenda IMPROVING THE QUALITY OF DATA USED FOR
Decent Work Indicators in the SDGs Global Indicator Framework. ILO Department of Statistics & ILO Regional Office for Asia and the Pacific
 Decent Work Indicators in the SDGs Global Indicator Framework ILO Department of Statistics & ILO Regional Office for Asia and the Pacific Content Introduction Monitoring and reporting Decent Work Agenda
IMPACT OF GLOBALIZATION ON POVERTY: CASE STUDY OF PAKISTAN
 Romain Pison Prof. Kamal NYU 03/20/06 NYU-G-RP-A1 IMPACT OF GLOBALIZATION ON POVERTY: CASE STUDY OF PAKISTAN INTRODUCTION The purpose of this paper is to examine the effect of globalization in Pakistan
Spatial Inequality in Cameroon during the Period
 AERC COLLABORATIVE RESEARCH ON GROWTH AND POVERTY REDUCTION Spatial Inequality in Cameroon during the 1996-2007 Period POLICY BRIEF English Version April, 2012 Samuel Fambon Isaac Tamba FSEG University
Volume 36, Issue 1. Impact of remittances on poverty: an analysis of data from a set of developing countries
 Volume 6, Issue 1 Impact of remittances on poverty: an analysis of data from a set of developing countries Basanta K Pradhan Institute of Economic Growth, Delhi Malvika Mahesh Institute of Economic Growth,
DECENT WORK COUNTRY DIAGNOSTICS TECHNICAL GUIDELINES TO DRAFT THE DIAGNOSTIC REPORT
 DECENT WORK COUNTRY DIAGNOSTICS TECHNICAL GUIDELINES TO DRAFT THE DIAGNOSTIC REPORT Prepared by: Country Diagnosis Tool Team July, 2015 Table of Contents OBJECTIVE AND STRUCTURE... 1 Scope and objective...
Explanatory note on the 2014 Human Development Report composite indices. Serbia. HDI values and rank changes in the 2014 Human Development Report
 Human Development Report 2014 Sustaining Human Progress: Reducing Vulnerabilities and Building Resilience Explanatory note on the 2014 Human Development Report composite indices Serbia HDI values and rank
Chapter 1 Overview of Poverty
 Chapter 1 Overview of Poverty Chapter 1 Overview of Poverty 1-1 Actual Situation of Poverty and Importance of Poverty is still a major issue and inequality still remains. There is a strong relationship
Measures of Poverty. Foster-Greer-Thorbecke(FGT) index Example: Consider an 8-person economy with the following income distribution
 index Example: Consider an 8-person economy with the following income distribution") Foster-Greer-Thorbecke(FGT) index Example: Consider an 8-person economy with the following income distribution Individuals Income 1 0.6 2 0.6 3 0.8 4 0.8 5 2 6 2 7 6 8 6 Poverty line= 1 Recall that Headcount
Foster-Greer-Thorbecke(FGT) index Example: Consider an 8-person economy with the following income distribution Individuals Income 1 0.6 2 0.6 3 0.8 4 0.8 5 2 6 2 7 6 8 6 Poverty line= 1 Recall that Headcount
Ghana Lower-middle income Sub-Saharan Africa (developing only) Source: World Development Indicators (WDI) database.
 Source: World Development Indicators (WDI) database.") Knowledge for Development Ghana in Brief October 215 Poverty and Equity Global Practice Overview Poverty Reduction in Ghana Progress and Challenges A tale of success Ghana has posted a strong growth performance
Knowledge for Development Ghana in Brief October 215 Poverty and Equity Global Practice Overview Poverty Reduction in Ghana Progress and Challenges A tale of success Ghana has posted a strong growth performance
Social Dimension S o ci al D im en si o n 141
 Social Dimension Social Dimension 141 142 5 th Pillar: Social Justice Fifth Pillar: Social Justice Overview of Current Situation In the framework of the Sustainable Development Strategy: Egypt 2030, social
How s Life in Hungary?
 How s Life in Hungary? November 2017 Relative to other OECD countries, Hungary has a mixed performance across the different well-being dimensions. It has one of the lowest levels of household net adjusted
Human Development Indices and Indicators: 2018 Statistical Update. Cambodia
 Human Development Indices and Indicators: 2018 Statistical Update Briefing note for countries on the 2018 Statistical Update Introduction Cambodia This briefing note is organized into ten sections. The
Human Development Indices and Indicators: 2018 Statistical Update. Indonesia
 Human Development Indices and Indicators: 2018 Statistical Update Briefing note for countries on the 2018 Statistical Update Introduction Indonesia This briefing note is organized into ten sections. The
24 indicators that are relevant for disaggregation Session VI: Which indicators to disaggregate by migratory status: A proposal
 SDG targets and indicators relevant to migration 10 indicators that are migration-related Session V: Brief presentations by custodian agencies 24 indicators that are relevant for disaggregation Session
Human Development Indices and Indicators: 2018 Statistical Update. Pakistan
 Human Development Indices and Indicators: 2018 Statistical Update Briefing note for countries on the 2018 Statistical Update Introduction Pakistan This briefing note is organized into ten sections. The
Lao People's Democratic Republic
 Human Development Report 2014 Sustaining Human Progress: Reducing Vulnerabilities and Building Resilience Explanatory note on the 2014 Human Development Report composite indices Democratic Republic HDI
vi. rising InequalIty with high growth and falling Poverty
 43 vi. rising InequalIty with high growth and falling Poverty Inequality is on the rise in several countries in East Asia, most notably in China. The good news is that poverty declined rapidly at the same
Japan s average level of current well-being: Comparative strengths and weaknesses
 How s Life in Japan? November 2017 Relative to other OECD countries, Japan s average performance across the different well-being dimensions is mixed. At 74%, the employment rate is well above the OECD
Trends in Poverty and Inequality in Decentralising Indonesia
 Trends in Poverty and Inequality in Decentralising Indonesia Riyana Miranti, Yogi Vidyattama, Erick Hansnata, Rebecca Cassells and Alan Duncan NATSEM, University of Canberra Presentation to the Working
Explanatory note on the 2014 Human Development Report composite indices. Cambodia. HDI values and rank changes in the 2014 Human Development Report
 Human Development Report 2014 Sustaining Human Progress: Reducing Vulnerabilities and Building Resilience Explanatory note on the 2014 Human Development Report composite indices Cambodia HDI values and
The Demographic Profile of Somalia
 UNITED NATIONS The Demographic Profile of Somalia Population Trends - Mortality - Fertility - Age Structure - Urbanization - International Migration - Education and Youth Unemployment Population Trends
ARMENIA COMPREHENSIVE FOOD SECURITY, VULNERABILITY ANALYSIS (CFSVA) UPDATE 2017
 UPDATE 2017") ARMENIA COMPREHENSIVE FOOD SECURITY, VULNERABILITY ANALYSIS (CFSVA) UPDATE 2017 SOCIO-ECONOMIC TRENDS The Armenia Comprehensive Food Security, Vulnerability Analysis (CFSVA) Update presents the current
ARMENIA COMPREHENSIVE FOOD SECURITY, VULNERABILITY ANALYSIS (CFSVA) UPDATE 2017 SOCIO-ECONOMIC TRENDS The Armenia Comprehensive Food Security, Vulnerability Analysis (CFSVA) Update presents the current
Contents. List of Figures List of Maps List of Tables List of Contributors. 1. Introduction 1 Gillette H. Hall and Harry Anthony Patrinos
 Contents List of Figures List of Maps List of Tables List of Contributors page vii ix x xv 1. Introduction 1 Gillette H. Hall and Harry Anthony Patrinos 2. Indigenous Peoples and Development Goals: A Global
How s Life in Belgium?
 How s Life in Belgium? November 2017 Relative to other countries, Belgium performs above or close to the OECD average across the different wellbeing dimensions. Household net adjusted disposable income
Rural and Urban Migrants in India:
 Rural and Urban Migrants in India: 1983 2008 Viktoria Hnatkovska and Amartya Lahiri This paper characterizes the gross and net migration flows between rural and urban areas in India during the period 1983
The former Yugoslav Republic of Macedonia
 Human Development Report 2014 Sustaining Human Progress: Reducing Vulnerabilities and Building Resilience Explanatory note on the 2014 Human Development Report composite indices The former Yugoslav HDI
Executive Summary. The Path to Gender Equality
 Vietnam: Country Gender Assessment Executive Summary Over the last few decades, Vietnam has made striking progress in improving people s well-being and reducing gender disparities. Vietnam now ranks 109th
% of Total Population
 12 2. SOCIO-ECONOMIC ANALYSIS 2.1 POPULATION The Water Services Development Plan: Demographic Report (October December 2000, WSDP) provides a detailed breakdown of population per settlement area for the
Poverty, Livelihoods, and Access to Basic Services in Ghana
 Poverty, Livelihoods, and Access to Basic Services in Ghana Joint presentation on Shared Growth in Ghana (Part II) by Zeljko Bogetic and Quentin Wodon Presentation based on a paper by Harold Coulombe and
Venezuela (Bolivarian Republic of)
") Human Development Report 2013 The Rise of the South: Human Progress in a Diverse World Explanatory note on 2013 HDR composite indices Venezuela (Bolivarian HDI values and rank changes in the 2013 Human
Human Development Report 2013 The Rise of the South: Human Progress in a Diverse World Explanatory note on 2013 HDR composite indices Venezuela (Bolivarian HDI values and rank changes in the 2013 Human
Human Development Indices and Indicators: 2018 Statistical Update. Eritrea
 Human Development Indices and Indicators: 2018 Statistical Update Briefing note for countries on the 2018 Statistical Update Introduction Eritrea This briefing note is organized into ten sections. The
Explanatory note on the 2014 Human Development Report composite indices. Solomon Islands
 Human Development Report 2014 Sustaining Human Progress: Reducing Vulnerabilities and Building Resilience Explanatory note on the 2014 Human Development Report composite indices Solomon Islands HDI values
Conference on What Africa Can Do Now To Accelerate Youth Employment. Organized by
 Conference on What Africa Can Do Now To Accelerate Youth Employment Organized by The Olusegun Obasanjo Foundation (OOF) and The African Union Commission (AUC) (Addis Ababa, 29 January 2014) Presentation
Laos: Ethno-linguistic Diversity and Disadvantage
 Laos: Ethno-linguistic Diversity and Disadvantage Elizabeth M. King Dominique van de Walle World Bank December 2010 1 The Lao People s Democratic Laos is one of the poorest countries in Southeast Asia
The Demographic Profile of the State of Palestine
 UNITED NATIONS The Demographic Profile of the State of Palestine Population Trends - Mortality - Fertility - Age Structure - Urbanization - International Migration - Education and Youth Unemployment Population
Executive summary. Part I. Major trends in wages
 Executive summary Part I. Major trends in wages Lowest wage growth globally in 2017 since 2008 Global wage growth in 2017 was not only lower than in 2016, but fell to its lowest growth rate since 2008,
Human development in China. Dr Zhao Baige
 Human development in China Dr Zhao Baige 19 Environment Twenty years ago I began my academic life as a researcher in Cambridge, and it is as an academic that I shall describe the progress China has made
Government of the Republic of Macedonia REPORT. of the Republic of Macedonia on Millennium Development Goals
 Government of the Republic of Macedonia REPORT of the Republic of Macedonia on Millennium Development Goals June 2005 Foreword This document is a report of The Republic of Macedonia elaborating the achievement
How s Life in Austria?
 How s Life in Austria? November 2017 Austria performs close to the OECD average in many well-being dimensions, and exceeds it in several cases. For example, in 2015, household net adjusted disposable income
Poverty and Inequality Changes in Turkey ( )
") State Planning Organization of the Republic of Turkey and World Bank Welfare and Social Policy Analytical Work Program Working Paper Number 1: Poverty and Inequality Changes in Turkey (2003-2006) Meltem
State Planning Organization of the Republic of Turkey and World Bank Welfare and Social Policy Analytical Work Program Working Paper Number 1: Poverty and Inequality Changes in Turkey (2003-2006) Meltem
SOUTH-EASTERN EUROPE. IDP children are delighted with a Lego donation to their class in Zemun Polje, on the outskirts of Belgrade, Serbia (2012) UNHCR
 UNHCR") SOUTH-EASTERN EUROPE Bosnia and Herzegovina Croatia Montenegro Serbia (and Kosovo: Security Council Resolution 1244 (1999)) The former Yugoslav Republic of Macedonia IDP children are delighted with a Lego
SOUTH-EASTERN EUROPE Bosnia and Herzegovina Croatia Montenegro Serbia (and Kosovo: Security Council Resolution 1244 (1999)) The former Yugoslav Republic of Macedonia IDP children are delighted with a Lego
Number of Countries with Data
 By Hafiz A. Pasha WHAT IS THE EXTENT OF SOUTH ASIA S PROGRESS ON THE MDGs? WHAT FACTORS HAVE DETERMINED THE RATE OF PROGRESS? WHAT HAS BEEN THE EXTENT OF INCLUSIVE GROWTH IN SOUTH ASIA? WHAT SHOULD BE
Roma poverty from a human development perspective
 Roma poverty from a human development perspective Andrey Ivanov, 1 Justin Kagin 2 Summary: The most recent publication in UNDP s Roma Inclusion Working Papers series builds on the collective work of many
Under-five chronic malnutrition rate is critical (43%) and acute malnutrition rate is high (9%) with some areas above the critical thresholds.
 and acute malnutrition rate is high (9%) with some areas above the critical thresholds.") May 2014 Fighting Hunger Worldwide Democratic Republic of Congo: is economic recovery benefiting the vulnerable? Special Focus DRC DRC Economic growth has been moderately high in DRC over the last decade,
May 2014 Fighting Hunger Worldwide Democratic Republic of Congo: is economic recovery benefiting the vulnerable? Special Focus DRC DRC Economic growth has been moderately high in DRC over the last decade,
Poverty Data Disaggregation: Experiences and Suggestions of China. Wang Pingping Department of Household Surveys of National Bureau of China (NBS)
") Poverty Data Disaggregation: Experiences and Suggestions of China Wang Pingping Department of Household Surveys of National Bureau of China (NBS) Disaggregated poverty data is important for most of the
Poverty Data Disaggregation: Experiences and Suggestions of China Wang Pingping Department of Household Surveys of National Bureau of China (NBS) Disaggregated poverty data is important for most of the
Contemporary Human Geography
 Chapter 9 Lecture Contemporary Human Geography rd 3 Edition Chapter 9: Development Marc Healy Elgin Community College 9.1 Development Regions A developed country, also known as a More Developed Country
Global Employment Trends for Women
 December 12 Global Employment Trends for Women Executive summary International Labour Organization Geneva Global Employment Trends for Women 2012 Executive summary 1 Executive summary An analysis of five
PENNSILVANIA STATE UNIVERSITY. How the IMF and the World Bank Dealt with the Issue of Poverty in Bangladesh from 2000 to 2010?
 Poverty in Bangladesh i PENNSILVANIA STATE UNIVERSITY How the IMF and the World Bank Dealt with the Issue of Poverty in Bangladesh from 2000 to 2010? Sarp Yanki Kalfa PLSC 440 Doctor Blackmon April 25,
Developing a Regional Core Set of Gender Statistics and Indicators in Asia and the Pacific
 Developing a Regional Core Set of Gender Statistics and Indicators in Asia and the Pacific Preparatory Survey Questionnaire REGIONAL CONSULTATIVE WORKSHOP TO DEVELOP A FRAMEWORK AND CORE SET OF GENDER
How s Life in Ireland?
 How s Life in Ireland? November 2017 Relative to other OECD countries, Ireland s performance across the different well-being dimensions is mixed. While Ireland s average household net adjusted disposable
Spain s average level of current well-being: Comparative strengths and weaknesses
 How s Life in Spain? November 2017 Relative to other OECD countries, Spain s average performance across the different well-being dimensions is mixed. Despite a comparatively low average household net adjusted
SUMMARY ANALYSIS OF KEY INDICATORS
 SUMMARY ANALYSIS OF KEY INDICATORS from the FSM 2010 Census of Population and Housing DIVISION OF STATISTICS FSM Office of Statistics, Budget, Overseas Development Assistance and Compact Management (S.B.O.C)
How s Life in the United Kingdom?
 How s Life in the United Kingdom? November 2017 On average, the United Kingdom performs well across a number of well-being indicators relative to other OECD countries. At 74% in 2016, the employment rate
The Demographic Profile of Qatar
 UNITED NATIONS The Demographic Profile of Qatar Population Trends - Mortality - Fertility - Age Structure - Urbanization - International Migration - Education and Youth Unemployment Population Trends Population
Hungary. HDI values and rank changes in the 2013 Human Development Report
 Human Development Report 2013 The Rise of the South: Human Progress in a Diverse World Explanatory note on 2013 HDR composite indices Hungary HDI values and rank changes in the 2013 Human Development Report
Explanatory note on the 2014 Human Development Report composite indices. Armenia. HDI values and rank changes in the 2014 Human Development Report
 Human Development Report 2014 Sustaining Human Progress: Reducing Vulnerabilities and Building Resilience Explanatory note on the 2014 Human Development Report composite indices Armenia HDI values and
The Demographic Profile of Kuwait
 UNITED NATIONS The Demographic Profile of Kuwait Population Trends - Mortality - Fertility - Age Structure - Urbanization - International Migration - Education and Youth Unemployment Population Trends
Reducing Poverty in the Arab World Successes and Limits of the Moroccan. Lahcen Achy. Beirut, Lebanon July 29, 2010
 Reducing Poverty in the Arab World Successes and Limits of the Moroccan Experience Lahcen Achy Beirut, Lebanon July 29, 2010 Starting point Morocco recorded an impressive decline in monetary poverty over
Measuring Social Inclusion
 Measuring Social Inclusion Measuring Social Inclusion Social inclusion is a complex and multidimensional concept that cannot be measured directly. To represent the state of social inclusion in European
Venezuela (Bolivarian Republic of)
") Human Development Report 2014 Sustaining Human Progress: Reducing Vulnerabilities and Building Resilience Explanatory note on the 2014 Human Development Report composite indices Venezuela (Bolivarian HDI
Human Development Report 2014 Sustaining Human Progress: Reducing Vulnerabilities and Building Resilience Explanatory note on the 2014 Human Development Report composite indices Venezuela (Bolivarian HDI
Hong Kong, China (SAR)
") Human Development Report 2014 Sustaining Human Progress: Reducing Vulnerabilities and Building Resilience Explanatory note on the 2014 Human Development Report composite indices Hong Kong, China (SAR)
Human Development Report 2014 Sustaining Human Progress: Reducing Vulnerabilities and Building Resilience Explanatory note on the 2014 Human Development Report composite indices Hong Kong, China (SAR)
Rural and Urban Migrants in India:
 Rural and Urban Migrants in India: 1983-2008 Viktoria Hnatkovska and Amartya Lahiri July 2014 Abstract This paper characterizes the gross and net migration flows between rural and urban areas in India
The Demographic Profile of Oman
 UNITED NATIONS The Demographic Profile of Oman Population Trends - Mortality - Fertility - Age Structure - Urbanization - International Migration - Education and Youth Unemployment Population Trends Population
Serbia. Working environment. The context. The needs. Serbia
 Working environment The context The Republic of hosts the largest number of refugees and internally displaced persons (IDPs) in the region. In 2007, repatriation to Croatia slowed, in part because of a
Explanatory note on the 2014 Human Development Report composite indices. Dominican Republic
 Human Development Report 2014 Sustaining Human Progress: Reducing Vulnerabilities and Building Resilience Explanatory note on the 2014 Human Development Report composite indices Dominican Republic HDI
How s Life in Portugal?
 How s Life in Portugal? November 2017 Relative to other OECD countries, Portugal has a mixed performance across the different well-being dimensions. For example, it is in the bottom third of the OECD in
Bosnia and Herzegovina
 Bosnia and Herzegovina Operational highlights The adoption by the Parliament of Bosnia and Herzegovina (BiH) of the Revised Strategy for the Implementation of Annex VII of the Dayton Peace Agreement was
Youth labour market overview
 1 Youth labour market overview With 1.35 billion people, China has the largest population in the world and a total working age population of 937 million. For historical and political reasons, full employment
Youth labour market overview
 0 Youth labour market overview Turkey is undergoing a demographic transition. Its population comprises 74 million people and is expected to keep growing until 2050 and begin ageing in 2025 i. The share
The Demographic Profile of Saudi Arabia
 Infant mortality rate (per 1 live births) UNITED NATIONS The Demographic Profile of Saudi Arabia Population Trends - Mortality - Fertility - Age Structure - Urbanization - International Migration - Education
Lecture 1. Introduction
 Lecture 1 Introduction In this course, we will study the most important and complex economic issue: the economic transformation of developing countries into developed countries. Most of the countries in
Role of Cooperatives in Poverty Reduction. Shankar Sharma National Cooperatives Workshop January 5, 2017
 Role of Cooperatives in Poverty Reduction Shankar Sharma National Cooperatives Workshop January 5, 2017 Definition Nepal uses an absolute poverty line, based on the food expenditure needed to fulfil a
Monitoring Country Progress in Pakistan
 Monitoring Country Progress in Pakistan Program Office OAPA & USAID/Pakistan U.S. Agency for International Development Pakistan Institute for Development Economics September, 21 st, 211 Economic Reforms
United Nations Development Assistance Framework
 United Nations SRI LANKA United Nations Development Assistance Framework UN Photo / Evan Schneider UN / Neomi UN Photo / Martine Perret UNICEF UNITED NATIONS IN SRI LANKA Working together for greater impact
The Demographic Profile of the United Arab Emirates
 UNITED NATIONS The Demographic Profile of the United Arab Emirates Population Trends - Mortality - Fertility - Age Structure - Urbanization - International Migration - Education and Youth Unemployment