Policy Performance and Governance Capacities in the OECD and EU
|
|
|
- Edith Booker
- 5 years ago
- Views:
Transcription

1 Policy Performance and Governance Capacities in the OECD and EU Sustainable Governance Indicators 2016
2 Contents Foreword Measuring Sustainable Governance Policy Performance Democracy Governance Rankings SGI Website Methodology Survey Structure SGI Board and Regional Coordinators Resources


3 Foreword The fifth edition of the Sustainable Governance Indicators (SGI) is being issued this year. Having published the previous editions every two to three years, last year we decided to update our data annually in the interests of ongoing monitoring. The 2016 SGI are the second edition to be based on the new annual data collection process. The transition to an annual procedure will make it possible to perform subject-specific analyses at short notice, based on the SGI data. The objective is also to identify the challenges of sustainable policy-making and to lay bare and compare successes and failures. This will give the debate surrounding good governance and sustainable political results sound foundations based on data. Our intention is also to highlight examples of successes and governance innovations, and to initiate international learning processes, acting in accordance with our founder Reinhard Mohn s guiding principle of learning from the world. Many countries belonging to the OECD and the EU now apply the SGI to their own performance management, thus breathing life into Reinhard Mohn s central idea. While it would appear that many OECD and EU countries have gradually overcome the global economic and financial crisis, there are a number of developed countries that still face major challenges and social upheavals as a result of the crisis. In the crisis-hit countries of southern Europe in particular, the social situation remains extremely alarming. In addition, OECD and EU countries are facing the challenge of global migration an issue that is handled very differently from country to country. Last year, developments in Europe were dominated by the largest flow of refugees since the Second World War, and this posed some serious challenges to the continent s governance systems. Tragic instances of terrorism also compel countries to seek new ways in which to deal with this threat. We cannot, however, allow ourselves to fall for the seemingly simple solutions to overcoming such challenges as offered by populists. Rather, we need to identify innovative concepts, compare and contrast them, and explore the possibilities of transfer between them. This is the purpose that the SGI are destined to fulfill once again this year. We examine OECD and EU member states on the basis of our three indicators: Policy Performance, Governance, and Quality of Democracy. The Nordic countries, Switzerland, and Germany are the most successful countries in terms of sustainable policies. The strong performance of Estonia in the Policy Performance index, being ranked seventh right behind Germany, cannot be overlooked. The main reasons behind this strong position are the country s sustainable budgetary policy and its very good education system. The majority of the OECD and EU countries recovered somewhat economically over the period under review (November 2014 to November 2015). We focus here in particular on the crisis-hit countries in Europe in which the structural reforms pushed through in recent years have begun to bear fruit. Greece still brings up the rear in our country comparison due to its dramatic social and economic situation. The northern European countries also clearly lead the way in the Governance index, although New Zealand s governmental system likewise boasts strong strategic capabilities and long-term orientation. The situation is rather different in the last-placed countries Romania, Greece, and Cyprus. Last but not least, the picture is much the same in the Democracy index, with the Scandinavian countries performing very well, while there is the greatest room for improvement in Romania, Turkey, and Hungary. The SGI can hopefully serve as a useful source of best practices for these countries in particular, as they offer a wealth of data that can be put to use in the areas of politics, science, and media. Aart De Geus Chairman and CEO, Bertelsmann Stiftung Executive Board Dr. Stefan Empter Senior Director Program Shaping Sustainable Economies 3

4 Sustainable Governance Indicators Sustainable Governance Indicators Measuring Sustainable Governance The Sustainable Governance Indicators (SGI) address one of the central social-policy questions facing the highly developed states of the OECD and the European Union at the outset of the 21st century: How can we achieve sustainable policy outcomes and ensure that political decision-making target long-term objectives? Challenges such as economic globalization, social inequality, resource scarcity and demographic change, each of which cut across policy sectors and extend beyond national boundaries, require policymakers to adapt rapidly and learn from the examples of others. Ideally, governments should act with long-term consequences in mind. This involves generating policy outcomes that maintain or improve the quality of life for present and future generations without placing an unfair burden on future generations. This also means governments need to safeguard the long-term health of their societies economic, social and environmental systems. However, longterm thinking of this nature is currently rare. Most governments tend instead to 4
5 Measuring Sustainable Governance INFO The entire set of results and each country report are available for direct use or download on our interactive website. > Website, page 18 OECD DENMARK, POLAND, SWEDEN, CZECH REPUBLIC, HUNGARY, UNITED KINGDOM EU 35 6 AUSTRALIA CHILE ICELAND ISRAEL JAPAN CANADA MEXICO NEW ZEALAND NORWAY SWITZERLAND SOUTH KOREA TURKEY UNITED STATES BELGIUM, GERMANY, ESTONIA, FINLAND, FRANCE, GREECE, IRELAND, ITALY, LATVIA, LUXEMBOURG, NETHERLANDS, AUSTRIA, PORTUGAL, SLOVAKIA, SLOVENIA, SPAIN LITHUANIA MALTA CYPRUS BULGARIA CROATIA ROMANIA act with the short term in mind. Mounting public debt, the unequal allotment of participation opportunities and the wasteful exploitation of natural resources have significant negative implications for present and future generations, thus imperiling the overall sustainability of OECD and EU states. Taking stock of these problems, the Sustainable Governance Indicators project aims to support OECD and EU governments capacity to act with the long term in mind, thereby achieving more sustainable policy outcomes. The SGI function as a monitoring instrument that uses evidence-based analysis to provide practical knowledge applicable to the daily work of policymaking. The SGI thus target the spectrum of those 5
6 Sustainable Governance Indicators The SGI provide political decision-makers, civil society actors, policy professionals, scholars and interested citizens alike an effective monitoring tool. The SGI provide an itemized comparison of policy outcomes in 41 states that draws upon a customized catalog of indicators. individuals who formulate, shape and implement policies, from political decision-makers in centers of government and the democratic institutions of the OECD and EU states, to representatives of civil society and international organizations, to scholars and interested citizens. Underlying the SGI project is a cross-national comparison of governance in 41 states of the OECD and the EU on the basis of a customized set of indicators. Operationalized as a survey, the SGI help identify successful examples of sustainable governance as well as policy and governance innovations. By comparing strengths and pitfalls, the SGI aim to activate (international) learning processes while at the same time casting a spotlight on vital reforms for decision-makers and the public. This instrument is built on three pillars the Policy Performance Index, the Democracy Index and the Governance Index that collectively identify examples of sustainable governance. INFO The SGI expert network With its innovative approach, the SGI is the first survey of its kind to allow far-reaching assessments of the sustainability of OECD and EU member states. The SGI are by no means a system of purely quantitative data; the SGI also include qualitative expert assessments, which are gathered by means of a questionnaire used as part of a multistage data capture and validation process. A network com prising a total of more than 100 renowned scholars from around the world has been engaged for the study. The inclusion of qualitative indicators is a major advantage of the SGI over many other indices, as this allows context-sensitive assessments that purely quantitative indicators cannot yield. > Methodology, page 22 6


 Profile of strengths and weaknesses (reform needs) Democratic Framework Governance")
7 Measuring Sustainable Governance Policy Performance Democracy Governance Policy outcomes in 16 policy areas Aligned with the three pillars of sustainability: economic development, environmental protection and social equity Domestic action taken by governments sensitive to international responsibilities State of democracy and the rule of law Criteria address substance and procedures of democracy Focus on institutional and procedural quality Executive capacity (steering capability, implementation, institutional learning) Executive accountability (participatory competencies of social actors) Profile of strengths and weaknesses (reform needs) Democratic Framework Governance and reform capacity 7
8 Sustainable Governance Indicators Sustainable policy outcomes Policy Performance The Policy Performance Index creates a map of reform needs in key policy areas for each country, asking how successful individual countries have been in achieving sustainable policy outcomes. In so doing, it references a range of ideas central to current international discourses on measuring sustainability, social progress and quality of life. Thus, the Policy Performance Index does not limit itself to the data associated with conventional measures of a society s economic growth and material prosperity. A broad set of indicators explore the viability and performance of economic, sociopolitical and environmental systems, as well as social inclusion. Instead, this pillar of the SGI also relies on data that measure the success of states in a variety of policy areas that must be taken into account in seeking to develop robust, high-performing, long-lasting economic, sociopolitical and environmental systems, not to mention high levels of social participation. The Policy Performance Index measures the performance of the 41 states surveyed in terms of the three core dimensions of sustainability, manifested here as economic, social and environmental policies. A total of 16 individual policy areas are addressed, with policy outcomes captured by means of a wide range of quantitative and qualitative data. In this respect, the SGI 2016 goes further than previous SGI surveys, as it also encompasses the contribution of individual countries in promoting sustainable development at the international level. And in the context of the United Nations new Sustainable Development Goals (SDGs), the highly developed OECD and EU states have a particular responsibility for contributing to an increase in global public welfare. Index dimension 1 Economic policies prospects for inclusive growth Economic policies that encourage competition and strengthen market principles remain the driver of growth, while safeguarding the resources necessary if a society is to be adaptable. However, such policies will be of the greatest advantage to the greatest number of people if they are accompanied by redistributive tax and labor-market policies, and underpinned by social policies that facilitate a just societal allocation of the benefits of economic growth. Therefore, sustainable governance can only be achieved through a successful, future-oriented approach to economic challenges. The decisive question with respect to sustainability is how opportunities for self-realization can be provided to the greatest number of people today without unjustly burdening future generations. Excessive public debt, for example, can leave future generations with a massive mortgage on their opportunities for self-realization, dwarfing the constraints felt by today s generations. In assessing the individual policy areas comprising the economic sustainability pillar, the following questions are addressed: 8
9 Policy Performance Policy Performance Economic Policies Social Policies Environmental Policies Economy Labor Market Taxes Budgets Research and Innovation Global Financial Markets Education Social Inclusion Health Families Pensions Integration Safe Living Global Social Inequalities Environment Policies Environmental Protection Regimes THREE CRITERIA AND THEIR INDICATORS Labor Market Labor Market Policy Unemployment Long-term Unemployment Youth Unemployment Low-Skilled Unemployment Assessment criteria for economic sustainability Are economic policies applied on the basis of a coherent institutional framework, thereby enhancing the country s international competitiveness? How successful are government strategies in addressing unemployment and increasing labor-market inclusion? To what extent do the country s tax policies promote social equity, competition and positive long-term state-revenue prospects? To what extent are budgetary policies underpinned by principles of fiscal sustainability? Employment Rate Low Pay Incidence Pensions Pension Policy Older Employment Old Age Dependency Ratio Senior Citizen Poverty To what extent do research and development policies contribute to the country s capacity for innovation? Does the country actively contribute to the effective regulation and stabilization of international financial markets? Environmental Protection Regimes Global Environmental Policy Multilateral Environmental Agreements Kyoto Participation and Achievements 9
10 Sustainable Governance Indicators Participatory justice and equal opportunities for self-realization should underpin social policies. Index dimension 2 Social policies securing participation for present and future generations Social policies designed to enhance sustainability involve maintaining or increasing individuals opportunities to act and live in accordance with their own values, which thereby ensures a high degree of participation in society. Political, social and economic systems must be constituted in such a way that individuals are provided with substantive opportunities for self-realization. Ensuring broad-based social participation involves more than providing safeguards against classic risks such as illness, accidents, aging, assisted living, disability and unemployment. Social policies should also be integrative in nature and empower members of the community to participate actively in public affairs. At the same time, all members of society should have equal access to these substantive opportunities: No one should be systematically excluded from those activities and states of being that comprise well-being. These include feeling safe, having good health and gainful employment, engaging in political participation, enjoying social relations, being able to participate in cultural life, and living in favorable environmental conditions. Seeking to enhance sustainability thus means ensuring the long-term viability of social welfare systems. Assessing the performance of OECD and EU states with this in mind involves more than evaluating the extent to which society provides opportunities and enables participation. It also involves taking a close look at factors such as the sustainability of public financing and the potential for reform within existing systems. Sustainability-minded decision-makingmaintains and even expands opportunities for social participation for today s generations without compromising the opportunities afforded to future generations. The SGI s social policies category addresses the following questions: Assessment criteria for social sustainability To what extent do the country s education policies foster high-quality, inclusive and efficient education and training systems? To what extent do sociopolitical measures facilitate social inclusion, while effectively combating social exclusion and polarization? How successfully do policies secure quality, inclusivity and cost efficiency in the country s health care system? To what extent do family-policy measures make it easier to combine career and family? How successful are the country s pension policies in preventing old-age poverty while promoting intergenerational equity and fiscal sustainability? To what extent do the country s political measures foster the effective integration of migrants into society? How successful is the country in establishing secure living conditions for its citizens by combating crime and other security risks? And looking to the international level: To what extent is the country engaged in efforts to combat global social inequalities, such as the promotion of fair global-trade structures and just participation opportunities within developing countries? 10
11 Policy Performance Index dimension 3 Environmental policies In terms of sustainability, environmental policies are particularly important given the far-reaching effects environmental conditions have on the quality of life. Our surrounding environment can influence the quality of life positively (by providing access to clean water, air and recreation areas) or negatively (through water, air or noise pollution, for example). The attractions or challenges provided by natural environments help determine where people want to live, drive migratory movements and make basic human existence possible. But natural environments (with their ecosystemic functions) are also dependent on human social systems particularly the extent to which these latter systems observe principles of environmental sustainability. Lifestyles and economic systems dependent on an intense use of resources destabilize the ecosystem in the long term. Indeed, the growing expectations of an expanding global population represent the greatest risk of destabilization. And yet the ability to fulfill these demands is constrained by immutable planetary limits. Environmental sustainability therefore means ensuring that regenerative resources are used only to the extent that they can be replenished. Environmental sustainability also involves ensuring that nonrenewable resources are consumed only to the extent that similar, renewable substitutes can be developed. Harmful pollutants such as greenhouse gases should be emitted only to the extent that they can be absorbed by natural systems. The goal of sustainable environmental policies must be to secure the natural foundation of human existence and leave an intact ecosystem for future generations. Therefore, in this category of sustainability, the SGI address the following key questions for each of the 41 OECD and EU countries: Assessment criteria for environmental sustainability How successful are the country s environmental policies in protecting natural resources and promoting livable environmental conditions? How committed is the country to the advancement of binding global environmental-protection regimes? A broad range of quantitative indicators underlying this category also allow for a systematic assessment of environmental-policy outcomes (e.g., greenhouse-gas emissions, renewable energies, particulate pollution, waste recycling). Comparing strengths and weaknesses across the three categories of the Policy Performance Index allows us to identify not only the areas in which individual countries are achieving positive policy outcomes, and the extent to which this is occurring, but also the areas in which there is a pressing need for further reform. Behind this model is the idea that the long-term viability of economic, social and environmental systems can be achieved only through measures that consider these systems together. It is important to consider the diverse interactions and conflicting goals that arise from the three systems and their associated policies, with no single component viewed in isolation from the others. The structures, actors and processes through which such conflicting goals are addressed, and where possible resolved, are therefore of central importance in sustainable policy formulation (for more on this, see also aspects of quality of democracy and governance, on the next page). 11
12 Sustainable Governance Indicators Comparing frameworks for democracy and the rule of law Democracy How do OECD and EU states compare with regard to the quality of democracy and the rule of law? This question is also vital in assessing sustainable governance because the rule of law and citizens ability to participate in political processes are essential to ensuring a political system s good performance and long-term stability. Fully developed opportunities for political participation must be in place if a society is to achieve high levels of participatory justice. The quality of democratic standards and the rule of law are key to any political system s longterm viability. Indeed, the quality of democracy in a society must be high if it is to sustain pluralism in the processes that build and shape public will and opinions (input legitimacy), as well as in the policy-formulation and decision-making processes that accommodate the interests and needs of a broad spectrum of stakeholders in society (throughput legitimacy), while ultimately transforming these processes into concrete and efficacious actions (output legitimacy). Democracy and the rule of law are therefore fundamental to preventing the systematic exclusion or neglect of social groups or individuals, enabling all members of a society to participate in shaping opinions and building the will to reform. When managing the inherent conflicts underlying sustainable policy goals, it is particularly important to prevent the systematic exclusion of any group, thus following the principle of equal opportunity.the legitimacy of a political system rests upon its ability to provide appropriate oversight of decision-makers activities, opportunities for democratic participation, protection of civil rights and legal certainty. Citizens consent to and trust in a political system will depend heavily on these conditions. Moreover, democratic participation and oversight are essential in enabling concrete learning and adaptation processes, as well as the capacity for change. In SGI terms, a high level of democracy quality and a rigorous observation of the rule of law are vital to achieving sustainability in the sense of long-term systemic viability. The SGI measure these conditions in detail through the Democracy Index. Quality of Democracy The SGIs Democracy Index is oriented toward the institutional and organizational realization of sound democratic standards. Its normative reference point is an ideal representative democracy. The SGI criteria by which government systems in the OECD and EU are measured derive from those dimensions identified by democratic theory as most significant, and contain key indicators by which the quality of democracy can be assessed. In total, 15 qualitative indicators, comprising four criteria, are used to evaluate the fabric of democracy in each country. Criteria include the following: 12
13 Democracy Quality of Democracy Electoral Processes Access to Information Civil Rights and Political Liberties Rule of Law FOUR CRITERIA AND THEIR INDICATORS Candidacy Procedures Media Freedom Civil Rights Legal Certainty Media Access Media Pluralism Political Liberties Judicial Review Voting and Registration Rights Access to Government Information Non-discrimination Appointment of Justices Party Financing Popular Decision- Making Corruption Prevention Assessment criteria for the quality of democracy The electoral process, which includes the rules governing political-party ballot qualification and voter registration as well as the issue of party financing; for the first time, this edition of the SGI also evaluates direct-democracy structures and participation opportunities The public s access to information, which can be measured by the extent of media freedoms and media pluralism Civil rights and political liberties The rule of law, including legal certainty, the judicial review of laws and the prevention of corruption 13
14 Sustainable Governance Indicators An international comparison of reform capacities Governance In a context of rapidly changing environments and growing complexity, it is ever more important for policymakers (and the institutions through which they act) to respond quickly and resolutely while bearing in mind the long-term impact of actions taken today. It is therefore important that any assessment of sustainable governance look not only at policy outcomes, a country s underlying democratic order and the rule of law, but also at the political leadership s capacity to steer processes with success. Just how effective are OECD and EU leaders in managing strategic processes, and how well do they address and resolve the problems they face? The Governance Index looks at a government s capacity to deliver sound policies as well as the participatory and oversight competencies of social actors. The SGIs Governance Index answers these questions using a broad and innovative set of indicators. These indicators permit a contextualized assessment of the extent to which the governments of OECD and EU states working together with other institutions and social stakeholders in the course of democratic decision-making processes are able to identify pressing issues, develop appropriate solutions and implement them efficiently and efficaciously. The modern concept of governance employed by the SGI emphasizes a government s capacity to deliver sustainable policies (executive capacity) as well as the participatory and oversight competencies of actors and institutions beyond the executive branch (executive accountability). Index dimension 1 Executive capacity The executive capacity category focuses on the core activities of a government and examines the steering capabilities demonstrated by a political system s administrative apparatus. This includes strategic planning, interministerial coordination, knowledge management, consultation and communication processes, as well as policy implementation and learning capacity. The key actors examined here are the governments of the OECD and EU states along with the organizational and institutional resources at their disposal (centers of government, ministries, agencies, etc.). Index dimension 2 Executive accountability The second category within the Governance Index, executive accountability, focuses on the forms of interaction between a government and other stakeholders in the policymaking process. It seeks to assess the extent to which participation and oversight competencies are produced and cultivated. If policies are to succeed in the long term and yield sustainable effects, governments clearly cannot afford to formulate and implement policies in isolation. Bearing this in mind, the SGI examine the extent to which other actors who perform essential functions in consolidating and mediating interests in a political system are able to participate in policymaking and monitor the process at each step along the way. The capacity to exercise this oversight 14
15 Governance Governance Executive Capacity Strategic Capacity Interministerial Coordination Evidence-based Instruments Societal Consultation Policy Communication Effective Implementation Adaptability Organizational Reform Capacity Executive Accountability Citizens Participatory Competence Legislative Actors Resources Media Parties and Interest Associations function in part reflects the government s obligation to account for its actions to citizens, parliaments, the media, parties and interest groups. Moreover, executive accountability addresses the effectiveness of government communication, examining how well a government acquires and disseminates information, and the extent to which it involves and activates various elements of society in formulating and implementing policy. The SGI therefore include a series of indicators exploring the extent to which governments consult entities such as special-interest groups early in legislative planning processes. The category also includes indicators that explore the extent to which the associations, citizens and legislatures possess participatory competencies (knowledge of politics, financial resources, etc.). In short, this is about the checks and balances and participatory processes that can enhance the quality and legitimacy of political decision-making. These aspects of modern governance are reflected in the architecture of the Governance Index, as shown in the figure above. As was the case for the Policy Performance and Democracy indices, the figure depicting the Governance Index represents merely an overview of its most important features. In sum, 67 qualitative and 69 quantitative indicators underlie the three indices. The issues and concerns discussed thus far highlight the SGIs two-pronged objective in assessing the future viability of OECD and EU states: to measure the need for reform with reference to sustainable policy outcomes and the quality of democracy; and to measure the capacity for reform in terms of governments and social groups abilities to steer these processes. The SGI take this approach further than other international rankings in two respects. First, the SGI never regard OECD and EU states reform needs from a purely economic point of view. Instead, the SGI intentionally incorporate cross-cutting topics such as education, the environment, social issues and security. Second, the dimension of reform capacity remains underexplored by other indices to date. No other ranking offers a comparable analysis with such depth of field. TWO CRITERIA AND THEIR INDICATORS Interministerial Coordination GO Expertise GO Gatekeeping Line Ministries Cabinet Committees Ministerial Bureaucracy Informal Coordination Parties and Interest Associations Intra-Party Democracy Association Competence (Business) Association Competence (Others) 15
16 Sustainable Governance Indicators Policy Performance Rankings The Policy Performance Index aggregates all the data compiled on policy outcomes in 16 areas that address the three dimensions of sustainability (economic development, environmental protection and social policies). This allows for a strengths and weaknesses profile of each country as it underscores their specific reform needs. The Democracy Index is based on the thorough analysis of each country s democratic order and the rule of law on which it is based. In assessing the quality of democratic institutions and processes, the index looks at the substantive and procedural features of a system that enable longterm oriented governance. The Governance Index assesses a government s capacity to steer and implement policies, as well as its capacity for institutional learning. It also takes a close look at the participatory and monitoring competencies of actors in society, thereby accounting for a political system s capacity for reform Ranking SGI 2016 Difference to SGI 2015 Trend Economic Policies Difference to SGI 2014 Social Policies Environmental Policies Policy Performance Sweden Denmark Norway Switzerland Finland Germany Estonia Luxembourg United Kingdom Lithuania Netherlands New Zealand Ireland Iceland Latvia Austria Canada France South Korea Czech Republic Belgium Slovenia Japan Poland Australia United States Israel Slovakia Spain Malta Portugal Italy Chile Romania Bulgaria Hungary Croatia Cyprus Turkey Mexico Greece 16
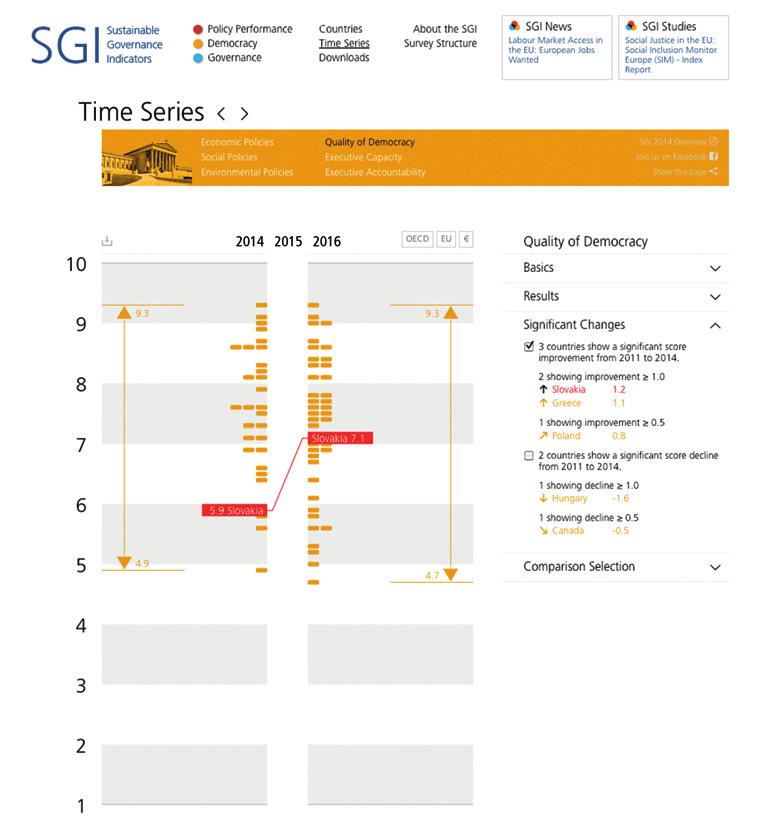
17 Rankings Democracy Governance Ranking SGI 2016 Difference to SGI 2015 Trend Difference to SGI 2014 Quality of Democracy Sweden Finland Norway Denmark Germany Switzerland New Zealand Poland Estonia Ireland Lithuania United States Latvia Luxembourg Canada Australia Slovenia Netherlands Austria Belgium United Kingdom Portugal Italy Iceland Czech Republic France Slovakia Greece Spain Israel Chile Cyprus Croatia Japan Mexico Bulgaria South Korea Malta Romania Turkey Hungary Ranking SGI 2016 Difference to SGI 2015 Trend Difference to SGI 2014 Executive Capacity Executive Accountability Governance Norway Finland Denmark Sweden New Zealand Luxembourg United States United Kingdom Canada Germany Australia Switzerland Poland Iceland Ireland Austria Lithuania Israel Belgium Spain Estonia Netherlands Latvia Japan Italy Czech Republic South Korea Mexico Chile France Malta Portugal Turkey Slovenia Slovakia Bulgaria Croatia Hungary Greece Romania Cyprus Survey periods SGI 2016: November 2014 November 2015, SGI 2015: May 2013 November 2014, SGI 2014: May 2011 May

18 Sustainable Governance Indicators Results and data at a glance SGI Website The SGI website s interactive features provide access to the findings for 41 countries. Users can explore the full range of data provided, from individual indicators across various analytic categories to fully aggregated indices

19 SGI Website 1 Intuitive navigation 2 3 pillars, 6 categories 3 News and studies 4 Interactive features Direct access to the entire set of Access to every level of analy- Studies and ongoing blog reports A variety of visualizations allow data, downloads and comparative sis from indicators to indices. that draw upon data for each for a systematic comparison of features. of the SGI countries. strengths and weaknesses. 4 19


20 Sustainable Governance Indicators


21 SGI Website 5 Time series analysis 6 Country reports 7 Policy areas in comparison 8 Determine weighting Compare a variety of items over Explore country reports from every The SGI also allow for the cross- Users can for the first time select time (SGI 2014, 2015 and 2016). angle. national comparison of policy areas. the relative weights of criteria used in rankings
22 Sustainable Governance Indicators Combining quantitative data with experts qualitative analysis Methodology: Generating Better Data through an Iterative Process The SGI draw on established survey and aggregation methods. In order to ensure the proper operationalization of the individual index components, the SGI rely on a combination of qualitative and quantitative data. This allows for an analysis in which the strengths of both types of data can be applied, and it avoids the pitfalls associated with the use of purely quantitative or qualitative surveys. In the SGI, the objectivity of quantitative data from official statistical sources is complemented by experts context-sensitive qualitative assessments. This combination delivers a detailed portrait of policy outcomes, the quality of democracy and steering capacities. SGI methodology stands out for being transparent and contextsensitive. The quantitative data underlying the SGI is drawn from official statistical sources, in particular those provided by the OECD and EU. While the SGI project team compiles this quantitative data centrally, the qualitative data is procured from a global network of more than 100 experts in a multiphase process of survey and validation. Each country is evaluated by (at least) two country experts (political scientists and economists) as well as a regional coordinator, each of whom respond to the questions posed in the SGI codebook. Country reports are then produced through an iterative evaluation process involving reviews and comments by each expert. This procedure is similar to that used by the Bertelsmann Stiftung in the SGI s sister project, the Transformation Index. The SGI Codebook (available at www. sgi-network.org) details the rationale behind each of the 67 qualitative indicators, thereby ensuring a shared understanding of each question among the SGI experts. The questions comprising this codebook include a range of answer options, allowing for precise evaluations on a scale of 1 (lowest score) to 10 (highest). The response to each question includes both a numerical score and a written response that substantiates and illustrates the score given. Throughout the course of the online survey process, experts refer to the quantitative indicators for all 41 countries as benchmarks, allowing assessments to be made on the basis of sound empirical data. To ensure the comparability of quantitative and qualitative data, all quantitative data are standardized by linear transformation on a scale of 1 to 10. These figures are then subject to simple aggregation in establishing the three Policy Performance, Democracy and Governance indices. The SGI evaluation process yields two products: detailed rankings and comprehensive reports on each of the 41 OECD and EU 22
23 Methodology A multi-stage survey of 41 OECD and EU states ensures that results are reliable and valid Initial survey 1 Review 2 Intra-regional calibration 3 Inter-regional calibration 4 Validity check 5 The first expert responds to the questionnaire, providing scores and drafting a country report. The second expert reviews and revises the draft report, providing scores for each indicator without being able to view the first expert s scores. A regional coordinator reviews the report and scores provided, revising both in consultation with the experts to create the final report. The coordinator also oversees the collection of data for up to eight countries. Regional coordinators convene to compare and calibrate across regions the results for each. In a final step, the SGI Board reviews the validity of the findings and approves the final scores. Policy Performance Democracy Governance Economic Policies Social Policies Environmental Policies Electoral Processes Access to Information Civil Rights and Political Liberties Rule of Law Executive Capacity Executive Accountability states surveyed (available free of charge at The SGI website provides access to every level of aggregation, from individual indicators up to the top-level indices. The country reports are also available as downloads. The survey period for the Sustainable Governance Indicators 2016 extended from November 7, 2014 to November 8, The assessments provided therefore refer to governance exclusively within this period of time. Following earlier edition in 2009, 2011, 2014 and 2015, this is the fifth SGI survey. 23
24 Sustainable Governance Indicators Survey Structure Category Economic Policies Social Policies Environmental Policies Criterion Indicator Indicator Indicator Economy Economic Policy GDP per Capita Inflation Gross Fixed Capital Formation Real Interest Rates Potential Output, Growth Rate Labor Market Labor Market Policy Unemployment Long-term Unemployment Youth Unemployment Low-skilled Unemployment Employment Rate Low Pay Incidence Taxes Tax Policy Tax System Complexity Structural Balance Marginal Tax Burden for Businesses Redistribution Effect Budgets Budgetary Policy Debt to GDP Primary Balance Debt Interest Ratio Budget Consolidation Research and Innovation Research and Innovation Policy Public R&D Spending Non-public R&D Spending Total Researchers Intellectual Property Licenses PCT Patent Applications Education Education Policy Upper Secondary Attainment Tertiary Attainment PISA Results PISA, Socioeconomic Background Pre-primary Expenditure Social Inclusion Social Inclusion Policy Poverty Rate NEET Rates Gini Coeffi cient Gender Equality in Parliaments Life Satisfaction Health Health Policy Spending on Health Programs Life Expectancy Infant Mortality Perceived Health Status Families Family Policy Child Care Density, Age 0-2 Child Care Density, Age 3-5 Fertility Rate Child Poverty Pensions Pension Policy Older Employment Old Age Dependency Ratio Senior Citizen Poverty Integration Integration Policy FB-N Upper Secondary Attainment FB-N Tertiary Attainment FB-N Unemployment FB-N Employment (FB-N = Foreign-Born to Native) Safe Living Safe Living Conditions Homicides Assaults and Muggings Confi dence in Police Global Inequalities Global Social Policy ODA Rate Environment Environmental Policy Energy Productivity Greenhouse Gas Emissions Particulate Matter Water Usage Waste Generation Material Recycling Biodiversity Protection Renewable Energy Global Environmental Protection Global Environmental Policy Multilateral Environmental Agreements Kyoto Participation and Achievements Global Financial System Stabilizing global financial markets Tier 1 Capital Ratio Category Quality of Democracy Executive Capacity Executive Accountability Criterion Indicator Indicator Indicator Electoral Processes Candidacy Procedures Media Access Voting and Registration Rights Party Financing Popular Decision-Making Access to Information Media Freedom Media Pluralism Access to Government Information Civil Rights and Political Liberties Civil Rights Political Liberties Non-discrimination Rule of Law Legal Certainty Judicial Review Appointment of Justices Corruption Prevention Strategic Capacity Strategic Planning Scholarly Advice Interministerial Coordination GO Expertise GO Gatekeeping Line Ministries Cabinet Committees Ministerial Bureaucracy Informal Coordination Evidence-based Instruments RIA Application Quality of RIA Process Sustainability Check Societal Consultation Negotiating Public Support Policy Communication Coherent Communication Implementation Government Efficiency Ministerial Compliance Monitoring Ministries Monitoring Agencies/Bureaucracies Task Funding Constitutional Discretion National Standards Adaptability Domestic Adaptability International Coordination Organizational Reform Self-monitoring Institutional Reform Citizens Participatory Competence Policy Knowledge Voicing Opinion to Offi cials Voter Turnout Legislative Actors Resources Parliamentary Resources Obtaining Documents Summoning Ministers Summoning Experts Task Area Congruence Audit Offi ce Ombuds Office Media Media Reporting Newspaper Circulation Quality Newspapers Parties and Interest Associations Intra-party Democracy Association Competence (Business) Association Competence (Others) 24
25 Methodology SGI Board and Regional Coordinators The SGI Advisory Board is comprised of representatives from academia, politics and business. Prof. Dr. Nils C. Bandelow Technical University Braunschweig Regional coordinator Northwest Europe Prof. Dr. Frank Bönker University of Cooperative Education Riesa and European University Viadrina, Frankfurt/Oder Regional coordinator East-Central Europe Dr. Martin Brusis University of Munich Prof. Dr. César Colino Spanish Distance-Learning University, Madrid Regional coordinator Western Mediterranean Countries Prof. Dr. Aurel Croissant University of Heidelberg Regional coordinator Asia and Oceania Dr. Martin Hüfner HF Economics Ltd., Krailling Prof. Dr. András Inotai Institute for World Economics of the Hungarian Academy of Sciences, Budapest Prof. Dr. Detlef Jahn University of Greifswald Regional coordinator Nordic Countries Prof. Dr. Werner Jann University of Potsdam Dr. Roy Karadag University of Bremen Regional coordinator Eastern Mediterranean Countries Prof. Dr. Hans-Dieter Klingemann Social Science Research Center Berlin Prof. Dr. Rolf J. Langhammer Kiel Institute for the World Economy Prof. Dr. Wolfgang Merkel Social Science Research Center Berlin Prof. Dr. Hans-Jürgen Puhle University of Frankfurt /Main Prof. Dr. Friedbert W. Rüb Humboldt University Berlin Prof. Dr. Kai Uwe Schnapp University of Hamburg Prof. Dr. Ulrich van Suntum University of Münster PD Dr. Martin Thunert University of Heidelberg Regional coordinator America Prof. Dr. Uwe Wagschal University of Freiburg Prof. Dr. Reimut Zohlnhöfer University of Heidelberg Regional coordinator Central Europe 2016 Bertelsmann Stiftung Bertelsmann Stiftung Carl-Bertelsmann-Straße Gütersloh Responsible Dr. Daniel Schraad-Tischler Phone Fax Dr. Christian Kroll Phone Fax Dr. Christof Schiller Phone Fax Photography Title: jovannig Fotolia.com; Page 3: Aart De Geus Arne Weychardt, Hamburg; Page 6: Policy Performance Marco2811 Fotolia.com; Page 6: Democracy Jozef Sedmák Shotshop.com; Page 6: Governance Gk Shotshop.com Design kopfstand, Bielefeld Translation and Editing Barbara Serfozo, Berlin Print Druckhaus Rihn GmbH, Blomberg

26 Daniel Schraad-Tischler Christian Kroll with a foreword by Kofi Annan Daniel Schraad-Tischler Sustainable Governance Indicators SGI Studies and SGI News In addition to working with academic experts in the field, we also work with journalists and bloggers who use our data in their commentary and reports on sustainable governance in a variety of countries. We engage in media partnerships for these reports, providing graphics, expert interviews and other informative support. Our media partners can be linked to our SGI News blog. Sustainable Development Goals: Are the rich countries ready? Sustainable Development Goals: Are the rich countries ready? The Millennium Development Goals have led to tangible progress in many developing countries. Once adopted, the United Nations new global Sustainable Development Goals will additionally require industrialized countries to implement such standards beginning in But the world s first comprehensive stocktaking shows that most industrialized nations are a long way from serving as role models for sustainable development. Social Justice in the EU Based on quantitative and qualitative SGI data, the Social Justice Index compares the 28 EU states across six dimensions: Poverty prevention, equitable education, labor market access, social cohesion and non-discrimination, health, as well as intergenerational justice. It reveals that EU countries vary considerably in their ability to create a truly inclusive society. Social Justice in the EU Index Report 2015 Social Inclusion Monitor Europe Nachhaltiges Regieren in der OECD und EU Wo steht Deutschland? Sustainable Governance Indicators 2014 Zukunftsfähigkeit im Vergleich Sustainable Governance in the OECD and EU How Does Germany compare? Based on the detailed set of quantitative and qualitative indicators used in the SGI project, this study provides a comprehensive assessment of Germany s strengths and weaknesses in terms Sustainable Governance. By looking at Germany s policy performance, quality of democracy and governance capacities, the study sheds light on the country s need for reform and its reform capacities. 26
, Centre for Global Cooperation Research Resources Social Justice in the OECD How Do the Member States Compare?")
27 Prof. Dr. Renato Flores, Getulio Vargas Foundation Graduate School of Economics Prof. Dr. Detlef Nolte, German Institute of Global and Area Studies (GIGA) Prof. Dr. Lucio Renno, University of Brasília Christina Stolte, German Institute of Global and Area Studies (GIGA) Dr. Peter Thiery (Coordinator), Centre for Global Cooperation Research Resources Social Justice in the OECD How Do the Member States Compare? This study is just one illustration of the range of possibilities offered by the Sustainable Governance Indicators vast pool of data. Published initially in early 2011, this study examined and compared the state of social justice in 31 OECD countries, combining selected SGI indicators with established social science methods to create a new index of social justice. Intergenerational Justice in Aging Societies A Cross-national Comparison of 29 OECD Countries Intergenerational Justice in Aging Societies How well do the OECD states live up to the principles of intergenerational justice? How clearly can such principles be measured? How can decision-makers develop policies that address issues relevant to aging societies without pitting the interests of older and younger generations against each other? What are the policymaking lessons that can be drawn from cross-national comparisons? This study provides evidence-based answers to these questions. Sustainable Governance in the BRICS Country Report Brazil Sustainable Governance in the BRICS The BRICS states have in recent years attracted much attention as emerging political and economic global players. But how sustainable is such rapid growth and development? How effective is governance in each of these states? This SGI study addresses these and other questions relevant to governance research. Assessing Pathways to Success Need for Reform and Governance Capacities in Asia Christian Göbel Sebastian Maslow Asia Study Though often overshadowed by the attention paid to economic growth in China and India, growth in other Asian economies such as Indonesia, Japan, Malaysia, Singapore, South Korea and Vietnam has made the region a driving force of the global economy. This regional study asks which features of governance have driven economic growth in each country, how sustainable they are, and the extent to which democratic principles influence decision-making. SGI Online: SGI Blog: Facebook: Showreel Sustainable Governance Indicators 2016: 27
Good Governance and Quality of Democracy Characteristics of the Quality of Society
 Good Governance and Quality of Democracy Characteristics of the Quality of Society Sustainable Governance Indicators 2014 Dr. Daniel Schraad-Tischler What is the SGI project? Indicator-based cross-national
Social Justice in the EU Index Report 2017
 Key Findings Social Justice in the EU Index Report 2017 Social Inclusion Monitor Europe Daniel Schraad-Tischler, Christof Schiller, Sascha Matthias Heller, Nina Siemer Social Justice in the EU Index Report
Social Justice in the EU Index Report 2015
 Key Findings Social Justice in the EU Index Report 2015 Social Inclusion Monitor Europe Daniel Schraad-Tischler Social Justice in the EU Index Report 2015 Social Inclusion Monitor Europe Daniel Schraad-Tischler
Social Justice in the EU Index Report 2015
 Country Profile Italy Social Justice in the EU Index Report 2015 Social Inclusion Monitor Europe Daniel Schraad-Tischler Social Justice in the EU Index Report 2015 Social Inclusion Monitor Europe Daniel
WORLDWIDE DISTRIBUTION OF PRIVATE FINANCIAL ASSETS
 WORLDWIDE DISTRIBUTION OF PRIVATE FINANCIAL ASSETS Munich, November 2018 Copyright Allianz 11/19/2018 1 MORE DYNAMIC POST FINANCIAL CRISIS Changes in the global wealth middle classes in millions 1,250
Andrew Wyckoff, OECD ITIF Innovation Forum Washington, DC 21 July 2010
 OECD s Innovation Strategy: Getting a Head Start on Tomorrow Andrew Wyckoff, OECD ITIF Innovation Forum Washington, DC 21 July 2010 www.oecd.org/innovation/strategy 1 Overview What is OECD s Innovation
OECD SKILLS STRATEGY FLANDERS DIAGNOSTIC WORKSHOP
 OECD SKILLS STRATEGY FLANDERS DIAGNOSTIC WORKSHOP Dirk Van Damme Head of Division OECD Centre for Skills Education and Skills Directorate 15 May 218 Use Pigeonhole for your questions 1 WHY DO SKILLS MATTER?
Settling In 2018 Main Indicators of Immigrant Integration
 Settling In 2018 Main Indicators of Immigrant Integration Settling In 2018 Main Indicators of Immigrant Integration Notes on Cyprus 1. Note by Turkey: The information in this document with reference to
Social Justice in the EU Index Report 2017
 Social Justice in the EU Index Report 2017 Social Inclusion Monitor Europe Daniel Schraad-Tischler, Christof Schiller, Sascha Matthias Heller, Nina Siemer EU Social Justice Index 2017 1 2 3 4 5 6 7 8 9
Widening of Inequality in Japan: Its Implications
 Widening of Inequality in Japan: Its Implications Jun Saito, Senior Research Fellow Japan Center for Economic Research December 11, 2017 Is inequality widening in Japan? Since the publication of Thomas
EuCham Charts. October Youth unemployment rates in Europe. Rank Country Unemployment rate (%)
") EuCham Charts October 2015 Youth unemployment rates in Europe Rank Country Unemployment rate (%) 1 Netherlands 5.0 2 Norway 5.5 3 Denmark 5.8 3 Iceland 5.8 4 Luxembourg 6.3... 34 Moldova 30.9 Youth unemployment
EuCham Charts October 2015 Youth unemployment rates in Europe Rank Country Unemployment rate (%) 1 Netherlands 5.0 2 Norway 5.5 3 Denmark 5.8 3 Iceland 5.8 4 Luxembourg 6.3... 34 Moldova 30.9 Youth unemployment
Taiwan s Development Strategy for the Next Phase. Dr. San, Gee Vice Chairman Taiwan External Trade Development Council Taiwan
 Taiwan s Development Strategy for the Next Phase Dr. San, Gee Vice Chairman Taiwan External Trade Development Council Taiwan 2013.10.12 1 Outline 1. Some of Taiwan s achievements 2. Taiwan s economic challenges
Russian Federation. OECD average. Portugal. United States. Estonia. New Zealand. Slovak Republic. Latvia. Poland
 INDICATOR TRANSITION FROM EDUCATION TO WORK: WHERE ARE TODAY S YOUTH? On average across OECD countries, 6 of -19 year-olds are neither employed nor in education or training (NEET), and this percentage
UNDER EMBARGO UNTIL 9 APRIL 2018, 15:00 HOURS PARIS TIME
 TABLE 1: NET OFFICIAL DEVELOPMENT ASSISTANCE FROM DAC AND OTHER COUNTRIES IN 2017 DAC countries: 2017 2016 2017 ODA ODA/GNI ODA ODA/GNI ODA Percent change USD million % USD million % USD million (1) 2016
European Union Passport
 European Union Passport European Union Passport How the EU works The EU is a unique economic and political partnership between 28 European countries that together cover much of the continent. The EU was
VISA POLICY OF THE REPUBLIC OF KAZAKHSTAN
 VISA POLICY OF THE REPUBLIC OF KAZAKHSTAN Country Diplomatic Service National Term of visafree stay CIS countries 1 Azerbaijan visa-free visa-free visa-free 30 days 2 Kyrgyzstan visa-free visa-free visa-free
OECD Strategic Education Governance A perspective for Scotland. Claire Shewbridge 25 October 2017 Edinburgh
 OECD Strategic Education Governance A perspective for Scotland Claire Shewbridge 25 October 2017 Edinburgh CERI overview What CERI does Generate forward-looking research analyses and syntheses Identify
OECD ECONOMIC SURVEY OF LITHUANIA 2018 Promoting inclusive growth
 OECD ECONOMIC SURVEY OF LITHUANIA 218 Promoting inclusive growth Vilnius, 5 July 218 http://www.oecd.org/eco/surveys/economic-survey-lithuania.htm @OECDeconomy @OECD 2 21 22 23 24 25 26 27 28 29 21 211
Migration and Integration
 Migration and Integration Integration in Education Education for Integration Istanbul - 13 October 2017 Francesca Borgonovi Senior Analyst - Migration and Gender Directorate for Education and Skills, OECD
Size and Development of the Shadow Economy of 31 European and 5 other OECD Countries from 2003 to 2013: A Further Decline
 January 31, 2013 ShadEcEurope31_Jan2013.doc Size and Development of the Shadow Economy of 31 European and 5 other OECD Countries from 2003 to 2013: A Further Decline by Friedrich Schneider *) In the Tables
The global and regional policy context: Implications for Cyprus
 The global and regional policy context: Implications for Cyprus Dr Zsuzsanna Jakab WHO Regional Director for Europe Policy Dialogue on Health System and Public Health Reform in Cyprus: Health in the 21
Identification of the respondent: Fields marked with * are mandatory.
 Towards implementing European Public Sector Accounting Standards (EPSAS) for EU Member States - Public consultation on future EPSAS governance principles and structures Fields marked with are mandatory.
1. Why do third-country audit entities have to register with authorities in Member States?
 Frequently Asked Questions (FAQ) Form A Annex to the Common Application Form for Registration of Third-Country Audit Entities under a European Commission Decision 2008/627/EC of 29 July 2008 on transitional
OECD/EU INDICATORS OF IMMIGRANT INTEGRATION: Findings and reflections
 OECD/EU INDICATORS OF IMMIGRANT INTEGRATION: Findings and reflections Meiji University, Tokyo 26 May 2016 Thomas Liebig International Migration Division Overview on the integration indicators Joint work
CO3.6: Percentage of immigrant children and their educational outcomes
 CO3.6: Percentage of immigrant children and their educational outcomes Definitions and methodology This indicator presents estimates of the proportion of children with immigrant background as well as their
Ignacio Molina and Iliana Olivié May 2011
 Ignacio Molina and Iliana Olivié May 2011 What is the IEPG? The Elcano Global Presence Index (IEPG after its initials in Spanish) is a synthetic index that orders, quantifies and aggregates the external
Equity and Excellence in Education from International Perspectives
 Equity and Excellence in Education from International Perspectives HGSE Special Topic Seminar Pasi Sahlberg Spring 2015 @pasi_sahlberg Evolution of Equity in Education 1960s: The Coleman Report 1970s:
Measuring Social Inclusion
 Measuring Social Inclusion Measuring Social Inclusion Social inclusion is a complex and multidimensional concept that cannot be measured directly. To represent the state of social inclusion in European
Education Quality and Economic Development
 Education Quality and Economic Development Eric A. Hanushek Stanford University Bank of Israel Jerusalem, June 2017 Sustainable Development Goals (SDGs) Development = Growth Growth = Skills Conclusions
How does education affect the economy?
 2. THE ECONOMIC AND SOCIAL BENEFITS OF EDUCATION How does education affect the economy? More than half of the GDP growth in OECD countries over the past decade is related to labour income growth among
A GAtewAy to A Bet ter Life Education aspirations around the World September 2013
 A Gateway to a Better Life Education Aspirations Around the World September 2013 Education Is an Investment in the Future RESOLUTE AGREEMENT AROUND THE WORLD ON THE VALUE OF HIGHER EDUCATION HALF OF ALL
IMMIGRATION IN THE EU
 IMMIGRATION IN THE EU Source: Eurostat 10/6/2015, unless otherwise indicated Data refers to non-eu nationals who have established their usual residence in the territory of an EU State for a period of at
Greifswald Comparative Politics
 Greifswald Comparative Politics Working paper no. 3 2012 Detlef Jahn Explaining Patterns of Performance in the 30 OECD-Countries: The Impact of Government Structure and Ideology Detlef Jahn (2012). Explaining
Convergence: a narrative for Europe. 12 June 2018
 Convergence: a narrative for Europe 12 June 218 1.Our economies 2 Luxembourg Ireland Denmark Sweden Netherlands Austria Finland Germany Belgium United Kingdom France Italy Spain Malta Cyprus Slovenia Portugal
MEETING OF THE OECD COUNCIL AT MINISTERIAL LEVEL, PARIS 6-7 MAY 2014 REPORT ON THE OECD FRAMEWORK FOR INCLUSIVE GROWTH KEY FINDINGS
 MEETING OF THE OECD COUNCIL AT MINISTERIAL LEVEL, PARIS 6-7 MAY 2014 REPORT ON THE OECD FRAMEWORK FOR INCLUSIVE GROWTH KEY FINDINGS This document is published on the responsibility of the Secretary-General
Meeting of the OECD Council at Ministerial Level
 Meeting of the OECD Council at Ministerial Level Paris, 6-7 May 2014 2014 OECD MINISTERIAL STATEMENT ON CLIMATE CHANGE 2014 OECD Ministerial Statement on Climate Change Climate change is a major urgent
How many students study abroad and where do they go?
 1. EDUCATION LEVELS AND STUDENT NUMBERS How many students study abroad and where do they go? More than 4.1 million tertiary-level students were enrolled outside their country of citizenship in 2010. Australia,
Migration, Mobility and Integration in the European Labour Market. Lorenzo Corsini
 Migration, Mobility and Integration in the European Labour Market Lorenzo Corsini Content of the lecture We provide some insight on -The degree of differentials on some key labourmarket variables across
GOVERNANCE IN EDUCATION
 GOVERNANCE IN EDUCATION Stocktaking Governance reforms and initiatives over the last two decades Herbert Altrichter Johannes Kepler Universität Linz OVERVIEW Governance studies - concepts and analytic
BRAND. Cross-national evidence on the relationship between education and attitudes towards immigrants: Past initiatives and.
 Cross-national evidence on the relationship between education and attitudes towards immigrants: Past initiatives and future OECD directions EMPLOYER BRAND Playbook Promoting Tolerance: Can education do
Trends in international higher education
 Trends in international higher education 1 Schedule Student decision-making Drivers of international higher education mobility Demographics Economics Domestic tertiary enrolments International postgraduate
The regional and urban dimension of Europe 2020
 ESPON Workshop The regional and urban dimension of Europe 2020 News on the implementation of the EUROPE 2020 Strategy Philippe Monfort DG for Regional Policy European Commission 1 Introduction June 2010
Succinct Terms of Reference
 Succinct Terms of Reference Ex-post evaluation of the European Refugee Fund 2011 to 2013 & Ex-post evaluation of the European Refugee Fund Community Actions 2008-2010 1. SUMMARY This request for services
European patent filings
 Annual Report 07 - European patent filings European patent filings Total filings This graph shows the geographic origin of the European patent filings. This is determined by the country of residence of
INTERNAL SECURITY. Publication: November 2011
 Special Eurobarometer 371 European Commission INTERNAL SECURITY REPORT Special Eurobarometer 371 / Wave TNS opinion & social Fieldwork: June 2011 Publication: November 2011 This survey has been requested
SKILLS, MOBILITY, AND GROWTH
 SKILLS, MOBILITY, AND GROWTH Eric Hanushek Ludger Woessmann Ninth Biennial Federal Reserve System Community Development Research Conference April 2-3, 2015 Washington, DC Commitment to Achievement Growth
MINISTERIAL DECLARATION
 1 MINISTERIAL DECLARATION The fight against foreign bribery towards a new era of enforcement Preamble Paris, 16 March 2016 We, the Ministers and Representatives of the Parties to the Convention on Combating
PISA 2015 in Hong Kong Result Release Figures and Appendices Accompanying Press Release
 PISA 2015 in Hong Kong Result Release Figures and Appendices Accompanying Press Release Figure 1-7 and Appendix 1,2 Figure 1: Comparison of Hong Kong Students Performance in Science, Reading and Mathematics
Is This Time Different? The Opportunities and Challenges of Artificial Intelligence
 Is This Time Different? The Opportunities and Challenges of Artificial Intelligence Jason Furman Chairman, Council of Economic Advisers The National Academies of Sciences, Engineering, and Medicine Washington,
A comparative analysis of poverty and social inclusion indicators at European level
 A comparative analysis of poverty and social inclusion indicators at European level CRISTINA STE, EVA MILARU, IA COJANU, ISADORA LAZAR, CODRUTA DRAGOIU, ELIZA-OLIVIA NGU Social Indicators and Standard
Civil and Political Rights
 DESIRED OUTCOMES All people enjoy civil and political rights. Mechanisms to regulate and arbitrate people s rights in respect of each other are trustworthy. Civil and Political Rights INTRODUCTION The
Equality between women and men in the EU
 1 von 8 09.07.2015 13:13 Case Id: 257d6b6c-68bc-48b3-bf9e-18180eec75f1 Equality between women and men in the EU Fields marked with are mandatory. About you Are you replying to this consultation in a professional
Children, Adolescents, Youth and Migration: Access to Education and the Challenge of Social Cohesion
 Children, Adolescents, Youth and Migration: Access to Education and the Challenge of Social Cohesion Turning Migration and Equity Challenges into Opportunities UNICEF s Global Policy Initiative on Children,
Emerging Asian economies lead Global Pay Gap rankings
 For immediate release Emerging Asian economies lead Global Pay Gap rankings China, Thailand and Vietnam top global rankings for pay difference between managers and clerical staff Singapore, 7 May 2008
How do the performance and well-being of students with an immigrant background compare across countries? PISA in Focus #82
 How do the performance and well-being of students with an immigrant background compare across countries? PISA in Focus #82 How do the performance and well-being of students with an immigrant background
INVESTING IN AN OPEN AND SECURE EUROPE Two Funds for the period
 INVESTING IN AN OPEN AND SECURE EUROPE Two Funds for the 2014-20 period COMMON ISSUES ASK FOR COMMON SOLUTIONS Managing migration flows and asylum requests the EU external borders crises and preventing
Improving the accuracy of outbound tourism statistics with mobile positioning data
 1 (11) Improving the accuracy of outbound tourism statistics with mobile positioning data Survey response rates are declining at an alarming rate globally. Statisticians have traditionally used imputing
Inclusion and Gender Equality in China
 Inclusion and Gender Equality in China 12 June 2017 Disclaimer: The views expressed in this publication are those of the authors and do not necessarily reflect the views and policies of the Asian Development
South Africa - A publisher s perspective. STM/PASA conference 11 June, 2012, Cape Town Mayur Amin, SVP Research & Academic Relations
 South Africa - A publisher s perspective STM/PASA conference 11 June, 2012, Cape Town Mayur Amin, SVP Research & Academic Relations 0 As a science information company, we have a unique vantage point on
International investment resumes retreat
 FDI IN FIGURES October 213 International investment resumes retreat 213 FDI flows fall back to crisis levels Preliminary data for 213 show that global FDI activity declined by 28% (to USD 256 billion)
Visa issues. On abolition of the visa regime
 Visa issues On abolition of the visa regime In accordance with the Decree of the Government of the Republic of Kazakhstan 838 dated 23 December 2016 About the introduction of amendments and additions to
Public consultation on the EU s labour migration policies and the EU Blue Card
 Case Id: a37bfd2d-84a1-4e63-8960-07e030cce2f4 Date: 09/07/2015 12:43:44 Public consultation on the EU s labour migration policies and the EU Blue Card Fields marked with * are mandatory. 1 Your Contact
BUILDING RESILIENT REGIONS FOR STRONGER ECONOMIES OECD
 o: o BUILDING RESILIENT REGIONS FOR STRONGER ECONOMIES OECD Table of Contents Acronyms and Abbreviations 11 List of TL2 Regions 13 Preface 16 Executive Summary 17 Parti Key Regional Trends and Policies
European Parliament Eurobarometer (EB79.5) ONE YEAR TO GO UNTIL THE 2014 EUROPEAN ELECTIONS Institutional Part ANALYTICAL OVERVIEW
 ONE YEAR TO GO UNTIL THE 2014 EUROPEAN ELECTIONS Institutional Part ANALYTICAL OVERVIEW") Directorate-General for Communication Public Opinion Monitoring Unit Brussels, 21 August 2013. European Parliament Eurobarometer (EB79.5) ONE YEAR TO GO UNTIL THE 2014 EUROPEAN ELECTIONS Institutional
Directorate-General for Communication Public Opinion Monitoring Unit Brussels, 21 August 2013. European Parliament Eurobarometer (EB79.5) ONE YEAR TO GO UNTIL THE 2014 EUROPEAN ELECTIONS Institutional
Key facts and figures about the AR Community and its members
 Key facts and figures about the AR Community and its members May 2009 Key facts and figures about the AR Community and its members 1 Contents ENISA 3 THE AWARENESS RAISING COMMUNITY A SUCCESS STORY 4 THE
Factual summary Online public consultation on "Modernising and Simplifying the Common Agricultural Policy (CAP)"
") Context Factual summary Online public consultation on "Modernising and Simplifying the Common Agricultural Policy (CAP)" 3 rd May 2017 As part of its Work Programme for 2017, the European Commission committed
Context Factual summary Online public consultation on "Modernising and Simplifying the Common Agricultural Policy (CAP)" 3 rd May 2017 As part of its Work Programme for 2017, the European Commission committed
Mapping physical therapy research
 Mapping physical therapy research Supplement Johan Larsson Skåne University Hospital, Revingevägen 2, 247 31 Södra Sandby, Sweden January 26, 2017 Contents 1 Additional maps of Europe, North and South
The Belgian industrial relations system in a comparative context. David Foden Brussels, October 25th 2018
 The Belgian industrial relations system in a comparative context David Foden Brussels, October 25th 2018 Structure of presentation What is Eurofound? Key features of the Belgian IR system IR systems compared
USING, DEVELOPING, AND ACTIVATING THE SKILLS OF IMMIGRANTS AND THEIR CHILDREN
 USING, DEVELOPING, AND ACTIVATING THE SKILLS OF IMMIGRANTS AND THEIR CHILDREN 29 October 2015 Thomas Liebig International Migration Division Directorate for Employment, Labour and Social Affairs, OECD
New York County Lawyers Association Continuing Legal Education Institute 14 Vesey Street, New York, N.Y (212)
") New York County Lawyers Association Continuing Legal Education Institute 14 Vesey Street, New York, N.Y. 10007 (212) 267-6646 Who is Who in the Global Economy And Why it Matters June 20, 2014; 6:00 PM-6:50
New York County Lawyers Association Continuing Legal Education Institute 14 Vesey Street, New York, N.Y. 10007 (212) 267-6646 Who is Who in the Global Economy And Why it Matters June 20, 2014; 6:00 PM-6:50
International Egg Market Annual Review
 07 International Egg Market Annual Review Global and regional development of egg production TABLE 1 2005 COUNTRY PRODUCTION SHARE (1,000 T) (%) 2006 COUNTRY PRODUCTION SHARE (1,000 T) (%) TABLE 2 COUNTRY
The Extraordinary Extent of Cultural Consumption in Iceland
 1 Culture and Business Conference in Iceland February 18 2011 Prof. Dr. Ágúst Einarsson Bifröst University PP 1 The Extraordinary Extent of Cultural Consumption in Iceland Prof. Dr. Ágúst Einarsson, Bifröst
EUROBAROMETER 62 PUBLIC OPINION IN THE EUROPEAN UNION
 Standard Eurobarometer European Commission EUROBAROMETER 6 PUBLIC OPINION IN THE EUROPEAN UNION AUTUMN 004 Standard Eurobarometer 6 / Autumn 004 TNS Opinion & Social NATIONAL REPORT EXECUTIVE SUMMARY ROMANIA
Europe in Figures - Eurostat Yearbook 2008 The diversity of the EU through statistics
 STAT/08/75 2 June 2008 Europe in Figures - Eurostat Yearbook 2008 The diversity of the EU through statistics What was the population growth in the EU27 over the last 10 years? In which Member State is
QGIS.org - Donations and Sponsorship Analysis 2016
 QGIS.org - Donations and Sponsorship Analysis 2016 QGIS.ORG received 1128 donations and 47 sponsorships. This equals to >3 donations every day and almost one new or renewed sponsorship every week. The
2018 Social Progress Index
 2018 Social Progress Index The Social Progress Index Framework asks universally important questions 2 2018 Social Progress Index Framework 3 Our best index yet The Social Progress Index is an aggregate
UNIDEM CAMPUS FOR THE SOUTHERN MEDITERRANEAN COUNTRIES
 UNIDEM CAMPUS FOR THE SOUTHERN MEDITERRANEAN COUNTRIES Venice Commission of Council of Europe STRENGTHENING THE LEGAL CAPACITIES OF THE CIVIL SERVICE IN THE SOUTHERN MEDITERRANEAN COUNTRIES Administrations
IMPROVING THE EDUCATION AND SOCIAL INTEGRATION OF IMMIGRANT STUDENTS
 IMPROVING THE EDUCATION AND SOCIAL INTEGRATION OF IMMIGRANT STUDENTS Mario Piacentini with Name of Speaker Francesca Borgonovi and Andreas Schleicher HUMANITARIANISM AND MASS MIGRATION Los Angeles, January
Employment in the tourism industries from the perspective of the ILO. Valeria Nesterenko, International Labour Organisation
 Employment in the tourism industries from the perspective of the ILO Valeria Nesterenko, International Labour Organisation Overview Labour-intensive and fast growing sector not influenced by the crisis
HOW EQUIPPED ARE THE EUROPEAN WELFARE STATES FOR THE DIGITAL TRANSFORMATION?
 Professur für Policy Analyse und Politische Wirtschaftslehre Prof. Dr. Daniel Buhr Bildquellen: de.de; Abendblatt; zdnet Bildquellen: de.de; Abendblatt; zdnet HOW EQUIPPED ARE THE EUROPEAN WELFARE STATES
China s Aid Approaches in the Changing International Aid Architecture
 China s Aid Approaches in the Changing International Aid Architecture Mao Xiaojing Deputy Director, Associate Research Fellow Chinese Academy of International Trade and Economic Cooperation (CAITEC) MOFCOM,
PISA 2009 in Hong Kong Result Release Figures and tables accompanying press release article
 PISA 2009 in Hong Kong Result Release Figures and tables accompanying press release article Figure 1-8 and App 1-2 for Reporters Figure 1 Comparison of Hong Kong Students' Performance in Reading, Mathematics
UNDER EMBARGO UNTIL 10 APRIL 2019, 15:00 HOURS PARIS TIME. Development aid drops in 2018, especially to neediest countries
 Development aid drops in 2018, especially to neediest countries OECD Paris, 10 April 2019 OECD adopts new methodology for counting loans in official aid data In 2014, members of the OECD s Development
Upgrading workers skills and competencies: policy strategies
 Federation of Greek Industries Greek General Confederation of Labour CONFERENCE LIFELONG DEVELOPMENT OF COMPETENCES AND QUALIFICATIONS OF THE WORKFORCE; ROLES AND RESPONSIBILITIES Athens 23-24 24 May 2003
Index for the comparison of the efficiency of 42 European judicial systems, with data taken from the World Bank and Cepej reports.
 FB Index 2012 Index for the comparison of the efficiency of 42 European judicial systems, with data taken from the World Bank and Cepej reports. Introduction The points of reference internationally recognized
The impact of international patent systems: Evidence from accession to the European Patent Convention
 The impact of international patent systems: Evidence from accession to the European Patent Convention Bronwyn H. Hall (based on joint work with Christian Helmers) Why our paper? Growth in worldwide patenting
Global Economic Trends in the Coming Decades 簡錦漢. Kamhon Kan 中研院經濟所. Academia Sinica /18
 1/18 Global Economic Trends in the Coming Decades Kamhon Kan Academia Sinica 簡錦漢 中研院經濟所 2017.09.22 2/18 Global Economic Trends in the Coming Decades New top ten & new economic powers Emerging Asia Mediocre
Territorial indicators for policy purposes: NUTS regions and beyond
 Territorial indicators for policy purposes: NUTS regions and beyond Territorial Diversity and Networks Szeged, September 2016 Teodora Brandmuller Regional statistics and geographical information unit,
FIGHTING THE CRIME OF FOREIGN BRIBERY. The Anti-Bribery Convention and the OECD Working Group on Bribery
 FIGHTING THE CRIME OF FOREIGN BRIBERY The Anti-Bribery Convention and the OECD Working Group on Bribery l PARTIES TO THE ANTI-BRIBERY CONVENTION Argentina Australia Austria Belgium Brazil Bulgaria Canada
The Transmission of Economic Status and Inequality: U.S. Mexico in Comparative Perspective
 The Students We Share: New Research from Mexico and the United States Mexico City January, 2010 The Transmission of Economic Status and Inequality: U.S. Mexico in Comparative Perspective René M. Zenteno
On aid orphans and darlings (Aid Effectiveness in aid allocation by respective donor type)
") On aid orphans and darlings (Aid Effectiveness in aid allocation by respective donor type) Sven Tengstam, March 3, 2017 Extended Abstract Introduction The Paris agenda assumes that the effectiveness of
On aid orphans and darlings (Aid Effectiveness in aid allocation by respective donor type) Sven Tengstam, March 3, 2017 Extended Abstract Introduction The Paris agenda assumes that the effectiveness of
Stimulating Investment in the Western Balkans. Ellen Goldstein World Bank Country Director for Southeast Europe
 Stimulating Investment in the Western Balkans Ellen Goldstein World Bank Country Director for Southeast Europe February 24, 2014 Key Messages Location, human capital and labor costs make investing in the
GERMANY, JAPAN AND INTERNATIONAL PAYMENT IMBALANCES
 Articles Articles Articles Articles Articles CENTRAL EUROPEAN REVIEW OF ECONOMICS & FINANCE Vol. 2, No. 1 (2012) pp. 5-18 Slawomir I. Bukowski* GERMANY, JAPAN AND INTERNATIONAL PAYMENT IMBALANCES Abstract
Economic and Social Council
 United Nations ADVANCE COPY Economic and Social Council Distr.: General 10 September 2014 ECE/WG.1/2014/4 Original: English Economic Commission for Europe Working Group on Ageing Seventh meeting Geneva,
EU Innovation strategy
 EU Innovation strategy In principle fine, in particular recognising EU s limited powers Much is left to Member States, but they disappointed in Finland Good points: Links between research and markets Education
Rankings: Universities vs. National Higher Education Systems. Benoit Millot
 Rankings: Universities vs. National Higher Education Systems Benoit Millot Outline 1. Background 2. Methodology 3. Results 4. Discussion 11/8/ 2 1. Background 11/8/ 3 Clear Shift Background: Leagues focus
The Human Dimension of Globalizing Mid-Caps - as Seen by their Leaders. Welcome to the Flight Deck»
 Welcome to the Flight Deck A Global C-Suite Study The Human Dimension of Globalizing Mid-Caps - as Seen by their Leaders Chapter 6 Becoming the Carrier of Choice A Culture of Innovation Introduction This
3. Sustainable Development
 3. Sustainable Development 3.1. Gini index in ASEM countries (2012) 0 10 20 30 40 50 Philippines Russian Federation Thailand Viet Nam Lao PDR Greece Portugal Bulgaria Spain Latvia Italy Lithuania Luxembourg
Markets in higher education
 Markets in higher education Simon Marginson Institute of Education (IOE) Conference on The State and Market in Education: Partnership or Competition? The Grundtvig Study Centre Aarhus University and LLAKES,
Putting the Experience of Chinese Inventors into Context. Richard Miller, Office of Chief Economist May 19, 2015
 Putting the Experience of Chinese Inventors into Context Richard Miller, Office of Chief Economist May 19, 2015 Outline Data and Methods Growth in PTO Filings Focus on foreign co-invention Patent examination