October 16, Whittier Union High School District Introduction to Districting
|
|
|
- Raymond Allison
- 5 years ago
- Views:
Transcription

1 Whittier Union High School District Introduction to Districting
 boundaries Respect voters choices / continuity in office Traditional Redistricting Principles Planned future")
2 Districting Rules 2 Federal Laws Equal Population Federal Voting Rights Act No Racial Gerrymandering Communities of interest Compact Contiguous Visible (Natural & man-made) boundaries Respect voters choices / continuity in office Traditional Redistricting Principles Planned future growth
3 3 Demographic Summary Latinos are 73% of the total population and 68% of the eligible voters (measured by Citizen Voting Age Population data). Asian-Americans are 4% of eligible voters, Non- Hispanic Whites are 20%, and African-Americans are 1%. Each of the 5 trustee areas will have about 43,639 residents. Category Field Count Pct Category Field Count Pct Total Pop 218,195 ACS Pop. Est. Total 226,378 Hisp 160,221 73% age ,305 27% Total Pop NH White 42,887 20% Age age ,376 55% NH Black 3,113 1% age60plus 39,696 18% Asian-American 9,775 4% immigrants 53,449 24% Immigration Total 148,950 naturalized 29,989 56% Citizen Voting Age Pop Voter Registration (Nov 2016) Voter Turnout (Nov 2016) Voter Turnout (Nov 2014) Hisp 102,006 68% english 98,670 47% NH White 33,935 23% Language spoken at spanish 101,358 48% NH Black 2,748 2% home asian-lang 7,662 4% Asian/Pac.Isl. 8,611 6% other lang 4,044 2% Total 117,965 Language Fluency Speaks Eng. "Less than Very Well" 41,513 20% Latino est. 83,623 71% hs-grad 88,103 60% Education (among Spanish-Surnamed 75,121 64% bachelor 18,595 13% those age 25+) Asian-Surnamed 2,789 2% graduatedegree 9,270 6% Filipino-Surnamed 1,795 2% Child in Household child-under18 22,342 35% NH White est. 27,543 23% Pct of Pop. Age 16+ employed 102,036 57% NH Black 1,384 1% income 0-25k 10,610 17% Total 80,919 income 25-50k 13,315 21% Latino est. 57,013 70% Household Income income 50-75k 12,152 19% Spanish-Surnamed 51,217 63% income k 24,833 39% Asian-Surnamed 1,767 2% income 200k-plus 3,174 5% Filipino-Surnamed 1,206 1% single family 51,691 77% NH White est. 19,445 24% multi-family 15,046 23% Housing Stats NH Black 937 1% rented 23,246 36% Total 32,136 owned 40,838 64% Latino est. 18,061 56% Spanish-Surnamed 16,250 51% Asian-Surnamed 785 2% Filipino-Surnamed 378 1% NH White est. 12,219 38% NH Black est %

4 4 Latino Concentrations Latino eligible voters are a significant majority everywhere in the District except in the north Whittier hills and the far southeast.
5 Defining Communities of Interest 5 1 st Question: what is your neighborhood or community of interest? A Community of Interest is generally defined as a neighborhood or community of shared interests, views, problems, or characteristics. Possible community feature/boundary definitions include: School attendance areas Natural neighborhood dividing lines, such as highway or major roads, rivers, canals, and/or hills Areas around parks and other neighborhood landmarks Common issues, neighborhood activities, or legislative/election concerns Shared demographic characteristics Such as similar levels of income, education, or linguistic isolation 2 nd Question: Does a Community of Interest want to be united in one district, or to be divided to have a voice in multiple elections?
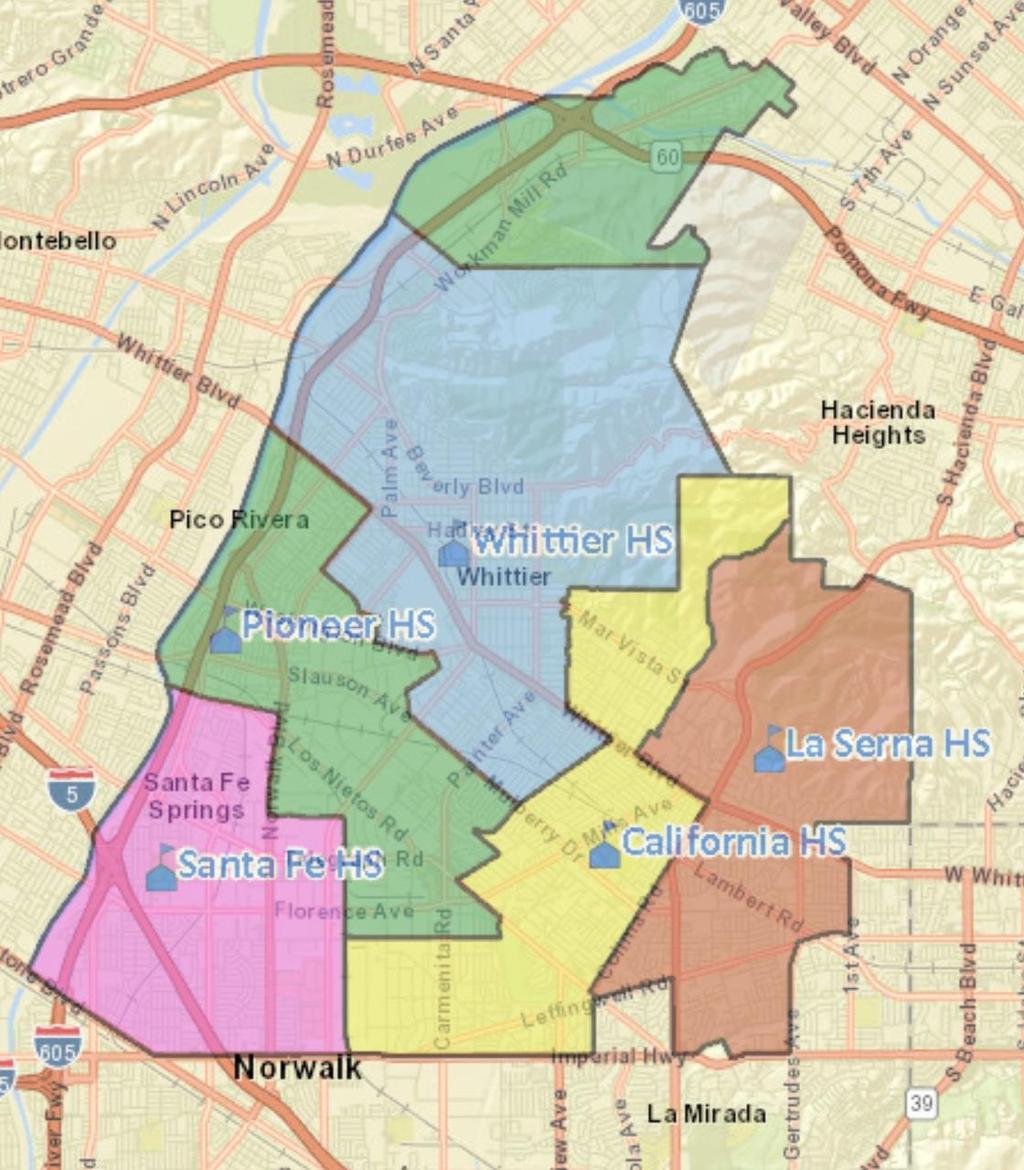
6 6 Attendance Zones


7 Sample Compact Maps 7 Compton Glendale Unified Examples of highly compact maps, with nooks and jogs driven only by equal population requirements.

 or rural")
, led to policy-driven")
8 Sample Multiple-Representative Maps 8 Pasadena Colorado Blvd. Examples of maps where a desire to have all members touch downtown (Pasadena) or rural areas (Central), or as many neighborhoods as possible (South Pas), led to policy-driven but non-compact maps. Central Unified

9 Public Hearing & Discussion 9 1. What is your neighborhood or community of interest? 2. Do you prefer your neighborhood be kept together in one trustee area or to have multiple representatives? 3. What are other communities of interest in the District that should be considered when drafting maps?
CITY OF VALLEJO SPECIAL CITY COUNCIL MEETING: ACTION ITEM A. City of Vallejo Districting Criteria and Process
 CITY OF VALLEJO SPECIAL CITY COUNCIL MEETING: ACTION ITEM A City of Vallejo Districting Criteria and Process December 19, 2018 Election Systems 2 1. At Large 2. From District or Residence Districts 3.
December 12, City of Oxnard Consideration of By-District Elections
 December 12, 2017 City of Oxnard Consideration of By-District Elections Project Timeline 2 Date December 12 January 3 January 5 No later than January 10 January 17 January 29 February 7 February 20 February
City of Placentia By-District Elections Briefing. February 6, 2018
 www.drawplacentia.org City of Placentia By-District Elections Briefing Tentative Project Timeline 2 Date February 6 February 20 March 11 No later than March 13 March 20 Event 1 st hearing: gather public
December 12, City of Oxnard Consideration of By-District Elections
 December 12, 2017 City of Oxnard Consideration of By-District Elections Project Timeline 2 Date December 12 January 3 January 5 No later than January 10 January 17 January 29 February 7 February 20 February
October 17, Lompoc 2017 Districting Initial Hearings
 Lompoc 2017 Districting Initial Hearings Lompoc is not alone facing CVRA 2 Switched (or in the process of switching) as a result of CVRA: At least 157 school districts 28 Community College Districts More
May 9, City of South San Francisco 2018 Districting Initial Hearings
 City of South San Francisco 2018 Districting Initial Hearings South SF is not alone facing CVRA 2 Switched (or in the process of switching) as a result of CVRA: At least 165 school districts 28 Community
October 30, City of Menlo Park Introduction to Election Systems
 October 30, 2017 City of Menlo Park Introduction to Election Systems California Voting Rights Act Impact 2 Switched (or in the process of switching) as a result of California Voting Rights Act challenges:
Legal & Policy Criteria Governing Establishment of Districts
 Legal & Policy Criteria Governing Establishment of Districts A Presentation by: Sean Welch Nielsen Merksamer Parrinello Gross & Leoni, LLP to the City of Martinez January 10, 2018 City of Martinez Establishment
City of LEMOORE CALIFORNIA. Staff Report
 City of LEMOORE CALIFORNIA 711 West Cinnamon Drive Lemoore, California 93245 (559) 924-6700 Fax (559) 924-9003 Staff Report To: Lemoore City Council From: Nathan Olson, Interim City Manager Date: January
Sweetwater Union High School District Demographic and Districting Introduction
 Sweetwater Union High School District Demographic and Districting Introduction Douglas Johnson, President National Demographics Corporation (NDC) 2 District General Demographics 2008 2012 American Community
4/23/2018. CCAC Annual Conference April 19, a.m. 12 p.m. Break w/ Exhibitors 10 a.m. 10:30 a.m.
 CALIFORNIA VOTING RIGHTS ACT TRANSITIONING FROM AT LARGE TO BY DISTRICT ELECTIONS: A PRACTICAL GUIDE FOR CITY CLERKS SPEAKERS DOUG JOHNSON, PRINCIPAL, NATIONAL DEMOGRAPHICS CORP. SHALICE TILTON, MMC, NDC
ORDINANCE NO WHEREAS, the Town currently elects five Council Members using an at large election system; and
 ORDINANCE NO. 278 AN ORDINANCE OF THE TOWN COUNCIL OF THE TOWN OF YUCCA VALLEY, CALIFORNIA, ADOPTING AMENDMENTS TO TITLE 2, CHAPTER 2.05, PART II OF THE MUNICIPAL CODE OF THE TOWN OF YUCCA VALLEY TO ESTABLISH
Item 10A 1 of 37
 MEETING DATE: 9/06/17 PREPARED BY: Christopher Skinnell, Special Counsel via City Attorney s Office Risk Dept. Manager DEPARTMENT: City Attorney CITY MANAGER: Karen Brust SUBJECT: District-Based Elections/composition
Sequoia Union High School District Districting Public Forums
 Sequoia Union High School District Districting Public Forums October 20, 25, 26, 2016 Douglas Johnson, President National Demographics Corporation (NDC) Election Systems 2 1. At Large Candidates can reside
City of Rancho Cucamonga Presentation of Draft Maps
 City of Rancho Cucamonga Presentation of Draft Maps Douglas Johnson, President Justin Levitt, Vice President Proposed Transition Timeline 2 Date Event March 16 March 25 April 4 Council Hearing. Council
City of Redlands Introduction to 2016 Districting
 City of Redlands Introduction to 2016 Districting Douglas Johnson, President Justin Levitt, Vice President Election Systems 2 1. At Large Candidates can reside anywhere in the jurisdiction All voters vote
ORDINANCE NO AN ORDINANCE OF THE CITY COUNCIL OF THE CITY OF HESPERIA, CALIFORNIA, ADDING A NEW CHAPTER 1. 09
 ORDINANCE NO. 207-09 AN ORDINANCE OF THE CITY COUNCI OF THE CITY OF HESPERIA, CAIFORNIA, ADDING A NEW CHAPTER. 09 TO THE HESPERIA MUNICIPA CODE TO CHANGE THE SYSTEM OF EECTIONS FOR MEMBERS OF THE CITY
Request to Change Election System without an Election Election Waiver Ed. Code, 72036
 STATE OF CALIFORNIA CALIFORNIA COMMUNITY COLLEGES CHANCELLOR S OFFICE 1102 Q STREET SACRAMENTO, CA 95811-6549 (916) 445-8752 HTTP://WWW.CCCCO.EDU Request to Change Election System without an Election Election
Robert McEntire, Chief Business and Financial Officer
 GLENDALE UNIFIED SCHOOL DISTRICT May 24, 2016 ACTION REPORT NO. 1 TO: FROM: SUBMITTED BY: SUBJECT: Board of Education Winfred B. Roberson, Jr., Superintendent Robert McEntire, Chief Business and Financial
July 19, Washington Unified 2018 Districting
 Washington Unified 2018 Districting Project Timeline 2 Date June 14 June 20 June 28 No later than July 12 July 19 August 22 August 23 September 5 September 13 September 19 September 27 TBD Event 1 st hearing:
The California Voting Rights Act: Recent Legislation & Litigation Outcomes
 The California Voting Rights Act: Recent Legislation & Litigation Outcomes Prepared By: James L. Markman Youstina N. Aziz Dr. Douglas Johnson May 3, 2018 League of California Cities: City Attorneys Spring
City of Oakland 2013 Redistricting Town Hall forum
 City of Oakland 2013 Redistricting Town Hall forum 6/6/2013 Agenda 1. Welcome & Introductions 2. Why Redistricting is important 3. Presentation on Redistricting Process 4. How to get involved 5. Group
El Monte Union High School District Introduction to the California Voting Rights Act & Districting
 El Monte Union High School District Introduction to the California Voting Rights Act & Districting Douglas Johnson, President National Demographics Corporation (NDC) CVRA Statewide Impact 2 Switched (or
RESOLUTION NO BEFORE THE BOARD OF TRUSTEES OF THE POWAY UNIFIED SCHOOL DISTRICT SAN DIEGO COUNTY, CALIFORNIA
 RESOLUTION NO. 28-2018 BEFORE THE BOARD OF TRUSTEES OF THE POWAY UNIFIED SCHOOL DISTRICT SAN DIEGO COUNTY, CALIFORNIA RESOLUTION ADOPTING A MAP OF PROPOSED TRUSTEE AREAS, AND RECOMMENDING THAT THE SAN
APPENDIX G DEMOGRAPHICS
 APPENDIX G DEMOGRAPHICS Analyzing current and past demographic data is an important step in defining future transportation needs for individuals living and working in the PPUATS Metropolitan Planning Area.
IUSD ELECTORAL PROCESS UNDER CONSIDERATION. May 8, 2018
 IUSD ELECTORAL PROCESS UNDER CONSIDERATION May 8, 2018 No Impact on School Attendance Areas The election method for the members of the IUSD Board of Education has no impact on school district or student
City Council Election System Changes Project. CVRA Community Input Workshop
 City Council Election System Changes Project CVRA Presentation Overview» Project Overview» Small Group Exercise Method to elect the mayor Factors to consider when drawing districts» Opportunities for Public
Redistricting 101 Why Redistrict?
 Redistricting 101 Why Redistrict? Supreme Court interpretation of the U.S. Constitution, specifically: - for Congress, Article 1, Sec. 2. and Section 2 of the 14 th Amendment - for all others, the equal
IUSD ELECTORAL PROCESS UNDER CONSIDERATION. March 27, 2018
 IUSD ELECTORAL PROCESS UNDER CONSIDERATION March 27, 2018 No Impact on School Attendance Areas The election method for the members of the IUSD Board of Education has no impact on school or district student
TX RACIAL GERRYMANDERING
 TX RACIAL GERRYMANDERING https://www.texastribune.org/2018/04/23/texas-redistricting-fight-returns-us-supreme-court/ TX RACIAL GERRYMANDERING https://www.texastribune.org/2018/04/23/texas-redistricting-fight-returns-us-supreme-court/
California s Congressional District 37 Demographic Sketch
 4.02.12 California s Congressional District 37 Demographic Sketch MANUEL PASTOR JUSTIN SCOGGINS JARED SANCHEZ Purpose Demographic Sketch Understand the Congressional District s population and its unique
REDISTRICTING FUN U DA D M A EN E TA T L A S L
 REDISTRICTING FUNDAMENTALS 2011 The Census & Redistricting Intro A. What is the Census? B. Results for the state of Arizona, Latino population in AZ/U.S. I. Federal Guidelines for Redistricting A. Equal
Elections by Trustee Area Informational Session on Transition to Trustee Areas. June 25-26, 2018
 Elections by Trustee Area Informational Session on Transition to Trustee Areas June 25-26, 2018 California Voting Rights Act In 2002, Governor Gray Davis signed the California Voting Rights Act of 2001
MORE SPANISH- SURNAMED VOTERS PARTICIPATED IN THE 2016 ELECTION THAN EVER IN THE 3RD LARGEST COUNTY IN THE NATION
 MORE SPANISH- SURNAMED VOTERS PARTICIPATED IN THE 2016 ELECTION THAN EVER IN THE 3RD LARGEST COUNTY IN THE NATION 1 About Presentation The charts and tables in this presentation are based on raw data extracted
February 1, William T Fujioka, Chief Executive Officer. Dean C. Logan, Registrar-Recorder/County Clerk
 January 31, 2012 Page 1 of 13 TO: Supervisor Zev Yaroslavsky, Chair Supervisor Gloria Molina Supervisor Mark Ridley-Thomas Supervisor Don Knabe Supervisor Michael D. Antonovich William T Fujioka, Chief
East Kootenay A Regional District in British Columbia
 Produced by Stats for Global Non-Response Rate: 35.5 Population Total Immigrants Change in Change in Immigrants Population Number Percent Population Number Percent 1991 52,368 5,9 11.3 1991 to 1996 3,998-55
Strathcona A Regional District in British Columbia
 Produced by Stats for Population Total Immigrants Change in Change in Immigrants Population Number Percent Population Number Percent 1991 - - - 1991 to 1996 - - - 1996 - - - 1996 to 1 - - - 1 - - - 1 to
CHANGING DEMOGRAPHICS AND IMMIGRATION POLITICS IN COLORADO. June 25, 2014
 CHANGING DEMOGRAPHICS AND IMMIGRATION POLITICS IN COLORADO June 25, 2014 Latino influence in Colorado Demographic trends Participation and party competition Immigration Politics The Colorado Population
Powell River A City in Powell River Regional District
 A City in Regional District Produced by Stats for Population Total Immigrants Change in Change in Immigrants Population Number Percent Population Number Percent 1991 12,991 1,965 15.1 1991 to 1996 14 4
Redistricting Overview San Mateo County Harbor District
 89 REDISTRICTING,~,tt PARTNERS Redistricting Overview San Mateo County Harbor District Overview of District and application of State/Federal voting rights acts 1 What is Districting Definition Districting
Introduction to the California Voting Rights Act (CVRA) Peter Fagen, F3 Larry Ferchaw, CS James Ayden, F3 July 24, 2017
 Peter Fagen, F3 Larry Ferchaw, CS James Ayden, F3 July 24, 2017") Introduction to the California Voting Rights Act (CVRA) Peter Fagen, F3 Larry Ferchaw, CS James Ayden, F3 July 24, 2017 1 Purpose of Discussion Introduction to CVRA Discuss where District stands Next Steps
Introduction to the California Voting Rights Act (CVRA) Peter Fagen, F3 Larry Ferchaw, CS James Ayden, F3 July 24, 2017 1 Purpose of Discussion Introduction to CVRA Discuss where District stands Next Steps
Case 5:11-cv OLG-JES-XR Document 649 Filed 02/13/12 Page 1 of 9
 Case 5:11-cv-00360-OLG-JES-XR Document 649 Filed 02/13/12 Page 1 of 9 IN THE UNITED STATES DISTRICT COURT FOR THE WESTERN DISTRICT OF TEXAS SAN ANTONIO DIVISION SHANNON PEREZ, et al., Plaintiffs and EDDIE
Presentation to the Orange County Committee on School District Organization
 Presentation to the Orange County Committee on School District Organization August 16, 2017 Dr. Gregory Franklin, Superintendent Peter Fagen, Fagen Friedman & Fulfrost Jonathan Salt, Fagen Friedman & Fulfrost
Quesnel A City in Cariboo Regional District
 Produced by Stats for Global NonResponse Rate:.4 Population Total Immigrants Change in Change in Immigrants Population Number Percent Population Number Percent 1991 8,8 1,35 16.4 1991 to 1996 26 5.4 1996
POLITICAL LEADERSHIP AND THE LATINO VOTE By NALEO Educational Fund
 POLITICAL LEADERSHIP AND THE LATINO VOTE By NALEO Educational Fund Already the second largest population group in the United States, the American Latino community continues to grow rapidly. Latino voting,
CIRCLE The Center for Information & Research on Civic Learning & Engagement
 FACT SHEET CIRCLE The Center for Information & Research on Civic Learning & Engagement The Youth Vote 2004 By Mark Hugo Lopez, Emily Kirby, and Jared Sagoff 1 July 2005 Estimates from all sources suggest
The Youth Vote in 2008 By Emily Hoban Kirby and Kei Kawashima-Ginsberg 1 Updated August 17, 2009
 The Youth Vote in 2008 By Emily Hoban Kirby and Kei Kawashima-Ginsberg 1 Updated August 17, 2009 Estimates from the Census Current Population Survey November Supplement suggest that the voter turnout rate
CHANGING DEMOGRAPHICS AND IMMIGRATION POLITICS IN ARIZONA. March 4, 2014
 CHANGING DEMOGRAPHICS AND IMMIGRATION POLITICS IN ARIZONA March 4, 2014 Latino influence in Arizona Demographic trends Participation and party competition Immigration Politics The Arizona Population Today
THE 2004 YOUTH VOTE MEDIA COVERAGE. Select Newspaper Reports and Commentary
 MEDIA COVERAGE Select Newspaper Reports and Commentary Turnout was up across the board. Youth turnout increased and kept up with the overall increase, said Carrie Donovan, CIRCLE s young vote director.
Why disaggregate data on U.S. children by immigrant status? Some lessons from the diversitydatakids.org project
 Why disaggregate data on U.S. children by immigrant status? Some lessons from the diversitydatakids.org project Dolores Acevedo-Garcia, PhD, MPA-URP Samuel F. and Rose B. Gingold Professor of Human Development
North Okanagan A Regional District in British Columbia
 Population Total Immigrants Change in Change in Immigrants Population Number Percent Population Number Percent 1991 61,744 7,855 12.7 1991 to 1996 9,863 685 8.7 1996 71,67 8,54 11.9 1996 to 1 1,6-28 -
COSSA Colloquium on Social and Behavioral Science and Public Policy
 COSSA Colloquium on Social and Behavioral Science and Public Policy Changes Regarding Race in America : The Voting Rights Act and Minority communities John A. Garcia Director, Resource Center for Minority
Current Kansas Polling
 Current Kansas Polling Results for October 20 October 21, 2014 Contact: Doug Kaplan, 407-242-1870 Executive Summary Gravis Marketing, a nonpartisan research firm, conducted a random survey of 1,124 registered
Lake Country A District Municipality in Central Okanagan Regional District
 Produced by Stats for Population Total Immigrants Change in Change in Immigrants Population Number Percent Population Number Percent 1991 1991 to 1996 1996 9,7 1,275 14.2 1996 to 1 26 7 5.5 1 9,267 1,345
Linda C. Luna, Superintendent. DISTRICT OFFICE 930 Westacre Road West Sacramento, CA 95691
 July 10, 2018 Re: Changes To School Board Elections - California Voting Rights Act (CVRA) Dear Parents and Guardians of the Washington Unified School District: We hope that this letter finds you well and
Update to the visible minority classification - a quick overview of the project
 Update to the visible minority classification - a quick overview of the project www.statcan.gc.ca Telling Canada s story in numbers Measuring identity, diversity and inclusion in Canada @ 150 and beyond
TRENDS IN IMMIGRATION AND MIGRATION OF ENGLISH AND DUAL LANGUAGE LEARNERS
 TRENDS IN IMMIGRATION AND MIGRATION OF ENGLISH AND DUAL LANGUAGE LEARNERS Randy Capps IOM/NRC Committee on Fostering School Success for English Learners: Toward New Directions in Policy, Practice, and
Voter Turnout by Income 2012
 American democracy is challenged by large gaps in voter turnout by income, age, and other factors. Closing these gaps will require a sustained effort to understand and address the numerous and different
Case 5:11-cv OLG-JES-XR Document Filed 06/09/14 Page 1 of 17 EXHIBIT C
 Case 5:11-cv-00360-OLG-JES-XR Document 1065-3 Filed 06/09/14 Page 1 of 17 EXHIBIT C Case 5:11-cv-00360-OLG-JES-XR Document 1065-3 Filed 06/09/14 Page 2 of 17 Case 5:11-cv-00360-OLG-JES-XR Document 1065-3
Share of Children of Immigrants Ages Five to Seventeen, by State, Share of Children of Immigrants Ages Five to Seventeen, by State, 2008
 Figure 1.1. Share of Children of Immigrants Ages Five to Seventeen, by State, 1990 and 2008 Share of Children of Immigrants Ages Five to Seventeen, by State, 1990 Less than 10 percent 10 to 19 percent
Case 5:11-cv OLG-JES-XR Document 664 Filed 02/20/12 Page 1 of 6
 Case 5:11-cv-00360-OLG-JES-XR Document 664 Filed 02/20/12 Page 1 of 6 IN THE UNITED STATES DISTRICT COURT FOR THE WESTERN DISTRICT OF TEXAS SAN ANTONIO DIVISION SHANNON PEREZ, et al., Plaintiffs, v. CIVIL
(Note: These are inititial neighbourhood estimates and are subject to change.) NEI Score. 1,000 Female 52%
 NEI Score. 1,000 Female 52%") 0-4 5-9 10-14 15-19 20-24 25-29 30-34 35-39 40-44 45-49 50-54 55-59 60-64 65-69 70-74 75-79 80-84 85-89 90-94 95-99 100+ 2011 Neighbourhood Demographic Estimates EGLINTON AVE E C P R DON VALLEY PARKWAY
0-4 5-9 10-14 15-19 20-24 25-29 30-34 35-39 40-44 45-49 50-54 55-59 60-64 65-69 70-74 75-79 80-84 85-89 90-94 95-99 100+ 2011 Neighbourhood Demographic Estimates EGLINTON AVE E C P R DON VALLEY PARKWAY
This Could Be the Start of Something Big: Looking for the New America
 This Could Be the Start of Something Big: Looking for the New America Manuel Pastor January 2011 La Conyuntura vs. the Long-run We tend to think about short-term politics and economics... 1 La Conyuntura
Nanaimo A City in Nanaimo Regional District
 A City in Regional District Produced by Stats for Population Total Immigrants Change in Change in Immigrants Population Number Percent Population Number Percent 1991 6,129 8,885 14.8 1991 to 1996,1 2,44
PROTECTING CALIFORNIA S DEMOCRACY: ENSURING COMPLIANCE WITH FEDERAL AND STATE BILINGUAL VOTING ASSISTANCE LAWS
 PROTECTING CALIFORNIA S DEMOCRACY: ENSURING COMPLIANCE WITH FEDERAL AND STATE BILINGUAL VOTING ASSISTANCE LAWS For more information, contact Eugene Lee, Voting Rights Project Director, Asian Pacific American
Saanich A District Municipality in Capital Regional District
 Produced by Stats for Population Total Immigrants Change in Change in Immigrants Population Number Percent Population Number Percent 1991 95,583 20,285 21.2 1991 to 1996 5,805 755 3.7 1996 101,388 21,040
The California Voting Rights Act
 The California Voting Rights Act A Presentation by: Chris Skinnell Nielsen Merksamer Parrinello Gross & Leoni, LLP for The City of San Rafael November 20, 2017 The California Voting Rights Act 1 The California
A Glance at THE LATINO VOTE IN Clarissa Martinez De Castro
 A Glance at THE LATINO VOTE IN 2016 Clarissa Martinez De Castro The Landscape 2 Latino voter growth continues. Latinos are a key factor in winning equation for White House and many state races, but investments/outreach
Introduction... i. Population Family Structure Education Mobility Status... 7
 Table of Contents Introduction... i Population... 2 Family Structure... 5 Education... 6 Mobility Status... 7 ward two Ethnicity, Language, Immigrants and Visible Minority... 9 Labour Force Characteristics...13
In the United States District Court for the Western District of Texas
 Case 5:11-cv-00360-OLG-JES-XR Document 1494 Filed 07/14/17 Page 1 of 9 In the United States District Court for the Western District of Texas SHANNON PEREZ, ET AL. v. GREG ABBOTT, ET AL. SA-11-CV-360 QUESTIONS
Castlegar A City in Central Kootenay Regional District
 Produced by Stats for Population Total Immigrants Change in Change in Immigrants Population Number Percent Population Number Percent 1991 6,579 885 13.5 1991 to 1996 448 45 5.1 1996 7,27 93 13.2 1996 to
Burnaby A City in Greater Vancouver Regional District
 Produced by Stats for Global Non-Response Rate: 23.6 Population Total Change in Change in Population Number Percent Population Number Percent 1991 158,858 49,5 31.2 1991 to 1996,351 24,5 49.1 1996 179,9
DATA PROFILES OF IMMIGRANTS IN THE DISTRICT OF COLUMBIA
 DATA PROFILES OF IMMIGRANTS IN THE DISTRICT OF COLUMBIA LATINO IMMIGRANTS Demographics Economic Opportunity Education Health Housing This is part of a data series on immigrants in the District of Columbia
Update on OFA Grassroots Organizing: Voter Registration and Early Voting
 October 11, 2012 MEMORANDUM TO INTERESTED PARTIES RE: TO: FROM: Update on OFA Grassroots Organizing: Voter Registration and Early Voting Interested Parties Jeremy Bird, Obama for America National Field
Skeena-Queen Charlotte A Regional District in British Columbia
 Global NonResponse Rate: 34.7 Population Total Immigrants Change in Change in Immigrants Population Number Percent Population Number Percent 1991 24,287 3,125 12.9 1991 to 1996 58 27 8.6 1996 24,795 2,855
Parksville A City in Nanaimo Regional District
 Produced by Stats for Global NonResponse Rate: 2.3 Population Total Immigrants Change in Change in Immigrants Population Number Percent Population Number Percent 1991 7,381 1,27 17.2 1991 to 1996 2,91
Environmental Justice Demographic Profile
 CENTRAL PUGET SOUND REGION Environmental Justice Demographic Profile January 2016 Contents INTRODUCTION... 3 OBJECTIVES... 4 DEFINITIONS... 4 Minority Populations... 4 Low-Income Population... 4 Other
Institute for Public Policy and Economic Analysis
 Institute for Public Policy and Economic Analysis The Institute for Public Policy and Economic Analysis at Eastern Washington University will convey university expertise and sponsor research in social,
Inside the 2012 Latino Electorate
 June 3, 2013 Mark Hugo Lopez, Associate Director Ana Gonzalez-Barrera, Research Associate FOR FURTHER INFORMATION CONTACT: Pew Hispanic Center 1615 L St, N.W., Suite 700 Washington, D.C. 20036 Tel(202)
Gentrification: A Recent History in Metro Denver
 Gentrification: A Recent History in Metro Denver RESEARCH POWERED BY OVERVIEW This report examines the relationship between metro Denver s history of redlining and recent gentrification trends in the region
(Note: These are inititial neighbourhood estimates and are subject to change.) C P R. NEI Score. 600 Female 51%
 C P R. NEI Score. 600 Female 51%") 0-4 5-9 10-14 15-19 20-24 25-29 30-34 35-39 40-44 45-49 50-54 55-59 60-64 65-69 70-74 75-79 80-84 85-89 90-94 95-99 100+ 2011 Neighbourhood Demographic Estimates STEELES AVE W FENMAR DR C P R GARYRAY DR
0-4 5-9 10-14 15-19 20-24 25-29 30-34 35-39 40-44 45-49 50-54 55-59 60-64 65-69 70-74 75-79 80-84 85-89 90-94 95-99 100+ 2011 Neighbourhood Demographic Estimates STEELES AVE W FENMAR DR C P R GARYRAY DR
NABPAC 2016 Biennial Post Election Conference
 The National Association of Business Political Action Committees 2016 NABPAC Post Election Conference NABPAC 2016 Biennial Post Election Conference PRESENTED BY: Hans Kaiser, Moore Information November
Implementing Trustee Area Elections: Procedural & Substantive Considerations
 Implementing Trustee Area Elections: Procedural & Substantive Considerations A Presentation by: Chris Skinnell Nielsen Merksamer Parrinello Gross & Leoni, LLP to the San Diego County Board of Education
Colorado Secretary of State Toni Larson League of Women Voters of Colorado 1410 Grant, Suite B204, Denver, Co Toni.Larsongmail.
 2017-2018 #50 Amended Draft Proposed statutory initiative concerning Designated Rcprcscntativ Kathleen Curry RECEIVED 5wP 54542 US Highway 50, Gunnison, CO 81230 2 27 970 209 5537 kathleencurry@rnontrose.net
Baseline Survey Results
 3 Baseline Survey Results RETHINKING I-94 2017 Baseline Survey Key Takeaways Rabbit Prepared for MnDOT, Rethinking I-94 Key Considerations Trend comparisons across both years (2016 and 2017) need to be
Case 1:11-cv DLI-RR-GEL Document 182 Filed 03/05/12 Page 1 of 1 PageID #: 2214
 Case 1:11-cv-05632-DLI-RR-GEL Document 182 Filed 03/05/12 Page 1 of 1 PageID #: 2214 Via ECF Magistrate Judge Roanne L. Mann United States District Court 225 Cadman Plaza East Brooklyn, New York 11201
Data Models. 1. Data REGISTRATION STATUS VOTING HISTORY
 Cambridge Analytica offers a range of enhanced audience segments drawn from our national database of over 220 million Americans. These segments can be used individually or together to power highly targeted
May 11, I. Breach of the Settlement Agreement
 National Headquarters MALDEF Nonprofit Center 634 S. Spring Street, 12 th Fl. Los Ángeles, CA 90014 TEL: 213.629.2512 Fax: 213.629.0266 Atlanta Program Office 500 West Lanier Avenue Suite 908 Fayetteville,
New Americans in Houston
 New Americans in Houston A Snapshot of the Demographic and Economic Contributions of Immigrants in the Metro Area POPULATION 6.8M.6M Total population in 06 Immigrant population.% Immigrant share of the
Language Minorities & The Right to Vote KEY PROTECTIONS UNDER THE VOTING RIGHTS ACT
 Language Minorities & The Right to Vote KEY PROTECTIONS UNDER THE VOTING RIGHTS ACT INTRODUCTION The path to ensuring all eligible voters in the United States have a political voice at the polls has been
Salmon Arm A City in Columbia-Shuswap Regional District
 Produced by Stats for Global NonResponse Rate: 22.8 Population Total Change in Change in Population Number Percent Population Number Percent 1991 12,115 1,365 11.3 1991 to 1996 2,549 25 18.3 1996 14,664
DEMOGRAPHIC PROFILE Skagit County, Washington. Prepared by: Skagit Council of Governments 204 West Montgomery Street, Mount Vernon, WA 98273
 DEMOGRAPHIC PROFILE 2013 Skagit County, Washington Prepared by: Skagit Council of Governments 204 West Montgomery Street, Mount Vernon, WA 98273 CONTENTS TABLE OF CONTENTS Introduction... 1 Persons and
The Latino Electorate in 2010: More Voters, More Non-Voters
 April 26, 2011 The Latino Electorate in 2010: More Voters, More Non-Voters Mark Hugo Lopez, Associate Director FOR FURTHER INFORMATION CONTACT: Pew Hispanic Center 1615 L St, N.W., Suite 700 Washington,
Title VI & Environmental Justice Plan
 Corvallis Area Metropolitan Planning Organization Title VI & Environmental Justice Plan Compliance with Federal Requirements under 49 CFR Part 21 and 23 CFR Part 200 Corvallis Area Metropolitan Planning
How The Mountain West States Voted In 2016: A Post-Election Analysis of Trends, Demographics, and Politics in America s New Swing Region
 Lectures/Events (BMW) Brookings Mountain West 11-15-2016 How The Mountain West States Voted In 2016: A Post-Election Analysis of Trends, Demographics, and Politics in America s New Swing Region William
Selected National Demographic Trends
 Selected National Demographic Trends Tawara D. Goode Director, Georgetown University National Center for Cultural Competence Assistant Professor, Center for Child and Human Development Spring 2016 University
Communities of Color Coalition on City Council Redistricting
 Communities of Color Coalition on City Council Redistricting Boston Chinatown Neighborhood Center, Castle Square Tenants Organization, Chinatown Resident Association, Chinese Progressive Association &
Analyzing Absentee Ballots Cast In San Diego Mayoral Special Election
 Analyzing Absentee Ballots Cast In San Diego Mayoral Special Election Executive Summary Early voting in the San Diego mayoral special election began on October 21 st, and since that time, more than 110,000
Keelesdale-Eglinton West
 BLACK CREEK DR 0-4 5-9 10-14 15-19 20-24 25-29 30-34 KEELE ST 35-39 40-44 45-49 50-54 -59 KANE AVE 60-64 65-69 70-74 75-79 80-84 85-89 90-94 95-99 100+ 2011 Neighbourhood Demographic Estimates EGLINTON
Building a Redistricting Database. By Kimball Brace Election Data Services, Inc.
 Building a Redistricting Database By Kimball Brace Election Data Services, Inc. Raise Your Hand If You: Have agreed to participate in Census Phase 2? Have collected current precincts maps for every county/town