Disruptive Demographics: Implications for Higher Education Institutions
|
|
|
- Tyler Holmes
- 5 years ago
- Views:
Transcription
1 Disruptive Demographics: Implications for Higher Education Institutions James H. Johnson, Jr. Frank Hawkins Kenan Ins<tute of Private Enterprise Kenan- Flagler Business School University of North Carolina at Chapel Hill September 2015
2 OVERVIEW Demographic Trends Challenges & Opportuni<es Discussion
3 what CENSUS 2010 will REVEAL September 2015

4
5 6 DISRUPTIVE TRENDS The South Rises Again The Browning of America Marrying Out is In The Silver Tsunami is About to Hit The End of Men? Cooling Water from Grandma s Well and Grandpa s Too!
6 People on the Move The South Rises Again!


7 The South Continues To Rise...Again!
8 SOUTH S SHARE OF U.S. NET Years POPULATION GROWTH, SELECTED YEARS, U.S. Absolute Population Change South s Absolute Population Change South s Share of Change ,974,129 8,468,303 27% ,123,138 9,339,455 33% ,886,128 15,598,279 30% ,497,947 22,650,563 50% ,035,665 29,104,814 49%
9 U.S. POPULATION CHANGE BY Region REGION, Population Absolute Population Change, Percent Population Change, U.S. 309,050,816 26,884, % Northeast 55,417,311 1,753, % Midwest 66,972,887 2,480, % South 114,555,744 14,318, % West 72,256,183 8,774, %
10 SHARES OF NET POPULATION GROWTH BY REGION, Region Absolute Population Change Percent of Total UNITED STATES 26,884, NORTHEAST 1,753, MIDWEST 2,480, SOUTH 14,318, WEST 8,774,
11 NET MIGRATION TRENDS, Northeast Midwest South West Total -1,032-2,008 +2, Black Hispanic Elderly Foreign born = Net Import = Net Export
12 STATE SHARE OF SOUTH S NET GROWTH, Region/State Absolute Change State s Share The South 14,318, % Texas 4,293, % Florida 2,818, % Georgia 1,501, % North Carolina 1,486, % Other Southern States 4,218, %
13 GROSS AND NET MIGRATION FOR THE SOUTH, The Region Domestic Foreign Years In Out Net In Out Net ,125,096 3,470, , , , , ,874,414 3,477, , , , ,300 Florida Domestic Foreign Years In Out Net In Out Net , , ,002 41,745 24,108 17, , ,087-13,156 33,095 32,094 1,001
14 Absolute and Percent Population Change, Area 2010 Popula3on Absolute Change Percent Change U.S. 308,745,538 27,323, % South 114,555,744 14,318, % Georgia 9,687,653 1,501, % Atlanta MSA 5,268,860 1,005, %
15 Popula3on Change by County, Atlanta MSA,
16 U.S. POPULATION CHANGE BY Region REGION, Population Absolute Population Change, Percent Population Change, U.S. 318,857,056 10,098, % Northeast 56,152, , % Midwest 67,745, , % South 119,771,934 5,208, % West 75,187,681 3,240, %
17 SHARES OF NET POPULATION GROWTH BY REGION, Region Absolute Population Change Percent of Total UNITED STATES 10,098, NORTHEAST 833, MIDWEST 815, SOUTH 5,208, WEST 3,240,
18 STATE SHARES OF SOUTH S NET GROWTH, Region/State Absolute Change State s Share The South 5,208, % Texas 1,810, % Florida 1,088, % Georgia 408, % North Carolina 408, % Virginia 325, % Other Southern States 1,167, %
19 Absolute and Percent Population Change, Area 2014 Popula3on Absolute Change Percent Change U.S. 318,857,056 10, % South 119,771,934 5,208, % Georgia 10,097, , % Atlanta MSA 5,614, , %
20 Balance of Population Change Equation Popula3on Change = In- Flows Out- Flows where In- flows = [Births + In- Migrants] & Out- Flows =[Deaths + Out- Migrants]
21 Typology of Communities Demographic Experience Balanced Growth Natural Growth Migra3on Magnets Dying Biologically Declining Emptying Out Drivers Births exceed deaths and in- migra3on exceeds out- migra3on. Out- migra3on exceeds in- migra3on but this popula3on loss is offset by an excess of births over deaths. Deaths exceed births but popula3on loss is averted because in- migra3on exceeds out- migra3on. Deaths exceed births and out- migra3on exceeds in- migra3on, resul3ng in popula3on loss. In- migra3on exceeds out- migra3on but his net migra3on is not substan3al enough to offset an excess of deaths over births Births exceed deaths but out- migra3on exceeds in- migra3on, resul3ng in net popula3on loss
22 Types of Communities in Atlanta MSA Type of Community Number Balanced Growth 16 Natural Growth 4 Migra<on Magnet 0 Emptying Out 8 Dying 1 Biologically Declining 0

23 Typology of County Popula3on Change, Atlanta MSA,
24 Two colorful demographic processes are drivers of change Browning & Graying of America
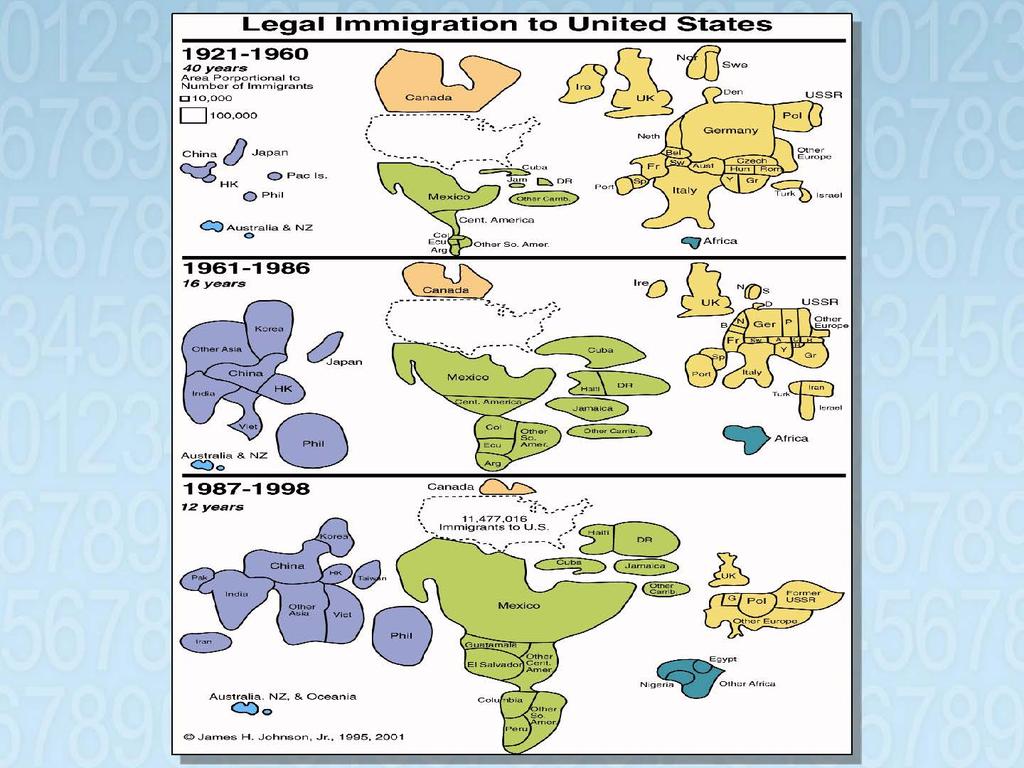
25 The Browning of America Immigra<on- driven popula<on change
26
27 The Numbers Legal Immigrants Year Annual Flow , , , , ,137, ,067,000 Refugees, Parolees, Asylees Year Annual Flow , , , , ,500
28 The Numbers Cont d Illegal Immigrants 300,000 to 400,000 annually over the past two decades Three million granted amnesty in million illegal immigrants remained aher 1986 reforms October 1996: INS es<mated there were 5 million illegal immigrants in U.S. Since August 2005: Es<mates of illegal popula<on have ranged between 7 million and 15 million Today: An es<mated 11.5 million unauthorized immigrants reside in U.S.
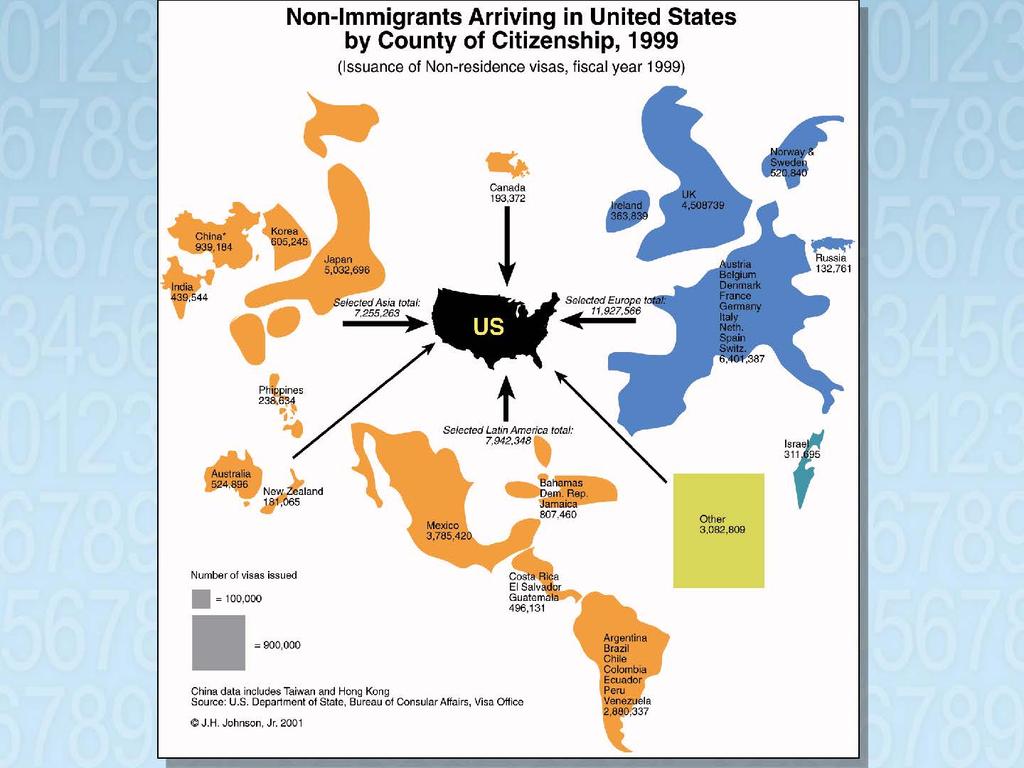
29 NON-IMMIGRANTS ADMITTED TO UNITED STATES, SELECTED YEARS, Year All Classes Exchange Visitors Academic & Voca3onal Students ,756, ,023 (1%) 271,861 (2%) ,539, ,213 (1%) 285,496 (3%) ,574, ,644 (1%) 355,207 (2%) ,640, ,364 (1%) 395,480 (2%) ,690, ,743 (1%) 699,953 (2%) ,824, ,435 (1%) 741,921 (2%) ,907, ,176 (1%) 687,506 (2%) ,381, ,138 (1%) 917,373 (2%) ,082, , 931 (1%) 1,702,730 (3%)
30
31 U.S. Immigrant Population, Number of Immigrants (in millions) Year
32 U.S. Foreign Born Population by Race/Ethnicity, 2011 Race/Ethnicity Foreign Popula3on Share of Total (%) Total 40,381, Hispanic 18,788, White Alone, not 7,608, Hispanic Black Alone, not Hispanic Asian Alone, not Hispanic Other Alone, not Hispanic 3,130, ,988, ,
33 U.S. POPULATION CHANGE BY RACE & ETHNICITY, Race 2010 Population Absolute Change Percentage Change Total 308,745,538 27,323, % Non-Hispanic 258,267,944 12,151, % White 196,817,552 2,264, % Black 37,685,848 3,738, % AI/AN 2,247, , % Asian 14,465,124 4,341, % NH/PI 481, , % 2 or More Races 5,966,481 1,364, % Hispanic 50,477,594 15,171, %

34 NON-WHITE AND HISPANIC SHARES OF POPULATION GROWTH, Area Absolute Population Change Non-White Share Hispanic Share US 27,323, South 14,318, Texas 4,293, Florida 2,818, Georgia 1,501, North Carolina 1,486,


35 MEDIAN AGE OF U.S. POPULATION BY RACE, HISPANIC ORIGIN & GENDER, 2009 Race Total Male Female United States White Alone White, Non-Hispanic Black Alone AI/AN Alone Asian Alone NH/PI Alone Two or More Races Hispanic September
36 RELATIVE DISTRIBUTION OF U.S. BIRTHS BY RACE / ETHNICITY Race/Ethnicity White 66% 50% 49.6% Blacks 17% 16% 15.0% Hispanics 15% 26% 26.0% Other 2% 8% 9.4% Source: Johnson and Lichter (2010); Tavernise (2011).
37 ATLANTA MSA POPULATION CHANGE BY RACE & ETHNICITY, Race 2010 Population Absolute Change Percentage Change Total 5,268,860 1,005, % Non-Hispanic 4,721, , % White 2,671,757 95, % Black 1,679, , % AI/AN 10,734 2, % Asian 252, , % NH/PI 2, % Some other race 13,732 5, % 2 or More Races 90,673 37, % Hispanic 547, , %

38 Median Age and Fer3lity Rates for Females in Atlanta MSA, Demographic Group All Females White, Not Hispanic Black American Indian & Alaskan Na3ve Asian Na3ve Hawaiian & Pacific Islander Some other race Two or more races Hispanic Na3ve Born Foreign Born Source: *Women 15 to 50 with births in past 12 months. Median Age Fer3lity/1000 women*
39 RELATIVE DISTRIBUTION OF U.S. POPULATION BY RACE / ETHNICITY Race/Ethnicity White 67% 47% Blacks 12.8% 13% Hispanics 14% 29% Asian 5% 9% Source: Pew Research Center, 2008 *projected.
40 The Graying of America The Silver Tsunami is about to hit
41 Key Drivers Changes in Longevity Declining Fer3lity Aging of Boomer Cohort
42 U.S. LIFE EXPECTANCY AT BIRTH YEAR AGE
43 Centenarians in the U.S. Year Number , , ,000
44 COMPLETED FERTILITY FOR WOMEN YEARS OLD Year Percent Childless Avg. Number of Children Percent Higher Order Births* *Three or more Children
45 TOTAL FERTILITY RATES FOR U.S. WOMEN BY RACE/ ETHNICITY, 2012 Race/Ethnicity Total Fertility Rate All Races 1.88 Hispanic 2.18 Non-Hispanic White 1.76 Blacks 1.90 Asian 1.77 Native American 1.35

46 U.S. POPULATION CHANGE BY AGE, Age 2010 Absolute Change Percentage Change < TOTAL 104,853,555 5,416, % 82,134,554-2,905, % 81,489,445 19,536, % 40,267,984 5,276, % 308,745,538 27,323, %
47 U.S. POPULATION TURNING 50, 55, 62, AND 65 YEARS OF AGE, ( ) Age 50 Age 55 Age 62 Age 65 Average Number/Day 12,344 11,541 9,221 8,032 Average Number/Minute September
 - 2,905,697 (- 3.4%) 19,536,809 (31.5%) 5,276,231 (15.1%) Atlanta MSA 1,005,422 (23.6% ) 341,205 (22.2%) 89,166 (5.9%) 431,888 (48.")
48 Absolute and Percent Population Change by Age, Age All Ages < United States 27,323,632 (9.7%) 5,416,292 (5.4%) - 2,905,697 (- 3.4%) 19,536,809 (31.5%) 5,276,231 (15.1%) Atlanta MSA 1,005,422 (23.6% ) 341,205 (22.2%) 89,166 (5.9%) 431,888 (48.4%) 143,163 (43.6%)
49 The Multigenerational Workforce
50 Multi-Generational Diversity Generation Birth Years Current Ages Est. Workforce Participation in 2013* Veterans Traditionalists WWII Generation Silent Generation Baby Boomers Boomers % (7M) % (60M) Generation X Baby Busters Generation Y Millennials % (51M) % (40M) September *Source: AARP Leading a Multi-Generational Workforce, 2007
51 Succession Planning & Accommodations for Elder Care Organiza<onal Game Changers!
52 Signs of Global Aging Japan sells more adult diapers than baby diapers. Vancouver outlaws use of door knobs in all new construc<on, including private homes. China grappling with the problem. Census Benchmark for White Americans: More Deaths than Births (Roberts, 2013).
53 Family Life is Changing Ozzie and Harriet are no longer the norm!


54 Marrying Out is In September
55 INTERMARRIAGE TREND, % Married Someone of a Different Race/Ethnicity September


56 INTERMARRIAGE TYPES Newly Married Couples in 2008 September
57
58 Living Arrangements are more diverse And Interes<ng!
59 COOLING WATERS FROM GRANDMA S WELL And Grandpa s Too!
60 Children Living in Non-Grandparent and Grandparent Households, Household Type Absolute Number 2010 Absolute Change All 74,718 2, No Grandparents 67, Both Grandparents Grandmother Only 2, , Grandfather Only Percent Change September
61 Children Living in Non-Grandparent and Grandparent-Headed Households by Presence of Parents, 2010 Household Type All Children (in thousands) Living with Both Parents Living with Mother Only Living with Father Only All 74, % 23.1% 3.4% 4.0% No Grandparents Both Grandparents Grandmother Only Grandfather Only 67, % 21.2% 3.3% 2.1% Living with Neither parent 2, % 40.6% 5.2% 36.1% 1, % 48.4% 4.5% 33.2% % 45.9% 4.4% 23.6% September
62 Type of Couple Couple Households with Children, 2009 Number of Households with Children Percent Own Children Married 23,453, opposite sex Unmarried 2,493, opposite sex Same Sex 104, Percent Unrelated Children
63 Same Sex Couple Households with Children, 2009 Type of Couple Number of Households with Children Percent Own Children Same Sex 104, Unmarried 33, Male- Male Unmarried Female- Female 71, Percent Unrelated Children

64 DIVERSITY RULES...but Challenges Abound September
65 Workforce Planning and Development Challenges The End of Men? The Triple Whammy of Geographic Disadvantage Educa<on necessary, but not sufficient

66 The End of Men?


67 FEMALE WORKFORCE REPRESENTATION % Female
68 JOBS LOST/GAINED BY GENDER DURING 2007 (Q4) 2009 (Q3) RECESSION Industry Women Men Construction -106,000-1,300,000 Manufacturing -106,000-1,900,000 Healthcare +451, ,100 Government +176, ,000 Total -1,700,000-4,700,000
69 THE PLIGHT OF MEN Today, three <mes as many men of working age do not work at all compared to Selec<ve male withdrawal from labor market rising non- employment due largely to skills mismatches, disabili<es & incarcera<on. The percentage of prime- aged men receiving disability insurance doubled between 1970 (2.4%) and 2009 (4.8%). Since 1969 median wage of the American male has declined by almost $13,000 aher accoun<ng for infla<on. Aher peaking in 1977, male college comple<on rates have barely changed over the past 35 years.
70 COLLEGE CLASS OF 2010 DEGREE MALE FEMALE DIFFERENCE Associate s 293, , ,000 Bachelor s 702, , ,000 Master s 257, , ,000 Professional 46,800 46, Doctor s 31,500 32,900 1,400 TOTAL 1,330,300 1,902, ,000
71 Area ENROLLMENT IN 2 YEAR COLLEGES, 2009 Total Enrollment Full Time Enrollment (%) Male Enrollment (%) Black Enrollment (%) U.S. 20,966, Southeast 4,731, Region North Carolina NC- 2 Yr Colleges 574, ,
72 UNC SYSTEM STUDENT ENROLLMENT BY GENDER AND TYPE OF INSTITUTION, Type of Institution Total Enrollment 2010 Male Enrollment Percent Male UNC System 175,281 76, Majority Serving 139,250 63, Minority Serving 36,031 13, HBUs 29,865 11,191 37
73 The Triple Whammy of Geographical Disadvantage The Human Capital Challenge
74 Racial Typology of U.S. Counties
75 Racial Typology of U.S. Counties
76 Racial Typology of U.S. Counties
77 Racial Typology of U.S. Counties
78 U.S. Racial Segregation by Census Tract
79 U.S. Racial Segregation by Census Tract
80 U.S. Racial Segregation by Census Tract
81 U.S. Racial Segregation by Census Tract
82 U.S. School Age Poverty by Census Tract
83 U.S. School Age Poverty by Census Tract
84 U.S. School Age Poverty by Census Tract
85 U.S. School Age Poverty by Census Tract


86 The Triple Whammy of Geographic Disadvantage
87 Summary Indicators of Exposure Level of Vulnerability Number of Youth Percent Non- White Triple Whammy 9.8 million 93 Double Whammy 12.2 million 81 Single Whammy 20.0 million 39 No Whammy 32.1 million 24
88
89
90

91 Male-Female Presence Disparity 6400 Total Number of EOC Test Takers Number of Test Takers males females / / / /2011 Year Graph shows total number of male and female students tested of 6 LEAs (Ber<e, Bladen, Duplin, Halifax, Northampton, and Pamlico)
92 Percent of High School Graduates Requiring Remedial Course Work , , , , , None One Two or MoreHS more GradsPercent of HS Grads
93 The Atlanta MSA Triple Whammy
94 Racial Typology of Atlanta MSA Coun3es
95 Racial Typology of Atlanta MSA Coun3es
96 Racial Typology of Atlanta MSA Coun3es
97 Racial Typology of Atlanta MSA Coun3es

98 Distribu3on of School Age Popula3on by County Typology
99 Atlanta MSA Segrega3on by Census Tract
100 Atlanta MSA Segrega3on by Census Tract

101 Atlanta MSA Segrega3on by Census Tract
102 Atlanta MSA Segrega3on by Census Tract

103 Distribu3on of School Age Popula3on by Race and Level of Neighborhood Segrega3on
104 Atlanta MSA Poverty by Census Tract
105 Atlanta MSA Poverty by Census Tract
106 Atlanta MSA Poverty by Census Tract
107 Atlanta MSA Poverty by Census Tract

108 Distribu3on of School Age Popula3on by Race and Level of Neighborhood Poverty
109 The Triple Whammy of Geographic Disadvantage

110 Education is Necessary...but insufficient
111 BACHELOR S DEGREE HOLDERS (UNDER AGE 25) WHO WERE JOBLESS OR UNDEREMPLOYED Year Percent
112 CHANGE IN INCIDENCE OF POVERTY BY EDUCATIONAL ATTAINMENT IN NC, , Educational Attainment Percent Change Less than High School 253, , % High School Graduate 216, , % Some College, Associate Degree 136, , % Bachelor s degree or higher 49,082 57, % Source: American Community Survey
113 THE COMPETITIVE TOOL KIT Analy<cal Reasoning Entrepreneurial Acumen Contextual Intelligence Soh Skills/Cultural Elas<city Agility and Flexibility
114 Implications for Workforce Planning and Development Manage the transi<on from the graying to the browning of America. Embrace immigrants. Address the wayward sons problem in U.S. educa<on and labor markets. Become more ac<vely involved in K- 12 educa<on as a form of enlightened self- interest. Establish stronger <es with business to ensure that students graduate with the requisite skills to add value and enhance U.S. compe<<veness in an ever- changing global marketplace. Adopt the Iceberg Model of Diversity

115 Race/Skin Color Gender Visible Disability Age Group Iceberg Model of Diversity Visible Diversity Traits Ethnicity Physical Attributes Invisible Diversity Traits If all I know about you is what I can see Level in Organization Culture Marital Status Values Education MBTI Religion/Religious Experiences International Cultural Immersion Communication Style Conflict Style Beliefs Teaching Style Recreational Habits IQ Learning Styles Academic Discipline Literacy Sexual Orientation Personality Style Orientation to Time Family Relationships Orientation to Tasks Physical Abilities/Qualities EQ Military Experience Socioeconomic Status Geographic Background Work Background Smoker/Non-Smoker Parental Status Native Born/Non-Native Born Political Ideology Thinking Style
116 Responding to the Crisis Leveraging the Power of Collec<ve Ambi<on!
117 Collective Ambition Supersedes individual goals and aspira<ons. Takes into account the key elements required to achieve and sustain excellence at the organiza<onal & community levels. Provides a framework that paves the way for successful organiza<onal & community change. October 2012
118 FOUNDATIONS OF COLLECTIVE AMBITION Collabora<ve Engagement (glue) Disciplined Execu<on of Strategy (grease)
119 Collaborative Engagement Making sure everybody is on the bus, in the right seat, headed in the right direc<on. Convincing aging empty nesters that they do have a dog in the K- 12 educa<on fight.
120 BUILDING COLLECTIVE AMBITION Government Private Sector Higher Educa3on Faith Community Philanthropic Community
121 The Strategy Challenge Most organiza<ons are long on vision and mission and short on strategy the road map for change. Explicit ac<ons are required to achieve vision and mission. Key community stakeholders must understand their specific roles in strategy execu<on. Key targets & milestones must be established to assess progress toward vision and mission. Leaders must be vigilant in strategy execu<on and not hesitate to adjust strategy when necessary. Failure is an op<on.
122 Postscript We must view solving The Triple Whammy of Geographic Disadvantage conundrum as a form of enlightened self- interest a strategic impera<ve for our communi<es and our na<on in the hyper- compe<<ve global economy of the 21 st century.
123 THE END
124 Supplemental Slides
125 Type of Demographic Change by County in Atlanta MSA
126 Area Estimated Change Atlanta MSA, Total Popula3on Change Natural Change Net Migra3on Atlanta MSA 236, , ,057
127 Net Migration Atlanta MSA, Area Total Net Interna3onal Domes3c Migra3on Net Migra3on Net Migra3on Atlanta MSA 100,057 53,103 46,954
128 County Balanced Growth Counties, Total Popula3on Change Natural Change Net Migra3on Dawson Pickens Barrow 2,086 1, Rockdale 1,704 1, Newton 2,488 1, Walton 1,986 1, Paulding 4,626 3,452 1,016 Dawson Pickens
129 County Balanced Growth Counties, , Cont d Total Popula3on Change Natural Change Net Migra3on Douglas 4,064 2,943 1,018 Fayeze 1, ,465 Henry 7,249 4,068 3,111 Coweta 5,863 2,595 3,239 Cherokee 10,760 5,187 5,585 Cobb 29,114 18,538 10,519 Forsyth 19,894 4,188 15,468 Gwinnez 53,980 25,880 27,695 Fulton 63,710 23,808 38,364
130 County Natural Growth Communities, Total Popula3on Change Natural Change Net Migra3on Clayton 4,753 8,843-4,189 DeKalb 21,450 22, Bartow 1,116 1, Carroll 1,740 1,
131 Emptying Out Communities, County Total Popula3on Change Natural Change Net Migra3on Heard Morgan Haralson Pike Lamar Buzs Jasper Spalding
132 Dying Communities, County Total Popula3on Change Natural Change Net Migra3on Meriwether
OVERVIEW. Demographic Trends. Challenges & Opportunities. Discussion
 People on the Move James H. Johnson, Jr. Frank Hawkins Kenan Institute of Private Enterprise Kenan-Flagler Business School University of North Carolina at Chapel Hill January 2017 OVERVIEW Demographic
Disruptive Demographics and the Triple Whammy of Geographic Disadvantage
 Disruptive Demographics and the Triple Whammy of Geographic Disadvantage James H. Johnson, Jr. Frank Hawkins Kenan Institute of Private Enterprise Kenan-Flagler Business School University of North Carolina
Disruptive Demographics: Implications for the Accounting Profession James H. Johnson, Jr. Distinguished Professor of Entrepreneurship & Strategy,
 Disruptive Demographics: Implications for the Accounting Profession James H. Johnson, Jr. Distinguished Professor of Entrepreneurship & Strategy, University of North Carolina Kenan-Flagler Business School
Six Disruptive Demographics That Will Change the U.S. Forever
 Six Disruptive Demographics That Will Change the U.S. Forever October 2017 OVERVIEW Demographic Trends Challenges & Opportunities Discussion October 2017 2 what CENSUS 2010 will REVEAL October 2017 October
Disruptive Demographics and the Triple Whammy of Geographic Disadvantage for America s Youth
 Disruptive Demographics and the Triple Whammy of Geographic Disadvantage for America s Youth James H. Johnson, Jr. Frank Hawkins Kenan Institute of Private Enterprise Kenan-Flagler Business School University
Disruptive Demographics: Implications for North Carolina s Health and Competitiveness
 Disruptive Demographics: Implications for North Carolina s Health and Competitiveness James H. Johnson, Jr. Frank Hawkins Kenan Institute of Private Enterprise Kenan-Flagler Business School University
Six Disruptive Demographics That Will Change the U.S. & South Carolina Forever
 Six Disruptive Demographics That Will Change the U.S. & South Carolina Forever James H. Johnson, Jr. Frank Hawkins Kenan Institute of Private Enterprise Kenan-Flagler Business School University of North
Disruptive Demographics and North Carolina s Global Competitiveness Challenge
 Disruptive Demographics and North Carolina s Global Competitiveness Challenge James H. Johnson, Jr. Frank Hawkins Kenan Institute of Private Enterprise Kenan-Flagler Business School University of North
Six Disruptive Demographics That Will Change the U.S. Forever
 Six Disruptive Demographics That Will Change the U.S. Forever James H. Johnson, Jr. Frank Hawkins Kenan Institute of Private Enterprise Kenan-Flagler Business School University of North Carolina at Chapel
What are the major changes you are seeing in your community?
 Court Trends, Changing Times in North Carolina, and Public Courts- the World Courts Work in Willow Jacobson, What are the major changes you are seeing in your community? Six Disruptive Trends The South
Disruptive Demographics: Implications for Workforce Planning and Development
 Disruptive Demographics: Implications for Workforce Planning and Development James H. Johnson, Jr. Ph.D. William Rand Kenan, Jr. Distinguished Professor of Entrepreneurship and Strategy Kenan-Flagler Business
People on the Move: Implications for Career Education
 People on the Move: Implications for Career Education James H. Johnson, Jr. Ph.D. William Rand Kenan, Jr. Distinguished Professor of Management Kenan-Flagler Business School Director, Urban Investment
IN THE UNITED STATES DISTRICT COURT FOR THE NORTHERN DISTRICT OF GEORGIA ATLANTA DIVISION SECOND DECLARATION OF WILLIAM S. COOPER
 Case 1:17-cv-01427-TCB-MLB-BBM Document 180-1 Filed 08/06/18 Page 1 of 84 IN THE UNITED STATES DISTRICT COURT FOR THE NORTHERN DISTRICT OF GEORGIA ATLANTA DIVISION AUSTIN THOMPSON, et al., Plaintiffs,
Demographic Changes, Health Disparities, and Tuberculosis
 Demographic Changes, Health Disparities, and Tuberculosis Joan M. Mangan, PhD, MST October 22, 2015 Delivering Culturally Competent Patient Education and Care to Tuberculosis Program Clients Austin, TX
Pulling Open the Sticky Door
 Pulling Open the Sticky Door Social Mobility among Latinos in Nebraska Lissette Aliaga-Linares Social Demographer Office of Latino/Latin American Studies (OLLAS) University of Nebraska at Omaha Overview
An Equity Profile of the Southeast Florida Region. Summary. Foreword
 An Equity Profile of the Southeast Florida Region PolicyLink and PERE An Equity Profile of the Southeast Florida Region Summary Communities of color are driving Southeast Florida s population growth, and
BLACK-WHITE BENCHMARKS FOR THE CITY OF PITTSBURGH
 BLACK-WHITE BENCHMARKS FOR THE CITY OF PITTSBURGH INTRODUCTION Ralph Bangs, Christine Anthou, Shannon Hughes, Chris Shorter University Center for Social and Urban Research University of Pittsburgh March
Institute for Public Policy and Economic Analysis
 Institute for Public Policy and Economic Analysis The Institute for Public Policy and Economic Analysis at Eastern Washington University will convey university expertise and sponsor research in social,
KENAN INSTITUTE WHITE PAPER
 KENAN INSTITUTE WHITE PAPER JANUARY 1, 2018 LEVERAGING NORTH CAROLINA S MIGRATION DIVIDEND UISC01201801 James H. Johnson, Jr., Ph.D Allan M. Parnell, Ph.D Frank Hawkins Kenan Institute of Private Enterprise
The Brookings Institution Metropolitan Policy Program Amy Liu, Deputy Director
 The Brookings Institution Metropolitan Policy Program Amy Liu, Deputy Director Mind the Gap: Reducing Disparities to Improve Regional Competitiveness in the Twin Cities Forum on the Business Response to
SECTION 1. Demographic and Economic Profiles of California s Population
 SECTION 1 Demographic and Economic Profiles of s Population s population has special characteristics compared to the United States as a whole. Section 1 presents data on the size of the populations of
Chapter One: people & demographics
 Chapter One: people & demographics The composition of Alberta s population is the foundation for its post-secondary enrolment growth. The population s demographic profile determines the pressure points
Race, Ethnicity, and Economic Outcomes in New Mexico
 Race, Ethnicity, and Economic Outcomes in New Mexico Race, Ethnicity, and Economic Outcomes in New Mexico New Mexico Fiscal Policy Project A program of New Mexico Voices for Children May 2011 The New Mexico
What Lies Ahead: Population, Household and Employment Forecasts to 2040 April Metropolitan Council Forecasts to 2040
 The Metropolitan Council forecasts population, households and employment for the sevencounty Minneapolis-St. Paul region with a 30-year time horizon. The Council will allocate this regional forecast to
MARRIAGE & PARENTHOOD
 CONTENTS OVERVIEW 3 KEY INDICATORS 4 OVERALL POPULATION 5 AGEING 8 MARRIAGE & PARENTHOOD 10 IMMIGRATION & CITIZENS BY DESCENT 14 1 ANNEX Overall Population Table 1: Total population 16 Table 2: Singapore
Active Michigan Members by Race/Ethnicity and Gender Joining the Bar
 The Big Picture Active Michigan Members by Race/Ethnicity and Gender Joining the Bar 2005-2015 Other Ethnic Origin Female, 379, 6.9% Other Ethnic Origin Male, 306, 5.5% Arab Origin Female, 101, 1.8% Arab
Introduction. Background
 Millennial Migration: How has the Great Recession affected the migration of a generation as it came of age? Megan J. Benetsky and Alison Fields Journey to Work and Migration Statistics Branch Social, Economic,
The EEO Tabulation: Measuring Diversity in the Workplace ACS Data Users Conference May 29, 2014
 The EEO Tabulation: Measuring Diversity in the Workplace ACS Data Users Conference May 29, 2014 Ana J. Montalvo Industry and Occupation Statistics Branch Social, Economic, and Housing Statistics Division
The Brookings Institution Metropolitan Policy Program Bruce Katz, Director
 The Brookings Institution Metropolitan Policy Program Bruce Katz, Director State of the World s Cities: The American Experience Delivering Sustainable Communities Summit February 1st, 2005 State of the
Regional Data Snapshot
 Regional Data Snapshot Population, Economy & Education Features SET Civic Forum Uwharrie Region, NC Table of Contents 01 Overview 03 Human Capital 02 Demography 04 Labor Force 01 overview Uwharrie Region,
Youth at High Risk of Disconnection
 Youth at High Risk of Disconnection A data update of Michael Wald and Tia Martinez s Connected by 25: Improving the Life Chances of the Country s Most Vulnerable 14-24 Year Olds Prepared by Jacob Rosch,
Chapter 7. Migration
 Chapter 7 Migration Chapter 7 Migration Americans have traditionally been highly higher levels of educational attainment than Figure 7-1. mobile, with nearly 1 in 7 people changing residence each year.
People. Population size and growth
 The social report monitors outcomes for the New Zealand population. This section provides background information on who those people are, and provides a context for the indicators that follow. People Population
Northwest Georgia Housing Authority Application for Employment
 Northwest Georgia Housing Authority Application for Employment An Equal Opportunity Employer Position Applying For: PERSONAL Name Phone: / (Last) (First) (Middle) Present Address Permanent Mailing SS#
Le Sueur County Demographic & Economic Profile Prepared on 7/12/2018
 Le Sueur County Demographic & Economic Profile Prepared on 7/12/2018 Prepared by: Mark Schultz Regional Labor Market Analyst Southeast and South Central Minnesota Minnesota Department of Employment and
Population Outlook for the Portland-Vancouver Metropolitan Region
 Portland State University PDXScholar Institute of Portland Metropolitan Studies Publications Institute of Portland Metropolitan Studies 2007 Population Outlook for the Portland-Vancouver Metropolitan Region
Demographic Change How the US is Coping with Aging, Immigration, and Other Challenges William H. Frey
 Demographic Change How the US is Coping with Aging, Immigration, and Other Challenges William H. Frey Brookings Institution University of Michigan www.frey-demographer.org US: Total and Age 65+ Growth,
Utah s Demographic Transformation
 Utah's Demographic Transformation: Implications for Education and Workforce 27 Council of Councils Southern Utah University Cedar City, Utah October 11, 27 Pamela S. Perlich, Ph.D. Senior Research Economist
Regional Data Snapshot
 Regional Data Snapshot Population, Economy & Education Features SET Civic Forum East Central NM, New Mexico Table of Contents 01 Overview 03 Human Capital 02 Demography 04 Labor Force 01 overview East
1615 L Street, NW, Suite 700 Washington, DC (main) (fax)
 (fax)") 1615 L Street, NW, Suite 700 Washington, DC 20036-5631 202-419-3600(main) 202-419-3608(fax) www.pewresearch.org A Fact Tank The Pew Research Center is a nonpartisan organization that provides information
1615 L Street, NW, Suite 700 Washington, DC 20036-5631 202-419-3600(main) 202-419-3608(fax) www.pewresearch.org A Fact Tank The Pew Research Center is a nonpartisan organization that provides information
Hispanic Health Insurance Rates Differ between Established and New Hispanic Destinations
 Population Trends in Post-Recession Rural America A Publication Series of the W3001 Research Project Hispanic Health Insurance Rates Differ between and New Hispanic s Brief No. 02-16 August 2016 Shannon
BIG PICTURE: CHANGING POVERTY AND EMPLOYMENT OUTCOMES IN SEATTLE
 BIG PICTURE: CHANGING POVERTY AND EMPLOYMENT OUTCOMES IN SEATTLE January 218 Author: Bryce Jones Seattle Jobs Initiative TABLE OF CONTENTS Introduction 1 Executive Summary 2 Changes in Poverty and Deep
Georgia Marijuana Arrests
 Working to Reform Marijuana Laws The NORML Almanac of Marijuana Arrest Statistics Georgia Marijuana Arrests Marijuana Arrests 1995-2002 (Summary) Marijuana Possession Arrests-2002 (Demographics) Marijuana
Extrapolated Versus Actual Rates of Violent Crime, California and the United States, from a 1992 Vantage Point
 Figure 2.1 Extrapolated Versus Actual Rates of Violent Crime, California and the United States, from a 1992 Vantage Point Incidence per 100,000 Population 1,800 1,600 1,400 1,200 1,000 800 600 400 200
Regional Data Snapshot
 Regional Data Snapshot Population, Economy & Education Features SET Civic Forum Glacial Lakes Region, South Dakota Table of Contents 01 Overview 03 Human Capital 02 Demography 04 Labor Force 01 overview
Rural America At A Glance
 Rural America At A Glance 7 Edition Between July 5 and July 6, the population of nonmetro America grew.6 percent. Net domestic migration from metro areas accounted for nearly half of this growth. Gains
Cultural Frames: An Analytical Model
 Figure 1.1 Cultural Frames: An Analytical Model Hyper-Selectivity/ Hypo-Selectivity Ethnic Capital Tangible and Intangible Resources Host Society Public Institutional Resources The Stereotype Promise/Threat
An Equity Assessment of the. St. Louis Region
 An Equity Assessment of the A Snapshot of the Greater St. Louis 15 counties 2.8 million population 19th largest metropolitan region 1.1 million households 1.4 million workforce $132.07 billion economy
Assessment of Demographic & Community Data Updates & Revisions
 Assessment of Demographic & Community Data Updates & Revisions Scott Langen, Director of Operations McNair Business Development Inc. P: 306-790-1894 F: 306-789-7630 E: slangen@mcnair.ca October 30, 2013
Rural Child Poverty across Immigrant Generations in New Destination States
 Rural Child Poverty across Immigrant Generations in New Destination States Brian Thiede, The Pennsylvania State University Leif Jensen, The Pennsylvania State University March 22, 2018 Rural Poverty Fifty
People. Population size and growth. Components of population change
 The social report monitors outcomes for the New Zealand population. This section contains background information on the size and characteristics of the population to provide a context for the indicators
Dynamic Diversity: Projected Changes in U.S. Race and Ethnic Composition 1995 to December 1999
 Dynamic Diversity: Projected Changes in U.S. Race and Ethnic Composition 1995 to 2050 December 1999 DYNAMIC DIVERSITY: PROJECTED CHANGES IN U.S. RACE AND ETHNIC COMPOSITION 1995 TO 2050 The Minority Business
U.S. immigrant population continues to grow
 U.S. immigrant population continues to grow Millions 45 40 35 30 25 20 15 10 5 0 Source: PEW Research Center. All foreign-born immigrants Unauthorized immigrants 40.4 38.0 31.1 12.0 11.1 8.4 2000 2007
Facts & Figures in this issue: income employment growth trends baby boomers millennials immigration
 Facts & Figures in this issue: income employment growth trends baby boomers millennials immigration 2017 Baby Boomers The term baby boomer refers to individuals born in the United States between 1946 and
Understanding the Immigrant Experience Lessons and themes for economic opportunity. Owen J. Furuseth and Laura Simmons UNC Charlotte Urban Institute
 Understanding the Immigrant Experience Lessons and themes for economic opportunity Owen J. Furuseth and Laura Simmons UNC Charlotte Urban Institute Charlotte-Mecklenburg Opportunity Task Force March 10,
Post-Secondary Education, Training and Labour September Profile of the New Brunswick Labour Force
 Post-Secondary Education, Training and Labour September 2018 Profile of the New Brunswick Labour Force Contents Population Trends... 2 Key Labour Force Statistics... 5 New Brunswick Overview... 5 Sub-Regional
Immigrants are playing an increasingly
 Trends in the Low-Wage Immigrant Labor Force, 2000 2005 THE URBAN INSTITUTE March 2007 Randy Capps, Karina Fortuny The Urban Institute Immigrants are playing an increasingly important role in the U.S.
THE NEW LATINO SOUTH: LATINOS IN NORTH CAROLINA. Understanding our Growing Community
 THE NEW LATINO SOUTH: LATINOS IN NORTH CAROLINA Understanding our Growing Community Axel Lluch Governor s Office of Hispanic/Latino Affairs 3/30/2006 1 THE NEW LATINO SOUTH? 3/30/2006 2 THE NEW LATINO
The Brookings Institution
 The Brookings Institution Center on Urban and Metropolitan Policy Alan Berube, Senior Research Analyst Census 2000: Key Trends & Implications for Cities Presentation to the Knight Center for Specialized
Appendix A. Environmental Justice Analysis
 Appendix A. Environmental Justice Analysis Project Memorandum Re: KY 536 Scoping Study Environmental Justice Analysis Date: December 22, 2014 Introduction This Environmental Justice Report presents a review
Institute for Public Policy and Economic Analysis
 Institute for Public Policy and Economic Analysis The Institute for Public Policy and Economic Analysis at Eastern Washington University will convey university expertise and sponsor research in social,
info Poverty in the San Diego Region SANDAG December 2013
 info December 2013 SANDAG Poverty in the San Diego Region Table of Contents Overview... 3 Background... 3 Federal Poverty Measurements... 4 Poverty Status for Individuals in the San Diego Region... 6 Demographic
The Brookings Institution
 The Brookings Institution Metropolitan Policy Program Bruce Katz, Director Understanding Regional Dynamics: Implications for Social and Economic Justice Understanding Regional Dynamics: Implications for
Based on our analysis of Census Bureau data, we estimate that there are 6.6 million uninsured illegal
 Memorandum Center for Immigration Studies September 2009 Illegal Immigrants and HR 3200 Estimate of Potential Costs to Taxpayers By Steven A. Camarota Based on our analysis of Census Bureau data, we estimate
Water Demand Demographic Change and Uncertainty
 Water Demand Demographic Change and Uncertainty Dr Peter Boden Edge Analytics Ltd College of Medical and Dental Sciences University of Birmingham February 2011 Slide 1 Edge Analytics www.edgeanalytics.co.uk
California s Congressional District 37 Demographic Sketch
 4.02.12 California s Congressional District 37 Demographic Sketch MANUEL PASTOR JUSTIN SCOGGINS JARED SANCHEZ Purpose Demographic Sketch Understand the Congressional District s population and its unique
Chapter 1: Objectives
 Chapter 1: Objectives Identify Texas political party activists and government officials to inform participation in the political affairs of the state and its counties, cities, and special districts. Understand
Human Population Growth Through Time
 Human Population Growth Through Time Current world population: 7.35 Billion (Nov. 2016) http://www.worldometers.info/world-population/ 2012 7 billion 1999 13 years 12 years 1974 1927 1804 13 years 14 years
Demographic, Social, and Economic Trends for Young Children in California
 Occasional Papers Demographic, Social, and Economic Trends for Young Children in California Deborah Reed Sonya M. Tafoya Prepared for presentation to the California Children and Families Commission October
Educa&on Agency Presenta&on Ways and Means Educa&on Subcommi8ee February 2017
 Educa&on Agency Presenta&on Ways and Means Educa&on Subcommi8ee February 2017 1 Table of Contents q Key Data and Calls to Ac1on q Cross Agency Commitments & Chief Educa1on Office Role q Commitment to Equity
Measuring Living Conditions and Integration of Refugees
 Measuring Living Conditions and Integration of Refugees Eric B. Jensen, U.S. Census Bureau Filip Tanay, European Commission International Forum on Migration Statistics January 15-16, 2018 Any views expressed
Social and Demographic Trends in Burnaby and Neighbouring Communities 1981 to 2006
 Social and Demographic Trends in and Neighbouring Communities 1981 to 2006 October 2009 Table of Contents October 2009 1 Introduction... 2 2 Population... 3 Population Growth... 3 Age Structure... 4 3
This analysis confirms other recent research showing a dramatic increase in the education level of newly
 CENTER FOR IMMIGRATION STUDIES April 2018 Better Educated, but Not Better Off A look at the education level and socioeconomic success of recent immigrants, to By Steven A. Camarota and Karen Zeigler This
Racial Inequities in Montgomery County
 W A S H I N G T O N A R E A R E S E A R C H I N I T I A T I V E Racial Inequities in Montgomery County Leah Hendey and Lily Posey December 2017 Montgomery County, Maryland, faces a challenge in overcoming
Illegal Immigration: How Should We Deal With It?
 Illegal Immigration: How Should We Deal With It? Polling Question 1: Providing routine healthcare services to illegal Immigrants 1. Is a moral/ethical responsibility 2. Legitimizes illegal behavior 3.
Geographic Mobility of New Jersey Residents. Migration affects the number and characteristics of our resident population
 Geographic Mobility of New Jersey Residents Migration affects the number and characteristics of our resident population Geographic Mobility of New Jersey Residents More than 4.1 million (or 47.4%) New
What Travel Trends Might Tell Us About the Future
 University of Massachusetts Amherst ScholarWorks@UMass Amherst Tourism Travel and Research Association: Advancing Tourism Research Globally 2014 Marketing Outlook Forum - Outlook for 2015 What Travel Trends
Demographic, Economic, and Social Transformations in Brooklyn Community District 4: Bushwick,
 Demographic, Economic, and Social Transformations in Brooklyn Community District 4: Bushwick, 1990-2007 Astrid S. Rodríguez Ph.D. Candidate, Educational Psychology Center for Latin American, Caribbean
The Brookings Institution Metropolitan Policy Program Robert Puentes, Fellow
 The Brookings Institution Metropolitan Policy Program Robert Puentes, Fellow A Review of New Urban Demographics and Impacts on Housing National Multi Housing Council Research Forum March 26, 2007 St. Louis,
Literacy, Numeracy, Technological Problem Solving, and Health among U.S. Adults: PIAAC Analyses
 Literacy, Numeracy, Technological Problem Solving, and Health among U.S. Adults: PIAAC Analyses Esther Prins, Shannon Monnat, Carol Clymer, & Blaire Toso Pennsylvania State University November 2, 2015
3Demographic Drivers. The State of the Nation s Housing 2007
 3Demographic Drivers The demographic underpinnings of long-run housing demand remain solid. Net household growth should climb from an average 1.26 million annual pace in 1995 25 to 1.46 million in 25 215.
America s s Emerging Demography The role of minorities, college grads & the aging and younging of the population
 America s s Emerging Demography The role of minorities, college grads & the aging and younging of the population William H. Frey The Brookings Institution and University of Michigan www.frey-demographer.org
CFSA Strategic Directions Summit January 7, 2013
 CFSA Strategic Directions Summit January 7, 2013 Background Southern Arizona Indicators Project started in January 2012 in partnership with Arizona Indicators and Morrison Ins
Robert Haveman For Poverty 101 June, 2018 Research Training Policy Practice
 Causes of Poverty Robert Haveman For Poverty 101 June, 2018 Research Training Policy Practice A Difficult Topic No comprehensive evidence enabling assignment of responsibility to various causes. Lots of
Tell us what you think. Provide feedback to help make American Community Survey data more useful for you.
 DP02 SELECTED SOCIAL CHARACTERISTICS IN THE UNITED STATES 2016 American Community Survey 1-Year Estimates Supporting documentation on code lists, subject definitions, data accuracy, and statistical testing
are receiving more funding than they should. Funds must be reallocated, zoning ordinances must be modified, train lines need to be laid, and new
 Suburban Poverty A hut standing before long rows of cotton fields at the edge of a road in the Mississippi Delta; a shack balanced precariously on a mountainside in Appalachia; a high rise catacomb in
Destination Portland: Post-Great Recession Migration Trends in the Rose City Region
 Portland State University PDXScholar Publications, Reports and Presentations Population Research Center 3-2017 Destination Portland: Post-Great Recession Migration Trends in the Rose City Region Jason
The Black Labor Force in the Recovery
 Cornell University ILR School DigitalCommons@ILR Federal Publications Key Workplace Documents 7-11-2011 The Black Labor Force in the Recovery United States Department of Labor Follow this and additional
APPENDIX G DEMOGRAPHICS
 APPENDIX G DEMOGRAPHICS Analyzing current and past demographic data is an important step in defining future transportation needs for individuals living and working in the PPUATS Metropolitan Planning Area.
Application for Employment
 Application for Employment It is the policy of BGCGW that all applicants for employment and all employees are recruited, hired, and assigned on the basis of merit without regard to race, color, religion,
Race and Economic Opportunity in the United States
 THE EQUALITY OF OPPORTUNITY PROJECT Race and Economic Opportunity in the United States Raj Chetty and Nathaniel Hendren Racial disparities in income and other outcomes are among the most visible and persistent
brownd Monday, May 9, :05:58 AM CT 58:b0:35:ac:27:98 Popula'on
 Popula'on Basic Terms Demography Immigra'on Emigra'on Ecumene Non- Ecumene Basic Terms Demography- Study of human popula'on Immigra'on- people coming into a country Emigra'on- people leaving a country
 Page 1 of 5 DP02 SELECTED SOCIAL CHARACTERISTICS IN THE UNITED STATES 2013 American Community Survey 1-Year Estimates Although the American Community Survey (ACS) produces population, demographic and housing
ATTACHMENT 16. Source and Accuracy Statement for the November 2008 CPS Microdata File on Voting and Registration
 ATTACHMENT 16 Source and Accuracy Statement for the November 2008 CPS Microdata File on Voting and Registration SOURCE OF DATA The data in this microdata file are from the November 2008 Current Population
Why disaggregate data on U.S. children by immigrant status? Some lessons from the diversitydatakids.org project
 Why disaggregate data on U.S. children by immigrant status? Some lessons from the diversitydatakids.org project Dolores Acevedo-Garcia, PhD, MPA-URP Samuel F. and Rose B. Gingold Professor of Human Development
Making the Case for Multicultural Education in Utah: Utah s Demographic Transformation
 Making the Case for Multicultural Education in Utah: Utah s Demographic Transformation Utah Reach Training Utah State Office of Education May 8, 2009 Pamela S. Perlich, Ph.D. University of Utah Utah s
MASON-DIXON GEORGIA POLL
 MASON-DIXON GEORGIA POLL FEBRUARY 2018 2018 GOVERNOR S RACE EMBARGO: Newspaper Publication - Friday, March 2, 2018 Broadcast & Internet Release - 6 am. Friday, March 2, 2018 Copyright 2018 Tracking public
Pacific Economic Trends and Snapshot
 Pacific Economic Trends and Snapshot September 213 Report to Ministry of Business, Innovation, and Employment Contents 1. Key points... 3 2. Demographic trends... 5 3. Qualifications and skills... 7 4.
Labor Force Characteristics by Race and Ethnicity, 2015
 Cornell University ILR School DigitalCommons@ILR Federal Publications Key Workplace Documents 9-2016 Labor Force Characteristics by Race and Ethnicity, 2015 Bureau of Labor Statistics Follow this and additional
PLEASE PRINT ALL INFORMATION REQUESTED EXCEPT SIGNATURE ON PAGES 5 & 6. Name LAST FIRST MIDDLE MAIDEN. Present Address NUMBER STREET CITY STATE ZIP
 EMPLOYEE APPLICATION Catholic Charities of the Diocese of Santa Rosa (Catholic Charities) is an Equal Opportunity Employer. Race, color, religion, age, sex, promotion, disability, marital or veteran status,