Demographic Change How the US is Coping with Aging, Immigration, and Other Challenges William H. Frey
|
|
|
- Victor Griffin
- 5 years ago
- Views:
Transcription
1 Demographic Change How the US is Coping with Aging, Immigration, and Other Challenges William H. Frey Brookings Institution University of Michigan
2 US: Total and Age 65+ Growth, Total Age 65+ Source: William H. Frey analysis
3 US Immigrant Population, millions Source: William H. Frey analysis
4 Growing New Minorities, Share of Population Hispanics Asians Source: William H. Frey analysis
5 Total Fertility Rate United States 2.05 France 1.89 United Kingdom 1.82 Italy 1.38 Germany 1.36 Japan 1.27 Source: United Nations
6 Life Expectancy Japan 82.6 France 80.7 Italy 80.5 Germany 79.4 United Kingdom 79.4 United States 78.2 Source: United Nations
7 Immigration Rate (per 1000) United States 3.9 Italy 2.6 United Kingdom 2.1 Germany 1.8 France 1.6 Japan 0.4 Source: United Nations
8 Projected Growth, United States 40% United Kingdom 14% France 5% Italy -5% Germany -9% Japan -21% Source: United Nations
9 Percent Aged 65+ Japan 20% Germany 19% Italy 19% France 16% United Kingdom 16% United States 12% Source: United Nations
10 Population Growth Source: United Nations US Japan
11 Labor Force Growth US Japan Source: United Nations
12 Age Dependency Persons age 65+ per 100 persons age US Japan Source: United Nations
13 US Growth by Age Source: William H. Frey
14 Population Changes in the Next 3 Decades 12,000 Young Elderly Old Elderly (65-74) (75 +) 10,000 8,000 6,000 4,000 2,000 0 Frey Source: William H. Frey
15 Population Changes in the Next 3 Decades 14,000 12,000 10,000 8,000 6,000 4,000 2, ,000-4,000-6,000-8,000 Empty Nesters Pre-Elderly (45-54) (55-64) Frey Source: William H. Frey
16 Source: William H. Frey Boomers vs. Parents at Midlife % With 3+ Kids 30% 55% % Not Married 21% 36% %Women Not Working 23% 50% % HS Dropout 14% 38% 0% 10% 20% 30% 40% 50% 60% Boomers Parents
17 Source: William H. Frey analysis Household Types: Older Age Groups 100% 80% % 40% 20% % Age Age Age 85+ Female Head NonFamilies Male Head NonFamilies Female Head Families Male Head Families Married Couples
18 Growth by Age, Under California Nevada Michigan Source: William Frey,
19 Growth: Under Age 35 Source: William H. Frey GT 7% 1% - 7% LT 1%
20 Percent 65+ population for States, 2005 Source: William H. Frey analysis 13.4% & above 12% -13% 11% -11.9% under 12%
21 Rates of Migration by Age < Per 100 Source: William H. Frey analysis
22 Source: William H. Frey analysis Arizona Projections: Aging in Place and Migration percent growth Aging in Place Net Migration
23 Source: William H. Frey analysis New York Projections: Aging in Place and Migration percent growth Aging in Place Net Migration
24 US Federal Budget Allocation as Percent of Projected Federal Revenue Health Care and Social Security All Other Expenditures Source: Dowell Myers, Boomers and Seniors
25 Immigrants in the US, in millions Source: William H. Frey, Brookings Institution
26 Immigrant Share of US Population Source: US Census sources
27 Types of US Foreign Born, 2005 Legal Temporary 3% Undocumented 30% Legal Permanent 67% Source: Jeffrey Passel, Pew Hispanic Center
28 Legal Permanent Immigrants, Other 17% Employment 19% FamilyTies 64% Source: Population Reference Bureau
29 Source: Population Reference Bureau, Pew Hispanic Center Immigrant Origins 100% 90% 80% 70% 60% 50% 40% 30% 20% 10% 0% Legal Undocumented Other Asia Latin America
30
31
32 Education: Immigrants vs Natives >8 Grade 9-12 Grade HS Diploma Some College College Diploma Post College foreign born Source: Congressional Budget Office Analysis native born
33 Immigrant Education: Mexican vs. Other Origins >8 Grade 9-12 Grade HS Diploma Some College College Diploma Post College Mexican Rest of World Source: Congressional Budget Office Analysis
34 Hispanics: Less than High School 60.0% 54% 50.0% 40.0% 30.0% 20.0% 10.0% 32% 15% 0.0% Ist Generation 2nd Generation Total US Source: William H. Frey analysis
35 Hispanics: College Graduates 30.0% 28% 25.0% 20.0% 18% 15.0% 10.0% 10% 5.0% 0.0% Ist Generation 2nd Generation Total US Source: William H. Frey analysis
36 Asians: College Graduates 60.0% 50.0% 51% 53% 40.0% 30.0% 28% 20.0% 10.0% 0.0% Ist Generation 2nd Generation Total US Source: William H. Frey analysis
37 Most Prevalent Jobs Native Born Foreign Born Admin Support Management Sales Education Production Construction Admin Support Sales Source: Congressional Budget Office
38 Immigrants - Prevalent Jobs Mexican Rest of World Construction Production Maintenance Transportation Sales Admin Support Management Production Source: Congressional Budget Office
39 Undocumented Prevalent Jobs Cooks Construction Maids/Housekeeping Maintenance Agriculture Source: Jeffrey Passel, Pew Hispanic Center
40 Long Term Fiscal Impact of One Migrant $150 $100 $76 US dollars $82 $105 $93 $50 $0 -$50 -$30 -$100 -$89 Not High School High School Some College Immigrant Descendent Source: Population Reference Bureau
41 Source: William H. Frey, analysis of 2000 Census Immigrant Magnet States
42 State Immigrant Growth, Source: William H. Frey 200% or more growth Btn 100% and 199% growth Traditional immigrant gateway All other states
43 Source: William H. Frey Immigrants vs Natives: 2005 Poverty and Near Poverty** Hispanics: Poverty and Near Poverty Blue Collar Workers* Hispanics: Blue Collar Workers Immigrants in New Destinations. Immigrants in Traditional Magnets US Native Born
44 Where Undocumented Dominate Foreign Born Source: Jeffery Passel, Pew Hispanic Center GT 40% Other
45 Desired US Immigration Levels 100% 90% 80% 70% 60% 50% 40% 30% 20% 10% 0% Traditional Magnet States New Destination States Present Increased Decreased Don't Know Source: William H. Frey analysis of CBS News Poll, July 29-Aug 2, 2005
46 3 Year Work Permits for Illegal Immigrants? 100% 90% 80% 70% 60% 50% 40% 30% 20% 10% 0% Traditional Magnet States New Destination States Allowed Not Allowed Don't Know Source: William H. Frey analysis of CBS News Poll, July 29-Aug 2, 2005
47 US Race-Ethnicity White Black Asian Am Indian Mixed Race Hispanic Source: William H. Frey, Brookings Institution
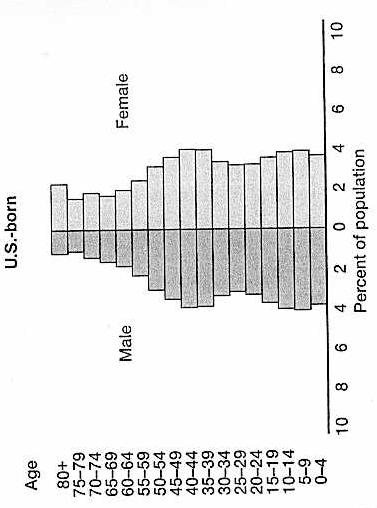
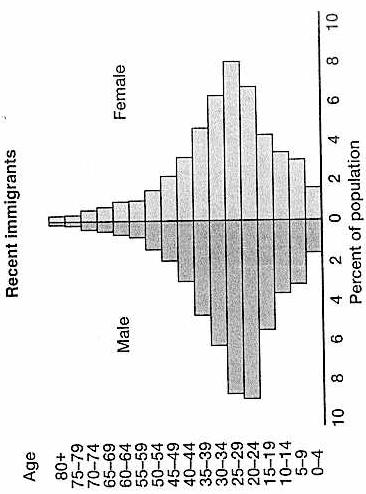
48 Natives and Recent Immigrants 1.0 Native Born 7.3 Recent Foreign Born White Black Asian Am Indian Mixed Race Hispanic Source: William H. Frey, Brookings Institution
49 US: Population by Race: 2000 and , , , , , % White Black 200, , ,000 50, % Asian Hispani c Source: William H. Frey, Brookings Institution
50 Source: William H. Frey New Demographic Regions Melting Pot America The New Sunbelt The Heartland
51 New Sunbelt, Melting Pot, and Heartland States Source: William H. Frey New Sunbelt Melting Pot Heartland States
52 Source: William Frey Demographic Components, (Rates per 1000) Melting Pot New Sunbelt Heartland Immigratio n Domestic Migration
53 Race Composition of Regions Melting Pot New Sunbelt Heartland 26% 10% 3% 2% 12% 2% 2% 4% 15% 2% 54% 7% 70% 11% 80% White Black Asian Other Hispanic Source: William H. Frey
54 Hispanic Concentrations, 2005 Percent of County Population 25% and above 10.0% to 24.9% 5.0 to 9.9% Under 5% Data source: William H. Frey, US Census Estimates
55 White Concentrations, 2005 Percent of County Population 95% and above 85.0% to 94.9% 70.0% to 84.9% Under 70% Data source: William H. Frey, US Census Estimates
56 Children Speaking Spanish at Home Source: William H. Frey, analysis of 2000 Census 20% and Over 10% to 20% 5% to 10% Under 5%
57 Race Profiles for Occupations Los Angeles Professional & Mgrs Clerical & Sales Skilled Blue Collar Unskilled & Services White Black Indian Asian Hispanic Source: William Frey. Milken Institute
58 Source: William H. Frey analysis Race for Age Groups: US 100% 90% 80% 70% 60% 50% 40% 30% 20% 10% 0% Age Under Age Age Age 65+ White Black Asian Other Hispanic
59 Source: William H. Frey analysis Race for Age Groups: California 100% 90% 80% 70% 60% 50% 40% 30% 20% 10% 0% Age Under Age Age Age 65+ White Black Asian Other Hispanic
60 Source: William H.Frey Hispanics: 2004 Total vs Voter Shares Total Voters 0 New Mexico Texas California Arizona Nevada Colorado Florida
61 United States Projected Race Compositions, 2025 Under Age 18 Age Age % 62 % 76 % white black Indian Asian Hispanic Source: William H. Frey, Brookings Institution
Immigration Goes Nationwide Recent dispersal has made immigrants and new minorities more visible
 Immigration Goes Nationwide Recent dispersal has made immigrants and new minorities more visible William H. Frey The Brookings Institution Metropolitan Policy Program Briefing, Immigration Policy: Federal
America s s Emerging Demography The role of minorities, college grads & the aging and younging of the population
 America s s Emerging Demography The role of minorities, college grads & the aging and younging of the population William H. Frey The Brookings Institution and University of Michigan www.frey-demographer.org
1615 L Street, NW, Suite 700 Washington, DC (main) (fax)
 (fax)") 1615 L Street, NW, Suite 700 Washington, DC 20036-5631 202-419-3600(main) 202-419-3608(fax) www.pewresearch.org A Fact Tank The Pew Research Center is a nonpartisan organization that provides information
1615 L Street, NW, Suite 700 Washington, DC 20036-5631 202-419-3600(main) 202-419-3608(fax) www.pewresearch.org A Fact Tank The Pew Research Center is a nonpartisan organization that provides information
The Brookings Institution Metropolitan Policy Program Robert Puentes, Fellow
 The Brookings Institution Metropolitan Policy Program Robert Puentes, Fellow A Review of New Urban Demographics and Impacts on Housing National Multi Housing Council Research Forum March 26, 2007 St. Louis,
Race, Immigration and America s s Changing Electorate. William H. Frey The Brookings Institution
 Race, Immigration and America s s Changing Electorate William H. Frey The Brookings Institution Race, Immigration and America's Changing Electorate Race-Ethnicity and Eligible Voter Growth Demographic
Utah s Demographic Transformation
 Utah's Demographic Transformation: Implications for Education and Workforce 27 Council of Councils Southern Utah University Cedar City, Utah October 11, 27 Pamela S. Perlich, Ph.D. Senior Research Economist
Hispanics and the Changing Racial Demographics of the Intermountain West
 Hispanics and the Changing Racial Demographics of the Intermountain West William H. Frey The Brookings Institution www.frey-demographer.org 2008: Greater Minority Turnout and Share of the Voter Population
The Brookings Institution Metropolitan Policy Program Bruce Katz, Director
 The Brookings Institution Metropolitan Policy Program Bruce Katz, Director Redefining Urban and Suburban America National Trust for Historic Preservation September 30, 2004 Redefining Urban and Suburban
Immigration Policy Brief August 2006
 Immigration Policy Brief August 2006 Last updated August 16, 2006 The Growth and Reach of Immigration New Census Bureau Data Underscore Importance of Immigrants in the U.S. Labor Force Introduction: by
The Brookings Institution Metropolitan Policy Program Robert Puentes, Fellow
 The Brookings Institution Metropolitan Policy Program Robert Puentes, Fellow Caution: Challenges Ahead A Review of New Urban Demographics and Impacts on Transportation Eno Foundation Forum on the Future
The New U.S. Demographics
 The Brookings Institution Center on Urban and Metropolitan Policy The New U.S. Demographics Audrey Singer Funders Network on Population, Reproductive Health and Rights November 10, 2003 QUESTIONS How has
Changing Dynamics and. to the United States
 Jeffrey S. Passel Pew Hispanic Center Changing Dynamics and Characteristics of Immigration to the United States International Symposium on International Migration and Development United Nations, Torino,
U.S. Hispanics & Immigration: A Demographer s View
 Jeffrey S. Passel Pew Hispanic Center Washington, DC The Economics of Immigration Construction Economics Research Network Washington, DC December 6, 2007 U.S. Hispanics & Immigration: A Demographer s View
The Brookings Institution Metropolitan Policy Program Bruce Katz, Director
 The Brookings Institution Metropolitan Policy Program Bruce Katz, Director State of the World s Cities: The American Experience Delivering Sustainable Communities Summit February 1st, 2005 State of the
The Impact of Ebbing Immigration in Los Angeles: New Insights from an Established Gateway
 The Impact of Ebbing Immigration in Los Angeles: New Insights from an Established Gateway Julie Park and Dowell Myers University of Southern California Paper proposed for presentation at the annual meetings
LATINOS IN AMERICA: A Demographic Profile
 April 2012 LATINOS IN AMERICA: A Demographic Profile Latinos in the United States are a diverse and fast-growing group that is amassing considerable economic and political power. As data from the 2010
THE DEMOGRAPHY OF MEXICO/U.S. MIGRATION
 THE DEMOGRAPHY OF MEXICO/U.S. MIGRATION October 19, 2005 B. Lindsay Lowell, Georgetown University Carla Pederzini Villarreal, Universidad Iberoamericana Jeffrey Passel, Pew Hispanic Center * Presentation
Illegal Immigration: How Should We Deal With It?
 Illegal Immigration: How Should We Deal With It? Polling Question 1: Providing routine healthcare services to illegal Immigrants 1. Is a moral/ethical responsibility 2. Legitimizes illegal behavior 3.
Population Outlook for the Portland-Vancouver Metropolitan Region
 Portland State University PDXScholar Institute of Portland Metropolitan Studies Publications Institute of Portland Metropolitan Studies 2007 Population Outlook for the Portland-Vancouver Metropolitan Region
Unauthorized Immigrants Today: A Demographic Profile Immigration P...
 Unauthorized Immigrants Today: A Demographic Profile With Congress gridlocked on immigration reform, all eyes have turned to the White House to implement administrative reforms that will address some of
Cultural Frames: An Analytical Model
 Figure 1.1 Cultural Frames: An Analytical Model Hyper-Selectivity/ Hypo-Selectivity Ethnic Capital Tangible and Intangible Resources Host Society Public Institutional Resources The Stereotype Promise/Threat
Immigration and Language
 NATIONAL CENTER ON IMMIGRANT INTEGRATION POLICY Immigration and Language Michael Fix Michael Fix Senior Vice President Earl Warren Institute University of California, Berkeley May 4, 2009 Points of Departure
Youth at High Risk of Disconnection
 Youth at High Risk of Disconnection A data update of Michael Wald and Tia Martinez s Connected by 25: Improving the Life Chances of the Country s Most Vulnerable 14-24 Year Olds Prepared by Jacob Rosch,
Measuring Mexican Emigration to the United States Using the American Community Survey
 Measuring Mexican Emigration to the United States Using the American Community Survey Eric Jensen and Matthew Spence Population Division U.S. Census Bureau International Forum on Migration Statistics January
Hispanics, Immigration and the Nation s Changing Demographics
 Hispanics, Immigration and the Nation s Changing Demographics Ana Gonzalez-Barrera Senior Researcher Immigration and Demographics U.S. Immigrant Population Reached 45 million in 2015; Projected to be 78.2
SECTION 1. Demographic and Economic Profiles of California s Population
 SECTION 1 Demographic and Economic Profiles of s Population s population has special characteristics compared to the United States as a whole. Section 1 presents data on the size of the populations of
New Patterns in US Immigration, 2011:
 Jeffrey S. Passel Pew Hispanic Center Washington, DC Immigration Reform: Implications for Farmers, Farm Workers, and Communities University of California, DC Washington, DC 12-13 May 2011 New Patterns
Demographic Trends Affecting Transportation in the U.S.
 Demographic Trends Affecting Transportation in the U.S. Robert Puentes September 11, 2008 Washington, DC Demographic Trends Affecting Transportation in the U.S. 1 2 3 Realities on the ground have changed
BIG PICTURE: CHANGING POVERTY AND EMPLOYMENT OUTCOMES IN SEATTLE
 BIG PICTURE: CHANGING POVERTY AND EMPLOYMENT OUTCOMES IN SEATTLE January 218 Author: Bryce Jones Seattle Jobs Initiative TABLE OF CONTENTS Introduction 1 Executive Summary 2 Changes in Poverty and Deep
Selected trends in Mexico-United States migration
 Selected trends in Mexico-United States migration Since the early 1970s, the traditional Mexico- United States migration pattern has been transformed in magnitude, intensity, modalities, and characteristics,
Geographic Mobility of New Jersey Residents. Migration affects the number and characteristics of our resident population
 Geographic Mobility of New Jersey Residents Migration affects the number and characteristics of our resident population Geographic Mobility of New Jersey Residents More than 4.1 million (or 47.4%) New
Hispanic Market Demographics
 Hispanic Market Demographics April 2008 Funded by The Beef Checkoff Why does this demographic deserve increased attention? Because the U.S. Hispanic population consists of 44.3 million people and is growing
Demographic Changes, Health Disparities, and Tuberculosis
 Demographic Changes, Health Disparities, and Tuberculosis Joan M. Mangan, PhD, MST October 22, 2015 Delivering Culturally Competent Patient Education and Care to Tuberculosis Program Clients Austin, TX
Immigration and the U.S. Economy
 Immigration and the U.S. Economy Pia M. Orrenius, Ph.D. Federal Reserve Bank of Dallas June 19, 2007 Mercatus Center, George Mason University Disclaimer: The views expressed herein are those of the presenter;
OVERVIEW. Demographic Trends. Challenges & Opportunities. Discussion
 People on the Move James H. Johnson, Jr. Frank Hawkins Kenan Institute of Private Enterprise Kenan-Flagler Business School University of North Carolina at Chapel Hill January 2017 OVERVIEW Demographic
Backgrounder. Immigrants in the United States, 2007 A Profile of America s Foreign-Born Population. Center for Immigration Studies November 2007
 Backgrounder Center for Immigration Studies November 2007 s in the United States, 2007 A Profile of America s Foreign-Born Population By Steven A. Camarota This Backgrounder provides a detailed picture
Inside the 2012 Latino Electorate
 June 3, 2013 Mark Hugo Lopez, Associate Director Ana Gonzalez-Barrera, Research Associate FOR FURTHER INFORMATION CONTACT: Pew Hispanic Center 1615 L St, N.W., Suite 700 Washington, D.C. 20036 Tel(202)
An Analysis of the Economic Impact of Undocumented Workers on Business Activity in the US with Estimated Effects by State and by Industry
 AN ESSENTIAL RESOURCE: An Analysis of the Economic Impact of Undocumented Workers on Business Activity in the US with Estimated Effects by State and by Industry Prepared by The Perryman Group 510 North
Econ 196 Lecture. The Economics of Immigration. David Card
 Econ 196 Lecture The Economics of Immigration David Card Main Questions 1. What are the characteristics of immigrants (and second generation immigrants)? 2. Why do people immigrate? Does that help explain
Regional demographic. institute view
 institute view by william h. frey Regional demographic shifts have always been a driving force in shaping American politics. And the latest numbers released from the 2000 census, along with the startling
DATA PROFILES OF IMMIGRANTS IN THE DISTRICT OF COLUMBIA
 DATA PROFILES OF IMMIGRANTS IN THE DISTRICT OF COLUMBIA LATINO IMMIGRANTS Demographics Economic Opportunity Education Health Housing This is part of a data series on immigrants in the District of Columbia
Evaluating Methods for Estimating Foreign-Born Immigration Using the American Community Survey
 Evaluating Methods for Estimating Foreign-Born Immigration Using the American Community Survey By C. Peter Borsella Eric B. Jensen Population Division U.S. Census Bureau Paper to be presented at the annual
The Great Immigration Turnaround
 The Great Immigration Turnaround New Facts and Old Rhetoric Dowell Myers USC Sol Price School of Public Policy Overview Where is immigration growing fastest? Divided opinion and fears about immigration
Chapter 3 - Community Demographics
 Comprehensive plans are prepared using a framework of population, household and economic trends. Demographic data available for the preparation of this plan is from the 2 census, data that is eight years
The Latino Electorate in 2010: More Voters, More Non-Voters
 April 26, 2011 The Latino Electorate in 2010: More Voters, More Non-Voters Mark Hugo Lopez, Associate Director FOR FURTHER INFORMATION CONTACT: Pew Hispanic Center 1615 L St, N.W., Suite 700 Washington,
Chapter 1: The Demographics of McLennan County
 Chapter 1: The Demographics of McLennan County General Population Since 2000, the Texas population has grown by more than 2.7 million residents (approximately 15%), bringing the total population of the
The Political Geography of Virginia and Florida: Bookends of the New South
 Table 1. Growth by Migration Components: and Florida, 2000 2007 Florida 2007 Population (000s) 7,712 18,251 Growth Rate* Total 8.5 13.7 Migration Rate* Domestic Migration 2.1 7.8 Immmigration 2.1 4.0 *
The Brookings Institution Metropolitan Policy Program Robert Puentes, Fellow
 The Brookings Institution Metropolitan Policy Program Robert Puentes, Fellow The Changing Shape of the City Rail-Volution Chicago, IL November 7, 2006 The Changing Shape of the City I What is the context
Left out under Federal Health Reform: Undocumented immigrant adults excluded from ACA Medicaid expansions
 Left out under Federal Health Reform: Undocumented immigrant adults excluded from ACA Medicaid expansions Jessie Kemmick Pintor, MPH Graduate Research Assistant State Health Access Data Assistance Center
What Lies Ahead: Population, Household and Employment Forecasts to 2040 April Metropolitan Council Forecasts to 2040
 The Metropolitan Council forecasts population, households and employment for the sevencounty Minneapolis-St. Paul region with a 30-year time horizon. The Council will allocate this regional forecast to
Pulling Open the Sticky Door
 Pulling Open the Sticky Door Social Mobility among Latinos in Nebraska Lissette Aliaga-Linares Social Demographer Office of Latino/Latin American Studies (OLLAS) University of Nebraska at Omaha Overview
Left out under Federal Health Reform: Undocumented immigrant adults excluded from ACA Medicaid expansions
 Left out under Federal Health Reform: Undocumented immigrant adults excluded from ACA Medicaid expansions Jessie Kemmick Pintor, MPH Graduate Research Assistant State Health Access Data Assistance Center
Le Sueur County Demographic & Economic Profile Prepared on 7/12/2018
 Le Sueur County Demographic & Economic Profile Prepared on 7/12/2018 Prepared by: Mark Schultz Regional Labor Market Analyst Southeast and South Central Minnesota Minnesota Department of Employment and
Understanding Immigration:
 Understanding Immigration: Key Issues in Immigration Debates and Prospects for Reform Presented by Judith Gans Immigration Policy Project Director judygans@email.arizona.edu Udall Center Immigration Program
U.S. immigrant population continues to grow
 U.S. immigrant population continues to grow Millions 45 40 35 30 25 20 15 10 5 0 Source: PEW Research Center. All foreign-born immigrants Unauthorized immigrants 40.4 38.0 31.1 12.0 11.1 8.4 2000 2007
Facts & Figures in this issue: income employment growth trends baby boomers millennials immigration
 Facts & Figures in this issue: income employment growth trends baby boomers millennials immigration 2017 Baby Boomers The term baby boomer refers to individuals born in the United States between 1946 and
Latinos and the Future of American Politics. Marc Rodriguez, History Department, Portland State
 Latinos and the Future of American Politics Marc Rodriguez, History Department, Portland State Largest Minority Electoral Block: But Also Very Diverse Since 2008 nearly 30% of Latinos have voted for Republicans
Friday Session: 8:45 10:15 am
 The Rocky Mountain Land Use Institute Friday Session: 8:45 10:15 am Hispanic Immigration in the Rocky Mountain West 8:45 10:15 a.m. Friday, March 10, 2006 Sturm College of Law/Frank J. Ricketson Law Building
What's Driving the Decline in U.S. Population Growth?
 Population Reference Bureau Inform. Empower. Advance. What's Driving the Decline in U.S. Population Growth? Mark Mather (May 2012) Between 2010 and 2011, the U.S. population increased by 0.7 percent, after
National Population Growth Declines as Domestic Migration Flows Rise
 National Population Growth Declines as Domestic Migration Flows Rise By William H. Frey U.S. population trends are showing something of a dual personality when viewed from the perspective of the nation
Extrapolated Versus Actual Rates of Violent Crime, California and the United States, from a 1992 Vantage Point
 Figure 2.1 Extrapolated Versus Actual Rates of Violent Crime, California and the United States, from a 1992 Vantage Point Incidence per 100,000 Population 1,800 1,600 1,400 1,200 1,000 800 600 400 200
Does Immigration Raise or Lower Taxes?
 Does Immigration Raise or Lower Taxes? Demography 175 Tuesday, April 2, 2018 Gretchen Donehower, UC Berkeley Demography 1997 2016 Thanks to Dr. Francine Blau, Chair of the 2016 Panel, for use of several
California s Congressional District 37 Demographic Sketch
 4.02.12 California s Congressional District 37 Demographic Sketch MANUEL PASTOR JUSTIN SCOGGINS JARED SANCHEZ Purpose Demographic Sketch Understand the Congressional District s population and its unique
Disruptive Demographics: Implications for North Carolina s Health and Competitiveness
 Disruptive Demographics: Implications for North Carolina s Health and Competitiveness James H. Johnson, Jr. Frank Hawkins Kenan Institute of Private Enterprise Kenan-Flagler Business School University
Latinos in Saratoga County. Trudi Renwick Senior Economist Fiscal Policy Institute April 26, 2008
 Latinos in Saratoga County Trudi Renwick Senior Economist Fiscal Policy Institute April 26, 2008 1 Fiscal Policy Institute set out to take a calm look at the real role of immigrants in New York Working
Attitudes toward Immigration: Findings from the Chicago- Area Survey
 Vol. 3, Vol. No. 4, 4, No. December 5, June 2006 2007 A series of policy and research briefs from the Institute for Latino Studies at the University of Notre Dame About the Researchers Roger Knight holds
Salvadorans. in Boston
 Salvadorans in Boston Banda El Salvador at the 2013 Rose Parade in Pasadena, California. Photo by Prayitno Photography, retrieved from flickr.com/ photos/prayitnophotography (Creative Commons Attribution
The migration ^ immigration link in Canada's gateway cities: a comparative study of Toronto, Montreal, and Vancouver
 Environment and Planning A 2006, volume 38, pages 1505 ^ 1525 DOI:10.1068/a37246 The migration ^ immigration link in Canada's gateway cities: a comparative study of Toronto, Montreal, and Vancouver Feng
Racial integration between black and white people is at highest level for a century, new U.S. census reveals
 Thursday, Dec 16 2010 Racial integration between black and white people is at highest level for a century, new U.S. census reveals By Daily Mail Reporter Last updated at 1:11 PM on 16th December 2010 But
Public Opinion & Political Action
 Public Opinion & Political Action Key Terms Public opinion = the distribution of the population s beliefs about politics and policy issues Demography = science of population changes Census = actual enumeration
Disruptive Demographics and the Triple Whammy of Geographic Disadvantage for America s Youth
 Disruptive Demographics and the Triple Whammy of Geographic Disadvantage for America s Youth James H. Johnson, Jr. Frank Hawkins Kenan Institute of Private Enterprise Kenan-Flagler Business School University
IMMIGRANTS. Udall Center for Studies in Public Policy The University of Arizona
 ECONOMIC CONTRIBUTIONS of IMMIGRANTS IN THE UNITED STATES A Regional and State-by-State Analysis JUDITH GANS Udall Center for Studies in Public Policy The University of Arizona research support provided
Tell us what you think. Provide feedback to help make American Community Survey data more useful for you.
 DP02 SELECTED SOCIAL CHARACTERISTICS IN THE UNITED STATES 2016 American Community Survey 1-Year Estimates Supporting documentation on code lists, subject definitions, data accuracy, and statistical testing
Managing Migration and Integration: Europe and the US March 9, 2012
 Managing Migration and Integration: Europe and the US March 9, 2012 MIGRANTS IN EUROPE... 1 ECONOMIC EFFECTS OF MIGRANTS... 3 INTEGRATION POLICIES: GERMANY... 4 INTEGRATION POLICIES: US... 5 Most Americans
Seattle Public Schools Enrollment and Immigration. Natasha M. Rivers, PhD. Table of Contents
 Seattle Public Schools Enrollment and Immigration Natasha M. Rivers, PhD Table of Contents 1. Introduction: What s been happening with Enrollment in Seattle Public Schools? p.2-3 2. Public School Enrollment
The Brookings Institution Metropolitan Policy Program Bruce Katz, Director
 The Brookings Institution Metropolitan Policy Program Bruce Katz, Director The State of American Cities and Suburbs Habitat Urban Conference March 18, 2005 The State of American Cities and Suburbs I What
Brazilians. imagine all the people. Brazilians in Boston
 Brazilians imagine all the people Brazilians in Boston imagine all the people is a series of publications produced by the Boston Redevelopment Authority for the Mayor s Office of Immigrant Advancement.
 Page 1 of 5 DP02 SELECTED SOCIAL CHARACTERISTICS IN THE UNITED STATES 2013 American Community Survey 1-Year Estimates Although the American Community Survey (ACS) produces population, demographic and housing
Battleground Districts July 2018 Midterm Survey Immigration Policy Attitudes
 1. Thinking about the election for Congress and other state offices in November 2018, how likely are you to vote on a scale between 0 and 10, where 0 means you definitely do not want to vote, and 10 means
What Travel Trends Might Tell Us About the Future
 University of Massachusetts Amherst ScholarWorks@UMass Amherst Tourism Travel and Research Association: Advancing Tourism Research Globally 2014 Marketing Outlook Forum - Outlook for 2015 What Travel Trends
Prophetic City: Houston on the Cusp of a Changing America.
 Prophetic City: Houston on the Cusp of a Changing America. Tracking Responses to the Economic and Demographic Transformations through 36 Years of Houston Surveys Dr. Stephen L. Klineberg TACA 63rd Annual
Gone to Texas: Migration Vital to Growth in the Lone Star State. Pia Orrenius Federal Reserve Bank of Dallas June 27, 2018
 Gone to Texas: Migration Vital to Growth in the Lone Star State Pia Orrenius Federal Reserve Bank of Dallas June 27, 2018 Roadmap History/Trends in migration to Texas Role in economic growth Domestic migration
Disruptive Demographics and the Triple Whammy of Geographic Disadvantage
 Disruptive Demographics and the Triple Whammy of Geographic Disadvantage James H. Johnson, Jr. Frank Hawkins Kenan Institute of Private Enterprise Kenan-Flagler Business School University of North Carolina
Who Are These Unauthorized Immigrants and What Are We Going To Do About Them?
 Who Are These Unauthorized Immigrants and What Are We Going To Do About Them? UNT Speaks Out Valerie Martinez-Ebers April 13, 2011 Growing Diversity in the United States Population National Population
CHANGING DEMOGRAPHICS AND IMMIGRATION POLITICS IN COLORADO. June 25, 2014
 CHANGING DEMOGRAPHICS AND IMMIGRATION POLITICS IN COLORADO June 25, 2014 Latino influence in Colorado Demographic trends Participation and party competition Immigration Politics The Colorado Population
History of Immigration to Texas
 History of Immigration to Texas For most of its history, Texas has attracted settlers from the rest of the nation rather than abroad Mexican immigrants did not begin to settle permanently until late 1970s
Labor Market Integration: as a response to goods market failure to adjust
 Labor Market Integration: as a response to goods market failure to adjust LINK CONFERENCE 2005: DISCUSSING THE WORLD FOR THE FUTURE CLEMENTE RUIZ DURAN MEXICO, MAY 2005 North America: INTEGRACION Labor
Hispanic Employment in Construction
 Hispanic Employment in Construction Published by the CPWR Data Center The recent economic downturn affected the entire U.S. construction industry. To better understand how Hispanic construction workers
Unemployment Rises Sharply Among Latino Immigrants in 2008
 Report February 12, 2009 Unemployment Rises Sharply Among Latino Immigrants in 2008 Rakesh Kochhar Associate Director for Research, Pew Hispanic Center The Pew Hispanic Center is a nonpartisan research
Demographic, Economic and Social Transformations in Bronx Community District 4: High Bridge, Concourse and Mount Eden,
 Center for Latin American, Caribbean & Latino Studies Graduate Center City University of New York 365 Fifth Avenue Room 5419 New York, New York 10016 Demographic, Economic and Social Transformations in
How Distance Matters: Comparing the Causes and Consequence of Emigration from Mexico and Peru
 How Distance Matters: Comparing the Causes and Consequence of Emigration from Mexico and Peru Ayumi Takenaka & Karen A. Pren May 2008 Latino migrants are heterogeneous Latino migrants are heterogeneous
CLACLS. Demographic, Economic, and Social Transformations in Bronx Community District 5:
 CLACLS Center for Latin American, Caribbean & Latino Stud- Demographic, Economic, and Social Transformations in Bronx Community District 5: Fordham, University Heights, Morris Heights and Mount Hope, 1990
Disruptive Demographics: Implications for the Accounting Profession James H. Johnson, Jr. Distinguished Professor of Entrepreneurship & Strategy,
 Disruptive Demographics: Implications for the Accounting Profession James H. Johnson, Jr. Distinguished Professor of Entrepreneurship & Strategy, University of North Carolina Kenan-Flagler Business School
Agricultural Outlook Forum Presented: March 1-2, 2007 U.S. Department of Agriculture
 Agricultural Outlook Forum Presented: March 1-2, 2007 U.S. Department of Agriculture IMMIGRATION REFORM AND AGRICULTURE William Kandel & Ashok Mishra Resource and Rural Economics Division Economic Research
Latinos and the 2008 Presidential Elections: a Visual Data Base
 Latinos and the 2008 Presidential Elections: a Visual Data Base Center for Latin American, Caribbean & Latino Studies Graduate Center City University of New York 365 Fifth Avenue Room 5419 New York, New
The Reshaping of America. The Reshaping of America. The Reshaping of America. The Reshaping of America 9/17/2014
 Columbia Room B 9:45 AM 1:35 AM Hyatt Grand Regency Capitol Hill Tuesday September 9, 214 Welcome Today s Session Guest Speaker Questions and Answer Current Situation Changing demographics across the country
DEMOGRAPHIC AND SOCIOECONOMIC CHARACTERISTICS OF CUBAN-AMERICANS: A FIRST LOOK FROM THE U.S POPULATION CENSUS
 DEMOGRAPHIC AND SOCIOECONOMIC CHARACTERISTICS OF CUBAN-AMERICANS: A FIRST LOOK FROM THE U.S. 2000 POPULATION CENSUS Daniel J. Perez-Lopez 1 The 2000 U.S. Population Census, conducted between January and
Peruvians in the United States
 Peruvians in the United States 1980 2008 Center for Latin American, Caribbean & Latino Studies Graduate Center City University of New York 365 Fifth Avenue Room 5419 New York, New York 10016 212-817-8438
K.W.S. Saddhananda. Deputy Director Statistics. Department of Labour, Sri Lanka. Member of the National Statistical Office (DCS)
") Regional workshop on strengthening the collection and use of international migration data in the context of the 2030 Agenda for Sustainable Development from 31 January to 3 February 2017 in Bangkok, Thailand.
Regional workshop on strengthening the collection and use of international migration data in the context of the 2030 Agenda for Sustainable Development from 31 January to 3 February 2017 in Bangkok, Thailand.
Nelson A City in Central Kootenay Regional District
 Produced by Stats for Global NonResponse Rate: 28.3 Population Total Immigrants Change in Change in Immigrants Population Number Percent Population Number Percent 1991 8,849 1,175 13.3 1991 to 1996 736