Six Disruptive Demographics That Will Change the U.S. Forever
|
|
|
- Holly Allison
- 5 years ago
- Views:
Transcription

1 Six Disruptive Demographics That Will Change the U.S. Forever October 2017
2 OVERVIEW Demographic Trends Challenges & Opportunities Discussion October
3 what CENSUS 2010 will REVEAL October 2017 October
4
5 6 DISRUPTIVE TRENDS The South Rises Again The Browning of America Marrying Out is In The Silver Tsunami is About Hit The End of Men? Cooling Water from Grandma s Well and Grandpa s Too! October
6 People on the Move The South Rises Again!

7 The South Continues To Rise...Again! October
8 Years South s Share of U.S. Net Population Growth, Selected Years, U.S. Absolute Population Change South s Absolute Population Change South s Share of Change ,974,129 8,468,303 27% ,123,138 9,339,455 33% ,886,128 15,598,279 30% ,497,947 22,650,563 50% ,035,665 29,104,814 49%
9 U.S. POPULATION CHANGE BY REGION, Region 2010 Population Absolute Population Change, Percent Population Change, U.S. 309,050,816 26,884, % Northeast 55,417,311 1,753, % Midwest 66,972,887 2,480, % South 114,555,744 14,318, % West 72,256,183 8,774, % Pennsylvania 12,702, , %
10 SHARES OF NET POPULATION GROWTH BY REGION, Region Absolute Population Change Percent of Total UNITED STATES 26,884, NORTHEAST 1,753, MIDWEST 2,480, SOUTH 14,318, WEST 8,774,
11 NET MIGRATION TRENDS, Northeast Midwest South West Total 1,032 2,008 +2, Black Hispanic Elderly Foreign born October 2017 = Net Import = Net Export 11
12 GROSS AND NET MIGRATION FOR THE SOUTH, The Region Domestic Foreign Years In Out Net In Out Net ,125,096 3,470, , , , , ,874,414 3,477, , , , ,300 Florida Domestic Foreign Years In Out Net In Out Net , , ,002 41,745 24,108 17, , ,087-13,156 33,095 32,094 1,001
13 State Share of South s Net Growth, Region/State Absolute Change State s Share The South 14,318, % Texas 4,293, % Florida 2,818, % Georgia 1,501, % North Carolina 1,486, % Other Southern States 4,218, % October

14

15
16 U.S. POPULATION CHANGE BY REGION, Region 2015 Population Absolute Population Change, Percent Population Change, U.S. 321,418,820 12,071, % Northeast 56,283, , % Midwest 67,907, , % South 121,182,847 6,319, % West 76,044,679 3,925, %
17 SHARES OF NET POPULATION GROWTH BY REGION, Region UNITED STATES Absolute Population Change Percent of Total 12,071, NORTHEAST 896, MIDWEST 929, SOUTH 6,319, WEST 3,925,
18 STATE SHARES OF SOUTH S NET GROWTH, Region/State Absolute State s Share Change The South 6,319, % Texas 2,244, % Florida 1,421, % Georgia 501, % North Carolina 483, % Virginia 357, % Other Southern States 1,311, %
19 Absolute and Relative Population Change, Area 2016 Population Absolute Change Percent Change U.S. 323,127,513 13,779, % Northeast 56,209, , % Mid Atlantic 41,473, , % Pennsylvania 12,784,227 71, % September
20 Balance of Population Change Equation Population Change = In Flows Out Flows where In flows = [Births + In Migrants] & Out Flows =[Deaths + Out Migrants]
21 Typology of Communities Demographic Experience Balanced Growth Natural Growth Migration Magnets Dying Biologically Declining Emptying Out Drivers Births exceed deaths and in migration exceeds outmigration. Out migration exceeds in migration but this population loss is offset by an excess of births over deaths. Deaths exceed births but population loss is averted because in migration exceeds out migration. Deaths exceed births and out migration exceeds inmigration, resulting in population loss. In migration exceeds out migration but his net migration is not substantial enough to offset an excess of deaths over births Births exceed deaths but out migration exceeds inmigration, resulting in net population loss
22 Area Estimated Change Pennsylvania, Total Population Change Natural Change Net Migration Pennsylvania 135, ,089 10,163
23 Area Net Migration Pennsylvania Total Net Migration International Net Migration Domestic Net Migration Pennsylvania 11, , ,614
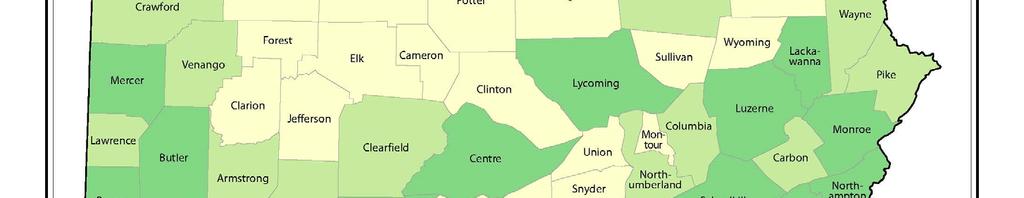
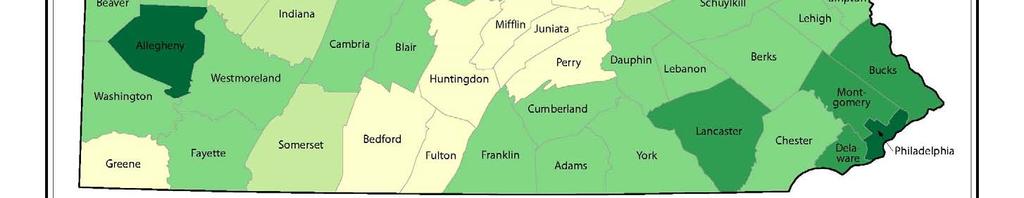
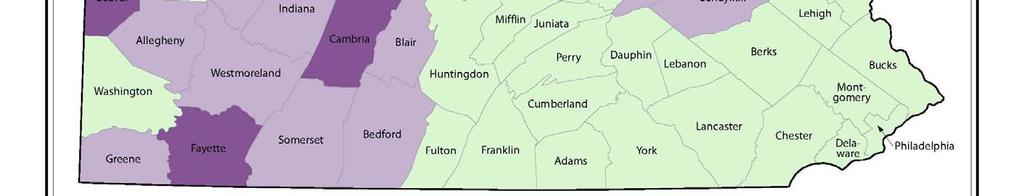
24 Estimated Change Pennsylvania and GPNP Counties Area 2016 Population Absolute Change Percent Change Pennsylvania 12,784,227 71, % GPNP Counties 2,762,947-33, % Allegheny 1,225,365 1, % Armstrong 66,486-2, % Beaver 167,429-3, % Butler 186,847 2, % Cambria 134,732-8, % Fayette 132,733-3, %
25 Area Estimated Change GPNP Counties Total Population Change Natural Change Net Migration Greene 37,197-1, % Indiana 86,364-2, % Lawrence 87,294-3, % Somerset 75,061-2, % Washington 207, % Westmoreland 355,458-9, %
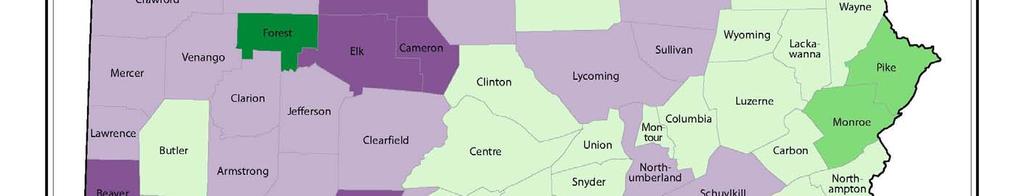
26 County Migration Magnet GPNP Counties Total Population Change Natural Change Net Migration Butler 2, ,227 Allegheny 2,027-2,894 8,028 Washington 133-3,161 3,572
27 Dying GPNP Counties, County Total Population Change Natural Change Net Migration Greene -1, ,091 Armstrong -2,452-1,239-1,153 Indiana -2, ,254 Somerset -2,685-1,548-1,020 Beaver -3,110-2, Lawrence -3,846-1,228-2,498 Fayette -3,869-2,643-1,023 Cambria -8,942-3,046-5,721 Westmoreland -9,706-7,972-1,179
28 THE BROWNING OF AMERICA October
29
30 The Numbers Legal Immigrants Year Annual Flow , , , , ,137, ,067,000 Refugees, Parolees, Asylees Year Annual Flow , , , , ,500
31 The Numbers Cont d Illegal Immigrants 300,000 to 400,000 annually over the past two decades Three million granted amnesty in million illegal immigrants remained after 1986 reforms October 1996: INS estimated there were 5 million illegal immigrants in U.S. Since August 2005: Estimates of illegal population have ranged between 7 million and 15 million Today: An estimated 11.0 million unauthorized immigrants reside in U.S.
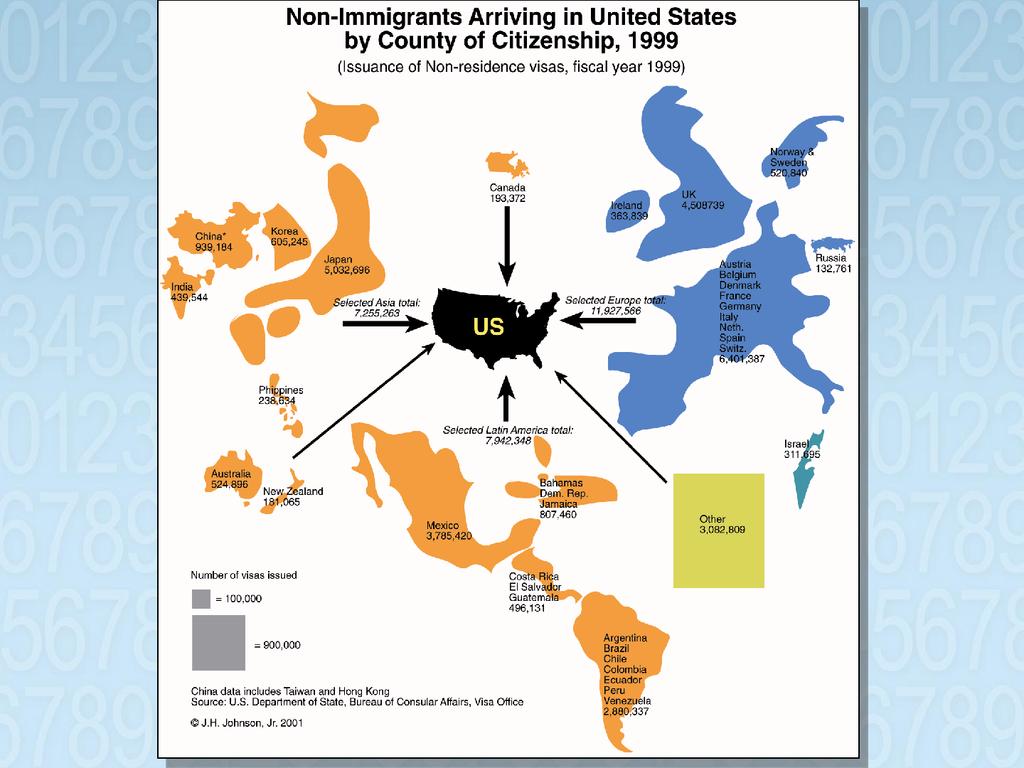
32 NON-IMMIGRANTS ADMITTED TO UNITED STATES, SELECTED YEARS, Year All Classes Exchange Visitors Academic & Vocational Students ,756, ,023 (1%) 271,861 (2%) ,539, ,213 (1%) 285,496 (3%) ,574, ,644 (1%) 355,207 (2%) ,640, ,364 (1%) 395,480 (2%) ,690, ,743 (1%) 699,953 (2%) ,824, ,435 (1%) 741,921 (2%) ,907, ,176 (1%) 687,506 (2%) ,381, ,138 (1%) 917,373 (2%) ,082, , 931 (1%) 1,702,730 (3%)
33
34 U.S. Immigrant Population, Number of Immigrants (in millions) Year
35 U.S. Foreign Born Population by Race/Ethnicity, 2014 Race/Ethnicity Foreign Population Share of Total (%) Total 42,235, Hispanic 19,300, White Alone, not 7,655, Hispanic Black Alone, not 3,377, Hispanic Asian Alone, not 11,036, Hispanic Other Alone, not Hispanic 866,
36 U.S. POPULATION CHANGE BY RACE & ETHNICITY, Percentage Race 2010 Population Absolute Change Change Total 308,745,538 27,323, % Non-Hispanic 258,267,944 12,151, % White 196,817,552 2,264, % Black 37,685,848 3,738, % AI/AN 2,247, , % Asian 14,465,124 4,341, % NH/PI 481, , % 2 or More Races 5,966,481 1,364, % Hispanic 50,477,594 15,171, %
37 PENNSYLVANIA POPULATION CHANGE BY RACE & ETHNICITY, Race 2010 Population Absolute Change Percentage Change Total 12,702, , % Non-Hispanic 11,982,719 95, % White 10,094, , % Black 1,327, , % AI/AN 16,909 2, % Asian 346, , % NH/PI 2, % Some other race 16,469 3, % 2 or More Races 178,595 65, % Hispanic 719, , %
38 NON-WHITE AND HISPANIC SHARES OF Area POPULATION GROWTH, Absolute Population Change Non-White Share Hispanic Share US 27,323, South 14,318, Texas 4,293, Florida 2,818, Georgia 1,501, NC 1,486, Pennsylvania 421,
39 NON-WHITE AND HISPANIC SHARES OF POPULATION GROWTH, Area Absolute Population Change Non-White Share Hispanic Share US 12,071, South 6,319, Texas 2,224, Florida 1,421, Georgia 501, NC 483, VA 357,
40 MEDIAN AGE OF U.S. POPULATION BY RACE, HISPANIC ORIGIN & GENDER, 2014 Race Total Male Female United States White Alone White, Non-Hispanic Black Alone AI/AN Alone Asian Alone NH/PI Alone Two or More Races Hispanic September

41 Median Age and Fertility Rates for Females in Pennsylvania, Demographic Group All Females White, Not Hispanic Black American Indian & Alaskan Native Asian Native Hawaiian & Pacific Islander Some other race Two or more races Hispanic Native Born Foreign Born Source: *Women 15 to 50 with births in past 12 months. Median Age Fertility/1000 women* NA
42 TOTAL FERTILITY RATES FOR U.S. WOMEN BY RACE/ETHNICITY, 2012 Race/Ethnicity Total Fertility Rate All Races 1.88 Hispanic 2.18 Non-Hispanic White 1.76 Blacks 1.90 Asian 1.77 Native American 1.35
43 RELATIVE DISTRIBUTION OF U.S. BIRTHS BY RACE / ETHNICITY Race/Ethnicity White 66% 50% 49.6% Blacks 17% 16% 15.0% Hispanics 15% 26% 26.0% Other 2% 8% 9.4% Source: Johnson and Lichter (2010); Tavernise (2011).
44 RELATIVE DISTRIBUTION OF U.S. POPULATION BY RACE / ETHNICITY Race/Ethnicity White 67% 47% Blacks 12.8% 13% Hispanics 14% 29% Asian 5% 9% October Source: Pew Research Center, 2008 *projected.

45 Marrying Out is In October
46 INTERMARRIAGE TREND, % Married Someone of a Different Race/Ethnicity October


47 INTERMARRIAGE TYPES Newly Married Couples in 2008 October


48 THE SILVER TSUNAMI The Graying of America October
49 Key Drivers Changes in Longevity Declining Fertility Aging of Boomer Cohort
50 U.S. LIFE EXPECTANCY AT BIRTH YEAR AGE
51 Centenarians in the U.S. Year Number , , ,000
52 COMPLETED FERTILITY FOR WOMEN YEARS OLD Year Percent Childless Avg. Number of Children Percent Higher Order Births* *Three or more Children
53 U.S. POPULATION CHANGE BY AGE, Age 2010 Absolute Change Percentage Change < TOTAL 104,853,555 5,416, % 82,134,554-2,905, % 81,489,445 19,536, % 40,267,984 5,276, % 308,745,538 27,323, %
54
55
56 U.S. POPULATION TURNING 50, 55, 62, AND 65 YEARS OF AGE, ( ) Age 50 Age 55 Age 62 Age 65 Average Number/Day 12,344 11,541 9,221 8,032 Average Number/Minute September
57
58
59
60 Metropolitan and Micropolitan Destinations of Elderly Migrants,
61

 5,276,231 (15.1%) 421,325 (3.4%) 36,866 (0.9%) 381,774 ( 10.")
62 Absolute and Percent Population Change by Age, Age United States Pennsylvania All Ages < ,323,632 (9.7%) 5,416,292 (5.4%) 2,905,697 ( 3.4%) 19,536,809 (31.5%) 5,276,231 (15.1%) 421,325 (3.4%) 36,866 (0.9%) 381,774 ( 10.9%) 726,091 (25.6%) 40,142 (2.1%)
63 The Multigenerational Workforce
64 Multi-Generational Diversity Generation Birth Years Current Ages Est. Workforce Participation in 2013* Veterans Traditionalists WWII Generation Silent Generation Baby Boomers Boomers % (7M) % (60M) Generation X Baby Busters Generation Y Millennials % (51M) % (40M) September *Source: AARP Leading a Multi-Generational Workforce, 2007
65 Succession Planning & Accommodations for Elder Care Organizational Game Changers!
66 Signs of Global Aging Japan sells more adult diapers than baby diapers China has the 4:2:1 problem Today, 9% of the Chinese population is elderly (129 million) By 2050, the Chinese elderly population will total 330 million (25% of the total) larger than the entire U.S. population today
67 Signs of Global Aging, Cont d For the first time in 100 years, deaths exceeded births among U.S. non Hispanic whites in 2011 Today, 16% of the U.S. population is 65+; 26% will be elderly by Close to 40 million people in the U.S. provided unpaid eldercare in 2011 and 2012 at an estimated cost of $30 billion in loss work productivity.
68 Signs of Global Aging Cont d 10 million millennials are caring for adult family members. 25 percent of U.S. caregivers are between 18 and 34 years of age. Google launches a medical company Calico to defeat death by prolonging life.
69 Living Arrangements are more diverse And Interesting!
70 COOLING WATERS FROM GRANDMA S WELL And Grandpa s Too!
71 Children Living in Non-Grandparent and Grandparent Households, Household Type Absolute Number 2010 Absolute Change All 74,718 2, No Grandparents 67, Both 2, Grandparents Grandmother 1, Only Grandfather Only Percent Change September
72 Children Living in Non-Grandparent and Grandparent- Headed Households by Presence of Parents, 2010 Household Type All Children (in thousands) Living with Both Parents Living with Mother Only Living with Father Only All 74, % 23.1% 3.4% 4.0% No Grandparents Both Grandparents Grandmother Only Grandfather Only 67, % 21.2% 3.3% 2.1% Living with Neither parent 2, % 40.6% 5.2% 36.1% 1, % 48.4% 4.5% 33.2% % 45.9% 4.4% 23.6% September
73 Couple Households with Children, 2009 Type of Couple Married opposite sex Unmarried opposite sex Number of Households with Children Percent Own Children 23,453, ,493, Same Sex 104, Percent Unrelated Children
74 Same Sex Couple Households with Children, 2009 Type of Couple Number of Households with Children Percent Own Children Same Sex 104, Unmarried 33, Male Male Unmarried Female Female 71, Percent Unrelated Children


75 DIVERSITY RULES...but Challenges Abound September
76 Workforce Planning and Development Challenges The End of Men? The Triple Whammy of Geographic Disadvantage Education necessary, but not sufficient


77 The End of Men? October


78 FEMALE WORKFORCE REPRESENTATION % Female October
79 JOBS LOST/GAINED BY GENDER DURING 2007 (Q4) 2009 (Q3) RECESSION Industry Women Men Construction -106,000-1,300,000 Manufacturing -106,000-1,900,000 Healthcare +451, ,100 Government +176, ,000 Total -1,700,000-4,700,000
80 The Plight of Men Today, three times as many men of working age do not work at all compared to Selective male withdrawal from labor market rising nonemployment due largely to skills mismatches, disabilities & incarceration. The percentage of prime aged men receiving disability insurance doubled between 1970 (2.4%) and 2009 (4.8%). Since 1969 median wage of the American male has declined by almost $13,000 after accounting for inflation. After peaking in 1977, male college completion rates have barely changed over the past 35 years.
81 COLLEGE CLASS OF 2010 DEGREE MALE FEMALE DIFFERENCE Associate s 293, , ,000 Bachelor s 702, , ,000 Master s 257, , ,000 Professional 46,800 46, Doctor s 31,500 32,900 1,400 TOTAL 1,330,300 1,902, ,000 October
82 Gender Composition of Student Head Count Enrollment in NC Colleges & Universities, Fall 2014 Type of Institution Total Enrollment Male Enrollment Percent Male Enrollment All Institutions 554, , Bible Colleges 3,880 2, Public Institutions 459, , UNC System 220,121 95, PWIs 181,246 81, MSIs 38,875 14, HBUs 32,653 11, Community Colleges 239, , Private Institutions 90,974 38, Senior Colleges & 90,296 37, Universities Junior Colleges
83 Jobs Lost/Gained by Gender During 2007 (Q4) 2009 (Q3) Recession Industry Women Men Construction 106,000 1,300,000 Manufacturing 106,000 1,900,000 Healthcare +451, ,100 Government +176, ,000 Total 1,700,000 4,700,000 October
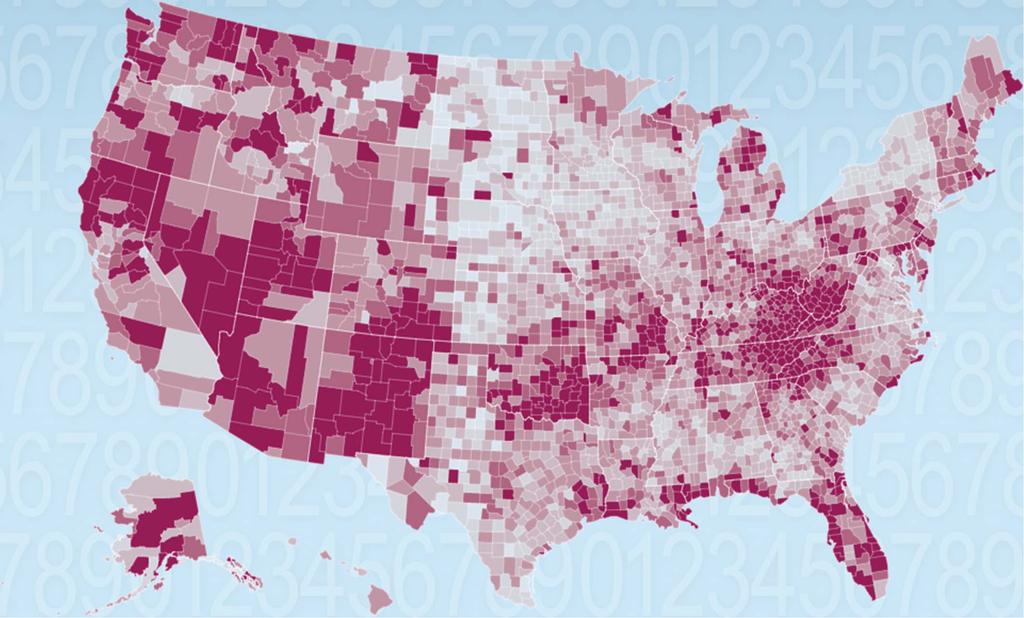
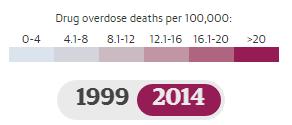
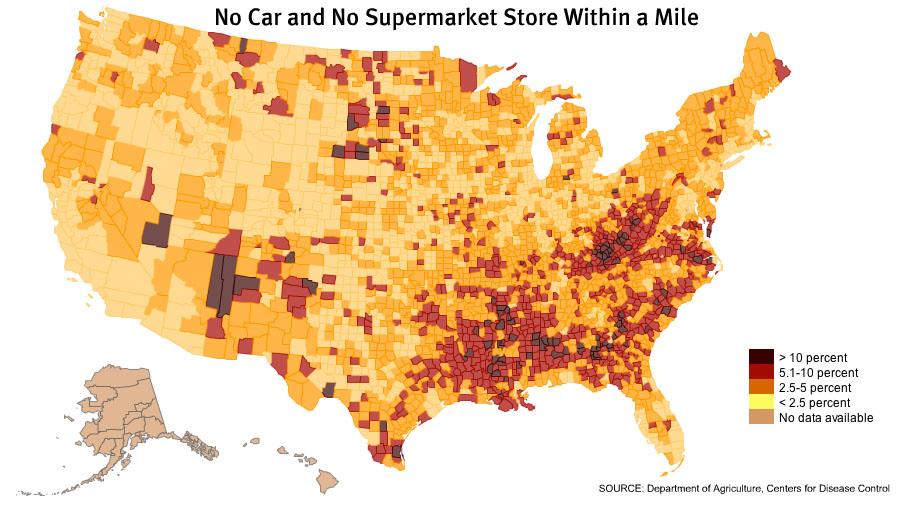
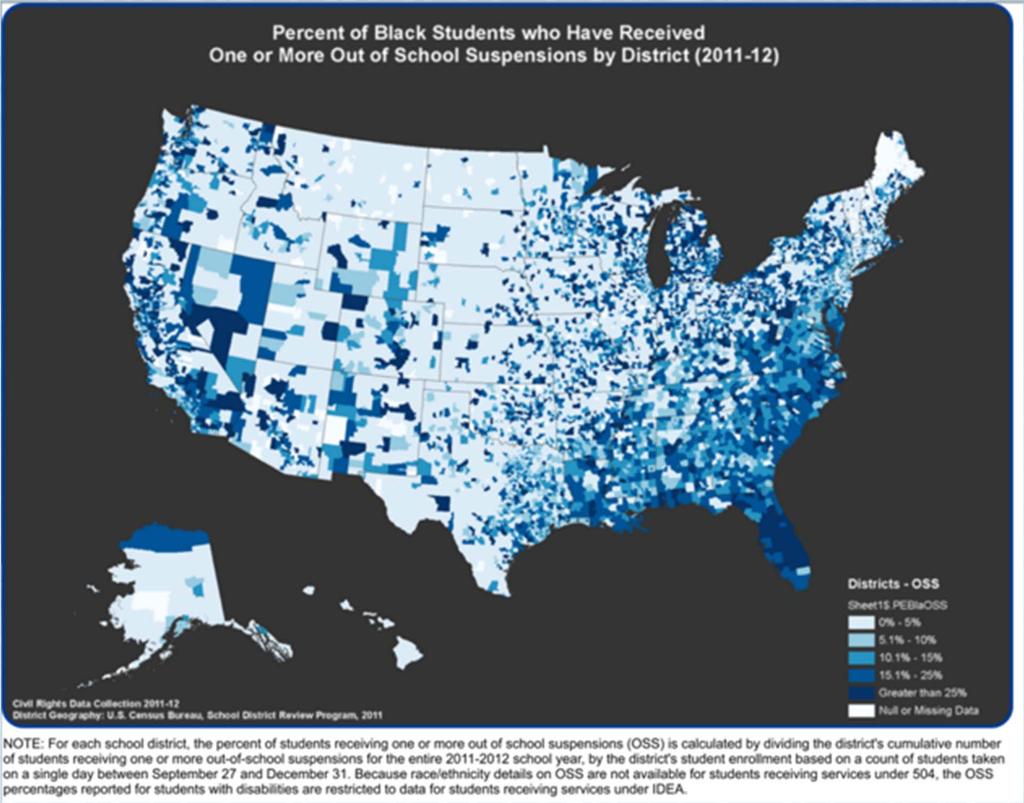
84 The Triple Whammy of Geographical Disadvantage The Human Capital Challenge


85 Racial Typology of U.S. Counties
86 Racial Typology of U.S. Counties
87 Racial Typology of U.S. Counties
88 Racial Typology of U.S. Counties

89 U.S. Racial Segregation by Census Tract
90 U.S. Racial Segregation by Census Tract
91 U.S. Racial Segregation by Census Tract
92 U.S. Racial Segregation by Census Tract


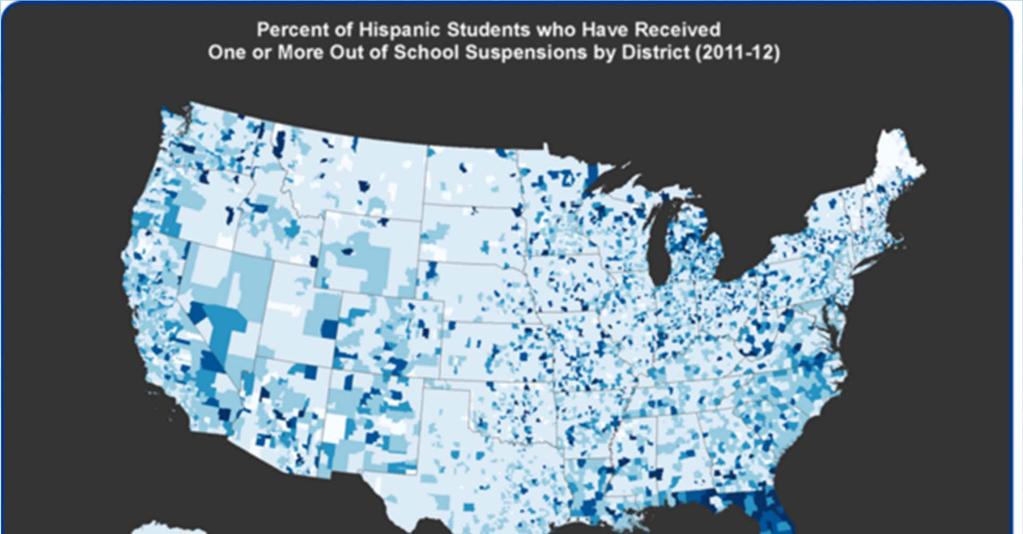
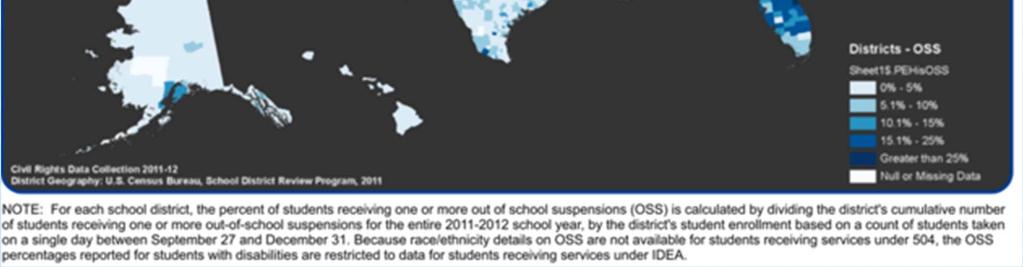
93 U.S. School Age Poverty by Census Tract
94 U.S. School Age Poverty by Census Tract

95 U.S. School Age Poverty by Census Tract
96 U.S. School Age Poverty by Census Tract


97 The Triple Whammy of Geographic Disadvantage
98 Summary Indicators of Level of Vulnerability Exposure Number of Youth Percent Non White Triple Whammy 9.8 million 93 Double 12.2 million 81 Whammy Single Whammy 20.0 million 39 No Whammy 32.1 million 24
99
100
101


102 Male-Female Presence Disparity 6400 Total Number of EOC Test Takers Number of Test Takers males females / / / /2011 Year Graph shows total number of male and female students tested of 6 LEAs (Bertie, Bladen, Duplin, Halifax, Northampton, and Pamlico)
103 Percent of High School Graduates Requiring Remedial Course Work , , , , , None One Two or MoreHS more GradsPercent of HS Grads


104 Education is Necessary...but insufficient
105 BACHELOR S DEGREE HOLDERS (UNDER AGE 25) WHO WERE JOBLESS OR UNDEREMPLOYED Year Percent
106 CHANGE IN INCIDENCE OF POVERTY BY EDUCATIONAL ATTAINMENT IN NC, , Educational Attainment Percent Change Less than High School 253, , % High School Graduate 216, , % Some College, Associate Degree 136, , % Bachelor s degree or higher 49,082 57, % Source: American Community Survey
107 The World of Working is Changing
108 The New World of Work Outsourcing Offshoring Robotic Outsourcing Freelancing & the Gig economy
109 THE COMPETITIVE TOOL KIT Analytical Reasoning Entrepreneurial Acumen Contextual Intelligence Soft Skills/Cultural Elasticity Agility and Flexibility
110 Maintaining & Enhancing Competitiveness Managing transition from the graying to the browning of America. Competition for talent will be fierce and global. Embrace immigrants. Address the wayward sons problem Actively engage in K 12 Education to ensure a steady flow of talent into all sectors of the SC economy. Successful recruitment and retention will hinge on your ability to effectively manage the full nexus of diversity issues. September

111 Race/Skin Color Iceberg Model of Diversity Visible Diversity Traits If all I know about you is what I can see Gender Visible Disability Age Group Ethnicity Physical Attributes Invisible Diversity Traits Level in Organization Culture Marital Status Values Education MBTI Religion/Religious Experiences International Cultural Immersion Communication Style Conflict Style Beliefs Teaching Style Recreational Habits IQ Learning Styles Academic Discipline Literacy Sexual Orientation Personality Style Orientation to Time Family Relationships Orientation to Tasks Physical Abilities/Qualities EQ Military Experience Socioeconomic Status Geographic Background Work Background Smoker/Non-Smoker Parental Status Native Born/Non-Native Born Political Ideology Thinking Style
112 THE END
113 Supplemental Slides October
114 Area Net Migration GPNP Counties Total Net Migration International Net Migration Domestic Net Migration Somerset -1, ,214 Beaver Lawrence -2, ,680 Fayette -1, ,400 Cambria -5, ,057 Westmoreland -1, ,797
115 Area Net Migration GPNP Counties Total Net Migration International Net Migration Domestic Net Migration Butler 3, ,594 Allegheny 8,028 19,756-11,728 Washington 3, ,653 Greene -1, ,106 Armstrong -1, ,186 Indiana -2, ,807
OVERVIEW. Demographic Trends. Challenges & Opportunities. Discussion
 People on the Move James H. Johnson, Jr. Frank Hawkins Kenan Institute of Private Enterprise Kenan-Flagler Business School University of North Carolina at Chapel Hill January 2017 OVERVIEW Demographic
Disruptive Demographics and the Triple Whammy of Geographic Disadvantage
 Disruptive Demographics and the Triple Whammy of Geographic Disadvantage James H. Johnson, Jr. Frank Hawkins Kenan Institute of Private Enterprise Kenan-Flagler Business School University of North Carolina
Disruptive Demographics: Implications for the Accounting Profession James H. Johnson, Jr. Distinguished Professor of Entrepreneurship & Strategy,
 Disruptive Demographics: Implications for the Accounting Profession James H. Johnson, Jr. Distinguished Professor of Entrepreneurship & Strategy, University of North Carolina Kenan-Flagler Business School
Disruptive Demographics: Implications for North Carolina s Health and Competitiveness
 Disruptive Demographics: Implications for North Carolina s Health and Competitiveness James H. Johnson, Jr. Frank Hawkins Kenan Institute of Private Enterprise Kenan-Flagler Business School University
Six Disruptive Demographics That Will Change the U.S. & South Carolina Forever
 Six Disruptive Demographics That Will Change the U.S. & South Carolina Forever James H. Johnson, Jr. Frank Hawkins Kenan Institute of Private Enterprise Kenan-Flagler Business School University of North
Disruptive Demographics and the Triple Whammy of Geographic Disadvantage for America s Youth
 Disruptive Demographics and the Triple Whammy of Geographic Disadvantage for America s Youth James H. Johnson, Jr. Frank Hawkins Kenan Institute of Private Enterprise Kenan-Flagler Business School University
Disruptive Demographics: Implications for Higher Education Institutions
 Disruptive Demographics: Implications for Higher Education Institutions James H. Johnson, Jr. Frank Hawkins Kenan Ins
Disruptive Demographics and North Carolina s Global Competitiveness Challenge
 Disruptive Demographics and North Carolina s Global Competitiveness Challenge James H. Johnson, Jr. Frank Hawkins Kenan Institute of Private Enterprise Kenan-Flagler Business School University of North
Six Disruptive Demographics That Will Change the U.S. Forever
 Six Disruptive Demographics That Will Change the U.S. Forever James H. Johnson, Jr. Frank Hawkins Kenan Institute of Private Enterprise Kenan-Flagler Business School University of North Carolina at Chapel
Disruptive Demographics: Implications for Workforce Planning and Development
 Disruptive Demographics: Implications for Workforce Planning and Development James H. Johnson, Jr. Ph.D. William Rand Kenan, Jr. Distinguished Professor of Entrepreneurship and Strategy Kenan-Flagler Business
People on the Move: Implications for Career Education
 People on the Move: Implications for Career Education James H. Johnson, Jr. Ph.D. William Rand Kenan, Jr. Distinguished Professor of Management Kenan-Flagler Business School Director, Urban Investment
What are the major changes you are seeing in your community?
 Court Trends, Changing Times in North Carolina, and Public Courts- the World Courts Work in Willow Jacobson, What are the major changes you are seeing in your community? Six Disruptive Trends The South
Demographic Changes, Health Disparities, and Tuberculosis
 Demographic Changes, Health Disparities, and Tuberculosis Joan M. Mangan, PhD, MST October 22, 2015 Delivering Culturally Competent Patient Education and Care to Tuberculosis Program Clients Austin, TX
What Lies Ahead: Population, Household and Employment Forecasts to 2040 April Metropolitan Council Forecasts to 2040
 The Metropolitan Council forecasts population, households and employment for the sevencounty Minneapolis-St. Paul region with a 30-year time horizon. The Council will allocate this regional forecast to
Pulling Open the Sticky Door
 Pulling Open the Sticky Door Social Mobility among Latinos in Nebraska Lissette Aliaga-Linares Social Demographer Office of Latino/Latin American Studies (OLLAS) University of Nebraska at Omaha Overview
SECTION 1. Demographic and Economic Profiles of California s Population
 SECTION 1 Demographic and Economic Profiles of s Population s population has special characteristics compared to the United States as a whole. Section 1 presents data on the size of the populations of
People. Population size and growth
 The social report monitors outcomes for the New Zealand population. This section provides background information on who those people are, and provides a context for the indicators that follow. People Population
Rural Child Poverty across Immigrant Generations in New Destination States
 Rural Child Poverty across Immigrant Generations in New Destination States Brian Thiede, The Pennsylvania State University Leif Jensen, The Pennsylvania State University March 22, 2018 Rural Poverty Fifty
Cultural Frames: An Analytical Model
 Figure 1.1 Cultural Frames: An Analytical Model Hyper-Selectivity/ Hypo-Selectivity Ethnic Capital Tangible and Intangible Resources Host Society Public Institutional Resources The Stereotype Promise/Threat
Chapter 7. Migration
 Chapter 7 Migration Chapter 7 Migration Americans have traditionally been highly higher levels of educational attainment than Figure 7-1. mobile, with nearly 1 in 7 people changing residence each year.
Dynamic Diversity: Projected Changes in U.S. Race and Ethnic Composition 1995 to December 1999
 Dynamic Diversity: Projected Changes in U.S. Race and Ethnic Composition 1995 to 2050 December 1999 DYNAMIC DIVERSITY: PROJECTED CHANGES IN U.S. RACE AND ETHNIC COMPOSITION 1995 TO 2050 The Minority Business
Population Outlook for the Portland-Vancouver Metropolitan Region
 Portland State University PDXScholar Institute of Portland Metropolitan Studies Publications Institute of Portland Metropolitan Studies 2007 Population Outlook for the Portland-Vancouver Metropolitan Region
BLACK-WHITE BENCHMARKS FOR THE CITY OF PITTSBURGH
 BLACK-WHITE BENCHMARKS FOR THE CITY OF PITTSBURGH INTRODUCTION Ralph Bangs, Christine Anthou, Shannon Hughes, Chris Shorter University Center for Social and Urban Research University of Pittsburgh March
Le Sueur County Demographic & Economic Profile Prepared on 7/12/2018
 Le Sueur County Demographic & Economic Profile Prepared on 7/12/2018 Prepared by: Mark Schultz Regional Labor Market Analyst Southeast and South Central Minnesota Minnesota Department of Employment and
The EEO Tabulation: Measuring Diversity in the Workplace ACS Data Users Conference May 29, 2014
 The EEO Tabulation: Measuring Diversity in the Workplace ACS Data Users Conference May 29, 2014 Ana J. Montalvo Industry and Occupation Statistics Branch Social, Economic, and Housing Statistics Division
Rural America At A Glance
 Rural America At A Glance 7 Edition Between July 5 and July 6, the population of nonmetro America grew.6 percent. Net domestic migration from metro areas accounted for nearly half of this growth. Gains
Hispanic Health Insurance Rates Differ between Established and New Hispanic Destinations
 Population Trends in Post-Recession Rural America A Publication Series of the W3001 Research Project Hispanic Health Insurance Rates Differ between and New Hispanic s Brief No. 02-16 August 2016 Shannon
U.S. immigrant population continues to grow
 U.S. immigrant population continues to grow Millions 45 40 35 30 25 20 15 10 5 0 Source: PEW Research Center. All foreign-born immigrants Unauthorized immigrants 40.4 38.0 31.1 12.0 11.1 8.4 2000 2007
MARRIAGE & PARENTHOOD
 CONTENTS OVERVIEW 3 KEY INDICATORS 4 OVERALL POPULATION 5 AGEING 8 MARRIAGE & PARENTHOOD 10 IMMIGRATION & CITIZENS BY DESCENT 14 1 ANNEX Overall Population Table 1: Total population 16 Table 2: Singapore
Active Michigan Members by Race/Ethnicity and Gender Joining the Bar
 The Big Picture Active Michigan Members by Race/Ethnicity and Gender Joining the Bar 2005-2015 Other Ethnic Origin Female, 379, 6.9% Other Ethnic Origin Male, 306, 5.5% Arab Origin Female, 101, 1.8% Arab
Illegal Immigration: How Should We Deal With It?
 Illegal Immigration: How Should We Deal With It? Polling Question 1: Providing routine healthcare services to illegal Immigrants 1. Is a moral/ethical responsibility 2. Legitimizes illegal behavior 3.
Geographic Mobility of New Jersey Residents. Migration affects the number and characteristics of our resident population
 Geographic Mobility of New Jersey Residents Migration affects the number and characteristics of our resident population Geographic Mobility of New Jersey Residents More than 4.1 million (or 47.4%) New
An Equity Profile of the Southeast Florida Region. Summary. Foreword
 An Equity Profile of the Southeast Florida Region PolicyLink and PERE An Equity Profile of the Southeast Florida Region Summary Communities of color are driving Southeast Florida s population growth, and
People. Population size and growth. Components of population change
 The social report monitors outcomes for the New Zealand population. This section contains background information on the size and characteristics of the population to provide a context for the indicators
Chapter One: people & demographics
 Chapter One: people & demographics The composition of Alberta s population is the foundation for its post-secondary enrolment growth. The population s demographic profile determines the pressure points
KENAN INSTITUTE WHITE PAPER
 KENAN INSTITUTE WHITE PAPER JANUARY 1, 2018 LEVERAGING NORTH CAROLINA S MIGRATION DIVIDEND UISC01201801 James H. Johnson, Jr., Ph.D Allan M. Parnell, Ph.D Frank Hawkins Kenan Institute of Private Enterprise
3Demographic Drivers. The State of the Nation s Housing 2007
 3Demographic Drivers The demographic underpinnings of long-run housing demand remain solid. Net household growth should climb from an average 1.26 million annual pace in 1995 25 to 1.46 million in 25 215.
1615 L Street, NW, Suite 700 Washington, DC (main) (fax)
 (fax)") 1615 L Street, NW, Suite 700 Washington, DC 20036-5631 202-419-3600(main) 202-419-3608(fax) www.pewresearch.org A Fact Tank The Pew Research Center is a nonpartisan organization that provides information
1615 L Street, NW, Suite 700 Washington, DC 20036-5631 202-419-3600(main) 202-419-3608(fax) www.pewresearch.org A Fact Tank The Pew Research Center is a nonpartisan organization that provides information
Introduction. Background
 Millennial Migration: How has the Great Recession affected the migration of a generation as it came of age? Megan J. Benetsky and Alison Fields Journey to Work and Migration Statistics Branch Social, Economic,
The Brookings Institution Metropolitan Policy Program Amy Liu, Deputy Director
 The Brookings Institution Metropolitan Policy Program Amy Liu, Deputy Director Mind the Gap: Reducing Disparities to Improve Regional Competitiveness in the Twin Cities Forum on the Business Response to
Youth at High Risk of Disconnection
 Youth at High Risk of Disconnection A data update of Michael Wald and Tia Martinez s Connected by 25: Improving the Life Chances of the Country s Most Vulnerable 14-24 Year Olds Prepared by Jacob Rosch,
Demographic Change How the US is Coping with Aging, Immigration, and Other Challenges William H. Frey
 Demographic Change How the US is Coping with Aging, Immigration, and Other Challenges William H. Frey Brookings Institution University of Michigan www.frey-demographer.org US: Total and Age 65+ Growth,
Utah s Demographic Transformation
 Utah's Demographic Transformation: Implications for Education and Workforce 27 Council of Councils Southern Utah University Cedar City, Utah October 11, 27 Pamela S. Perlich, Ph.D. Senior Research Economist
Institute for Public Policy and Economic Analysis
 Institute for Public Policy and Economic Analysis The Institute for Public Policy and Economic Analysis at Eastern Washington University will convey university expertise and sponsor research in social,
Facts & Figures in this issue: income employment growth trends baby boomers millennials immigration
 Facts & Figures in this issue: income employment growth trends baby boomers millennials immigration 2017 Baby Boomers The term baby boomer refers to individuals born in the United States between 1946 and
Extrapolated Versus Actual Rates of Violent Crime, California and the United States, from a 1992 Vantage Point
 Figure 2.1 Extrapolated Versus Actual Rates of Violent Crime, California and the United States, from a 1992 Vantage Point Incidence per 100,000 Population 1,800 1,600 1,400 1,200 1,000 800 600 400 200
Demographic Data. Comprehensive Plan
 Comprehensive Plan 2010-2030 4 Demographic Data Population and demographics have changed over the past several decades in the City of Elwood. It is important to incorporate these shifts into the planning
Race, Ethnicity, and Economic Outcomes in New Mexico
 Race, Ethnicity, and Economic Outcomes in New Mexico Race, Ethnicity, and Economic Outcomes in New Mexico New Mexico Fiscal Policy Project A program of New Mexico Voices for Children May 2011 The New Mexico
The Impact of Ebbing Immigration in Los Angeles: New Insights from an Established Gateway
 The Impact of Ebbing Immigration in Los Angeles: New Insights from an Established Gateway Julie Park and Dowell Myers University of Southern California Paper proposed for presentation at the annual meetings
Regional Data Snapshot
 Regional Data Snapshot Population, Economy & Education Features SET Civic Forum Uwharrie Region, NC Table of Contents 01 Overview 03 Human Capital 02 Demography 04 Labor Force 01 overview Uwharrie Region,
Geographic Mobility Central Pennsylvania
 Geographic Mobility Central Pennsylvania Centre, Clinton, Columbia, Lycoming, Mifflin, Montour, Northumberland, Snyder, and Union Counties Central Pennsylvania Workforce Development Corporation (CPWDC)
Water Demand Demographic Change and Uncertainty
 Water Demand Demographic Change and Uncertainty Dr Peter Boden Edge Analytics Ltd College of Medical and Dental Sciences University of Birmingham February 2011 Slide 1 Edge Analytics www.edgeanalytics.co.uk
Components of Population Change by State
 IOWA POPULATION REPORTS Components of 2000-2009 Population Change by State April 2010 Liesl Eathington Department of Economics Iowa State University Iowa s Rate of Population Growth Ranks 43rd Among All
Human Resources in the 1990s
 CHAPTER 5 Human Resources in the 1990s THE SUSTAINED ECONOMIC EXPANSION of the 1980s has produced remarkable growth in employment and increased economic opportunity. As the Nation looks ahead to the 1990s,
Post-Secondary Education, Training and Labour September Profile of the New Brunswick Labour Force
 Post-Secondary Education, Training and Labour September 2018 Profile of the New Brunswick Labour Force Contents Population Trends... 2 Key Labour Force Statistics... 5 New Brunswick Overview... 5 Sub-Regional
Regional Data Snapshot
 Regional Data Snapshot Population, Economy & Education Features SET Civic Forum East Central NM, New Mexico Table of Contents 01 Overview 03 Human Capital 02 Demography 04 Labor Force 01 overview East
ATTACHMENT 16. Source and Accuracy Statement for the November 2008 CPS Microdata File on Voting and Registration
 ATTACHMENT 16 Source and Accuracy Statement for the November 2008 CPS Microdata File on Voting and Registration SOURCE OF DATA The data in this microdata file are from the November 2008 Current Population
Human Population Growth Through Time
 Human Population Growth Through Time Current world population: 7.35 Billion (Nov. 2016) http://www.worldometers.info/world-population/ 2012 7 billion 1999 13 years 12 years 1974 1927 1804 13 years 14 years
REGIONAL. San Joaquin County Population Projection
 Lodi 12 EBERHARDT SCHOOL OF BUSINESS Business Forecasting Center in partnership with San Joaquin Council of Governments 99 26 5 205 Tracy 4 Lathrop Stockton 120 Manteca Ripon Escalon REGIONAL analyst june
Tell us what you think. Provide feedback to help make American Community Survey data more useful for you.
 DP02 SELECTED SOCIAL CHARACTERISTICS IN THE UNITED STATES 2016 American Community Survey 1-Year Estimates Supporting documentation on code lists, subject definitions, data accuracy, and statistical testing
Social and Demographic Trends in Burnaby and Neighbouring Communities 1981 to 2006
 Social and Demographic Trends in and Neighbouring Communities 1981 to 2006 October 2009 Table of Contents October 2009 1 Introduction... 2 2 Population... 3 Population Growth... 3 Age Structure... 4 3
Regional Data Snapshot
 Regional Data Snapshot Population, Economy & Education Features SET Civic Forum Glacial Lakes Region, South Dakota Table of Contents 01 Overview 03 Human Capital 02 Demography 04 Labor Force 01 overview
This analysis confirms other recent research showing a dramatic increase in the education level of newly
 CENTER FOR IMMIGRATION STUDIES April 2018 Better Educated, but Not Better Off A look at the education level and socioeconomic success of recent immigrants, to By Steven A. Camarota and Karen Zeigler This
 Page 1 of 5 DP02 SELECTED SOCIAL CHARACTERISTICS IN THE UNITED STATES 2013 American Community Survey 1-Year Estimates Although the American Community Survey (ACS) produces population, demographic and housing
STRENGTHENING RURAL CANADA: Fewer & Older: Population and Demographic Crossroads in Rural Saskatchewan. An Executive Summary
 STRENGTHENING RURAL CANADA: Fewer & Older: Population and Demographic Crossroads in Rural Saskatchewan An Executive Summary This paper has been prepared for the Strengthening Rural Canada initiative by:
What Travel Trends Might Tell Us About the Future
 University of Massachusetts Amherst ScholarWorks@UMass Amherst Tourism Travel and Research Association: Advancing Tourism Research Globally 2014 Marketing Outlook Forum - Outlook for 2015 What Travel Trends
Demographic, Economic, and Social Transformations in Brooklyn Community District 4: Bushwick,
 Demographic, Economic, and Social Transformations in Brooklyn Community District 4: Bushwick, 1990-2007 Astrid S. Rodríguez Ph.D. Candidate, Educational Psychology Center for Latin American, Caribbean
Destination Portland: Post-Great Recession Migration Trends in the Rose City Region
 Portland State University PDXScholar Publications, Reports and Presentations Population Research Center 3-2017 Destination Portland: Post-Great Recession Migration Trends in the Rose City Region Jason
Understanding the Immigrant Experience Lessons and themes for economic opportunity. Owen J. Furuseth and Laura Simmons UNC Charlotte Urban Institute
 Understanding the Immigrant Experience Lessons and themes for economic opportunity Owen J. Furuseth and Laura Simmons UNC Charlotte Urban Institute Charlotte-Mecklenburg Opportunity Task Force March 10,
OREGON OUTLOOK Sponsored by Population Research Center Portland Multnomah Progress Board Oregon Progress Board
 REGN TATE ERIE APRIL 003 PPULATIN REEARCH CENTER REGN s MAJR PPULATIN TREND This report reviews Population Growth Household Trends Household ize Families and Non-families Implications Future Reports Metropolitan
Why disaggregate data on U.S. children by immigrant status? Some lessons from the diversitydatakids.org project
 Why disaggregate data on U.S. children by immigrant status? Some lessons from the diversitydatakids.org project Dolores Acevedo-Garcia, PhD, MPA-URP Samuel F. and Rose B. Gingold Professor of Human Development
Appendix A. Environmental Justice Analysis
 Appendix A. Environmental Justice Analysis Project Memorandum Re: KY 536 Scoping Study Environmental Justice Analysis Date: December 22, 2014 Introduction This Environmental Justice Report presents a review
Immigration Policy Brief August 2006
 Immigration Policy Brief August 2006 Last updated August 16, 2006 The Growth and Reach of Immigration New Census Bureau Data Underscore Importance of Immigrants in the U.S. Labor Force Introduction: by
Prophetic City: Houston on the Cusp of a Changing America.
 Prophetic City: Houston on the Cusp of a Changing America. Tracking Responses to the Economic and Demographic Transformations through 36 Years of Houston Surveys Dr. Stephen L. Klineberg TACA 63rd Annual
Northwest Georgia Housing Authority Application for Employment
 Northwest Georgia Housing Authority Application for Employment An Equal Opportunity Employer Position Applying For: PERSONAL Name Phone: / (Last) (First) (Middle) Present Address Permanent Mailing SS#
Pennsylvania Marijuana Arrests
 Working to Reform Marijuana Laws The NORML Almanac of Marijuana Arrest Statistics Pennsylvania Marijuana Arrests Marijuana Arrests 1995-2002 (Summary) Marijuana Possession Arrests-2002 (Demographics) Marijuana
Representational Bias in the 2012 Electorate
 Representational Bias in the 2012 Electorate by Vanessa Perez, Ph.D. January 2015 Table of Contents 1 Introduction 3 4 2 Methodology 5 3 Continuing Disparities in the and Voting Populations 6-10 4 National
info Poverty in the San Diego Region SANDAG December 2013
 info December 2013 SANDAG Poverty in the San Diego Region Table of Contents Overview... 3 Background... 3 Federal Poverty Measurements... 4 Poverty Status for Individuals in the San Diego Region... 6 Demographic
Based on our analysis of Census Bureau data, we estimate that there are 6.6 million uninsured illegal
 Memorandum Center for Immigration Studies September 2009 Illegal Immigrants and HR 3200 Estimate of Potential Costs to Taxpayers By Steven A. Camarota Based on our analysis of Census Bureau data, we estimate
BIG PICTURE: CHANGING POVERTY AND EMPLOYMENT OUTCOMES IN SEATTLE
 BIG PICTURE: CHANGING POVERTY AND EMPLOYMENT OUTCOMES IN SEATTLE January 218 Author: Bryce Jones Seattle Jobs Initiative TABLE OF CONTENTS Introduction 1 Executive Summary 2 Changes in Poverty and Deep
Labor Force Characteristics by Race and Ethnicity, 2015
 Cornell University ILR School DigitalCommons@ILR Federal Publications Key Workplace Documents 9-2016 Labor Force Characteristics by Race and Ethnicity, 2015 Bureau of Labor Statistics Follow this and additional
Racial Inequities in Montgomery County
 W A S H I N G T O N A R E A R E S E A R C H I N I T I A T I V E Racial Inequities in Montgomery County Leah Hendey and Lily Posey December 2017 Montgomery County, Maryland, faces a challenge in overcoming
California s Congressional District 37 Demographic Sketch
 4.02.12 California s Congressional District 37 Demographic Sketch MANUEL PASTOR JUSTIN SCOGGINS JARED SANCHEZ Purpose Demographic Sketch Understand the Congressional District s population and its unique
Recommendation 1: Collect Basic Information on All Household Members
 RECOMMENDATIONS REGARDING THE PROPOSED 2018 REDESIGN OF THE NHIS POPULATION ASSOCIATION OF AMERICA JUNE 30, 2016 Prepared by: Irma Elo, Robert Hummer, Richard Rogers, Jennifer Van Hook, and Julia Rivera
Chapter 1: The Demographics of McLennan County
 Chapter 1: The Demographics of McLennan County General Population Since 2000, the Texas population has grown by more than 2.7 million residents (approximately 15%), bringing the total population of the
STATE OF THE STATE MSFCA Strategic Long Range Plan
 STATE OF THE STATE - 2016 MSFCA Strategic Long Range Plan Background Research What are the current hot issues affecting the Minnesota Fire Service in 2016. Includes numerous reports/references. See appendix
Minority-Owned Businesses By: Chuck Vollmer 10 January 2014
 Minority-Owned Businesses www.jobenomics.com By: Chuck Vollmer 10 January 2014 Executive Summary. Today, there are 6 million minority-owned businesses in the US. Jobenomics advocates a national goal of
Indian Migration to the Global North in the Americas: The United States
 Chapter 1 Indian Migration to the Global North in the Americas: The United States The multicultural, multiracial and diverse character of North American society reflects the consequences of significant
Institute for Public Policy and Economic Analysis
 Institute for Public Policy and Economic Analysis The Institute for Public Policy and Economic Analysis at Eastern Washington University will convey university expertise and sponsor research in social,
Preliminary Audit of the City s Diversity Report # June, 2016
 Preliminary Audit of the City s Diversity Report # 2016-02 June, 2016 Jorge Oseguera, City Auditor John Silva, Independent Budget Analyst The City of Sacramento s can be contacted by phone at 916-808-7270
The Black Labor Force in the Recovery
 Cornell University ILR School DigitalCommons@ILR Federal Publications Key Workplace Documents 7-11-2011 The Black Labor Force in the Recovery United States Department of Labor Follow this and additional
Making the Case for Multicultural Education in Utah: Utah s Demographic Transformation
 Making the Case for Multicultural Education in Utah: Utah s Demographic Transformation Utah Reach Training Utah State Office of Education May 8, 2009 Pamela S. Perlich, Ph.D. University of Utah Utah s
Planning for the Silver Tsunami:
 Planning for the Silver Tsunami: The Shifting Age Profile of the Commonwealth and Its Implications for Workforce Development H e n r y Renski A NEW DEMOGRAPHIC MODEL PROJECTS A CONTINUING, LONG-TERM SLOWING
Two of the key demographic issues that frame society around the globe today are migration and the ageing of the population. Every country around the
 1 Two of the key demographic issues that frame society around the globe today are migration and the ageing of the population. Every country around the globe is now facing an ageing population. And this
Seattle Public Schools Enrollment and Immigration. Natasha M. Rivers, PhD. Table of Contents
 Seattle Public Schools Enrollment and Immigration Natasha M. Rivers, PhD Table of Contents 1. Introduction: What s been happening with Enrollment in Seattle Public Schools? p.2-3 2. Public School Enrollment
STATE OF WORKING FLORIDA
 STATE OF WORKING FLORIDA 2018 The Future Workforce The 15th edition of the State of Working Florida reviews recent changes in Florida s economy and their potential impacts on the future workforce. This
The Brookings Institution Metropolitan Policy Program Bruce Katz, Director
 The Brookings Institution Metropolitan Policy Program Bruce Katz, Director State of the World s Cities: The American Experience Delivering Sustainable Communities Summit February 1st, 2005 State of the
Demographic, Economic and Social Transformations in Bronx Community District 4: High Bridge, Concourse and Mount Eden,
 Center for Latin American, Caribbean & Latino Studies Graduate Center City University of New York 365 Fifth Avenue Room 5419 New York, New York 10016 Demographic, Economic and Social Transformations in
destination Philadelphia Tracking the City's Migration Trends executive summary
 destination Philadelphia October 6, 2010 executive summary An analysis of migration data from the Internal Revenue Service shows that the number of people moving into the city of Philadelphia has increased
Understanding Racial Inequity in Alachua County
 Understanding Racial Inequity in Alachua County (January, 2018) Hector H. Sandoval (BEBR) Department of Economics College of Liberal Arts and Sciences University of Florida Understanding Racial Inequity