Prophetic City: Houston on the Cusp of a Changing America.
|
|
|
- Ilene Franklin
- 5 years ago
- Views:
Transcription

1 Prophetic City: Houston on the Cusp of a Changing America. Tracking Responses to the Economic and Demographic Transformations through 36 Years of Houston Surveys Dr. Stephen L. Klineberg TACA 63rd Annual Meeting 15 June 2017
2 The Kinder Houston Area Survey ( ) Thirty-six years of systematic interviews with successive representative samples of Harris County residents, focused on three central issues: 2
3 Two contrasting economic eras (1949 to 1979 and 1980 to 2015) Percent increase in before-tax income The 30 years after World War II were a period of broad-based prosperity. 110% 116% 100% 111% 114% 99% 86% The past 36 years have been marked by growing income inequalities. 50% 2.07% 7.5% 13.56% 25.31% 53.54% 74.55% -10% Bottom 20% Second 20% Middle 20% Fourth 20% Top 20% Top 5% The 30 years after World War II ( ) The past 36 years ( ) 3 Source: U.S. Census Bureau, Current Population Survey, Annual Social And Economic Supplements. Mean Household Income Received By Each Fifth and the Top 5 Percent, Inflation Adjusted to 2015 dollar.
4 Changes in the education requirements for jobs across America ( ) 100% 50% Master's degree or better Bachelor's degree Associate's degree Some college High school diploma Less than high school 0% (91 million) 1992 (129 million) 2010 (143 million) 2020 (164 million) By 2020, 65% of all American jobs will require education beyond high school. Year and Number of Available Jobs 4 Source: Georgetown University Center on Education and the Workforce, "Recovery: Job Growth and Education Requirements through 2020." Retrieved from cew.georgetown.edu/recovery2020, on July 27, 2015.
5 U.S. States ranked by percent adults aged 25+ with high school diplomas (ACS, ) Montana (1) Minnesota (2) Wyoming (3) Alaska (4) New Hampshire Vermont (6) Iowa (7) Maine (7) North Dakota (9) Utah (10) 92.2% 92.1% 92.0% 91.6% 91.6% 91.5% 91.0% 91.0% 90.9% 90.7% Harris County Texas (50) United States 78.6% 81.1% 85.9% 0.0% 20.0% 40.0% 60.0% 80.0% 100.0% Source: U.S. Census Bureau. American Community Survey (ACS), three-year estimates for population aged 25 years and over.
6 U.S. States ranked by percent adults aged 25+ with college degree or more (ACS, ) Massachusetts (1) Colorado (2) Maryland (3) Connecticut (4) New Jersey (5) Virginia (6) Vermont (7) New Hampshire New York (9) Minnesota (10) 39.2% 36.8% 36.6% 36.3% 35.8% 34.9% 34.8% 33.7% 33.0% 32.6% Harris County Texas (30) United States 28.2% 26.4% 28.6% 0.0% 10.0% 20.0% 30.0% 40.0% Source: U.S. Census Bureau. American Community Survey (ACS), three-year estimates for population aged 25 years and over.
7 The fates of all eighth graders in the Houston region through their next 11 years ( ) 100% 90% 100% 94% Fall 2004 Cohort 80% 70% 68% 60% 54% 50% 40% 30% 20% 21% 10% 0% 8th Grade (N=69,847) High School Enrollee (N=65,511) High School Diploma (N=47,539) Post-Secondary Enrollee (N=37,806) Post-Secondary Credential (N=14,945) 7 Source: TEA Division of Performance Reporting for Region 4, Texas Academic Performance Reports District Attendance and Postsecondary Readiness Report.

8
9 The number of documented U.S. immigrants, by decade ( ) From 1492 to 1965, 82% of all the immigrants who came to American shores came from Europe. After reform of the restrictive laws in 1965, fully 88% of all the new immigrants have been non-europeans. 8.8 Millions of immigrants Hart-Celler Act National Origins Quota Act 1820s 1830s 1840s 1850s 1860s 1870s 1880s 1890s 1900s 1910s 1920s 1930s 1940s 1950s 1960s 1970s 1980s 1990s 2000s Source: U.S. Department of Homeland Security. Office of Immigration Statistics Dr. Stephen L. Klineberg and the Kinder Institute for Urban Research
10 Cities with large numbers of foreign born residents ( ) Boston San Francisco Chicago New York City Washington D.C. Dallas Los Angeles Atlanta San Diego Houston 10 Source: ACS Five-Year Estimates. U.S. Census Bureau Dr. Stephen L. Klineberg and the Kinder Institute for Urban Research Miami
11 Demographic changes in Harris County by decade (1980, 1990, 2000, 2010 and ACS ) % 7.9% Asians POPULATION IN MILLIONS % 15.5% 19.7% 62.7% 4.1% 22.7% 19.1% 54.0% 6.7% 32.9% 18.2% 42.1% 40.8% 18.4% 33.0% 41.6% Latinos 18.9% Blacks 31.7% Anglos (N=2,409,547) 1990 (N=2,818,199) 2000 (N=3,400,578) 2010 (N=4,092,459) 2015 (N=4,356,362) 11 Source: Census Bureau, Classifications based on Texas State Data Center Conventions.

12 The ethnic distribution across Harris County Anglo majority Black majority Latino majority No majority Source: Outreach Strategists, LLC. Color represents demographic group being a majority in that census tract. Dr. Stephen L. Klineberg and the Kinder Institute for Urban Research

13 The ethnic distribution across Harris County Anglo majority Black majority Latino majority No majority Source: Outreach Strategists, LLC. Color represents demographic group being a majority in that census tract. Dr. Stephen L. Klineberg and the Kinder Institute for Urban Research


14 The ethnic distribution across Harris County Anglo majority Black majority Latino majority No majority Source: Outreach Strategists, LLC. Color represents demographic group being a majority in that census tract. Dr. Stephen L. Klineberg and the Kinder Institute for Urban Research

15 The ethnic distribution across Harris County Anglo majority Black majority Latino majority No majority Source: Outreach Strategists, LLC. Color represents demographic group being a majority in that census tract. Dr. Stephen L. Klineberg and the Kinder Institute for Urban Research

16 The current population of Harris County by age group and ethnicity (ACS, ) Non-Hispanic Whites All Others Source: U.S. Census Bureau ACS 5-year estimates Dr. Stephen L. Klineberg and the Kinder Institute for Urban Research
17 The current population of Texas by age group and ethnicity (ACS, ) Non-Hispanic Whites All others Source: U.S. Census Bureau ACS 5-year estimates Dr. Stephen L. Klineberg and the Kinder Institute for Urban Research
18 The current population of the United States by age group and ethnicity (ACS, ) Non-Hispanic Whites All others Source: U.S. Census Bureau ACS 5-year estimates Dr. Stephen L. Klineberg and the Kinder Institute for Urban Research
19 The projected population of the U.S. by age group and ethnicity in 2050 Non-Hispanic Whites All others Source: U.S. Census Bureau National Population Projections, Alternative Net International Migration Series (Constant Series). Dr. Stephen L. Klineberg and the Kinder Institute for Urban Research
20 Educational attainment by ethnicity, among respondents aged 25 and older ( ) Less than H.S. H.S. diploma Some college College degree Post-graduate Percent of respondents 57% 24% 34% 29% 20% 33% 26% 31% 28% 28% 28% 27% 21% 24% 4% 10% 7% 14% 14% 14% 7% 5% 11% 6% 2% Asian Immigrants U.S.-born Anglos U.S.-born Blacks U.S.-born Latinos Latino Immigrants 20 Source: Kinder Houston Area Surveys ( ) Dr. Stephen L. Klineberg and the Kinder Institute for Urban Research
 Some college or more (Age 25+) Working in production jobs or as day laborers <10 years 21% 10-19 years 17% 20+")
21 Percent of Latinos by time in the U.S. Socioeconomic status among Latinos by time in the U.S. and by generation ( ) Some college or more (Age 25+) Working in production jobs or as day laborers <10 years 21% years 17% 20+ years 22% 2 nd Generation 3 rd Generation <10 years years 20+ years 2 nd Gen. 20% 3 rd Gen. 20% 45% 49% 38% 31% 31% Personal earnings of more than $25,000 <10 years years 20+ years 2 nd Generation 3 rd Generation 31% 40% 56% 58% 68% 21 Source: Kinder Houston Area Surveys ( ) Dr. Stephen L. Klineberg and the Kinder Institute for Urban Research

22 Percent of Latinos by time in the U.S. Correlates of SES among Latinos by time in the U.S. and by generation ( ) Owns the place where lives Self and family have health insurance Has internet access at home or work <10 years years 20+ years 2 nd Generation 3 rd Generation <10 years years 20+ years 2 nd Generation 3 rd Generation <10 years years 20+ years 2 nd Generation 3 rd Generation 25% 49% 67% 63% 58% 45% 50% 62% 67% 76% 37% 53% 70% 83% 78% 22 Source: Kinder Houston Area Surveys ( ) Dr. Stephen L. Klineberg and the Kinder Institute for Urban Research
23 Attitudes toward immigration among Harris County residents from 2010 to 2017 PERCENT AGREEING Immigrants to the U.S. generally contribute more to the American economy than they take The U.S. should admit the same number or more legal immigrants in the next ten years as were admitted in the last ten years The increasing immigration into this country today mostly strengthens, rather than threatens, American culture Favor: Granting illegal immigrants in the U.S. a path to legal citizenship, if they speak English and have no criminal record YEAR OF SURVEY: Source: Kinder Houston Area Survey ( )
24 Attitudes toward immigration in four time periods among Anglo Baby Boomers (born ) The increasing immigration into this country today mostly strengthens, rather than threatens, American culture. Immigrants to the U.S. generally contribute more to the American economy than they take. The U.S. should admit the same number or more legal immigrants in the next ten years as in the last ten years. PERCENT AGREEING YEAR OF SURVEY: Source: Kinder Houston Area Survey ( )
25 Interethnic romantic relationships by age among Anglos (2007, 2011, 2014, and 2016) Have you ever been in a romantic relationship with someone who was not Anglo? 59% 59% 49% 40% 26% 14% Source: Kinder Houston Area Survey ( )
26 Attitudes toward immigration among three cohorts of Harris County Anglos, all aged PERCENT AGREEING The increasing immigration into this country today mostly strengthens, rather than threatens, American culture Immigrants to the U.S. generally contribute more to the American economy than they take The U.S. should admit the same number or more legal immigrants in the next ten years as in the last ten years DATE OF BIRTH: Source: Kinder Houston Area Survey ( )


27 Arts, culture, sports Air and water quality Transportation Bayous Green spaces, trees Urban centers Hiking, boating, birding
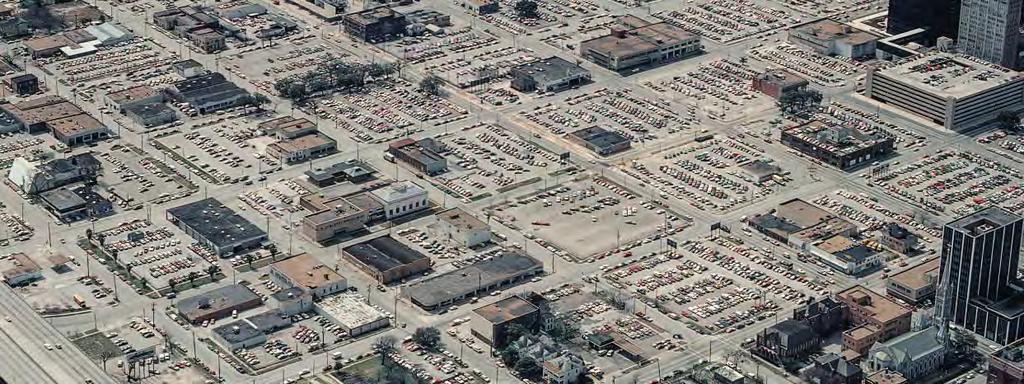
28 Houston s urban sprawl 2.1 million 600 sq. mi. Baltimore 0.6 million 81 sq. mi. Chicago 2.7 million 228 sq. mi. Detroit 0.7 million 139 sq. mi. Philadelphia 1.5 million 134 sq. mi. 28 Source: U.S. Census Bureau Dr. Stephen L. Klineberg and the Kinder Institute for Urban Research


29 The nine-county Houston metropolitan area 6.5 million 10,072 sq. mi. Massachusetts 6.6 million 10,550 sq. mi. New Jersey 8.8 million 8,729 sq. mi. 29 Source: U.S. Census Bureau Dr. Stephen L. Klineberg and the Kinder Institute for Urban Research
30 The preference for walkable urbanism among Harris County residents ( ) 70 PERCENT OF RESPONDENTS A single-family residential area An area with a mix of developments A single-family home with need to drive everywhere A smaller, more urbanized home within walking distance 2011, 2013, 2015, , 2012, 2014, Source: Kinder Houston Area Survey ( )

31 1978 Alex Ma


32 2011 Alex Ma

33 Today s pro-growth agenda Texas needs cities to need develop nurture to grow a into far into a truly successful more much educated more multiethnic appealing workforce society, urban and destinations, equality the while research of opportunity accommodating centers for all one with develop communities, that rapidly will fuel growing a where new populations. economy. all are encouraged to participate as full partners in shaping the state s future.


34 kinder.rice.edu /InstituteForUrbanResearch
The Changing Face of Texas:
 The Changing Face of Texas: Tracking Responses to the Economic and Demographic Transformations through 35 Years of Systematic Surveys Dr. Stephen L. Klineberg The Fort Worth City Council 11 October, 2016.
THE 34 TH ANNUAL KINDER HOUSTON AREA SURVEY. Perspectives on a City in Transition. Kinder Houston Area Survey Luncheon April 30, 2015
 THE 34 TH ANNUAL KINDER HOUSTON AREA SURVEY Perspectives on a City in Transition Dr. Stephen Klineberg Kinder Houston Area Survey Luncheon April 30, 2015 THE 34 TH KINDER HOUSTON AREA SURVEY (2015) Systematic
The Impact of Ebbing Immigration in Los Angeles: New Insights from an Established Gateway
 The Impact of Ebbing Immigration in Los Angeles: New Insights from an Established Gateway Julie Park and Dowell Myers University of Southern California Paper proposed for presentation at the annual meetings
Components of Population Change by State
 IOWA POPULATION REPORTS Components of 2000-2009 Population Change by State April 2010 Liesl Eathington Department of Economics Iowa State University Iowa s Rate of Population Growth Ranks 43rd Among All
Immigration Policy Brief August 2006
 Immigration Policy Brief August 2006 Last updated August 16, 2006 The Growth and Reach of Immigration New Census Bureau Data Underscore Importance of Immigrants in the U.S. Labor Force Introduction: by
PRESENT TRENDS IN POPULATION DISTRIBUTION
 PRESENT TRENDS IN POPULATION DISTRIBUTION Conrad Taeuber Associate Director, Bureau of the Census U.S. Department of Commerce Our population has recently crossed the 200 million mark, and we are currently
CBRE CAPITAL MARKETS CBRE 2017 MULTIFAMILY CONFERENCE BEYOND THE CYCLE
 CBRE CAPITAL MARKETS CBRE 2017 MULTIFAMILY CONFERENCE BEYOND THE CYCLE INVESTING IN GOOD GROWTH: FINDING DEMAND IN ALL THE RIGHT PLACES JEFF ADLER Vice President, Yardi Matrix JEANETTE RICE Americas Head
The Brookings Institution
 The Brookings Institution Metropolitan Policy Program Bruce Katz, Director Understanding Regional Dynamics: Implications for Social and Economic Justice Understanding Regional Dynamics: Implications for
America s s Emerging Demography The role of minorities, college grads & the aging and younging of the population
 America s s Emerging Demography The role of minorities, college grads & the aging and younging of the population William H. Frey The Brookings Institution and University of Michigan www.frey-demographer.org
The Brookings Institution Metropolitan Policy Program Robert Puentes, Fellow
 The Brookings Institution Metropolitan Policy Program Robert Puentes, Fellow A Review of New Urban Demographics and Impacts on Housing National Multi Housing Council Research Forum March 26, 2007 St. Louis,
Hispanic Market Demographics
 Hispanic Market Demographics April 2008 Funded by The Beef Checkoff Why does this demographic deserve increased attention? Because the U.S. Hispanic population consists of 44.3 million people and is growing
Representational Bias in the 2012 Electorate
 Representational Bias in the 2012 Electorate by Vanessa Perez, Ph.D. January 2015 Table of Contents 1 Introduction 3 4 2 Methodology 5 3 Continuing Disparities in the and Voting Populations 6-10 4 National
New Americans in. By Walter A. Ewing, Ph.D. and Guillermo Cantor, Ph.D.
 New Americans in the VOTING Booth The Growing Electoral Power OF Immigrant Communities By Walter A. Ewing, Ph.D. and Guillermo Cantor, Ph.D. Special Report October 2014 New Americans in the VOTING Booth:
IMMIGRANTS. Udall Center for Studies in Public Policy The University of Arizona
 ECONOMIC CONTRIBUTIONS of IMMIGRANTS IN THE UNITED STATES A Regional and State-by-State Analysis JUDITH GANS Udall Center for Studies in Public Policy The University of Arizona research support provided
The Brookings Institution Metropolitan Policy Program Robert Puentes, Fellow
 The Brookings Institution Metropolitan Policy Program Robert Puentes, Fellow The Changing Shape of the City Rail-Volution Chicago, IL November 7, 2006 The Changing Shape of the City I What is the context
ACTION: Notice announcing addresses for summons and complaints. SUMMARY: Our Office of the General Counsel (OGC) is responsible for processing
 is responsible for processing") This document is scheduled to be published in the Federal Register on 02/23/2017 and available online at https://federalregister.gov/d/2017-03495, and on FDsys.gov 4191-02U SOCIAL SECURITY ADMINISTRATION
This document is scheduled to be published in the Federal Register on 02/23/2017 and available online at https://federalregister.gov/d/2017-03495, and on FDsys.gov 4191-02U SOCIAL SECURITY ADMINISTRATION
Creating Inclusive Communities
 Fostering opportunity through planning. Creating Inclusive Communities Lisa Corrado, Long Range Planning Manager City of Henderson John Tapogna, President EcoNorthwest Overview Recent research on economic
MIGRATION STATISTICS AND BRAIN DRAIN/GAIN
 MIGRATION STATISTICS AND BRAIN DRAIN/GAIN Nebraska State Data Center 25th Annual Data Users Conference 2:15 to 3:15 p.m., August 19, 2014 David Drozd Randy Cantrell UNO Center for Public Affairs Research
SMART GROWTH, IMMIGRANT INTEGRATION AND SUSTAINABLE DEVELOPMENT
 SMART GROWTH, IMMIGRANT INTEGRATION AND SUSTAINABLE DEVELOPMENT Manuel Pastor 02/04/2012 U.S. Decadal Growth Rates for Population by Race/Ethnicity, 1980-2010 1980-1990 1990-2000 2000-2010 96.3% 57.9%
Overview of Boston s Population. Boston Redevelopment Authority Research Division Alvaro Lima, Director of Research September
 Overview of Boston s Population Boston Redevelopment Authority Research Division Alvaro Lima, Director of Research September - 2011 Historic Trends Boston s Population Boston reached its population peak
The Great Immigration Turnaround
 The Great Immigration Turnaround New Facts and Old Rhetoric Dowell Myers USC Sol Price School of Public Policy Overview Where is immigration growing fastest? Divided opinion and fears about immigration
The Brookings Institution Metropolitan Policy Program Bruce Katz, Director
 The Brookings Institution Metropolitan Policy Program Bruce Katz, Director Redefining Urban and Suburban America National Trust for Historic Preservation September 30, 2004 Redefining Urban and Suburban
Growth in the Foreign-Born Workforce and Employment of the Native Born
 Report August 10, 2006 Growth in the Foreign-Born Workforce and Employment of the Native Born Rakesh Kochhar Associate Director for Research, Pew Hispanic Center Rapid increases in the foreign-born population
3Demographic Drivers. The State of the Nation s Housing 2007
 3Demographic Drivers The demographic underpinnings of long-run housing demand remain solid. Net household growth should climb from an average 1.26 million annual pace in 1995 25 to 1.46 million in 25 215.
Home in America: Immigrants and Housing Demand
 Home in America: Immigrants and Housing Demand How Immigrants Shape Suburban Housing Markets Stephen B. Siegel Lecture The Future of New Jersey s Suburbs Monmouth University May 4, 2017 Lisa Sturtevant,
WYOMING POPULATION DECLINED SLIGHTLY
 FOR IMMEDIATE RELEASE Wednesday, December 19, 2018 Contact: Dr. Wenlin Liu, Chief Economist WYOMING POPULATION DECLINED SLIGHTLY CHEYENNE -- Wyoming s total resident population contracted to 577,737 in
Union Byte By Cherrie Bucknor and John Schmitt* January 2015
 January 21 Union Byte 21 By Cherrie Bucknor and John Schmitt* Center for Economic and Policy Research 1611 Connecticut Ave. NW Suite 4 Washington, DC 29 tel: 22-293-38 fax: 22-88-136 www.cepr.net Cherrie
America is facing an epidemic of the working hungry. Hunger Free America s analysis of federal data has determined:
 Key Findings: America is facing an epidemic of the working hungry. Hunger Free America s analysis of federal data has determined: Approximately 16 million American adults lived in food insecure households
Immigrants and the Direct Care Workforce
 JUNE 2017 RESEARCH BRIEF Immigrants and the Direct Care Workforce BY ROBERT ESPINOZA Immigrants are a significant part of the U.S. economy and the direct care workforce, providing hands-on care to older
Latest Immigration Data
 Latest Immigration Data And America s Changing Classrooms Denzil Mohammed Director, Public Education Institute The Immigrant Learning Center, Inc., Malden MA dmohammed@ilctr.org Immigrant Student Success,
Paths to Citizenship: Data on the eligible-to-naturalize populations in the U.S.
 Paths to Citizenship: Data on the eligible-to-naturalize populations in the U.S. Manuel Pastor Director CSII Thai V. Le Research Assistant CSII Justin Scoggins Data Manager CSII Melissa Rodgers Director
Selected National Demographic Trends
 Selected National Demographic Trends Tawara D. Goode Director, Georgetown University National Center for Cultural Competence Assistant Professor, Center for Child and Human Development Spring 2016 University
2010 CENSUS POPULATION REAPPORTIONMENT DATA
 Southern Tier East Census Monograph Series Report 11-1 January 2011 2010 CENSUS POPULATION REAPPORTIONMENT DATA The United States Constitution, Article 1, Section 2, requires a decennial census for the
131,815,386. The Growth Majority: Understanding The New American Mainstream. Today, there are. Multicultural Americans in the U.S.
 The Growth Majority: Understanding The New American Mainstream Part 1 November 218 Today, there are 131,815,386 Multicultural Americans in the U.S. The face of America is changing and multicultural consumers
Backgrounder. Immigrants in the United States, 2007 A Profile of America s Foreign-Born Population. Center for Immigration Studies November 2007
 Backgrounder Center for Immigration Studies November 2007 s in the United States, 2007 A Profile of America s Foreign-Born Population By Steven A. Camarota This Backgrounder provides a detailed picture
2015 ANNUAL OUTCOME GOAL PLAN (WITH FY 2014 OUTCOMES) Prepared in compliance with Government Performance and Results Act
 Prepared in compliance with Government Performance and Results Act") Administration for Children & Families 370 L Enfant Promenade, S.W. Washington, D.C. 20447 Office of Refugee Resettlement www.acf.hhs.gov 2015 ANNUAL OUTCOME GOAL PLAN (WITH FY 2014 OUTCOMES) Prepared
Administration for Children & Families 370 L Enfant Promenade, S.W. Washington, D.C. 20447 Office of Refugee Resettlement www.acf.hhs.gov 2015 ANNUAL OUTCOME GOAL PLAN (WITH FY 2014 OUTCOMES) Prepared
An Equity Assessment of the. St. Louis Region
 An Equity Assessment of the A Snapshot of the Greater St. Louis 15 counties 2.8 million population 19th largest metropolitan region 1.1 million households 1.4 million workforce $132.07 billion economy
INSTITUTE of PUBLIC POLICY
 INSTITUTE of PUBLIC POLICY Harry S Truman School of Public Affairs University of Missouri ANALYSIS OF STATE REVENUES AND EXPENDITURES Andrew Wesemann and Brian Dabson Summary This report analyzes state
African immigrants in the Washington region: a demographic overview
 African immigrants in the Washington region: a demographic overview Jill H. Wilson, Senior Research Analyst Presented at the DC Mayor s Office on African Affairs 2010 Census Kick-off 1 February 25, 2010
National Population Growth Declines as Domestic Migration Flows Rise
 National Population Growth Declines as Domestic Migration Flows Rise By William H. Frey U.S. population trends are showing something of a dual personality when viewed from the perspective of the nation
Salvadorans. in Boston
 Salvadorans in Boston Banda El Salvador at the 2013 Rose Parade in Pasadena, California. Photo by Prayitno Photography, retrieved from flickr.com/ photos/prayitnophotography (Creative Commons Attribution
LOOKING FORWARD: DEMOGRAPHY, ECONOMY, & WORKFORCE FOR THE FUTURE
 LOOKING FORWARD: DEMOGRAPHY, ECONOMY, & WORKFORCE FOR THE FUTURE 05/20/2016 MANUEL PASTOR @Prof_MPastor U.S. Change in Youth (
Household Income, Poverty, and Food-Stamp Use in Native-Born and Immigrant Households
 Household, Poverty, and Food-Stamp Use in Native-Born and Immigrant A Case Study in Use of Public Assistance JUDITH GANS Udall Center for Studies in Public Policy The University of Arizona research support
WILLIAMSON STATE OF THE COUNTY Capital Area Council of Governments
 WILLIAMSON STATE OF THE COUNTY 2011 Capital Area Council of Governments POPULATION Capital Area Council of Governments POPULATION THE RISE OF TEXAS During the past decade, the State of Texas has proved
Online Appendix for The Contribution of National Income Inequality to Regional Economic Divergence
 Online Appendix for The Contribution of National Income Inequality to Regional Economic Divergence APPENDIX 1: Trends in Regional Divergence Measured Using BEA Data on Commuting Zone Per Capita Personal
The sustained negative mood of the country drove voter attitudes.
 3 The sustained negative mood of the country drove voter attitudes. Last Time Mood Was Positive: 154 Months Ago 01/2004: 47% RD 43% WT The Mood of the Country Rasmussen Reports 11/20 11/22: 30% - 58% The
A Regional Comparison Minneapolis Saint Paul Regional Economic Development Partnership
 Greater MSP Baltimore A Regional Comparison Minneapolis Saint Paul Regional Economic Development Partnership TOP EMPLOYERS IN AND MSA GREATER MSP EMPLOYER EMPLOYEES EMPLOYER EMPLOYEES Target Corp. 26,694
TABLE OF CONTENTS. Introduction. Identifying the Importance of ID. Overview. Policy Recommendations. Conclusion. Summary of Findings
 1 TABLE OF CONTENTS Introduction Identifying the Importance of ID Overview Policy Recommendations Conclusion Summary of Findings Quick Reference Guide 3 3 4 6 7 8 8 The National Network for Youth gives
How Many Illegal Aliens Currently Live in the United States?
 How Many Illegal Aliens Currently Live in the United States? OCTOBER 2017 As of 2017, FAIR estimates that there are approximately 12.5 million illegal aliens residing in the United States. This number
THE MEASURE OF AMERICA
 THE MEASURE OF AMERICA American Human Development Report 2008 2009 xvii Executive Summary American history is in part a story of expanding opportunity to ever-greater numbers of citizens. Practical policies
Migration Information Source - Chinese Immigrants in the United States
 Pagina 1 di 8 Chinese Immigrants in the United States By Aaron Terrazas, Jeanne Batalova Migration Policy Institute May 6, 2010 The United States is home to about 1.6 million Chinese immigrants (including
Peruvians in the United States
 Peruvians in the United States 1980 2008 Center for Latin American, Caribbean & Latino Studies Graduate Center City University of New York 365 Fifth Avenue Room 5419 New York, New York 10016 212-817-8438
The Brookings Institution
 The Brookings Institution Center on Urban and Metropolitan Policy Bruce Katz, Director Census 2000: Key Trends & Implications for Cities Macalester College September 8, 2003 Overview I. II. III. About
Extrapolated Versus Actual Rates of Violent Crime, California and the United States, from a 1992 Vantage Point
 Figure 2.1 Extrapolated Versus Actual Rates of Violent Crime, California and the United States, from a 1992 Vantage Point Incidence per 100,000 Population 1,800 1,600 1,400 1,200 1,000 800 600 400 200
destination Philadelphia Tracking the City's Migration Trends executive summary
 destination Philadelphia October 6, 2010 executive summary An analysis of migration data from the Internal Revenue Service shows that the number of people moving into the city of Philadelphia has increased
Beyond cities: How Airbnb supports rural America s revitalization
 Beyond cities: How Airbnb supports rural America s revitalization Table of contents Overview 03 Our growth in rural areas 04 Creating opportunity 05 Helping seniors and women 07 State leaders in key categories
Illegal Immigration: How Should We Deal With It?
 Illegal Immigration: How Should We Deal With It? Polling Question 1: Providing routine healthcare services to illegal Immigrants 1. Is a moral/ethical responsibility 2. Legitimizes illegal behavior 3.
New data from the Census Bureau show that the nation s immigrant population (legal and illegal), also
, also") Backgrounder Center for Immigration Studies October 2011 A Record-Setting Decade of Immigration: 2000 to 2010 By Steven A. Camarota New data from the Census Bureau show that the nation s immigrant population
Backgrounder Center for Immigration Studies October 2011 A Record-Setting Decade of Immigration: 2000 to 2010 By Steven A. Camarota New data from the Census Bureau show that the nation s immigrant population
Regional Trends in the Domestic Migration of Minnesota s Young People
 HOUSE RESEARCH & STATE DEMOGRAPHIC CENTER A Changing Minnesota Sean Williams, House Research Susan Brower, Minnesota State Demographic Center September 2018 Regional Trends in the Domestic Migration of
New Population Estimates Show Slight Changes For 2010 Congressional Apportionment, With A Number of States Sitting Close to the Edge
 67 Emerywood Court Manassas, Virginia 202 202 789.2004 tel. or 703 580.7267 703 580.6258 fax Info@electiondataservices.com EMBARGOED UNTIL 6:0 P.M. EST, SUNDAY, SEPTEMBER 26, 200 Date: September 26, 200
Oklahoma, Maine, Migration and Right to Work : A Confused and Misleading Analysis. By the Bureau of Labor Education, University of Maine (Spring 2012)
") Oklahoma, Maine, Migration and Right to Work : A Confused and Misleading Analysis By the Bureau of Labor Education, University of Maine (Spring 2012) The recent article released by the Maine Heritage Policy
Oklahoma, Maine, Migration and Right to Work : A Confused and Misleading Analysis By the Bureau of Labor Education, University of Maine (Spring 2012) The recent article released by the Maine Heritage Policy
11.433J / J Real Estate Economics
 MIT OpenCourseWare http://ocw.mit.edu 11.433J / 15.021J Real Estate Economics Fall 2008 For information about citing these materials or our Terms of Use, visit: http://ocw.mit.edu/terms. Week 12: Real
The Changing Face of Labor,
 The Changing Face of Labor, 1983-28 John Schmitt and Kris Warner November 29 Center for Economic and Policy Research 1611 Connecticut Avenue, NW, Suite 4 Washington, D.C. 29 22-293-538 www.cepr.net CEPR
Part 1: Focus on Income. Inequality. EMBARGOED until 5/28/14. indicator definitions and Rankings
 Part 1: Focus on Income indicator definitions and Rankings Inequality STATE OF NEW YORK CITY S HOUSING & NEIGHBORHOODS IN 2013 7 Focus on Income Inequality New York City has seen rising levels of income
India Visa: Application Guide
 India Visa: Application Guide The following is a guide to completing the India visa application. The application is completed online, then printed, signed and included with the rest of applicant s documents.
Demographic, Economic, and Social Transformations in Brooklyn Community District 4: Bushwick,
 Demographic, Economic, and Social Transformations in Brooklyn Community District 4: Bushwick, 1990-2007 Astrid S. Rodríguez Ph.D. Candidate, Educational Psychology Center for Latin American, Caribbean
The Brookings Institution Metropolitan Policy Program Bruce Katz, Director
 The Brookings Institution Metropolitan Policy Program Bruce Katz, Director State of the World s Cities: The American Experience Delivering Sustainable Communities Summit February 1st, 2005 State of the
The New Metropolitan Geography of U.S. Immigration
 The Brookings Institution Metropolitan Policy Program Audrey Singer, Immigration Fellow The New Metropolitan Geography of U.S. Immigration Mayors Institute on City Design Rethinking Neighborhoods for Immigrants
State Trial Courts with Incidental Appellate Jurisdiction, 2010
 ALABAMA: G X X X de novo District, Probate, s ALASKA: ARIZONA: ARKANSAS: de novo or on the de novo (if no ) G O X X de novo CALIFORNIA: COLORADO: District Court, Justice of the Peace,, County, District,
Chapter 6 Shaping an Abundant Land. Page 135
 Chapter 6 Shaping an Abundant Land Page 135 Waves of immigrants came to the U.S. in order to find a better life. Push-pull factors were at play. Immigration is not the only movement of people in the U.S.
Beyond cities: How Airbnb supports rural America s revitalization
 Beyond cities: How Airbnb supports rural America s revitalization Table of contents Overview 03 Our growth in rural areas 04 Creating opportunity 05 Helping seniors and women 07 State leaders in key categories
DREAM Act-Eligible Poised to Build on the Investments Made in Them
 DREAM Act-Eligible Poised to Build on the Investments Made in Them Donald Kerwin Center for Migration Studies Robert Warren Center for Migration Studies Executive Summary This paper presents the results
The Brookings Institution Metropolitan Policy Program Amy Liu, Deputy Director
 The Brookings Institution Metropolitan Policy Program Amy Liu, Deputy Director Mind the Gap: Reducing Disparities to Improve Regional Competitiveness in the Twin Cities Forum on the Business Response to
Georgia s Immigrants: Past, Present, and Future
 Georgia s Immigrants: Past, Present, and Future Douglas J. Krupka John V. Winters Fiscal Research Center Andrew Young School of Policy Studies Georgia State University Atlanta, GA FRC Report No. 175 April
The Inland Empire in Hans Johnson Joseph Hayes
 The Inland Empire in 2015 Hans Johnson Joseph Hayes Inland Empire: Tremendous Growth and Change Strong population growth Increasing diversity Sustained economic growth* 2 PPIC Developed 2015 Projections
The New U.S. Demographics
 The Brookings Institution Center on Urban and Metropolitan Policy The New U.S. Demographics Audrey Singer Funders Network on Population, Reproductive Health and Rights November 10, 2003 QUESTIONS How has
California Counts. Can California Import Enough College Graduates to Meet Workforce Needs? Public Policy Institute of California
 population trends and profiles Hans P. Johnson, editor Volume 8 Number 4 May 2007 Can California Import Enough College Graduates to Meet Workforce Needs? By Hans P. Johnson and Deborah Reed California
SUMMARY: This document amends regulations listing the current addresses and describing
 This document is scheduled to be published in the Federal Register on 09/13/2018 and available online at https://federalregister.gov/d/2018-19929, and on govinfo.gov 6727-01-M FEDERAL LABOR RELATIONS AUTHORITY
What Lies Ahead: Population, Household and Employment Forecasts to 2040 April Metropolitan Council Forecasts to 2040
 The Metropolitan Council forecasts population, households and employment for the sevencounty Minneapolis-St. Paul region with a 30-year time horizon. The Council will allocate this regional forecast to
Racial Disparities in Youth Commitments and Arrests
 Racial Disparities in Youth Commitments and Arrests Between 2003 and 2013 (the most recent data available), the rate of youth committed to juvenile facilities after an adjudication of delinquency fell
TOP TEN STATES TOP TEN STATES. subgroups are Vietnamese (16%), Indian (11%) and Filipino (8%).
, Indian (11%) and Filipino (8%).") 13 million Americans identify themselves as Asian alone Chinese are the single largest subgroup of the Asian alone population in the United States, numbering 3.1 million. Among other groups there are 2.5
13 million Americans identify themselves as Asian alone Chinese are the single largest subgroup of the Asian alone population in the United States, numbering 3.1 million. Among other groups there are 2.5
Potential Effects of Public Charge Changes on Health Coverage for Citizen Children
 May 2018 Issue Brief Potential Effects of Public Charge Changes on Health Coverage for Citizen Children Samantha Artiga, Anthony Damico, and Rachel Garfield Key Findings The Trump Administration is pursuing
12B,C: Voting Power and Apportionment
 12B,C: Voting Power and Apportionment Group Activities 12C Apportionment 1. A college offers tutoring in Math, English, Chemistry, and Biology. The number of students enrolled in each subject is listed
Prior research finds that IRT policies increase college enrollment and completion rates among undocumented immigrant young adults.
 In-State Resident Tuition Policies for Undocumented Immigrants Kate Olson, Stephanie Potochnick Summary This brief examines the effects of in-state resident tuition (IRT) policies on high school dropout
Chapter 1: The Demographics of McLennan County
 Chapter 1: The Demographics of McLennan County General Population Since 2000, the Texas population has grown by more than 2.7 million residents (approximately 15%), bringing the total population of the
Latinos in Massachusetts Selected Areas: Framingham
 University of Massachusetts Boston ScholarWorks at UMass Boston Gastón Institute Publications Gastón Institute for Latino Community Development and Public Policy Publications 9-17-2010 Latinos in Massachusetts
Matthew Miller, Bureau of Legislative Research
 Matthew Miller, Bureau of Legislative Research Arkansas (reelection) Georgia (reelection) Idaho (reelection) Kentucky (reelection) Michigan (partisan nomination - reelection) Minnesota (reelection) Mississippi
CIRCLE The Center for Information & Research on Civic Learning & Engagement 70% 60% 50% 40% 30% 20% 10%
 FACT SHEET CIRCLE The Center for Information & Research on Civic Learning & Engagement Youth Voter Increases in 2006 By Mark Hugo Lopez, Karlo Barrios Marcelo, and Emily Hoban Kirby 1 June 2007 For the
Washington Area Economy: Performance and Outlook
 Washington Area Economy: Performance and Outlook Presentation to: Arlington Economic Development Commission Mark C. White, Ph.D. Deputy Director Center for Regional Analysis Schar School of Policy and
Children of Immigrants
 L O W - I N C O M E W O R K I N G F A M I L I E S I N I T I A T I V E Children of Immigrants 2013 State Trends Update Tyler Woods, Devlin Hanson, Shane Saxton, and Margaret Simms February 2016 This brief
Webinar on Reducing Barriers to Citizenship: New Research and the Need for a Partial Fee Waiver. January 8, pm ET / 1pm PT
 Webinar on Reducing Barriers to Citizenship: New Research and the Need for a Partial Fee Waiver January 8, 2015 4pm ET / 1pm PT During the Webinar For technical issues with webinar system Call 1-800-843-9166
How Have Hispanics Fared in the Jobless Recovery?
 How Have Hispanics Fared in the Jobless Recovery? William M. Rodgers III Heldrich Center for Workforce Development Rutgers University and National Poverty Center and Richard B. Freeman Harvard University
The EEO Tabulation: Measuring Diversity in the Workplace ACS Data Users Conference May 29, 2014
 The EEO Tabulation: Measuring Diversity in the Workplace ACS Data Users Conference May 29, 2014 Ana J. Montalvo Industry and Occupation Statistics Branch Social, Economic, and Housing Statistics Division
o Yes o No o Under 18 o o o o o o o o 85 or older BLW YouGov spec
 BLW YouGov spec This study is being conducted by John Carey, Gretchen Helmke, Brendan Nyhan, and Susan Stokes, who are professors at Dartmouth College (Carey and Nyhan), the University of Rochester (Helmke),
Briefing Book- Labor Market Trends in Metro Boston
 Briefing Book- Labor Market Two other briefing books focus on the importance of formal education and ESOL courses to Boston s foreign-born residents. While there are a number of reasons why improving immigrant
CLACLS. Demographic, Economic, and Social Transformations in Bronx Community District 5:
 CLACLS Center for Latin American, Caribbean & Latino Stud- Demographic, Economic, and Social Transformations in Bronx Community District 5: Fordham, University Heights, Morris Heights and Mount Hope, 1990
STATE LAWS SUMMARY: CHILD LABOR CERTIFICATION REQUIREMENTS BY STATE
 STATE LAWS SUMMARY: CHILD LABOR CERTIFICATION REQUIREMENTS BY STATE THE PROBLEM: Federal child labor laws limit the kinds of work for which kids under age 18 can be employed. But as with OSHA, federal
Federal Rate of Return. FY 2019 Update Texas Department of Transportation - Federal Affairs
 Federal Rate of Return FY 2019 Update Texas Department of Transportation - Federal Affairs Texas has historically been, and continues to be, the biggest donor to other states when it comes to federal highway
WORKINGPAPER SERIES. Did Immigrants in the U.S. Labor Market Make Conditions Worse for Native Workers During the Great Recession?
 Did Immigrants in the U.S. Labor Market Make Conditions Worse for Native Workers During the Great Recession? Robert Pollin & Jeannette Wicks-Lim RESEARCH INSTITUTE POLITICAL ECONOMY Gordon Hall 418 North
The Changing Racial and Ethnic Makeup of New York City Neighborhoods
 The Changing Racial and Ethnic Makeup of New York City Neighborhoods State of the New York City s Property Tax New York City has an extraordinarily diverse population. It is one of the few cities in the