Lecture 4: Change Over Time
|
|
|
- Heather Farmer
- 5 years ago
- Views:
Transcription
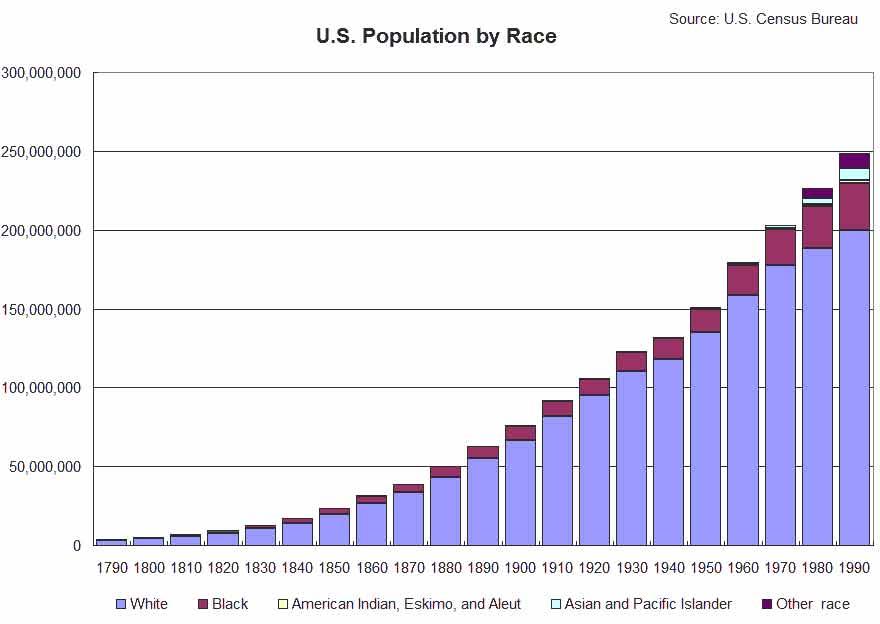
1 Lecture 4: Change Over Time I. Charts and Maps A. Graphing Statistics and Data by Wallgreen et al. (Sage, Thousand Oaks, 1996: pp ) i. Bar charts, Horizontal bar charts, Grouped bar charts, Staked bar charts ii. Histograms iii. Population pyramids iv. Pie charts v. Scatterplots vi. Line charts, Area charts, Flow charts vii. Boxplots viii. Density maps ix. Choropleth maps (thematic maps) B. America by the Numbers by Frey et al. (New Press, New York, 2001) i. Median income by sex and race, 1998 ii. White attitudes toward school integration iii. Self-identified race of selected U.S. hispanics, 1990 iv. Population structures, 2000 v. Urbanization in the United States vi. The face of today's urban growth vii. High-school dropout rate by race, 1998 C. Understanding by Richard Saul Wurman (Ted Conferences, Newport, 1999) i. Immigration ii. Juvenile crime D. Original charts: different presentation of the same data: U.S. Population by Race from 1790 to 1990 i. Stacked bar chart ii. Ratio chart iii. Line chart iv. Line chart by index
2

3
4
5
6 II. III. Sophisticated Examples A. The Visual Display of Quantitative Information by Edward Tufte (Graphics Press, Cheshire, CT, 2001) i. Dr. John Snow's map of deaths from cholera ii. OPEC Oil Prices (from NY Times) iii. New York State Total Budget Expenditures and Aid to Localities (from NY Times) iv. The Shrinking Family Doctor in California (from LA Times) Student Examples A. Who is Moving Out by Hiba Bou Akar B. Rent Decontrol and September 11 by Moshahida Sultana C. Gentrification in Central Square by Will Carry D. School Concentration, Wealth Clustering, Ethnic Diversity and Central Square by David Ritchay E. Diversity in Central Square by Susana Williams


7 A WHO IS MOVING OUT? Hiba Akar Click on images for larger views Mapping the percentage of the rented housing units in the city of Cambridge gives us the impression that most residential units in Central Square are rented rather than owned. However, 1990 & 2000 data clearly shows that Central Square is losing its low and middle income population. Closer look at Central Square and its vicinity. Meanwhile rents are increasing all over Cambridge; Rent Occupied Units Owner Occupied Units Total Occupied Units % of rent occupied units to owner occpied units % Vacant units the ratio of rent occupied to owner occupied units is decreasing. % of owner occupied units has more than doubled from 1990 to 2000 in Central Square. Students might be part of the population leaving Central Square.

8 Decrease in low and middle income, renter groups, and students -manifested in the decrese in the percentage of population age- suggest that they groups are moving out of Central Square. Additional data might assert if students are gradually renting towards East Cambridge. link to: Purpose, Process, and Reflections link to: Who is moving out?.doc


9 Rent Decontrol and September 11 Moshahida Sultana How Has Central Square's Housing Market Changed? Because Central Square is A Center of the Biggest Residential A Center of the Largest Commercia Between Harvard and MIT Well Connected by Subway and Bus Located Close to Downtown Boston Has Convenient Access to Shopping Rent Decontrol in 1995 Housing Sales Price Increased Investment Increased After September 11 - Influx of Immigrants and Corporate Relocation Decreased Rent Decreased The Composition of New Renters Changed
10
11 About the Research My Argument: After September 11, rent decontrol has actually caused rents in Central Square to decrease. September 11 has also changed the composition of new renters moving to Central Square. My Position: I am a planner at the Manhattan Institute of Policy Research. The Manhattan Institute is a think tank whose mission is to develop and disseminate new ideas that foster greater economic choice and individual responsibility. I have come to the MIT Center for Real Estate (CRE) to present my preliminary findings about Central Square to some real estate economists at CRE. What is the question and why is it important? Henry O. Pollakowski has been a housing economist at the MIT Center for Real Estate since He studied the effect of rent decontrol in Cambridge after Cambridge maintained a very strict form of rent regulation till 1995 and rents were held considerably below market rents. After 1996 investment increased by approximately 20% over what would have been the case if rent control had been maintained. Manhattan Institute of Policy Research hired me to find out if New York City could achieve the same result from deregulation. To do so I have selected Central Square as a sample to understand what kinds of changes are taking place in Central Square after September 11 attack of Specifically, I want to see if rent is increasing and how the composition of renters is changing. My research finding will be helpful in understanding how housing market has changed after September 11 attack and how effective deregulation is after One assumption inherent in my position: Increase in housing price also increases rent but decrease in rent does not necessarily decrease the price of housing. My methodology: For this project I had to rely heavily on data but I paid equal attention to the qualitative data too. For example, I have consulted my observations with one of the real estate agencies located in Central Square and requested them to share with me their own opinion about the new trend after September 11. This gave me a very useful insight and helped me to go beyond the available statistics of U.S. Census Bureau. It was fascinating to discover something with own eyes rather than depending on the information available in books and Internet. Research Findings: My research finding is completely different from what I expected it to be. I focused more on rent decontrol than on any other shock like September 11 attack. The Most Significant Constraint: Gathering additional data was the most significant constraint in such a short period of time. I spent a good amount of time to find an argument that excites me and after that getting data to support my argument was the most difficult part. One action that I would take to overcome this constraint:i will clearly define my goal and play with the already existing data to find a significant relationship between variables. I will narrow the topic from the beginning in order to avoid last minute rush. Did I enjoy? I enjoyed the part of taking photos and creating website in this process. I would prefer to have the topic given so that I could spend more time in learning the technical issues and finding out creative ways to do the same thing differently.

12 What has been the impact of gentrification on Central Square? On rents? On the racial and income mix? On the neighborhood fabric? Rent and Real Estate Value Trends Central Square Cambridge % Chg % Chg Median Gross Rent* % % Median Value Owner- Occupied Unit* 219K 224K 2.4% 256K 331K 29.1% *Values are not adjusted for inflation. Source: US Census 2000 and 1990 Population Trends 0.1 Population Trends in Central Square and Cambridge: Perc ent Change by Dec ade Poverty Trends Perc ent Change in Poverty Rates : Central Square in the Regional Context Population Change Cent ra l Square Cambr idge Decade Source: US Census 1970, 1980, 1990, 2000 % Chg in Poverty C ent ral Sq uare C ambrdige B ost on M et ro A rea Source: US Census 1990 & 2000 A Neighborhood Change Fact Sheet by William Carry Dec. 2, 2003

 and 6.")
13 Ethnic and Racial Composition Trends* Income: How Does Central Square Compare to Cambridge? Rac ial Composition of Central Square in % 3% White Af rican American American Indian Asian Other 19% 0% 72% Source: US Census 1990 Rac ial Composition of Central Square in % 3% 6% White 0% Afrcan i Amercan i 12% A merican Indian Asian Other Two or mo re races Source: US Census % Hispanic Population Trends *Census data asks respondents if they are Hispanic in separate question. In 2000, 7.2% of Central Square residents identified themselves as Hispanic, compared to 7.7% in The figures for Cambridge were 7.3 (2000) and 6.4 (1990), (Source: US Census 1990 & 2000). A Neighborhood Change Fact Sheet by William Carry Dec. 2, 2003


14 Susana Williams Analysis prepared for: DIVERSITY IN CENTRAL SQUARE THE CENTRAL SQUARE ECONOMIC DEVELOPEMENT ASSOCIATION By: Williams and Associates. Central Square businesses have invested in its diversity as one of its greatest strengths and have marketed itself that way. But how diverse is Central Square? Central Square portrays an image of diversity along Massachusetts Avenue. WHITE AND NON-WHITE POPULATION BY CENSUS TRACT Exploring the white-non-wh ite ratio of populati on on each tract in Cambridge N N Miles MBTA Stops MBTA Subway BLUE GREEN ORANGE RED Central Square Boundary Cambridge Border White Population wi thin each Census Tract 37% - 57% 57% - 68% 68% - 76% 76% - 81% 81% - 93% MBTA Stops MBTA Subway BLUE GREEN ORANGE RED Centra l Square Boundary Cambridge Border Non-Whi te Populaton i withn i each Census Tract 7% - 18% 18% - 23% 23% - 32% 32% - 41% 41% - 63% Data Source: U.S. Bureau of the Census, 2000 MBTA Author: Susana Williams Date: November 30, 2002 Analyzing the percentages of white and non-white population in the Central Square Tract, one can see that the percentage of white people is much higher than that of non-white.
15 ETHNIC DIVERSITY BY CENSUS TRACT OTHER PACIFIC ASIAN NATIVE AMERICAN BLACK WHITE CENTRAL SQUARE TRACT PERCENTAGE Author: Susana M. Williams Data Source: US Census /02/2002 CAMBRIDGE CENSUS TRACTS This chart provides a more detailed understanding of the different groups comprising the Central Square area. It is very easy to see how Central Square is not one of the most diverse areas in Cambridge anymore.
16 ANSWERS TO QUESTIONS: 1. What is your position and who is your intended audience? I am a private consultant for the Central Square Economic Development Association which is comprised of all the businesses in the area. Their marketing strategy relies heavily on the diversity in Central Square manifested through its murals and ethnic stores. The association wants to ensure that they should continue investing on this image or if they should refocus their goals since there is also a trend for gentrification. 2. What is the question and why is it important? The question is: Is diversity a true character of Central Square or is it just a nostalgic image and a current business tool? It is important for the businesses of the area since there are conflicting views about gentrification and economic development among businesses themselves. Central Square has always portrayed itself as a community of immigrants and celebrates that fact. Some stores (and also residents) capitalize on this issue and set restrictions for other types of development. However, different business interests feel the need to refocus some of their strategies and be able to learn for sure what they can count on. 3. After some analysis, you will likely refine your question. Describe one assumption inherent in your position. The assumption made was that Central Square was viewed as the most diverse area in Cambridge and that this diversity was only based on race and ethnicity since there was not more specific information broken down into neighborhoods to estimate diversity in income levels (professional, students and blue collar), different age groups etc. 4. Briefly describe your methodology. Do you rely heavily on quantitative data? Qualitative data? A combination of the two? For the framing of the questions, qualitative data was important to me since it was matter of the image of Central Square. However, I relied heavily upon quantitative data to find ethnicity rations within each tract, population densities and percentages that would give me a better insight on this project. 5. What is the principal finding? Did your analysis support or deny your original hypothesis? Did you discover a finding that was only remotely related to your original question, and change your question? My findings corroborated one of my assumptions that questioned whether diversity was being used to preserve a nostalgic image and a current business tool to promote an identity for the area. 6. Identify at least three constraints you experienced during the research process. a. Restrictions on the amount of data provided for the project. Diversity for me is not only based on race or ethnicity, but also on different educational and income levels that may bring professionals or blue-collar workers to live close together. An aspect of diversity is also manifested on different age levels (i.e. young professionals, children and seniors in the same neighborhood). It would have been interesting to get more of this information in a smaller level than the census tract to see the actual composition of Central Square. b. Schedule of TA s was incompatible with most of my classes. Many of the scheduled hours were set when most of us were having the core courses. This was more of an inconvenience than a constraint because I have to chase them later otherwise. c. Some of the programs are more user-friendly than other ones and I found myself repeating one of the labs thoroughly to re-understand the main concepts. 7. Describe one action you would take to overcome one of these constraints. Be specific. Imagine that you were given the entire semester to complete the project. What action(s) would you take to improve the end result? With a full semester, I think we would have been able to utilize much more of the data existing in the network and have the opportunity to look for missing data on our own. 8. Did you enjoy the process? Why or why not? How might you change your approach or question so that it had more meaning or held your interest? I certainly enjoyed the process. I felt I had the opportunity to actually utilize the tools we learned in a more comprehensive way. My current approach and questions were influenced by availability of data for the course. I may have approached Central Square in a different way if I knew I had no restrictions on what it could have been used (i.e. community organizations and citizen participation, minority levels of involvement in the neighborhood, role of religious groups in community building and immigrant access to some of these services).
Gentrification: A Recent History in Metro Denver
 Gentrification: A Recent History in Metro Denver RESEARCH POWERED BY OVERVIEW This report examines the relationship between metro Denver s history of redlining and recent gentrification trends in the region
Immigrant Communities of Philadelphia: Spatial Patterns and Revitalization
 University of Pennsylvania ScholarlyCommons Reports Social Science Studio 1-1-2015 Immigrant Communities of Philadelphia: Spatial Patterns and Revitalization Jake Riley University of Pennsylvania, rjake@sas.upenn.edu
Patterns of Housing Voucher Use Revisited: Segregation and Section 8 Using Updated Data and More Precise Comparison Groups, 2013
 Patterns of Housing Voucher Use Revisited: Segregation and Section 8 Using Updated Data and More Precise Comparison Groups, 2013 Molly W. Metzger, Assistant Professor, Washington University in St. Louis
Gentrification is rare in the Orlando region, while a moderate number of neighborhoods are strongly declining.
 ORLANDO REGION Gentrification is rare in the Orlando region, while a moderate number of neighborhoods are strongly declining. One in four regional residents live in an area that experienced strong decline
Patterns of Housing Voucher Use Revisited: Segregation and Section 8 Using Updated Data and More Precise Comparison Groups, 2013
 Patterns of Housing Voucher Use Revisited: Segregation and Section 8 Using Updated Data and More Precise Comparison Groups, 2013 Molly W. Metzger Center for Social Development Danilo Pelletiere U.S. Department
BUFFALO REGION. NET DISPLACEMENT (Low-Income Change in Tracts with Strong Expansion, )
") BUFFALO REGION Poverty concentration and neighborhood abandonment are commonplace in the Buffalo region, while economic growth and displacement are rare. Regionally, about 3 percent of residents live in
BUFFALO REGION Poverty concentration and neighborhood abandonment are commonplace in the Buffalo region, while economic growth and displacement are rare. Regionally, about 3 percent of residents live in
Regional Total Population: 2,780,873. Regional Low Income Population: 642,140. Regional Nonwhite Population: 1,166,442
 BALTIMORE REGION Neighborhood change in Baltimore is marked by a major city suburban divide, reflecting its long and troubled history of racial segregation. In the suburbs, only about one in six residents
Rutgers Center on Law, Inequality & Metropolitan Equity
 Rutgers Center on Law, Inequality & Metropolitan Equity Displacement Risk and Gentrification: The CLiME Displacement Risk Indicators Matrix (DRIM) Methodology A CLiME Research Brief November 2017 By David
South Salt Lake: Fair Housing Equity Assessment
 South Salt Lake: Fair Housing Equity Assessment Prepared by Bureau of Economic and Business Research David Eccles School of Business University of Utah James Wood John Downen DJ Benway Darius Li April
The Changing Racial and Ethnic Makeup of New York City Neighborhoods
 The Changing Racial and Ethnic Makeup of New York City Neighborhoods State of the New York City s Property Tax New York City has an extraordinarily diverse population. It is one of the few cities in the
An Equity Profile of the Southeast Florida Region. Summary. Foreword
 An Equity Profile of the Southeast Florida Region PolicyLink and PERE An Equity Profile of the Southeast Florida Region Summary Communities of color are driving Southeast Florida s population growth, and
Midvale: Fair Housing Equity Assessment
 Midvale: Fair Housing Equity Assessment Prepared by Bureau of Economic and Business Research David Eccles School of Business University of Utah James Wood John Downen DJ Benway Darius Li April 2013 [DRAFT]
APPENDIX G DEMOGRAPHICS
 APPENDIX G DEMOGRAPHICS Analyzing current and past demographic data is an important step in defining future transportation needs for individuals living and working in the PPUATS Metropolitan Planning Area.
Population Vitality Overview
 8 Population Vitality Overview Population Vitality Overview The Population Vitality section covers information on total population, migration, age, household size, and race. In particular, the Population
Neighborhood Diversity Characteristics in Iowa and their Implications for Home Loans and Business Investment
 Economics Technical Reports and White Papers Economics 9-2008 Neighborhood Diversity Characteristics in Iowa and their Implications for Home Loans and Business Investment Liesl Eathington Iowa State University,
Downtown Redmond Link Extension SEPA Addendum. Appendix G Environmental Justice. August Parametrix 719 2nd Avenue, Suite 200
 Downtown Redmond Link Extension SEPA Addendum Appendix G Environmental Justice August 2018 Prepared for Central Puget Sound Regional Transit Authority 401 S. Jackson Street Seattle, WA 98104 Prepared by
California s Congressional District 37 Demographic Sketch
 4.02.12 California s Congressional District 37 Demographic Sketch MANUEL PASTOR JUSTIN SCOGGINS JARED SANCHEZ Purpose Demographic Sketch Understand the Congressional District s population and its unique
IN THE UNITED STATES DISTRICT COURT FOR THE EASTERN DISTRICT OF PENNSYLVANIA
 IN THE UNITED STATES DISTRICT COURT FOR THE EASTERN DISTRICT OF PENNSYLVANIA Mahari Bailey, et al., : Plaintiffs : C.A. No. 10-5952 : v. : : City of Philadelphia, et al., : Defendants : PLAINTIFFS EIGHTH
Understanding Transit s Impact on Public Safety
 Understanding Transit s Impact on Public Safety June 2009 401 B Street, Suite 800 San Diego, CA 92101-4231 Phone 619.699.1900 Fax 619.699.1905 Online www.sandag.org UNDERSTANDING TRANSIT S IMPACT ON PUBLIC
Mexicans in New York City, : A Visual Data Base
 Mexicans in New York City, 1990 2009: A Visual Data Base Center for Latin American, Caribbean & Latino Studies Graduate Center City University of New York 365 Fifth Avenue Room 5419 New York, New York
An Equity Assessment of the. St. Louis Region
 An Equity Assessment of the A Snapshot of the Greater St. Louis 15 counties 2.8 million population 19th largest metropolitan region 1.1 million households 1.4 million workforce $132.07 billion economy
COMPARATIVE ANALYSIS OF NEIGHBORHOOD CONTEXTS: ANNIE E. CASEY FOUNDATION CITIES
 ANNIE E. CASEY FOUNDATION MAKING CONNECTIONS INITIATIVE COMPARATIVE ANALYSIS OF NEIGHBORHOOD CONTEXTS: ANNIE E. CASEY FOUNDATION CITIES G. Thomas Kingsley and Kathryn L.S. Pettit December 2003 THE URBAN
Community Well-Being and the Great Recession
 Pathways Spring 2013 3 Community Well-Being and the Great Recession by Ann Owens and Robert J. Sampson The effects of the Great Recession on individuals and workers are well studied. Many reports document
City of Hammond Indiana DRAFT Fair Housing Assessment 07. Disparities in Access to Opportunity
 ANALYSIS EDUCATIONAL OPPORTUNITIES i. Describe any disparities in access to proficient schools based on race/ethnicity, national origin, and family status. ii. iii. Describe the relationship between the
REGIONAL. San Joaquin County Population Projection
 Lodi 12 EBERHARDT SCHOOL OF BUSINESS Business Forecasting Center in partnership with San Joaquin Council of Governments 99 26 5 205 Tracy 4 Lathrop Stockton 120 Manteca Ripon Escalon REGIONAL analyst june
Area Year 2000 Year 2030 Change. Housing Units 3,137,047 4,120, % Housing Units 1,276,578 1,637, % Population 83,070 96,
 4.3 POPULATION, HOUSING AND ENVIRONMENTAL JUSTICE This section describes potential project-related impacts to population, housing and employment associated with the Canoga Transportation Corridor Project.
New Jersey Long-Range Transportation Plan 2030
 New Jersey Long-Range Transportation Plan 2030 Task 7.3 Demographic Analysis Technical Memorandum Prepared for: New Jersey Department of Transportation Prepared by: DMJM Harris, Inc. March 2006 TABLE OF
HOUSTON REGION. NET DISPLACEMENT (Low-Income Change in Tracts with Strong Expansion, )
") HOUSTON REGION The Houston region has undergone significant population growth since 2000. About 13 percent of regional population lives in a census tract that has undergone strong economic expansion, while
HOUSTON REGION The Houston region has undergone significant population growth since 2000. About 13 percent of regional population lives in a census tract that has undergone strong economic expansion, while
The Impact of Drug and Marijuana Arrests Within the Largest Cities of Massachusetts
 The Impact of Drug and Marijuana Arrests Within the Largest Cities of Massachusetts By Jon B. Gettman, Ph.D. Associate Professor, Criminal Justice Shenandoah University jgettman@su.edu January 8, 2018
2016 Appointed Boards and Commissions Diversity Survey Report
 2016 Appointed Boards and Commissions Diversity Survey Report November 28, 2016 Neighborhood and Community Relations Department 612-673-3737 www.minneapolismn.gov/ncr Table of Contents Introduction...
DEMOGRAPHIC PROFILE Skagit County, Washington. Prepared by: Skagit Council of Governments 204 West Montgomery Street, Mount Vernon, WA 98273
 DEMOGRAPHIC PROFILE 2013 Skagit County, Washington Prepared by: Skagit Council of Governments 204 West Montgomery Street, Mount Vernon, WA 98273 CONTENTS TABLE OF CONTENTS Introduction... 1 Persons and
MARKET SNAPSHOT New York DMA
 MARKET SNAPSHOT New York DMA The New York Designated Market Area (DMA) is the most populous and densely populated area in the U.S. with a total 2016 population of 21,438,229 and a population density of
Corruption's Effect on Socioeconomic Factors
 College of Saint Benedict and Saint John's University DigitalCommons@CSB/SJU Celebrating Scholarship & Creativity Day Experiential Learning & Community Engagement 2016 Corruption's Effect on Socioeconomic
Working Overtime: Long Commutes and Rent-burden in the Washington Metropolitan Region
 Working Overtime: Long Commutes and Rent-burden in the Washington Metropolitan Region By Kathryn Howell, PhD Research Associate George Mason University School of Public Policy Center for Regional Analysis
Environmental Justice Demographic Profile
 CENTRAL PUGET SOUND REGION Environmental Justice Demographic Profile January 2016 Contents INTRODUCTION... 3 OBJECTIVES... 4 DEFINITIONS... 4 Minority Populations... 4 Low-Income Population... 4 Other
Poverty in Buffalo-Niagara
 Cornell University ILR School DigitalCommons@ILR Buffalo Commons Centers, Institutes, Programs 9-2014 Poverty in Buffalo-Niagara Partnership for the Public Good Follow this and additional works at: http://digitalcommons.ilr.cornell.edu/buffalocommons
Racial Inequities in Montgomery County
 W A S H I N G T O N A R E A R E S E A R C H I N I T I A T I V E Racial Inequities in Montgomery County Leah Hendey and Lily Posey December 2017 Montgomery County, Maryland, faces a challenge in overcoming
APPENDIX B. Environmental Justice Evaluation
 Appendix B. Environmental Justice Evaluation 1 APPENDIX B. Environmental Justice Evaluation Introduction The U.S. Department of Transportation has issued a final order on Environmental Justice. This final
Salvadorans. in Boston
 Salvadorans in Boston Banda El Salvador at the 2013 Rose Parade in Pasadena, California. Photo by Prayitno Photography, retrieved from flickr.com/ photos/prayitnophotography (Creative Commons Attribution
Demographic Data. Comprehensive Plan
 Comprehensive Plan 2010-2030 4 Demographic Data Population and demographics have changed over the past several decades in the City of Elwood. It is important to incorporate these shifts into the planning
NAPP Extraction and Analysis
 Minnesota Population Center Training and Development NAPP Extraction and Analysis Exercise 2 OBJECTIVE: Gain an understanding of how the NAPP dataset is structured and how it can be leveraged to explore
Racial integration between black and white people is at highest level for a century, new U.S. census reveals
 Thursday, Dec 16 2010 Racial integration between black and white people is at highest level for a century, new U.S. census reveals By Daily Mail Reporter Last updated at 1:11 PM on 16th December 2010 But
Poverty in Buffalo-Niagara
 Cornell University ILR School DigitalCommons@ILR Buffalo Commons Centers, Institutes, Programs 4-18-2013 Poverty in Buffalo-Niagara Partnership for the Public Good Follow this and additional works at:
Latinos in Massachusetts Selected Areas: Framingham
 University of Massachusetts Boston ScholarWorks at UMass Boston Gastón Institute Publications Gastón Institute for Latino Community Development and Public Policy Publications 9-17-2010 Latinos in Massachusetts
The foreign born are more geographically concentrated than the native population.
 The Foreign-Born Population in the United States Population Characteristics March 1999 Issued August 2000 P20-519 This report describes the foreign-born population in the United States in 1999. It provides
Brazilians. in Boston
 Brazilians in Boston The Dewey Square mural (2012), by the Brazilian artist duo Os Gémeos (twins Otávio and Gustavo Pandolfo), spray painted on a 25-metre wide wall on the occasion of their exhibition
Chapter 1: The Demographics of McLennan County
 Chapter 1: The Demographics of McLennan County General Population Since 2000, the Texas population has grown by more than 2.7 million residents (approximately 15%), bringing the total population of the
The Latino Population of New York City, 2008
 The Latino Population of New York City, 2008 Center for Latin American, Caribbean & Latino Studies Graduate Center City University of New York 365 Fifth Avenue Room 5419 New York, New York 10016 Laird
The Rise and Decline of the American Ghetto
 David M. Cutler, Edward L. Glaeser, Jacob L. Vigdor September 11, 2009 Outline Introduction Measuring Segregation Past Century Birth (through 1940) Expansion (1940-1970) Decline (since 1970) Across Cities
BY Rakesh Kochhar FOR RELEASE MARCH 07, 2019 FOR MEDIA OR OTHER INQUIRIES:
 FOR RELEASE MARCH 07, 2019 BY Rakesh Kochhar FOR MEDIA OR OTHER INQUIRIES: Rakesh Kochhar, Senior Researcher Jessica Pumphrey, Communications Associate 202.419.4372 RECOMMENDED CITATION Pew Research Center,
Wealth in Polk County, Florida
 Wealth in Polk County, Florida Background & Introduction In our county or community 1 analysis we address four key awareness areas: The Transfer of Wealth (TOW) Opportunity Findings Indicators of Wealth
Appendix A. Environmental Justice Analysis
 Appendix A. Environmental Justice Analysis Project Memorandum Re: KY 536 Scoping Study Environmental Justice Analysis Date: December 22, 2014 Introduction This Environmental Justice Report presents a review
Traffic Density and Ethnic Composition in Massachusetts: An Exploratory Study. Rana Charafeddine Boston University School of Public Health
 Traffic Density and Ethnic Composition in Massachusetts: An Exploratory Study Rana Charafeddine Boston University School of Public Health Outline 1. Introduction 2. Research Question 3. Methods 4. Results
The Planning & Development Department recommends that Council receive this report for information.
 CORPORATE REPORT NO: R237 COUNCIL DATE: November 19, 2018 REGULAR COUNCIL TO: Mayor & Council DATE: November 15, 2018 FROM: General Manager, Planning & Development FILE: 6600-01 SUBJECT: Surrey Community
San Diego 2nd City Council District Race 2018
 San Diego 2nd City Council District Race 2018 Submitted to: Bryan Pease Submitted by: Jonathan Zogby Chief Executive Officer Chad Bohnert Chief Marketing Officer Marc Penz Systems Administrator Zeljka
Peruvians in the United States
 Peruvians in the United States 1980 2008 Center for Latin American, Caribbean & Latino Studies Graduate Center City University of New York 365 Fifth Avenue Room 5419 New York, New York 10016 212-817-8438
Mischa-von-Derek Aikman Urban Economics February 6, 2014 Gentrification s Effect on Crime Rates
 1 Mischa-von-Derek Aikman Urban Economics February 6, 2014 Gentrification s Effect on Crime Rates Many scholars have explored the behavior of crime rates within neighborhoods that are considered to have
This report examines the factors behind the
 Steven Gordon, Ph.D. * This report examines the factors behind the growth of six University Cities into prosperous, high-amenity urban centers. The findings presented here provide evidence that University
Boston s Emerging Ethnic Quilt: A Geographic Perspective. James P. Allen and Eugene Turner. California State University, Northridge.
 Boston s Emerging Ethnic Quilt: A Geographic Perspective by James P. Allen and Eugene Turner Department of Geography California State University, Northridge Notes The 15 full-color maps that are integral
Characteristics of People. The Latino population has more people under the age of 18 and fewer elderly people than the non-hispanic White population.
 The Population in the United States Population Characteristics March 1998 Issued December 1999 P20-525 Introduction This report describes the characteristics of people of or Latino origin in the United
CLACLS. Demographic, Economic, and Social Transformations in Bronx Community District 5:
 CLACLS Center for Latin American, Caribbean & Latino Stud- Demographic, Economic, and Social Transformations in Bronx Community District 5: Fordham, University Heights, Morris Heights and Mount Hope, 1990
Evaluating the Role of Immigration in U.S. Population Projections
 Evaluating the Role of Immigration in U.S. Population Projections Stephen Tordella, Decision Demographics Steven Camarota, Center for Immigration Studies Tom Godfrey, Decision Demographics Nancy Wemmerus
DISPROPORTIONATE MINORITY CONTACT
 DISPROPORTIONATE MINORITY CONTACT Racial and ethnic minority representation at various stages of the Florida juvenile justice system Frank Peterman Jr., Secretary Florida Department of Juvenile Justice
Officer-Involved Shootings in Fresno, California: Frequency, Fatality, and Disproportionate Impact
 Celia Guo PPD 631: GIS for Policy, Planning, and Development Officer-Involved Shootings in Fresno, California: Frequency, Fatality, and Disproportionate Impact Introduction Since the late 1990s, there
3Demographic Drivers. The State of the Nation s Housing 2007
 3Demographic Drivers The demographic underpinnings of long-run housing demand remain solid. Net household growth should climb from an average 1.26 million annual pace in 1995 25 to 1.46 million in 25 215.
Part 1: Focus on Income. Inequality. EMBARGOED until 5/28/14. indicator definitions and Rankings
 Part 1: Focus on Income indicator definitions and Rankings Inequality STATE OF NEW YORK CITY S HOUSING & NEIGHBORHOODS IN 2013 7 Focus on Income Inequality New York City has seen rising levels of income
Determinants of Violent Crime in the U.S: Evidence from State Level Data
 12 Journal Student Research Determinants of Violent Crime in the U.S: Evidence from State Level Data Grace Piggott Sophomore, Applied Social Science: Concentration Economics ABSTRACT This study examines
Low-Skill Jobs A Shrinking Share of the Rural Economy
 Low-Skill Jobs A Shrinking Share of the Rural Economy 38 Robert Gibbs rgibbs@ers.usda.gov Lorin Kusmin lkusmin@ers.usda.gov John Cromartie jbc@ers.usda.gov A signature feature of the 20th-century U.S.
We know that the Latinx community still faces many challenges, in particular the unresolved immigration status of so many in our community.
 1 Ten years ago United Way issued a groundbreaking report on the state of the growing Latinx Community in Dane County. At that time Latinos were the fastest growing racial/ethnic group not only in Dane
Demographic, Economic and Social Transformations in Bronx Community District 4: High Bridge, Concourse and Mount Eden,
 Center for Latin American, Caribbean & Latino Studies Graduate Center City University of New York 365 Fifth Avenue Room 5419 New York, New York 10016 Demographic, Economic and Social Transformations in
IV. Residential Segregation 1
 IV. Residential Segregation 1 Any thorough study of impediments to fair housing choice must include an analysis of where different types of people live. While the description of past and present patterns
Testimony of Peter Wagner, Executive Director, Prison Policy Initiative. Before the Joint Committee on Judiciary of the Connecticut General Assembly
 Peter Wagner Executive Director pwagner@prisonpolicy.org (413) 961-0002 Testimony of Peter Wagner, Executive Director, Prison Policy Initiative Before the Joint Committee on Judiciary of the Connecticut
THE LITERACY PROFICIENCIES OF THE WORKING-AGE RESIDENTS OF PHILADELPHIA CITY
 THE LITERACY PROFICIENCIES OF THE WORKING-AGE RESIDENTS OF PHILADELPHIA CITY Prepared by: Paul E. Harrington Neeta P. Fogg Alison H. Dickson Center for Labor Market Studies Northeastern University Boston,
Refusal Report Official Plan and Zoning By-law Amendment Applications 1121 Leslie Street north of Eglinton Avenue East
 STAFF REPORT ACTION REQUIRED Refusal Report Official Plan and Zoning By-law Amendment Applications 1121 Leslie Street north of Eglinton Avenue East Date: December 22, 2006 To: From: Wards: Reference Number:
Overview of Annual Survey Data Across Three New York County Jails from Working Paper # November 2017
 Overview of Annual Survey Data Across Three New York County Jails from 21-215 Working Paper #217-2 November 217 Jaleesa Panico Research Assistant Cps247@rit.edu Janelle Duda-Banwar Research Associate jmdgcj@rit.edu
Demographic, Economic, and Social Transformations in Brooklyn Community District 4: Bushwick,
 Demographic, Economic, and Social Transformations in Brooklyn Community District 4: Bushwick, 1990-2007 Astrid S. Rodríguez Ph.D. Candidate, Educational Psychology Center for Latin American, Caribbean
Segregation in Motion: Dynamic and Static Views of Segregation among Recent Movers. Victoria Pevarnik. John Hipp
 Segregation in Motion: Dynamic and Static Views of Segregation among Recent Movers Victoria Pevarnik John Hipp March 31, 2012 SEGREGATION IN MOTION 1 ABSTRACT This study utilizes a novel approach to study
Brockton and Abington
 s in Massachusetts Selected Areas Brockton and Abington by Phillip Granberry, PhD and Sarah Rustan September 17, 2010 INTRODUCTION This report provides a descriptive snapshot of selected economic, social,
THE BRAIN GAIN: 2015 UPDATE. How the Region s Shifting Demographics Favor the Lower Manhattan Business District
 THE BRAIN GAIN: 2015 UPDATE How the Region s Shifting Demographics Favor the Lower Manhattan Business District 2015 UPDATE THE BRAIN GAIN: How the Region s Shifting Demographics Favor the Lower Manhattan
Staff Pay Levels for Selected Positions in Senators Offices, FY2001-FY2015
 Staff Pay Levels for Selected Positions in Senators Offices, FY2001-FY2015 R. Eric Petersen, Coordinator Specialist in American National Government Lara E. Chausow Research Assistant November 9, 2016 Congressional
Institute for Public Policy and Economic Analysis
 Institute for Public Policy and Economic Analysis The Institute for Public Policy and Economic Analysis at Eastern Washington University will convey university expertise and sponsor research in social,
The Impact of Immigrant Remodeling Trends on the Future of the Home Improvement Industry
 The Impact of Immigrant Remodeling Trends on the Future of the Home Improvement Industry Abbe Will Remodeling Futures Conference September 22, 2009 Why Study Immigrant Remodeling Trends? Immigrants have
NOVEMBER visioning survey results
 NOVEMBER 2016 visioning survey results 2 Denveright SECTION 1 SURVEY INTRODUCTION OVERVIEW Our community is undertaking an effort that builds upon our successes and proud traditions to design the future
Presentation Script English Version
 Presentation Script English Version The presentation opens with a black screen. When ready to begin, click the forward arrow. The nations of sub-saharan Africa are poised to take off. Throughout the continent,
Brazilians. imagine all the people. Brazilians in Boston
 Brazilians imagine all the people Brazilians in Boston imagine all the people is a series of publications produced by the Boston Redevelopment Authority for the Mayor s Office of Immigrant Advancement.
Approaches to Analysing Politics Variables & graphs
 Approaches to Analysing Politics Variables & Johan A. Elkink School of Politics & International Relations University College Dublin 6 8 March 2017 1 2 3 Outline 1 2 3 A variable is an attribute that has
JULY Esri Diversity Index
 JULY 2018 Esri Diversity Index Copyright 2018 Esri All rights reserved. Printed in the United States of America. The information contained in this document is the exclusive property of Esri. This work
BIG PICTURE: CHANGING POVERTY AND EMPLOYMENT OUTCOMES IN SEATTLE
 BIG PICTURE: CHANGING POVERTY AND EMPLOYMENT OUTCOMES IN SEATTLE January 218 Author: Bryce Jones Seattle Jobs Initiative TABLE OF CONTENTS Introduction 1 Executive Summary 2 Changes in Poverty and Deep
Building Stronger Communities for Better Health: The Geography of Health Equity
 Building Stronger Communities for Better Health: The Geography of Health Equity Brian D. Smedley, Ph.D. Joint Center for Political and Economic Studies www.jointcenter.org Geography and Health the U.S.
Dynamic Diversity: Projected Changes in U.S. Race and Ethnic Composition 1995 to December 1999
 Dynamic Diversity: Projected Changes in U.S. Race and Ethnic Composition 1995 to 2050 December 1999 DYNAMIC DIVERSITY: PROJECTED CHANGES IN U.S. RACE AND ETHNIC COMPOSITION 1995 TO 2050 The Minority Business
Our Shared Future: U N D E R S T A N D I N G B O S T O N. #SharedFuture. Charting a Path for Immigrant Advancement in a New Political Landscape
 U N D E R S T A N D I N G B O S T O N Our Shared Future: Charting a Path for Immigrant Advancement in a New Political Landscape Wednesday, April 19 th, 2017 8:30-10:30 a.m. #SharedFuture U N D E R S T
DISPROPORTIONATE MINORITY CONTACT
 DISPROPORTIONATE MINORITY CONTACT Racial and ethnic minority representation at various stages of the Florida juvenile justice system Walter A. McNeil, Secretary Florida Department of Juvenile Justice Office
SECTION 1. Demographic and Economic Profiles of California s Population
 SECTION 1 Demographic and Economic Profiles of s Population s population has special characteristics compared to the United States as a whole. Section 1 presents data on the size of the populations of
Racial Disparities in the Direct Care Workforce: Spotlight on Hispanic/Latino Workers
 FEBRUARY 2018 RESEARCH BRIEF Racial Disparities in the Direct Care Workforce: Spotlight on Hispanic/Latino Workers BY STEPHEN CAMPBELL The second in a three-part series focusing on racial and ethnic disparities
Segregation in the Boston Metropolitan Area at the end of the 20 th Century
 THE CIVIL RIGHTS PROJECT HARVARD UNIVERSITY Segregation in the Boston Metropolitan Area at the end of the 20 th Century by Guy Stuart Lecturer in Public Policy Kennedy School of Government February 2000
Extrapolated Versus Actual Rates of Violent Crime, California and the United States, from a 1992 Vantage Point
 Figure 2.1 Extrapolated Versus Actual Rates of Violent Crime, California and the United States, from a 1992 Vantage Point Incidence per 100,000 Population 1,800 1,600 1,400 1,200 1,000 800 600 400 200
Business Case for Diversity
 INCORPORATING Diversity Making the Business Case for Diversity By Kari Heistad afiz Adamjee doesn t look like a revolutionary trendsetter. He was born in Africa and raised in Pakistan before he came to
Kansas Then & Now
 Kansas Then & Now 1890-2015 2016 Kansas State of the State Kansas Economic Policy Conference Reimagining Kansas: Policy Implications Now and in the Future Original Inhabitants While this presentation focuses
Riverside Labor Analysis. November 2018
 November 2018 The City of Labor Market Dynamics and Local Cost of Living Analysis Executive Summary The City of is located in one of the fastest growing parts of California. Over the period 2005-2016,
The State of Working Wisconsin 2017
 The State of Working Wisconsin 2017 Facts & Figures Facts & Figures Laura Dresser and Joel Rogers INTRODUCTION For more than two decades now, annually, on Labor Day, COWS reports on how working people