Segregation in the Boston Metropolitan Area at the end of the 20 th Century
|
|
|
- Jonathan Jones
- 5 years ago
- Views:
Transcription
1 THE CIVIL RIGHTS PROJECT HARVARD UNIVERSITY Segregation in the Boston Metropolitan Area at the end of the 20 th Century by Guy Stuart Lecturer in Public Policy Kennedy School of Government February 2000 Contact information: Guy Stuart Kennedy School of Government 79 JFK Street Cambridge, MA
2 Forward Gary Orfield The Civil Rights Project at Harvard University is committed to conducting and commissioning research which sheds light upon the changing patterns of race relations within the United States. We are convinced that housing segregation and housing discrimination in metropolitan areas, where four out of every five Americans live, are among the most urgent problems facing minorities today. For ten years, analysts have been using 1990 Census data to describe the nation's racial housing patterns; but that data is now a decade out of date. The average household in the United States moves every six years. This means that the typical family has moved more than 1.5 times since the Census was collected. During this time, there have been vast demographic changes within our nation s population. Recent data from the Census Bureau shows, for example, that in the second half of the l990s, the Latino population grew far more rapidly than the white population. In Massachusetts, according to this data, the black population grew 21% and Latinos increased 31% between l990 and 1998, while there was no increase in the white population. If these patterns continue, the greater Boston metropolitan area will soon house a much larger minority population than it does today. The ability of these growing non-white communities to enter into the educational, social and economic mainstream will become increasingly crucial to the future vitality of the region. There is a great debate in the U.S. today about whether or not our history of discrimination and segregation has been cured by the enactment of civil rights laws and the enforcement of court decisions. Many recent decisions in our federal courts have assumed that discrimination has been resolved. For example, the Supreme Court has authorized the return to segregated neighborhood schools. Federal courts, in some decisions such as the one rendered last year in regards to the Boston Latin School, are prohibiting school boards from implementing even voluntary policies to maintain integration. The University of Massachusetts is one of several major state universities to reverse its affirmative admissions policies. These decisions are based on the premise that there now exists an equal playing field for minorities in our communities. If this premise was accurate, then race would no longer play a role in where people chose to live. We would expect that the segregation in the greater Boston housing market would be declining rapidly. This is particularly true because, when compared to other large metropolitan areas, Boston has a very small percentage of black and Hispanic families, many of whom are middle class. Five out of six homebuyers are white. In addition, surveys show that few of the region's minority families prefer to live in segregated communities. Yet, this is not the case. This study and other research show that economic differences cannot explain the highly segregated pattern of housing choices because serious racial segregation continues to exist within each economic group. Homeownership has always been central to the realization of the American dream. The government offers massive tax benefits to those who own rather than rent their homes. Homeownership creates family wealth and determines access to education in communities lacking affordable rental housing. Black and Latino families lag far behind whites in
3 homeownership and are grossly underrepresented in most newer suburban communities. Nationally, the home buying market is changing substantially to reflect the dramatic impacts of immigration. The home buying market in metropolitan Boston, however, remains overwhelmingly white, in stark contrast to cities with much larger percentages of minorities. In this market, it would seem relatively easy to accommodate the small minority housing demand on a non-segregated basis. This report shows however that, 30 years after the enactment of the federal fair housing law and despite these favorable circumstances, housing markets remain strongly segregated. And it draws the links between that segregation and poorer schools, with fewer resources to offer the black and Latino children who attend them. The handful of districts where minorities are obtaining significant numbers of homes are not among the higher achieving systems. It also notes the virtual absence of black and Latino residents in many of the communities where real estate values are increasing most rapidly. It illustrates how minority households remain largely isolated from many of the fastest growing job markets. The fragmentation of the Boston area into more than 120 independent towns and school districts, the concentration of affordable rental housing in limited sectors, and the larger percentage of white students in non-public schools within Boston, all combine to make the education picture even grimmer than the housing story. Although the city of Boston has a predominantly white home purchase market and substantial gentrification, five of six children in the public schools are non-white and the school population is overwhelmingly impoverished, with low achievement levels. With the shutdown of minority access to Boston Latin School and the termination of the city s desegregation plan, racial and class isolation in the city is likely to become even more extreme. Massachusetts was one of the states with the most rapidly increasing school segregation in our l999 national report, Resegregation in American Schools. The lawsuit now under way against Lynn could lead to an order by the court prohibiting even the limited desegregation strategies now employed. Although the state s "Anti-Snob Zoning" law has helped to produce thousands of units of affordable housing in various area communities, these have not been effectively marketed to minority families. Thus the law has not made a significant impact on patterns of residential and school segregation. Boston has been the focus of intense litigation over segregation of public housing and there has been a bitter and lengthy battle to enforce those changes. The Boston area has also been the focal point for some of the most important studies showing the severity of discrimination in the mortgage lending market, carried out by the Federal Reserve Bank. This study underscores the urgent need to develop new initiatives in housing policy, in testing and enforcement of the fair housing laws, and to provide better information to minority families interested in exploring a broader range of housing options. We need to understand better the causes of the patterns revealed in this report. We should also think about how to pry open the housing market more effectively to the growing numbers of families and individuals who are hindered not only by discrimination, but by the extraordinary cost of real estate in the region. Boston was one of the last major cities to open up a fair housing center two years ago, and its work is desperately needed.
4 An ongoing focus on housing patterns must be a central tenet of contemporary civil rights efforts. Housing segregation, reinforced by municipal and educational separation and the migration of minority families into neighborhoods far removed from suburban growth centers, is exacerbating racial and ethnic inequalities. Guy Stuart's study clearly shows that, far from easing up, these patterns may well be intensifying. If we are to halt these regressive trends, we need to develop more powerful and effective anti-discrimination policies. We also must initiate planning that recognizes and provides for the diversity of the metropolitan population. This study reveals the scope of the problem. We hope that it will be instrumental in focusing attention on the mechanisms and leadership needed to make real inroads, so that all groups can benefit from the opportunities available within our communities.
5 Executive Summary Throughout the United States metropolitan areas are undergoing considerable changes as minorities leave central cities and buy homes in suburbs. The Boston metropolitan area is no different. This report shows that African-American and Hispanic homebuyers are making inroads into the housing markets of towns and cities surrounding Boston. But it also shows that these buyers are concentrated in a limited number of communities: they are segregated from European-American homebuyers. In addition, the report shows that people of different incomes are buying in different communities outside of Boston -- there is income segregation. Specifically, the findings of the report are the following: In the Boston metropolitan area over 40% of African-American homebuyers, 60% of Hispanic homebuyers and 90% of European-American homebuyers bought homes in cities and towns outside of Boston in the period 1993 to 1998; Almost half of the purchases made by African-American and Hispanic homebuyers outside of Boston were concentrated in seven (7) communities out of a total of 126 communities; To achieve racial and ethnic integration with European-American homebuyers, over 50% of African-American and Hispanic homebuyers would have had to have bought a home in a different city or town in the 1993 to 1998 period; To achieve income integration between low-income and very high-income European- American buyers, almost 50% of low-income buyers would have had to have bought a home in a different city or town in the 1993 to 1998 period; In the city of Boston, the market share of buyers earning more than the metropolitan area median income has increased from 40% to 50% in the 1993 to 1998 period; Asian-American homebuyers are experiencing segregation, but to a lesser extent than African-American and Hispanic buyers; These findings are disturbing because they indicate that despite the progress that disdavantaged minorities have made in achieving homeownership outside of Boston, there is a danger that the benefits of such ownership may not accrue to them. In particular, this report raises concerns about the potential for the emergence of highly segregated schools across the metropolitan area. Furthermore, the finding of income segregation provides evidence of the persistence of a patchwork of "have" and "have not" communities outside of Boston that affect the opportunities available to a large number of lower-income families. But the news is not all bad. Exclusive, high-income, European-American communities have not excluded all minority and low-income homebuyers. Their presence throughout the metropolitan area is a fact of life. The state, local governments and the real estate industry can provide the leadership necessary to ensure that pernicious patterns of segregation do not become entrenched in the first decade of this new century. The report is based on Home Mortgage Disclosure Act (HMDA) data and census data. The HMDA data provide information about the race, ethnicity, income, and census tract location of nearly all home purchases involving a mortgage loan across the nation. The report covers the Boston Primary Metropolitan Statistical Area (PMSA). The data are drawn from the years 1993 through 1998.
6 Introduction Metropolitan areas across the country are undergoing substantial changes as minorities move out of central cities and into the suburbs. This report documents this process for the Boston metropolitan area and shows that, despite their small numbers, minority home buyers are finding themselves concentrated in a limited number of communities. Outside of Boston, almost half of all African-American and Hispanic buyers (47.95%) are concentrated in seven (7) cities and towns where, combined, they made more than 10% of the home purchases in the period from 1993 to In contrast, there are 94 cities and towns out of 126 where African-American and Hispanic home buyers made up less than 2% of the buyers. Overall, African-American and Hispanic buyers made 3.35% of the purchases outside of Boston in the 1993 to 1998 period. Table 1 Cities and Towns Outside Boston with 10% or more Minority Home Purchases, 1993 to 1998 African-American and Hispanic combined Total Purchases (where race known) Towns % # Chelsea city 43.64% 525 1,203 Randolph town 32.31% 790 2,445 Everett city 15.95% 232 1,455 Lynn city 15.59% 699 4,483 Somerville city 14.36% 352 2,451 Milton town 14.01% 281 2,005 Malden city 13.06% 365 2,795 Total of towns with more than 10% minorities* 3,244 16,837 % of total purchases in towns outside Boston 47.95% 8.36% Total of towns outside Boston 6, ,377 *African-American and Hispanic only Source: FFIEC, ; Author's calculations What this table, and the more detailed analysis in the remainder of this report show, is that as the small percentage of home buyers who are African-American and Hispanic buy homes in the suburbs, they are doing so in a segregated manner. This raises important questions about the future of the metropolitan area. Are we going to replicate the racial segregation that has marred Boston's history for so long? In the face of segregation, how should government resources, especially educational resources, be distributed? What can we do to promote greater integration? This report also shows the extent to which home buyers in the metropolitan area are isolated from people of different incomes. If we look only at European-Americans, home buyers earning $36,000 or less (in 1998 dollars) made 9.4% of the home purchases in cities and towns outside Boston. There were 40 towns where more than 10% of the purchases were by people earning $36,000 or less, and 60% of their purchases were concentrated in these towns. In contrast, 14% of the purchases made by European-Americans earning over $90,000 were made in these 40
7 towns. 1 About the Boston Primary Metropolitan Statistical Area This study uses the Boston Primary Metropolitan Statistical Area (PMSA) as its definition for the Boston metropolitan area. The area covers all of Suffolk County and most of Middlesex, Essex, Plymouth, Bristol, Norfolk and Worcester counties. It stretches up and down the North and South Shores and as far west as Malborough, just west of Framingham (see maps). Technically the PMSA includes some towns in New Hampshire, which have been excluded from this analysis. 2 In 1990 the population of the area was 3,219,893. European-Americans constituted 86.32% of the population, African-Americans and Hispanics combined constituted just over 10% of the population, and Asian-Americans were 2.97% of the population (see Table 2). Table 2 Distribution of Population by Race/Ethnicity Boston Metropolitan Area, 1990 Cities and Towns Outside Boston Asian African-American Hispanic European-American Other Total # % # % # % # % # % 65, % 61, % 71, % 2,441, % 8, % 2,647, % 30.88% 54.51% 87.82% 53.04% 82.22% City of Boston Asian African-American Hispanic European-American Other Total # % # % # % # % # % 30, % 137, % 59, % 338, % 7, % 572, % 69.12% 45.49% 12.18% 46.96% 17.78% Metropolitan Area Asian African-American Hispanic European-American Other* Total # % # % # % # % # % 95, % 198, % 130, % 2,779, % 15, % 3,219, % % % % % % * "Other" includes Non-hispanic Native Americans and other races. Source: U.S. Census Bureau, These numbers are likely to be an underestimate of the extent of income segregation because the income data are those that the buyer reports in order to get a mortgage. Many buyers who indicate that they have low incomes may simply be reporting the amount of income necessary to secure a mortgage, which means that there are a number of people who do not have low incomes but show up as having low incomes in the data. As a result, there are some families that show up as low income in the data but really have considerable incomes and/or wealth that allow them to buy a home in a high-priced community. Short of fraud on the part of buyers, there is very little chance for the data to exaggerate the incomes of buyers -- those who report having high incomes have at least the income they report. 2 More details on the definition of the Boston Primary Metropolitan Statistical Area can be found in the methodological notes at the end of this report. 2
8 Boston's share of the population was 17.78%, and, though it was home to many more minorities than the surrounding cities and towns, 59.13% of its population was European-American. There were 689,935 owner occupied housing units in the Boston metropolitan area in Of these almost 95% were owned by European-Americans; African-Americans and Hispanics owned just under 3.5% of the owner occupied units, and Asian-Americans owned just over 1.5% of the units (see Table 3). Boston had just over 10% of the owner occupied units, lower than its share of population, which reflects its larger rental market. Table 3 Distribution of Owner-Occupied Housing Units by Race/Ethnicity Boston Metropolitan Area, 1990 Cities and Towns Outside Boston Asian African-American Hispanic European-American Other Total # % # % # % # % # % 8, % 5, % 4, % 598, % 1, % 619, % 34.19% 70.17% 91.58% 69.36% 89.78% Boston Asian African-American Hispanic European-American Other Total # % # % # % # % # % 1, % 11, % 2, % 55, % % 70, % 65.81% 29.83% 8.42% 30.64% 10.22% Metropolitan Area Asian African-American Hispanic European-American Other* Total # % # % # % # % # % 10, % 16, % 6, % 653, % 1, % 689, % % % % % % * "Other" includes Non-hispanic Native Americans and other races. Source: U.S. Census Bureau, 1990 Who is buying where Metropolitan overview Under the Home Mortgage Disclosure Act (HMDA) lenders report the race, income, and census tract location (and other information) of all applicants for home mortgage loans. An analysis of the applications that lenders approved for the purchase of a home which the applicant said they would occupy provides information about the race, income, and census tract location of home buyers. The methodological notes at the end of this report provide details on the definitions of the race/ethnicity and income categories used in this report. From the beginning of 1993 to the end of 1998 there were 238,414 home purchases made in the Boston Primary Metropolitan Statistical Area (PMSA) that were recorded in the HMDA data. The race and income of the purchasers were recorded in 229,658 and 234,688 of the records respectively. Just over 87% of purchases were made by European-Americans, 3.87% were made by African-Americans, 3.69% by Asian-Americans and 2.21% by Hispanics. The central city of 3
9 Boston accounted for 12.31% of the purchasing activity (see Table 4). Table 4 Cities and Towns Outside Boston Asian African-American Hispanic European-American Other** Total # % # % # % # % # % 7, % 3, % 3, % 181, % 5, % 201, % 41.35% 60.94% 90.77% 83.75% 87.69% City of Boston Asian African-American Hispanic European-American Other** Total # % # % # % # % # % 1, % 5, % 1, % 18, % 1, % 28, % 58.65% 39.06% 9.23% 16.25% 12.31% Metropolitan Area Asian African-American Hispanic European-American Other** Total # % # % # % # % # % 8, % 8, % 5, % 200, % 7, % 229, % % % % % % * Total records includes all purchases, including those where race and ethnicity are not recorded. Total includes those whose race was coded as "other" or as a mixed-race couple. Percentages for each race/ethnicity are in terms of all purchases where the race/ethnicity of the buyer is known and therefore the denominator is the Total. **Other includes Native Americans, Others and Mixed-race applications Source: FFIEC, ; Author's Calculations Distribution of Home Purchases by Race and City Location Boston Metropolitan Area, 1993 to 1998 Comparing Table 4 with Table 3 it is clear that minorities have gained a greater foothold in the Boston housing market during the mid-'90s than they had before. African-Americans owned 2.45% of the owner occupied housing units in 1990, but they made 3.87% of the home purchases in the 1993 to 1998 period. Hispanics owned less than 1% of the units in 1990, but made over 2% of the purchases. And these gains were made both in Boston itself and in the cities and towns around it. Despite these gains European-Americans still dominate the home buying market because of their sheer population numbers. By classifying the incomes of buyers into six (6) categories based on the median income for the metropolitan area in each year we can see the distribution of buyers by income over the whole period. People earning very high incomes, over one and a half times the median income ($90,000 a year in 1998) made 30% of the home purchases in the 1993 to 1998 period; in contrast people earning low incomes, 60% of the median or less ($36,000 or less in 1998) made just under 11% of the purchases (see Table 5). Despite the fact that lower income buyers had a greater share of the City of Boston housing market than they did of the metropolitan area as a whole, over 75% of them bought beyond the city's boundaries. In other words, as this report details, cities and towns outside of Boston are not, by any means, the sole domain of upper-income buyers or even of middle-income buyers, they are also home to many lower income buyers. Looking more closely at Boston itself, though over 90% of very high income buyers bought homes outside of Boston, they were a substantial presence in the city: there were more very high income buyers (6,541) in the city than low income buyers (5,911) in the 1993 to 1998 period (see 4
10 Table 5). Table 5 Distribution of Owner-Occupied Housing Units by Income and Location Boston Metropolitan Area, 1990 Cities and Towns Outside Boston Low Moderate Middle Upper-Middle Upper Very high Total # % # % # % # % # % # % 19, % 28, % 32, % 28, % 32, % 64, % 205, % 83.32% 87.84% 90.14% 91.01% 90.74% 87.63% Boston Low Moderate Middle Upper-Middle Upper Very high Total # % # % # % # % # % 5, % 5, % 4, % 3, % 3, % 6, % 29, % 16.68% 12.16% 9.86% 8.99% 9.26% 12.37% Metropolitan Area Low Moderate Middle Upper-Middle Upper Very high Total # % # % # % # % # % 25, % 34, % 36, % 31, % 35, % 70, % 234, % % % % % % % * "Other" includes Non-hispanic Native Americans and other races. Totals are not the same as in Table 4 because there are a different number of records with missing income data. Source: U.S. Census Bureau, 1990 In fact, the trend in the city over the past few years has been towards the more high income buyers: in % of the home purchases were made by buyers reporting incomes equal to or less than the metropolitan area median ($60,000 or less in 1998); in 1998 they made 50% of the purchases. The greatest gains have been among the very high income buyers who have risen from 21% to 26% of the share of home buyers in the city (see Table 6). Table 6 Percent share of Boston's Home Purchase Market, by Year and Income 1993 to 1998 Total less Total greater Low Moderate Middle than median Upper-Middle Upper Very high than median % 21% 18% 60% 10% 10% 21% 40% % 22% 16% 58% 10% 11% 21% 42% % 21% 15% 59% 11% 10% 21% 41% % 20% 14% 56% 10% 11% 23% 44% % 19% 15% 54% 11% 12% 23% 46% % 17% 15% 50% 12% 12% 26% 50% Source: FFIEC, ; Author's calculations City and town details As noted above, the purchasing data are organized by census tract. To generate a clear idea of who is buying where census tracts are not very helpful because they have very little meaning in the everyday lives of Americans. Though many tract boundaries have a social significance, we are not conscious of them as we go about our daily activities, or even as we look for a home to buy. The boundaries about which many home buyers are extremely conscious are those of the 5
11 town or city in which they are buying, mostly because they determine, especially at the elementary level, the school district in which they will find themselves. In the Boston PMSA there are 127 cities and towns, and nearly all of them have their own elementary school district (see the definitions and technical notes for more details). Much of the analysis that follows will look at the data in terms of who is buying in which city and town as a way to highlight the impact that segregation has on the ordinary lives of people. Though the HMDA data do not contain information about the town location of the purchase property, the boundaries of towns and cities and the boundaries of census tracts coincide very well. In the Boston metropolitan area there is only one census tract that clearly straddles the boundary between two towns, those being Hull and Hingham. Spatially the largest part of the tract is in Hingham and so the tract was assigned to that town. Table 7 lists the largest towns and cities in the Boston area by the number of owner-occupied housing units and the number of home purchasers. These, in turn, are divided into the cities and towns that have the greatest share of the home purchase market for each of the four major racial and ethnic groups featured in this analysis. Table 7 Owner-Occupied Housing Units, 1990 Boston Metropolitan Area Top 20 Cities/Towns # % of total # % of total Boston city 70, % Boston city 29, % Newton city 20, % Quincy city 5, % Quincy city 17, % Newton city 5, % Lynn city 14, % Plymouth town 4, % Weymouth town 13, % Cambridge city 4, % Framingham town 13, % Lynn city 4, % Medford city 12, % Framingham town 4, % Peabody city 12, % Brookline town 4, % Cambridge city 11, % Weymouth town 4, % Plymouth town 11, % Franklin town 3, % Taunton city 10, % Taunton city 3, % Arlington town 10, % Marlborough city 3, % Brookline town 10, % Medford city 3, % Waltham city 9, % Natick town 3, % Malden city 9, % Peabody city 3, % Somerville city 9, % Arlington town 3, % Braintree town 9, % Waltham city 3, % Beverly city 8, % Malden city 2, % Lexington town 8, % Beverly city 2, % Revere city 8, % Salem city 2, % All owner-occupied units 689,935 All Purchases 238,414 Source: FFIEC , Author's Calculations; U.S. Census Bureau, Home Purchases, 1993 to 1998 Boston Metropolitan Area Top 20 Cities/Towns 6
12 Table 8 Boston Metropolitan Area Home Purchases, 1993 to 1998 Top ten cities/towns by race and ethnicity Asian-American African-American Hispanic European-American Town Town Town Town Boston city 17.33% Boston city 58.65% Boston city 39.07% Boston city 9.23% Quincy city 9.99% Randolph town 7.97% Chelsea city 9.12% Plymouth town 2.22% Newton city 5.00% Lynn city 3.16% Lynn city 8.25% Newton city 2.20% Malden city 4.61% Milton town 2.89% Framingham 4.11% Quincy city 2.13% Brookline town 4.16% Malden city 2.73% Somerville city 3.83% Weymouth town 1.87% Lynn city 3.70% Cambridge city 2.00% Revere city 3.28% Cambridge city 1.83% Lexington town 3.50% Somerville city 1.78% Malden city 2.41% Framingham 1.83% Cambridge city 3.37% Medford city 1.42% Everett city 2.33% Franklin town 1.75% Randolph town 3.09% Everett city 1.28% Waltham city 1.72% Brookline town 1.69% Framingham 2.73% Stoughton town 1.26% Randolph town 1.60% Lynn city 1.66% Total Total Total Total Purchases 8,476 Purchases 8,894 Purchases 5,065 Purchases 200,152 Source: FFIEC, , Author's Calculations (% of all purchases within each group) Obviously these lists are driven by the relative size of each town or city -- the larger the city or town the greater share it will have of all the home buying market. This is clear from a comparison of the European-American list in Table 8 and the list in Table 7. Despite this "size effect" there are clear differences among the different groups as to where they are buying homes (Table 8). Only Boston and Lynn appear on every single list. Boston, due to its size, has the largest share of the market among all groups. African-Americans are the only group a majority of which are buying in Boston. But the other groups are not neglecting Boston. In fact, Boston's share of the market in every group, except African-Americans, is greater than its share of each group's housing units as of 1990 (see Table 3). For Asian-Americans and African-Americans there are clear second-place cities: Quincy and Randolph respectively. For Hispanics, Chelsea and Lynn are the most popular cities after Boston. Tables 9-12 show the top ten cities and towns for each racial or ethnic group by income. Table 9 shows the ten cities where the largest number of Asian-American home buyers bought homes, expressed as a percent of all Asian-American home purchases within three different income groups, low- and moderate-income, middle-income, and upper-income. The table shows that upper income buyers are buying in towns such as Lexington, Newton, and Brookline, while lowand moderate-income buyers are buying in Quincy, Malden, and Lynn. Both income groups are buying in Boston, but it is more likely that a lower-income Asian-American will buy in Boston than will their higher-income counterpart. 7
13 Table 9 Top ten cities/towns by Income Boston Metropolitan Area Home Purchases, 1993 to 1998 Asian-American Home Buyers Low- and moderate-income Middle-income Upper-income Town Low/mod Town Middle Town Upper Boston city 26.90% Boston city 16.47% Newton city 8.86% Quincy city 15.25% Quincy city 11.35% Boston city 8.83% Malden city 7.66% Malden city 5.38% Lexington town 7.30% Lynn city 7.07% Randolph town 4.56% Brookline town 5.43% Randolph town 3.36% Brookline town 3.97% Acton town 4.26% Cambridge city 3.32% Newton city 3.92% Cambridge city 4.13% Somerville city 3.29% Lynn city 3.54% Quincy city 3.60% Brookline town 3.15% Waltham city 3.16% Framingham town 3.13% Medford city 2.69% Framingham town 2.99% Burlington town 2.47% Framingham town 2.20% Medford city 2.86% Needham town 2.20% All Purchases 2,859 All Purchases 2,344 All Purchases 3,002 Source: FFIEC, , Author's Calculations Table 10 reinforces the fact that African-American buyers are concentrated in the city; only upper-income buyers in this group are buying predominantly outside of the city. Table 10 Top ten cities/towns by Income Boston Metropolitan Area Home Purchases, 1993 to 1998 African-American Home Buyers Low- and moderate-income Middle-income Upper-income Town Low/mod Town Middle Town Upper Boston city 71.57% Boston city 50.89% Boston city 30.54% Randolph town 4.77% Randolph town 11.94% Randolph town 11.22% Lynn city 4.08% Milton town 4.16% Milton town 6.94% Malden city 2.84% Malden city 3.42% Cambridge city 3.74% Somerville city 1.63% Lynn city 2.41% Newton city 2.65% Everett city 1.55% Somerville city 2.41% Stoughton town 2.65% Cambridge city 1.51% Medford city 2.06% Sharon town 2.45% Milton town 0.98% Cambridge city 1.94% Framingham town 2.11% Chelsea city 0.94% Stoughton town 1.91% Medford city 1.97% Medford city 0.88% Framingham town 1.56% Brookline town 1.77% All Purchases 4,783 All Purchases 2,572 All Purchases 1,470 Source: FFIEC, , Author's Calculations It is also clear that to some extent African-American buyers of different incomes are buying in 8
14 different communities: of the top nine (9) cities and towns surrounding Boston featured on the upper-income list, five (5) do not appear on the low-and moderate-income list of towns. Upperincome African-Americans are buying homes in Newton, Stoughton, Sharon, Framingham, and Brookline; while their lower-income counterparts are buying homes in Lynn, Malden, Somerville, Everett, and Chelsea. Notably there are two towns, Randolph and Milton, in which African-Americans of all incomes are buying. Table 11 shows that upper-income Hispanic buyers are buying homes in Lexington, Newton, Brookline, and Cambridge. Their lower-income counterparts, though able to buy in Somerville and Framingham which appear on the upper-income list, are concentrating in Boston, Chelsea and Lynn. Table 11 Top ten cities/towns by Income Boston Metropolitan Area Home Purchases, 1993 to 1998 Hispanic Home Buyers Low- and moderate-income Middle-income Upper-income Town Low-mod Town Middle Town Upper Boston city 44.74% Boston city 32.83% Boston city 24.81% Chelsea city 12.14% Lynn city 6.65% Framingham town 3.70% Lynn city 10.23% Framingham town 6.01% Somerville city 3.39% Revere city 3.62% Chelsea city 5.54% Brookline town 3.24% Somerville city 3.55% Somerville city 4.91% Newton city 3.24% Framingham town 3.36% Revere city 3.64% Cambridge city 3.08% Everett city 2.45% Malden city 3.09% Chelsea city 2.31% Malden city 2.16% Everett city 2.77% Lynn city 2.31% Salem city 1.78% Waltham city 2.77% Malden city 2.31% Waltham city 1.36% Randolph town 2.53% Lexington town 2.16% All Purchases 3,098 All Purchases 1,264 All Purchases 649 Source: FFIEC, , Author's Calculations Finally, Table 12 shows that European-Americans are buying homes in different cities and towns depending on their incomes. The top 10 towns in which upper-income European-Americans are buying is almost completely different from those in which lower income European-Americans are buying. The former are buying in the wealthy western suburbs, while the latter are buying along the North and South Shores. Though there is this very clear contrast in the case of the European-American data, they are, as will be shown below, the the least segregated by income. Part of the explanation for this is the fact that though, at the extremes, the data show a high level of segregation, there is a large middle sector in which there is more income integration. 9
15 Table 12 Top ten cities/towns by Income Boston Metropolitan Area Home Purchases, 1993 to 1998 European-American Home Buyers Low- and moderate-income Middle-income Upper-income Town Low-mod Town Middle Town Upper Boston city 11.54% Boston city 8.44% Boston city 8.59% Lynn city 3.97% Plymouth town 2.97% Newton city 3.48% Plymouth town 3.53% Quincy city 2.55% Brookline town 2.21% Quincy city 3.31% Weymouth town 2.37% Cambridge city 2.09% Taunton city 3.09% Framingham town 2.01% Franklin town 1.98% Weymouth town 2.97% Taunton city 1.97% Wellesley town 1.85% Salem city 1.95% Peabody city 1.92% Framingham town 1.71% Peabody city 1.89% Franklin town 1.89% Needham town 1.67% Revere city 1.85% Lynn city 1.78% Arlington town 1.64% Framingham town 1.79% Medford city 1.70% Lexington town 1.61% All Purchases 45,591 All Purchases 58,168 All Purchases 93,788 Source: FFIEC, , Author's Calculations These lists also reveal towns and cities where people of different races are buying. The wealthy towns of Brookline and Newton attract upper-income people of all races; Lynn is the most strikingly integrated town, other than Boston, in which lower-income home buyers are buying (though, as this report shows later on, it is segregated within its borders). Who is buying with whom Those familiar with the Boston metropolitan area should not find the description of "who is buying where" very surprising. The names are familiar, and the data fit the generalizations that people living in the area have developed over the years. Another way of looking at the data that is less familiar to most people, and sheds light on the nuances of segregation, is to look at "who is buying with whom?" This analysis will focus on the cities and towns outside of Boston because it is here where the majority of the home buying activity takes place and it is here where the socially significant school district boundaries divide people. Table 13 shows the extent to which people of different races are buying homes in the market in which people of other races are also active in the 126 cities and towns outside of Boston. Looking at the shaded cells in the table we see that more than 70% of African-American buyers, Hispanic buyers and Asian-American buyers bought homes in communities where they were an above-average presence in the home buying market. African-Americans bought 1.83% of the homes in the 1993 to 1998 period in the cities and towns surrounding Boston. In 19 of those cities and towns they exceeded their average market share of 1.83%, and 73.16% of them bought homes in those 19 communities. In other words, 73.16% of African-American buyers are concentrated in 19 communities where they have an above-average market share. In the case of Hispanic buyers, 71.49% of buyers are concentrated in 17 communities where they have a market 10
16 share above their average share of 1.53%. Finally, though a larger percent of Asian-Americans buyers, 79.79%, are concentrated in communities where they have a market share above their average share of 3.47%, they are spread throughout 32 communities. This, as will be confirmed below using segregation indices, means that they are less segregated than African-Americans and Hispanics. Table 13 Concentration of Buyers in Cities and Towns with an Above-Average Number of Buyers of Different Ethnicities Cities and Towns Outside Boston, 1993 to 1998 Type of City/Town, based on African-American Hispanic Asian-American European-American % of buyers, 1993 to 1998 # and % # and % # and % # and % Above-Average African-American Buyers 2,691 2,122 2,568 36,043 (19 towns and cities) 73.16% 68.74% 36.65% 19.84% Above-Average Hispanic Buyers 2,213 2,207 2,440 32,763 (17 towns and cities) 60.17% 71.49% 34.82% 18.03% Above-Average Asian-American Buyers 2,537 2,292 5,591 62,869 (32 towns and cities) 68.98% 74.25% 79.79% 34.60% Above-Average European-American Buyers , ,195 (99 towns and cities) 22.40% 23.78% 25.30% 68.91% Total for cities and towns outside Boston 3,678 3,087 7, ,684 Source: FFIEC, , Author's Calculations Focusing now on the column on the far right of the table, we can see the extent to which European-Americans are buying in communities with an above-average minority presence. The data show that less than 20% of European-American buyers are buying in communities where African-Americans and Hispanics have an above-average presence in the market. In contrast, over 30% of them are buying in a community where Asian-Americans have an above-average presence. In other words, European-Americans are more likely to be buying homes in communities where there is an above-average number of Asian-American buyers than they are to be buying homes in communities with an above-average number of other minority buyers. It should also be noted that while African-American and Hispanics overlap considerably in the communities in which they are buying, there is less overlap between them and Asian-Americans. For example, 68.74% of Hispanic buyers are buying in the above average African-American markets while only 36.65% of Asian-Americans are doing so. And again, 60.17% of African- American buyers are buying in above-average Hispanic markets, while only 34.82% of Asian- American buyers are doing so. Table 14 shows the extent to which things are changing in the cities and towns surrounding Boston. Among African-American buyers, 74.09% are buying in the 28 towns and cities in which they had an above-average ownership presence in 1990 (greater than 0.93% of owneroccupied units). Among Asian-American buyers, 68.85% are buying in the 41 towns and cities cities in which they had an above-average ownership presence in 1990 (greater than 1.42% of owner-occupied units). And Hispanic buyers, 70.31% are buying in the 42 towns and cities in which they had an above-average ownership presence in 1990 (greater than 0.77% of owneroccupied units). 11
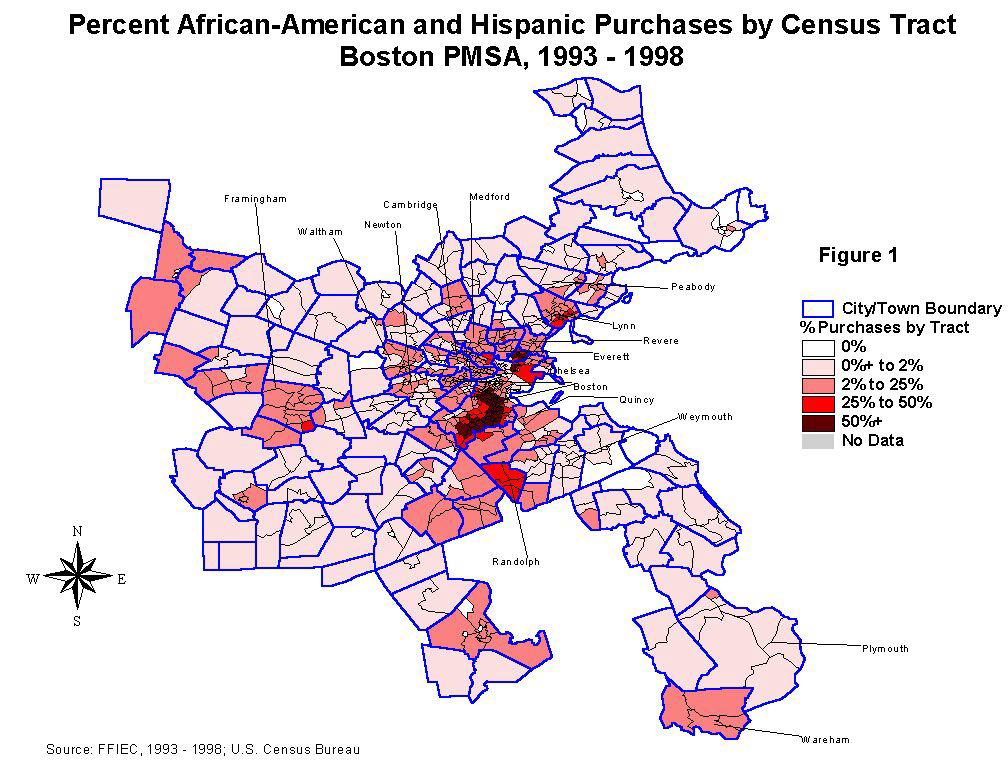
17 Table 14 Concentration of Home Buyers in Above-Average Ownership Cities and Towns of Different Ethnicities Cities and Towns Outside Boston, 1993 to 1998 Type of City/Town, based on African-American Hispanic Asian-American European-American % of owner-occupied housing units in 1990 # and % # and % # and % # and % Above-Average African-American Ownership 2,725 2,042 3,329 49,903 (28 towns and cities) 74.09% 66.15% 47.51% 27.47% Above-Average Hispanic Ownership 2,311 2,173 3,129 59,311 (42 towns and cities) 62.83% 70.39% 44.66% 32.65% Above-Average Asian-American Ownership 1,977 1,536 4,824 58,551 (41 towns and cities) 53.75% 49.76% 68.85% 32.23% Above-Average European-American Ownership 920 1,072 2, ,677 (94 towns and cities) 25.01% 34.73% 31.91% 66.97% Total for cities and towns outside Boston 3,678 3,087 7, ,684 Source: FFIEC, ; U.S. Census Bureau, 1990 Though the data indicate that minorities are buying in communities where they already had a home ownership stake in 1990, they also show that many of them are buying in communities that were almost exclusively European-American in This is revealed in the penultimate row of the table, which shows the percent of each group that are buying in communities where European-Americans had an above average ownership presence in 1990 (owned over 96.68% of the owner-occupied housing units) : 25.01% of African-Americans, 34.73% of Hispanics and 31.91% of Asian-Americans are buying homes in such highly exclusive communities. The maps in Figures 1, 2 and 3 at the end of this report provide a visual rendition of these data, with some added detail. Figure 1 shows the distribution of African-American and Hispanic buyers combined, and figures 2 and 3 show the distribution of Asian-American and European- American buyers for the period 1993 through The maps show the extent to which African- Americans and Hispanics are far more concentrated in a few communities than are Asian- Americans. But the news is not all bad, African-Americans and Hispanics had a small presence in almost all communities in the metropolitan area. Note that the maps display these data by census tract, but also display the boundaries of each city and town within the PMSA. They show that in some cities and towns there are concentrations of minorities in particular census tracts, and that in other cities and towns there are very few minority buyers regardless of the part of the town in which you look. For example, both Boston and Lynn show clear patterns of segregation within their borders, while in the towns and cities along the North and South Shores nearly all the census tracts are over 95% European-American. One lesson to be drawn from these data is that there are still many European-American communities in the Boston area that remain to some extent racially and ethnically isolated, despite the growing presence of minorities in the housing market. But the data also show that many once-exclusive communities are becoming the homes of a few minorities: minorities in the cities and towns surrounding Boston are a fact of life. Another lesson to be learned from these data is that the European-Americans buyers are being joined in the market largely by Asian- 12
18 Americans. Though Asian-Americans are buying in communities where they already had a presence, they are still buying in a market with European-Americans. Following from this, the third lesson from these data confirm what was stated above: African-American homebuyers are still largely confining their purchases, or are being confined to, the city of Boston. Beyond the city boundaries African-Americans and Hispanics are finding their way into a number of different towns and cities, but they are still mostly buying in those where they already had a presence and they are doing so in a market where European-Americans are heavily underrepresented. Turning now to an analysis of who is buying with whom in terms of income, Tables 15 and 16 show the distribution of European-American buyers in different cities and towns outside Boston categorized in terms of whether they have an above-average share of households or buyers with low and moderate incomes, on the one hand, or very high incomes, on the other hand. The focus here is on European-American buyers alone so as not to confuse an income analysis with the effects of ethnicity, which is correlated with income. Table 15 shows the extent to which people of different incomes are buying in communities that, in 1990, had an above-average share of households with lower-incomes (less than $35,000) or an above-average share of households with very high incomes (more than $74,999). The first thing to note is that 65 communities outside of Boston have an above-average share of households with lower-incomes of them have an above-average share of lower-income households but not an above-average share of very high income households and there are another 18 that have an above-average share of both lowerincome and very high income households. This means that, in 1990, lower-income households were not concentrated in a few communities. Regardless of this, 60% of low- and moderateincome buyers bought homes in the 47 communities that had an above-average share of lowerincome households (and a below-average share of very high income households) in Only 17.98% of low- and moderate-income buyers bought homes in the 56 communities with an above-average share of very high income households. This suggests that low- and moderateincome buyers are not fully able to access all the communities surrounding Boston in the mid- 1990's. Looking at the market from the perspective of very high income buyers, Table 15 shows that almost 60% of very high income buyers bought in the 56 communities with an aboveaverage share of very high income households, while 19.74% of them bought in the 47 communities with an above-average share of lower-income households. Table 16 shows the distribution of European-American buyers of different incomes across communities that either have an above-average share of low- and moderate-income buyers or an above-average share of very high income buyers. The first thing to note is that there is only one community where there is both an above-average share of lower-income buyers and an aboveaverage share of very high income buyers -- Rockport town which is excluded from the table. This suggests that these two income groups are buying in different communities. This is supported by the data in the table: 64.1% of low- and moderate-income buyers are buying in the 50 communities where such buyers have an above-average share of the market, but only just over one-fifth (20.78%) are buying in the 63 communities where very high income European- American buyers have an above-average share of the market. 13
19 Table 15 Concentration of European-American Buyers in Cities and Towns with an Above-Average Number of European-American Households of Different Incomes Cities and Towns Outside Boston, 1993 to 1998 Type of City/Town, based on Low-mod Middle Upper Very high % of European-American Households, 1990 # and % # and % # and % # and % Above-average % of households with incomes < $35,000 24,202 25,262 9,956 11,121 (47 cities and towns) 60.03% 47.47% 34.35% 19.74% Above-average % of households with incomes > $74,999 7,278 14,370 11,242 33,732 (56 cities and towns) 17.98% 26.86% 38.54% 59.41% Mixed 6,567 10,061 5,773 9,173 (18 cities and towns) 16.22% 18.81% 19.79% 16.16% Total European-American Buyers, 1993 to ,330 53,260 29,079 56,657 Low-mod = income of $48,000 or less in 1998 terms Middle = income greater than $48,000 and less than or equal to $72,000 in 1998 terms Upper = income greater than $72,000 and less than or equal to $90,000 in 1998 terms Very high = income greater than $90,000 in 1998 terms Mixed = have an above-average % of lower-income households and an above-average % of higher-income households Source: FFIEC, , Author's calculations; U.S. Census Bureau, 1990 Table 16 Concentration of European-American Buyers in Cities and Towns with an Above-Average Number of European-American Buyers of Different Incomes Cities and Towns Outside Boston, 1993 to 1998 Type of City/Town, based on Low-mod Middle Upper Very high % of European-American Buyers, 1993 to 1998 # and % # and % # and % # and % Above-average % of low- and moderate-income buyers 25,824 27,252 10,584 10,411 (50 cities and towns) 64.10% 51.32% 36.53% 18.47% Above-average % of very high income buyers 8,387 15,604 12,299 37,889 (63 cities and towns) 20.78% 29.23% 42.23% 66.81% Total European-American Buyers, 1993 to ,330 53,260 29,079 56,657 Low-mod = income of $48,000 or less in 1998 terms Middle = income greater than $48,000 and less than or equal to $72,000 in 1998 terms Upper = income greater than $72,000 and less than or equal to $90,000 in 1998 terms Very high = income greater than $90,000 in 1998 terms There is one mixed community, with an above-average % of both low-mod and very high income buyers, Rockport town, which is not included in this table. Source: FFIEC, , Author's calculations; U.S. Census Bureau,
20 Looking at the market from the perspective of very high income buyers, almost two-thirds (66.81%) of very high income buyers are buying in the 63 communities where they have an above average share of the market, while only 18.47% of them are buying in the 50 communities where lower-income European-American buyers have an above-average share of the market. These data show that there is at least some income segregation within the European-American community. Specifically, home buyers with incomes at or below $48,000 are buying in different communities from those with incomes above $90,000. The dissimilarity index analysis that follows in the next section provides more detailed and conclusive evidence as to the extent of income segregation, including its extent among minority groups. Dissimilarity analysis The meaning of dissimilarity and a guide to the tables We now have a picture of who is buying where. The tables that make up this picture suggest both racial and income segregation. This section uses a measure called the dissimilarity index to assess the overall extent of the racial and income segregation in the Boston metropolitan area. The dissimilarity index measures the extent to which the proportions of two groups of homebuyers in any particular area, such as a census tract or town, are different from the proportions of those groups in the metropolitan area as a whole (or in any designated group of census tracts or towns). An index of 100 indicates complete segregation, and and index of zero indicates full integration. The practical interpretation of the index is that it measures the percentage of one of the groups' members that would have to move to a different census tract or town to generate a fully integrated result. For example, an index of 50 between two groups, A and B, indicates that 50% of either group A or group B would have to buy in different census tracts to reduce the index to zero. It is normal to assume that the smaller of the two groups, the minority group, will move because that involves the fewest number of people or households; this does not necessarily have to be the case. Tables 17 through 21 provide a large number of indices comparing different groups of home buyers. Each table follows the same logic: The colum headings list the groups that form the basis of comparison. For example, in Table 17 the first column shows "African-/European-American" which means that the indices that are listed below it are comparisons between these two groups. The inner row headings list the sub-groups within each of the groups in the column headings that form the basis of comparison. Continuing with the African-/European-American example in Table 17, the rows show income-based sub-groups; the first index, 78.08, is the dissimilarity index of low-income African-Americans from low-income European- Americans. The last index in that first column of seven numbers is the index of dissimilarity of all African-Americans from all European-Americans, The outer row headings that appear on some of the tables simply distinguish between different geographical areas. On the city/town analysis Boston does not appear separately in 15
21 these headings but it is included in the Metropolitan Area indices. Census tract analysis Though census tracts often lack social meaning, they are a good starting point for a dissimilarity analysis. Their large number, which in a descriptive analysis is a problem, does not pose any problems in a dissimilarity analysis because such an analysis reduces the data to a single result. In addition, the census tract delineation allows us to disaggregate data for large cities like Boston. Table 17 Home Buyer Race/Ethnicity Segregation Indeces by Census Tract Boston Metropolitan Area, Race/Ethnicity Segregation Indeces Location Applicant income African-/European- Hispanic/European- Asian-/European- American American American Metropolitan low Area moderate middle upper-middle upper very high ALL Outside Boston low moderate middle upper-middle upper very high ALL Boston low moderate middle upper-middle upper very high ALL Source: FFIEC, , Author's Calculations Race/Ethnicity Segregation Indices Boston Metropolitan Area African-/European- Hispanic/European- Asian-/Europeanlow moderate middle upper-middle upper very high 16
22 As shown in Table 17 the dissimilarity indices for the Boston metropolitan area, using census tracts, are for African- and European-Americans and for Hispanic and European- Americans, and for Asian-Americans. In many of the comparisons, lower-income members of one group are more segregated from their lower income European-American counterparts than are higher-income members of the same group from their higher-income European-American counterparts. This is illustrated graphically in the bar chart on Table 17. We see here that the income effect is fairly strict in the case of African- and Asian-Americans -- the bars slope down from left to right, but it is not strict for Hispanics. What the bar chart also makes clear is that only at the very highest income levels, households earning over 1.5 times the median income, do the segregation indices fall below 60 for African-Americans and Hispanics. Table 18 shows the race dissimilarity indices of owner-occupied housing units for the Boston area based on 1990 census data. By comparing these data to those in Table 17 we can come to some tentative conclusions about the trends in segregation. Those who are interested in why the conclusions from such a comparison can only be tentative should read the discussion in the "Definitions and Technical Notes" of this report. Table 18 Owner-Occupied Housing Units and Purchases Race/Ethnicity Segregation Indices by Census Tract Boston Metropolitan Area, 1990 and 1993 to 1998 Race/ethnicity Segregation Indices African-/European- Hispanic/European- Asian-/European- American American American Units, 1990 Purchases Units, 1990 Purchases Units, 1990 Purchases Metropolitan Area Outside Boston Boston Source: U.S. Census Bureau 1990, Author's Calculations The indices show that the current racial distribution of home buying is reproducing a pre-existing pattern. The index for African-Americans is for the metropolitan area as a whole, very close to the home buyer index of For Asian-Americans the index for housing units in 1990 was 47.48, which is very close to the home buyer index of For Hispanics the housing unit index was 51.41, which is lower than the index for home buyers of 64.40, indicating that Hispanic home owners may have become more segregated from European-Americans during the 1990's. This trend for Hispanics is borne out both within Boston and in its surrounding cities and towns: the owner index in 1990 in Boston was 55.8 and the home buyer index is 66.84; outside of Boston the owner index was and the home buyer index is Table 19 shows the extent to which people of different incomes, but of the same race, are buying in different census tracts. Looking only at European-Americans we see that the dissimilarity index for low-income households, those earning less than or equal to 60% ($36,000 in 1998) of 17
23 the metropolitan area's median income, in comparison to upper-income households, those earning more than 150% of the median ($90,000 in 1998), is overall. In the cities and towns outside of Boston the index is This means that the lowest-income European- Americans are as segregated from very high income European-Americans as African- Americans are segregated from European-Americans in the cities and towns outside Boston. In addition, income segregation among European-American home buyers involves far more families. In the 1993 to 1998 period 15,813 European-Americans earning 60% or less than the median income bought homes outside Boston, but only 3,678 African-Americans did so. Using the dissimilarity index as a measure of the percent of people who would have had to have bought a home in a different census tract, over four times as many low income European- Americans would have had to have bought elsewhere to achieve income integration with very high income home buyers than African-Americans would have had to have bought elsewhere to achieve racial integration with European-Americans. Table 19 Income Segregation Indices Location Low/Very High Low/Upper-Middle Moderate/U-M* Moderate/V-H** Metropolitan African-American Area Hispanic European-American Asian-American ALL Outside Boston African-American Hispanic European-American Asian-American ALL Boston African-American Hispanic European-American Asian-American ALL * U-M = Upper-Middle ** V-H = Very High Home Buyer Income Segregation Indices by Census Tract Boston Metropolitan Area, Source: FFIEC, , Author's Calculations Cities and towns analysis Table 20 shows the race dissimilarity indices of home buyers in the towns and cities around Boston, using the town as a unit of analysis. Because there is more than one census tract in each town, it is natural to expect that the dissimilarity indices would be lower when we analyze the data by town. The table shows this to be the case. But it also shows that this dilution effect is slight. Looking only at the towns and cities surrounding Boston the dissimilarity index between African-Americans and European-Americans is 53.34; for Hispanics it is 53.46; and for Asian- Americans it is Looking at the bar showing these data graphically we see that there is a strong income effect for Asian-Americans and Hispanics in their relationship to European- 18
24 Americans: the higher the income of each group the lower the segregation index (the bars in the chart slope downwards from left to right). For African-Americans there is very little income effect except for those with the highest incomes: it is only they who are distinctly less segregated from their European-American counterparts than other African-American buyers. Table 20 Home Buyer Race/Ethnicity Segregation Indeces by City/Town Boston Metropolitan Area, Race/Ethnicity Segregation Indeces Location Applicant African-/ Hispanic-/ Asian-/ income European- European- European- American American American Metropolitan low Area moderate middle upper-middle upper very high ALL Outside Boston low moderate middle upper-middle upper very high ALL Source: FFIEC, , Author's Calculations Race/Segregation Indeces Towns and Cities Outside Boston African-/ Hispanic-/ Asian-/ low moderate middle upper-middle upper very high In sum, the segregation indices show that as minorities move out of the city they are moving disproportionately into some towns and cities, and that 40% to 50% of them would have to 19
25 buy in another city or town to create an integrated pattern of home buying. Comparing these home buyer indices to the indices for owner-occupied housing units in 1990 there is evidence that the cities and towns outside of Boston are becoming more segregated (see Table 21). The most significant increase is for Hispanics for whom the difference between the two indices is over 20 points whether we look at the Metropolitan area as a whole or just the cities and towns surrounding Boston: the index for owner-occupied units in 1990 was for the Metropolitan Area, while the index for home buyers in the 1993 to 1998 period is 57.99; the index for owner-occupied units in 1990 was for the towns and cities surrounding Boston, while the index for home buyers in the 1993 to 1998 period is Table 21 Owner-Occupied Housing Units and Purchases Race/Ethnicity Segregation Indices by City/Town Boston Metropolitan Area, 1990 and 1993 to 1998 Race/ethnicity Segregation Indices African-/European- Hispanic/European- Asian-/European- American American American Units, 1990 Purchases Units, 1990 Purchases Units, 1990 Purchases Metropolitan Area Outside Boston Source: U.S. Census Bureau, 1990, Author's Calculations Table 22 shows the income dissimilarity indices of home buyers in the towns and cities around Boston, using the town or city as a unit of analysis. As is the case in the census tract analysis, these data show that even when you look at the data by city and town the lowest-income European-Americans are almost as segregated from their very high income counterparts (index of 48.26) as are African-American buyers from European-American buyers (index 53.34). And, again, achieving income integration throughout cities and towns in the metropolitan area involves far more families than does achieving racial integration. 20
26 Table 22 Home Buyer Income Segregation Indices by City and Town Boston Metropolitan Area, Income Segregation Indeces Location Low/Very High Low/Upper-Middle Moderate/U-M* Moderate/V-H** Metropolitan African-American Area Hispanic European-American Asian-American ALL Outside Boston African-American Hispanic European-American Asian-American ALL * U-M = Upper-Middle ** V-H = Very High Source: FFIEC, , Author's Calculations Conclusion This report has shown a disturbing pattern of home buying in the Boston metropolitan area. African-American and Hispanic home buyers are purchasing homes in a limited number of communities as they begin to gain a foothold in the housing market outside the city of Boston. This is despite the fact that they are still few in numbers. The city of Boston is itself highly segregated, and this report shows that this pattern of segregation is replicating itself across the cities and towns outside its boundaries. In addition, this report has shown that families of different incomes are buying in different communities, and that this phenomenon involves far more families than does racial and ethnic segregation. The consequences of these patterns are that the metropolitan area will remain a patchwork of "have" and "have not" communities that are also divided along the lines of race and ethnicity. These community divisions coincide with educational opportunities, because almost every city and town has its own school district. An immediate concern is that if this pattern of buying continues we will see the development of highly segregated schools, with the dire consequences for the educational opportunity of minority and low-income students that we know such segregation generates. For example, Chelsea's schools are currently over 65% Hispanic, Randolph's schools are 29% African-American and Lynn's schools are 25.3% Hispanic and 15.3% African-American. Further cause for concern is that these data only reflect the distribution of home buyers. We must wait until the 2000 census provides us with an accurate enumeration of renters and their location, but it is very likely that this enumeration will show that the level of segregation of families of different races, ethnicities and incomes is much worse than this report shows. 21
27 More optimistically, this report shows that minorities are beginning to buy homes outside of Boston and that many once-exclusive communities are welcoming a few of them into their midst. Minority concentration in a few communities and high-income, exclusive communities are not inevitable. An active promotion of integration by the state, local governments and the real estate industry can alter the patterns described in this report. 22
28
The Impact of Drug and Marijuana Arrests Within the Largest Cities of Massachusetts
 The Impact of Drug and Marijuana Arrests Within the Largest Cities of Massachusetts By Jon B. Gettman, Ph.D. Associate Professor, Criminal Justice Shenandoah University jgettman@su.edu January 8, 2018
ASIAN AMERICANS IN METRO BOSTON: Growth, Diversity, and Complexity Prepared for the Metro Boston Equity Initiative of The Harvard Civil Rights Project
 ASIAN AMERICANS IN METRO BOSTON: Growth, Diversity, and Complexity Prepared for the Metro Boston Equity Initiative of The Harvard Civil Rights Project Paul Watanabe, Director, Institute for Asian American
Heading in the Wrong Direction: Growing School Segregation on Long Island
 Heading in the Wrong Direction: Growing School Segregation on Long Island January 2015 Heading in the Wrong Direction: Growing School Segregation on Long Island MAIN FINDINGS Based on 2000 and 2010 Census
Boston s Emerging Ethnic Quilt: A Geographic Perspective. James P. Allen and Eugene Turner. California State University, Northridge.
 Boston s Emerging Ethnic Quilt: A Geographic Perspective by James P. Allen and Eugene Turner Department of Geography California State University, Northridge Notes The 15 full-color maps that are integral
Summary of the U.S. Census Bureau s 2015 County-Level Population and Component Estimates for Massachusetts
 Summary of the U.S. Census Bureau s 2015 County-Level Population and Component Estimates for Massachusetts Prepared by: UMass Donahue Institute Economic and Public Policy Research Population Estimates
The Changing Racial and Ethnic Makeup of New York City Neighborhoods
 The Changing Racial and Ethnic Makeup of New York City Neighborhoods State of the New York City s Property Tax New York City has an extraordinarily diverse population. It is one of the few cities in the
how neighbourhoods are changing A Neighbourhood Change Typology for Eight Canadian Metropolitan Areas,
 how neighbourhoods are changing A Neighbourhood Change Typology for Eight Canadian Metropolitan Areas, 1981 2006 BY Robert Murdie, Richard Maaranen, And Jennifer Logan THE NEIGHBOURHOOD CHANGE RESEARCH
The Last Have Become First Rural and Small Town America Lead the Way on Desegregation. A Research Brief from the Civil Rights Project
 The Last Have Become First Rural and Small Town America Lead the Way on Desegregation A Research Brief from the Civil Rights Project Gary Orfield & Erica Frankenberg January, 2008 1 Back in the early l960s
Working Overtime: Long Commutes and Rent-burden in the Washington Metropolitan Region
 Working Overtime: Long Commutes and Rent-burden in the Washington Metropolitan Region By Kathryn Howell, PhD Research Associate George Mason University School of Public Policy Center for Regional Analysis
Eric S. Belsky & Daniel McCue
 Comeback Cities or the New Melting Pots: Explorations into the Changing Cities in New England Eric S. Belsky & Daniel McCue New England Smart Growth Leadership Forum October 16-17, 2006 Post Conference
Mortgage Lending and the Residential Segregation of Owners and Renters in Metropolitan America, Samantha Friedman
 Mortgage Lending and the Residential Segregation of Owners and Renters in Metropolitan America, 2000-2010 Samantha Friedman Department of Sociology University at Albany, SUNY Mary J. Fischer Department
Enabling the Asian American Electorate: 2003 Voter Registration in Eleven Massachusetts Cities and Towns
 University of Massachusetts Boston ScholarWorks at UMass Boston Institute for Asian American Studies Publications Institute for Asian American Studies 12-1-2004 Enabling the Asian American Electorate:
University of California Institute for Labor and Employment
 University of California Institute for Labor and Employment The State of California Labor, 2002 (University of California, Multi-Campus Research Unit) Year 2002 Paper Weir Income Polarization and California
IV. Residential Segregation 1
 IV. Residential Segregation 1 Any thorough study of impediments to fair housing choice must include an analysis of where different types of people live. While the description of past and present patterns
Neighborhood Diversity Characteristics in Iowa and their Implications for Home Loans and Business Investment
 Economics Technical Reports and White Papers Economics 9-2008 Neighborhood Diversity Characteristics in Iowa and their Implications for Home Loans and Business Investment Liesl Eathington Iowa State University,
3Demographic Drivers. The State of the Nation s Housing 2007
 3Demographic Drivers The demographic underpinnings of long-run housing demand remain solid. Net household growth should climb from an average 1.26 million annual pace in 1995 25 to 1.46 million in 25 215.
An Equity Assessment of the. St. Louis Region
 An Equity Assessment of the A Snapshot of the Greater St. Louis 15 counties 2.8 million population 19th largest metropolitan region 1.1 million households 1.4 million workforce $132.07 billion economy
USE IN THE BOSTON REGION MPO
 2 LAND USE IN THE BOSTON REGION MPO Existing Land Use in the Boston Region MPO Area Background The Boston Region MPO area is a mature area, with a dense urban core where the majority of jobs and population
Summary of the U.S. Census Bureau s 2016 County-Level Population and Component Estimates for Massachusetts
 Summary of the U.S. Census Bureau s 2016 County-Level Population and Component Estimates for Massachusetts Prepared by: UMass Donahue Institute Economic and Public Policy Research Population Estimates
Gentrification: A Recent History in Metro Denver
 Gentrification: A Recent History in Metro Denver RESEARCH POWERED BY OVERVIEW This report examines the relationship between metro Denver s history of redlining and recent gentrification trends in the region
Institute for Public Policy and Economic Analysis
 Institute for Public Policy and Economic Analysis The Institute for Public Policy and Economic Analysis at Eastern Washington University will convey university expertise and sponsor research in social,
JOINT CENTER FOR HOUSING STUDIES OF HARVARD UNIVERSITY
 JOINT CENTER FOR HOUSING STUDIES OF HARVARD UNIVERSITY The Anatomy of the Low-Income Homeownership Boom in the 1990s Mark Duda and Eric S. Belsky LIHO.01-1 July 2001 Low-Income Homeownership Working Paper
OFFICE OF THE CONTROLLER. City Services Auditor 2005 Taxi Commission Survey Report
 OFFICE OF THE CONTROLLER City Services Auditor 2005 Taxi Commission Survey Report February 7, 2006 TABLE OF CONTENTS INTRODUCTION 3 SURVEY DATA ANALYSIS 5 I. The Survey Respondents 5 II. The Reasonableness
Integrating Latino Immigrants in New Rural Destinations. Movement to Rural Areas
 ISSUE BRIEF T I M E L Y I N F O R M A T I O N F R O M M A T H E M A T I C A Mathematica strives to improve public well-being by bringing the highest standards of quality, objectivity, and excellence to
Racial Inequities in the Washington, DC, Region
 W A S H I N G T O N A R E A R E S E A R C H I N I T I A T V E Racial Inequities in the Washington, DC, Region 2011 15 Leah Hendey December 2017 The Washington, DC, region is increasingly diverse and prosperous,
Socio-Economic Mobility Among Foreign-Born Latin American and Caribbean Nationalities in New York City,
 Socio-Economic Mobility Among Foreign-Born Latin American and Caribbean Nationalities in New York City, 2000-2006 Center for Latin American, Caribbean & Latino Studies Graduate Center City University of
Far From the Commonwealth: A Report on Low- Income Asian Americans in Massachusetts
 University of Massachusetts Boston ScholarWorks at UMass Boston Institute for Asian American Studies Publications Institute for Asian American Studies 1-1-2007 Far From the Commonwealth: A Report on Low-
Where Do We Belong? Fixing America s Broken Housing System
 Where Do We Belong? Fixing America s Broken Housing System PRESENTER: john a. powell Director, Haas Institute DATE: 10/5/2016 Housing in America Nearly ten years after the foreclosure crisis, we have a
The Quarterly Review of Economic News & Insight. Economic Currents. Economic Indices for Massachusetts. Population Change, Housing, and Local Finance
 The Quarterly Review of Economic News & Insight summer 2003 Volume six Issue 2 Economic Currents Economic Indices for Massachusetts Population Change, Housing, and Local Finance The Biotech Industry: A
The Rise and Decline of the American Ghetto
 David M. Cutler, Edward L. Glaeser, Jacob L. Vigdor September 11, 2009 Outline Introduction Measuring Segregation Past Century Birth (through 1940) Expansion (1940-1970) Decline (since 1970) Across Cities
Immigrants and the Restructuring of the Boston Metropolitan Workforce,
 Institute for Immigration Research Immigrants and the Restructuring of the Boston Metropolitan Workforce, 1970-2010 Erin M. Stephens, Justin P. Lowry and James C. Witte JUNE 2015 1 Immigrants and the Restructuring
Economic Segregation in the Housing Market: Examining the Effects of the Mount Laurel Decision in New Jersey
 Economic Segregation in the Housing Market: Examining the Effects of the Mount Laurel Decision in New Jersey Jacqueline Hall The College of New Jersey April 25, 2003 I. Introduction Housing policy in the
Latinos in Massachusetts Selected Areas: Framingham
 University of Massachusetts Boston ScholarWorks at UMass Boston Gastón Institute Publications Gastón Institute for Latino Community Development and Public Policy Publications 9-17-2010 Latinos in Massachusetts
REGENERATION AND INEQUALITY IN AMERICA S LEGACY CITIES
 REGENERATION AND INEQUALITY IN AMERICA S LEGACY CITIES Alan Mallach, Senior Fellow Center for Community Progress Washington, DC amallach@communityprogress.net Setting the stage A dramatic reversal of long-term
Exclusionary Zoning and Racial and Economic Segregation in New Jersey. Adam Gordon Staff Attorney Fair Share Housing Center October 2014
 Exclusionary Zoning and Racial and Economic Segregation in New Jersey Adam Gordon Staff Attorney Fair Share Housing Center October 2014 Overall Racial Segregation Source: Urban Institute Analysis of 1970-2010
Minority Suburbanization and Racial Change
 University of Minnesota Law School Scholarship Repository Studies Institute on Metropolitan Opportunity 2006 Minority Suburbanization and Racial Change Institute on Metropolitan Opportunity University
Joint Center for Housing Studies Harvard University
 Joint Center for Housing Studies Harvard University New Americans, New Homeowners: The Role and Relevance of Foreign-Born First-Time Homebuyers in the U.S. Housing Market Rachel Bogardus Drew N02-2 August
Race, Ethnicity, and Economic Outcomes in New Mexico
 Race, Ethnicity, and Economic Outcomes in New Mexico Race, Ethnicity, and Economic Outcomes in New Mexico New Mexico Fiscal Policy Project A program of New Mexico Voices for Children May 2011 The New Mexico
Residential segregation and socioeconomic outcomes When did ghettos go bad?
 Economics Letters 69 (2000) 239 243 www.elsevier.com/ locate/ econbase Residential segregation and socioeconomic outcomes When did ghettos go bad? * William J. Collins, Robert A. Margo Vanderbilt University
DOING GOOD AND DOING WELL: WHY EQUITY MATTERS FOR SUSTAINING PROSPERITY IN A CHANGING AMERICA
 DOING GOOD AND DOING WELL: WHY EQUITY MATTERS FOR SUSTAINING PROSPERITY IN A CHANGING AMERICA 11/13 MANUEL PASTOR @Prof_MPastor 1 2 U.S. Change in Youth (
We could write hundreds of pages on the history of how we found ourselves in the crisis that we see today. In this section, we highlight some key
 We could write hundreds of pages on the history of how we found ourselves in the crisis that we see today. In this section, we highlight some key events that illustrate the systemic nature of the problem
Racial Inequities in Fairfax County
 W A S H I N G T O N A R E A R E S E A R C H I N I T I A T I V E Racial Inequities in Fairfax County Leah Hendey and Lily Posey December 2017 Fairfax County, Virginia, is an affluent jurisdiction, with
Community Health Needs Assessment 2018
 Massachusetts Massachusetts Community Health Needs Assessment 218 Summary of Demographics and Social Determinants of Health The total population count of MAH's primary service area is estimated at 351,764.
Report. Poverty and Economic Insecurity: Views from City Hall. Phyllis Furdell Michael Perry Tresa Undem. on The State of America s Cities
 Research on The State of America s Cities Poverty and Economic Insecurity: Views from City Hall Phyllis Furdell Michael Perry Tresa Undem For information on these and other research publications, contact:
Population Vitality Overview
 8 Population Vitality Overview Population Vitality Overview The Population Vitality section covers information on total population, migration, age, household size, and race. In particular, the Population
Part 1: Focus on Income. Inequality. EMBARGOED until 5/28/14. indicator definitions and Rankings
 Part 1: Focus on Income indicator definitions and Rankings Inequality STATE OF NEW YORK CITY S HOUSING & NEIGHBORHOODS IN 2013 7 Focus on Income Inequality New York City has seen rising levels of income
THE COLOR OF ENTREPRENEURSHIP Why the Racial Gap among Firms Costs the U.S. Billions
 APRIL 2016 Why the Racial Gap among Firms Costs the U.S. Billions BY ALGERNON AUSTIN Businesses owned by people of color are playing an important part in restoring the health of the American economy after
Regional Total Population: 2,780,873. Regional Low Income Population: 642,140. Regional Nonwhite Population: 1,166,442
 BALTIMORE REGION Neighborhood change in Baltimore is marked by a major city suburban divide, reflecting its long and troubled history of racial segregation. In the suburbs, only about one in six residents
South Salt Lake: Fair Housing Equity Assessment
 South Salt Lake: Fair Housing Equity Assessment Prepared by Bureau of Economic and Business Research David Eccles School of Business University of Utah James Wood John Downen DJ Benway Darius Li April
SURVEY OF GREATER BOSTON AREA COURT PROCEDURES FOR CRIMINAL RECORD SEALING
 SURVEY OF GREATER BOSTON AREA COURT PROCEDURES FOR CRIMINAL RECORD SEALING Updated October 22, 2013 Background Section 100C of Chapter 276 provides for automatic sealing of criminal cases that end in a
SECTION TWO: REGIONAL POVERTY TRENDS
 SECTION TWO: REGIONAL POVERTY TRENDS Metropolitan Council Choice, Place and Opportunity: An Equity Assessment of the Twin Cities Region Section 2 The changing face of poverty Ebbs and flows in the performance
COMPARATIVE ANALYSIS OF NEIGHBORHOOD CONTEXTS: ANNIE E. CASEY FOUNDATION CITIES
 ANNIE E. CASEY FOUNDATION MAKING CONNECTIONS INITIATIVE COMPARATIVE ANALYSIS OF NEIGHBORHOOD CONTEXTS: ANNIE E. CASEY FOUNDATION CITIES G. Thomas Kingsley and Kathryn L.S. Pettit December 2003 THE URBAN
The Misunderstood Consequences of Shelley v. Kraemer Extended Abstract
 The Misunderstood Consequences of Shelley v. Kraemer Extended Abstract Yana Kucheva Department of Sociology, University of California Los Angeles California Center for Population Research Richard Sander
Patterns of Housing Voucher Use Revisited: Segregation and Section 8 Using Updated Data and More Precise Comparison Groups, 2013
 Patterns of Housing Voucher Use Revisited: Segregation and Section 8 Using Updated Data and More Precise Comparison Groups, 2013 Molly W. Metzger, Assistant Professor, Washington University in St. Louis
Chapter 1: The Demographics of McLennan County
 Chapter 1: The Demographics of McLennan County General Population Since 2000, the Texas population has grown by more than 2.7 million residents (approximately 15%), bringing the total population of the
Midvale: Fair Housing Equity Assessment
 Midvale: Fair Housing Equity Assessment Prepared by Bureau of Economic and Business Research David Eccles School of Business University of Utah James Wood John Downen DJ Benway Darius Li April 2013 [DRAFT]
City of Hammond Indiana DRAFT Fair Housing Assessment 07. Disparities in Access to Opportunity
 ANALYSIS EDUCATIONAL OPPORTUNITIES i. Describe any disparities in access to proficient schools based on race/ethnicity, national origin, and family status. ii. iii. Describe the relationship between the
THE DIFFERENTIAL IMPACT OF GENTRIFICATION ON COMMUNITIES IN CHICAGO
 THE DIFFERENTIAL IMPACT OF GENTRIFICATION ON COMMUNITIES IN CHICAGO By Philip Nyden, Emily Edlynn, and Julie Davis Center for Urban Research and Learning Loyola University Chicago Executive Summary The
The problem of growing inequality in Canadian. Divisions and Disparities: Socio-Spatial Income Polarization in Greater Vancouver,
 Divisions and Disparities: Socio-Spatial Income Polarization in Greater Vancouver, 1970-2005 By David F. Ley and Nicholas A. Lynch Department of Geography, University of British Columbia The problem of
The Effect of the Mount Laurel Decision on Segregation by Race, Income and Poverty Status. Damiano Sasso College of New Jersey April 20, 2004
 The Effect of the Mount Laurel Decision on Segregation by Race, Income and Poverty Status Damiano Sasso College of April 2, 24 I. Introduction Few aspects of life are more important to citizens than housing.
Patterns of Housing Voucher Use Revisited: Segregation and Section 8 Using Updated Data and More Precise Comparison Groups, 2013
 Patterns of Housing Voucher Use Revisited: Segregation and Section 8 Using Updated Data and More Precise Comparison Groups, 2013 Molly W. Metzger Center for Social Development Danilo Pelletiere U.S. Department
THE FORGOTTEN HISTORY OF HOW GOVERNMENT SEGREGATED
 TEXAS HOUSERS texashousers.net 2/13/19 THE FORGOTTEN HISTORY OF HOW GOVERNMENT SEGREGATED & HOUSTON HOW THIS IS MAINTAINED TODAY 3Segregated Houston FOR MORE INFORMATION The information shown here is
CAMPAIGN FINANCE GUIDE
 CAMPAIGN FINANCE GUIDE Candidates for Municipal Office (Non-Depository) Office of Campaign and Political Finance Commonwealth of Massachusetts Revised 3/18 T his brochure is designed to introduce non-depository
Joint Center for Housing Studies Harvard University
 Joint Center for Housing Studies Harvard University Comeback Cities or the New Melting Pots: Explorations into the Changing Large Cities of New England Eric S. Belsky and Daniel McCue December 2006 W06-7
OLDER INDUSTRIAL CITIES
 Renewing America s economic promise through OLDER INDUSTRIAL CITIES Executive Summary Alan Berube and Cecile Murray April 2018 BROOKINGS METROPOLITAN POLICY PROGRAM 1 Executive Summary America s older
Racial Inequities in Montgomery County
 W A S H I N G T O N A R E A R E S E A R C H I N I T I A T I V E Racial Inequities in Montgomery County Leah Hendey and Lily Posey December 2017 Montgomery County, Maryland, faces a challenge in overcoming
8AMBER WAVES VOLUME 2 ISSUE 3
 8AMBER WAVES VOLUME 2 ISSUE 3 F E A T U R E William Kandel, USDA/ERS ECONOMIC RESEARCH SERVICE/USDA Rural s Employment and Residential Trends William Kandel wkandel@ers.usda.gov Constance Newman cnewman@ers.usda.gov
Racial Equity and Opportunity in Metro Boston Job Markets
 Racial Equity and Opportunity in Metro Boston Job Markets By Nancy McArdle December 2004 Metro Boston Equity Initiative The Civil Rights Project at Harvard University Racial Equity and Opportunity in Metro
LEFT BEHIND: WORKERS AND THEIR FAMILIES IN A CHANGING LOS ANGELES. Revised September 27, A Publication of the California Budget Project
 S P E C I A L R E P O R T LEFT BEHIND: WORKERS AND THEIR FAMILIES IN A CHANGING LOS ANGELES Revised September 27, 2006 A Publication of the Budget Project Acknowledgments Alissa Anderson Garcia prepared
MWRA Board of Directors Meeting July 17, 2013 Voting Summary Sheet
 MWRA Board of Directors Meeting July 17, 2013 Voting Summary Sheet Item Name Type Notes Vote Approval of Minutes n/a n/a Unanimous Discussion Highlights Attachments Report of the Chair n/a n/a n/a * Report
The Brookings Institution Metropolitan Policy Program Bruce Katz, Director
 The Brookings Institution Metropolitan Policy Program Bruce Katz, Director State of the World s Cities: The American Experience Delivering Sustainable Communities Summit February 1st, 2005 State of the
The Latino Population of the New York Metropolitan Area,
 The Latino Population of the New York Metropolitan Area, 2000 2008 Center for Latin American, Caribbean & Latino Studies Graduate Center City University of New York 365 Fifth Avenue Room 5419 New York,
The Brookings Institution Metropolitan Policy Program Robert Puentes, Fellow
 The Brookings Institution Metropolitan Policy Program Robert Puentes, Fellow Good News and Bad News: Westchester County and America s First Suburbs Not-For-Profit Leadership Summit IV Rye, NY May 15, 2006
The Racial Dimension of New York s Income Inequality
 The Racial Dimension of New York s Income Inequality Data Brief, March 2017 It is well-known that New York State has one of the highest degrees of income inequality among all fifty states, and that the
Brockton and Abington
 s in Massachusetts Selected Areas Brockton and Abington by Phillip Granberry, PhD and Sarah Rustan September 17, 2010 INTRODUCTION This report provides a descriptive snapshot of selected economic, social,
Riverside Labor Analysis. November 2018
 November 2018 The City of Labor Market Dynamics and Local Cost of Living Analysis Executive Summary The City of is located in one of the fastest growing parts of California. Over the period 2005-2016,
Race and Economic Opportunity in the United States
 THE EQUALITY OF OPPORTUNITY PROJECT Race and Economic Opportunity in the United States Raj Chetty and Nathaniel Hendren Racial disparities in income and other outcomes are among the most visible and persistent
Housing Policy Report Of the Twin Cities Fully Developed Suburbs and School Districts
 Housing Policy Report Of the Twin Cities Fully Developed Suburbs and School Districts Presentation to the Community Development Committee of the Metropolitan Council July 15, 2013 Section I - Overview
Understanding Residential Patterns in Multiethnic Cities and Suburbs in U.S. and Canada*
 Understanding Residential Patterns in Multiethnic Cities and Suburbs in U.S. and Canada* Lingxin Hao John Hopkins University 3400 N. Charles Street Baltimore, MD 21218 (Tel) 410-516-4022 Email: hao@jhu.edu
Segregation in Motion: Dynamic and Static Views of Segregation among Recent Movers. Victoria Pevarnik. John Hipp
 Segregation in Motion: Dynamic and Static Views of Segregation among Recent Movers Victoria Pevarnik John Hipp March 31, 2012 SEGREGATION IN MOTION 1 ABSTRACT This study utilizes a novel approach to study
Gentrification: Deliberate Displacement, or Natural Social Movement?
 Gentrification: Deliberate Displacement, or Natural Social Movement? I. Introduction Gentrification is the process of physically renovating the housing and retail in a neighborhood in order to increase
Housing and Neighborhood Preferences of African Americans on Long Island
 Housing and Neighborhood Preferences of African Americans on Long Island 2012 Survey Research Report A Report From Table of Contents Executive Summary -Summary of Significant Findings -Key Findings 1-4
VULNERABILITY INEQUALITY. Impacts of Segregation and Exclusionary Practices. Shannon Van Zandt, Ph.D., AICP
 VULNERABILITY AND INEQUALITY Impacts of Segregation and Exclusionary Practices Shannon Van Zandt, Ph.D., AICP Roy L. Dockery Professor of Housing and Homelessness Interim Director, Center for Housing &
We know that the Latinx community still faces many challenges, in particular the unresolved immigration status of so many in our community.
 1 Ten years ago United Way issued a groundbreaking report on the state of the growing Latinx Community in Dane County. At that time Latinos were the fastest growing racial/ethnic group not only in Dane
A PATHWAY TO THE MIDDLE CLASS: MIGRATION AND DEMOGRAPHIC CHANGE IN PRINCE GEORGE S COUNTY
 A PATHWAY TO THE MIDDLE CLASS: MIGRATION AND DEMOGRAPHIC CHANGE IN PRINCE GEORGE S COUNTY Brooke DeRenzis and Alice M. Rivlin The Brookings Greater Washington Research Program April 2007 ACKNOWLEDGEMENTS
Characteristics of Poverty in Minnesota
 Characteristics of Poverty in Minnesota by Dennis A. Ahlburg P overty and rising inequality have often been seen as the necessary price of increased economic efficiency. In this view, a certain amount
Between 1990 and 2000, the rate of
 Has The Homeownership Rate Been Inflated? The Effect Of Falling Household Formation Between 199 and 2, the rate of homeownership in the U.S. rose from 64.2 percent to a record high of 66.2 percent (Simmons
! # % & ( ) ) ) ) ) +,. / 0 1 # ) 2 3 % ( &4& 58 9 : ) & ;; &4& ;;8;
 ) ) ) ) +,. / 0 1 # ) 2 3 % ( &4& 58 9 : ) & ;; &4& ;;8;") ! # % & ( ) ) ) ) ) +,. / 0 # ) % ( && : ) & ;; && ;;; < The Changing Geography of Voting Conservative in Great Britain: is it all to do with Inequality? Journal: Manuscript ID Draft Manuscript Type: Commentary
! # % & ( ) ) ) ) ) +,. / 0 # ) % ( && : ) & ;; && ;;; < The Changing Geography of Voting Conservative in Great Britain: is it all to do with Inequality? Journal: Manuscript ID Draft Manuscript Type: Commentary
Chapter 5. Residential Mobility in the United States and the Great Recession: A Shift to Local Moves
 Chapter 5 Residential Mobility in the United States and the Great Recession: A Shift to Local Moves Michael A. Stoll A mericans are very mobile. Over the last three decades, the share of Americans who
January 8, Comments on selected civil rights aspects of the FY 2016 draft QAP. Dear Ms. Frawley:
 40 COURT STREET 617-357-0700 PHONE SUITE 800 617-357-0777 FAX BOSTON, MA 02108 WWW.MLRI.ORG January 8, 2016 Rebecca Frawley, Director, Low Income Housing Tax Credit Program Division of Housing Development
Economic Mobility & Housing
 Economic Mobility & Housing State of the Research There is an increasing amount of research examining the role housing, and particularly neighborhoods, have on economic mobility. Much of the existing literature
Building Stronger Communities for Better Health: The Geography of Health Equity
 Building Stronger Communities for Better Health: The Geography of Health Equity Brian D. Smedley, Ph.D. Joint Center for Political and Economic Studies www.jointcenter.org Geography and Health the U.S.
What kinds of residential mobility improve lives? Testimony of James E. Rosenbaum July 15, 2008
 What kinds of residential mobility improve lives? Testimony of James E. Rosenbaum July 15, 2008 Summary 1. Housing projects create concentrated poverty which causes many kinds of harm. 2. Gautreaux shows
REPORT. PR2: Refugee Resettlement Trends in the Northeast. The University of Vermont. Pablo Bose & Lucas Grigri
 The University of Vermont PR2: Refugee Resettlement Trends in the Northeast REPORT Pablo Bose & Lucas Grigri Photo Credit: L. Grigri Published October 15th, 2017 in Burlington, VT Refugee Resettlement
Complaints not really about our methodology
 Page 1 of 6 E-MAIL JS ONLINE TMJ4 WTMJ WKTI CNI LAKE COUNTRY News Articles: Advanced Searches JS Online Features List ON WISCONSIN : JS ONLINE : NEWS : EDITORIALS : E-MAIL PRINT THIS STORY News Wisconsin
The Dynamics of Low Wage Work in Metropolitan America. October 10, For Discussion only
 The Dynamics of Low Wage Work in Metropolitan America October 10, 2008 For Discussion only Joseph Pereira, CUNY Data Service Peter Frase, Center for Urban Research John Mollenkopf, Center for Urban Research
Demographic, Economic, and Social Transformations in Queens Community District 3: East Elmhurst, Jackson Heights, and North Corona,
 Demographic, Economic, and Social Transformations in Queens Community District 3: East Elmhurst, Jackson Heights, and North Corona, 1990-2006 Astrid S. Rodríguez Fellow, Center for Latin American, Caribbean
Unlocking Opportunities in the Poorest Communities: A Policy Brief
 Unlocking Opportunities in the Poorest Communities: A Policy Brief By: Dorian T. Warren, Chirag Mehta, Steve Savner Updated February 2016 UNLOCKING OPPORTUNITY IN THE POOREST COMMUNITIES Imagine a 21st-century
Demographic, Economic and Social Transformations in Bronx Community District 4: High Bridge, Concourse and Mount Eden,
 Center for Latin American, Caribbean & Latino Studies Graduate Center City University of New York 365 Fifth Avenue Room 5419 New York, New York 10016 Demographic, Economic and Social Transformations in
Antoine Paccoud Migrant trajectories in London - spreading wings or facing displacement?
 Antoine Paccoud - spreading wings or facing displacement? Book section Original citation: Originally published in Paccoud, Antoine (2014) - spreading wings or facing displacement? In: Kochan, Ben, (ed.)