Southern California Crime Report
|
|
|
- Nickolas Hawkins
- 5 years ago
- Views:
Transcription
 School of Social Ecology University of California Irvine January,")
1 Southern California Crime Report 2018 Presented by the UCI Irvine Lab for the Study of Space and Crime (ILSSC) School of Social Ecology University of California Irvine January, 2018


2 Southern California Crime Report 2018 Authors: John R. Hipp Charis E. Kubrin Graduate Student Researchers: Christopher J. Bates Christopher Contreras Benjamin Forthun Navjyot Gill Young-An Kim Michelle D. Mioduszewski Hwawon Seo Rylan Simpson Seth Williams ii
3 ABOUT THE IRVINE LAB FOR THE STUDY OF SPACE AND CRIME (ILSSC) The Irvine Laboratory for the Study of Space and Crime (ILSSC) in the Department of Criminology, Law and Society at the University of California, Irvine is dedicated to researching the social ecology of crime at all levels of analysis including street segments, blocks, neighborhoods, cities, counties, and metropolitan areas. Together with our collaborators and community partners, our team seeks to generate high quality scientific research on the spacecrime nexus, and to foster intellectual exchange among faculty, graduate students, and undergraduate students at the University of California, Irvine, as well as members of the larger community. The team studies: 1) Foundational issues, including the dynamics of urban crime, the micro-environment of crime, and the role of local institutional resources for fighting crime; 2) Enduring challenges, including inequality, concentrated poverty and concentrated affluence, urban processes such as economic redevelopment and gentrification, and trends in immigration and other demographic population shifts; 3) Contemporary challenges, including the housing crisis and foreclosures, the spatial clustering of multiple social problems, and the continuous cycling of offenders in and out of prison and on and off of supervision. The ILSSC is a subsidiary of the Metropolitan Futures Initiative (MFI). iii
4 Table of Contents Executive Summary... v Chapter 1. Introduction... 1 Methodology... 1 Chapter 2. Violent and property crime... 3 Top 10 cities with cities with highest violent or property crime rates in Top 10 cities with highest violent and property crime rates averaged over Top 10 cities with lowest violent or property crime rates in Top 10 cities with lowest violent and property crime rates averaged over Adjusted Crime rates based on city characteristics Top 10 cities with highest adjusted violent or property crime rates in Top 10 cities with highest adjusted violent and property crime rates averaged over Top 10 cities with lowest adjusted violent or property crime rates in Top 10 cities with lowest adjusted violent and property crime rates averaged over Chapter 3. Change in Violent and Property Crime in last 10 years Top 10 cities with biggest increases in violent crime in last 1, 5, and 10 years Top 10 cities with biggest increases in property crime in last 1, 5, and 10 years Top 10 cities with biggest decreases in violent crime in last 1, 5, and 10 years Top 10 cities with biggest decreases in property crime in last 1, 5, and 10 years Chapter 4. Violent and Property Crime long-term change and projections Changes since 1990 in violent and property crime for U.S. cities Projections of violent and property crime for County-level changes in violent and property crime Appendix Los Angeles County Orange County Riverside County San Bernardino County San Diego County Ventura County iv
5 Executive Summary Cities with the highest violent and property crime rates in 2016 tend to be in the Counties of Los Angeles and San Bernardino. The highest violent crime rate is in Barstow, which has a rate of violence 331% higher than the national average. And, the highest property crime rate is in Commerce, which has 269% more property crimes than a typical U.S. city. Cities with the lowest violent and property crime rates tend to be in counties across the Southern California region. Palos Verdes Estates in Los Angeles County has the lowest violent crime rate, and the City of Imperial has the lowest property crime rate. In the last year, a diverse mix of cities from counties across the Southern California region saw large decreases in violent and property crime rates. The city of Fillmore in Ventura County witnessed the largest decrease in violent crime, while the City of Orange saw the largest decrease in property crime rates. In the last year, Needles experienced the largest increase in crimes against persons, and La Habra Heights experienced the largest increase in crimes against property. However, these seem to be minor blips in crime rates for these particular cities, given that neither is among the top 10 cities with the largest increases in violent and property crime rates over a longer time period, say the last 5 or 10 years. It does not follow that short-term increases in crime are indicative of more long-term trends in crime rates. The largest increases in violent crime in the last 5 years and the last 10 years have overwhelmingly taken place in cities in Los Angeles County, although long-term decreases in violent crime rates are taking root across cities in virtually all counties within the Southern California region. Four of the top 10 cities going through more long-term decreases in violence are in the County of Los Angeles. Still, the city going through the largest decrease in violence in the last 10 years is in Riverside County: Lake Elsinore. Among the cities with more long-term increases in property crime, only six cities (i.e., Murrieta, Commerce, Palmdale, Pomona, El Segundo, and Long Beach) have witnessed the largest increases in property crime in the last 5 years and the last 10 years. It does not follow that sizeable, and more durable, increases in levels of property crime characterize crime trends for the Southern California region as a whole. Although a diverse mix of Southern California cities are undergoing more long-term decreases in in crimes against property, the majority of these cities are from the Inland Empire. Indeed, the city of Lake Elsinore in the County of Riverside has seen the largest decrease in property crime rates over the last 10 years, going from almost 50% above to almost 25% below the national average in property crime. v
6 Our forecast model projects an average decrease in violent crime across cities of 17% in 2018, and 6% for property crime. Our forecast model also projects violence decreasing in 87% of cities in the region, and property crime decreasing in 71% of the cities in the region. vi
7 Chapter 1. Introduction This is the fourth annual Southern California Crime Report (SCCR). In the SCCR, we use data from the FBI s Uniform Crime Reporting (UCR) program to describe the level of crime in cities located in the Southern California region in It is well-known that these data underestimate the actual amount of crime. This occurs because some crime events are not reported by citizens or detected by the police. The crime data can also be inaccurate if the police classify some non-crime events as crimes, or if they code some crime events as non-crimes. Despite these limitations, UCR data is generally recognized as the best data source available for tracking crime trends in U.S. cities. In our report, we examine the six most serious types of crime: homicide; aggravated assault; robbery; burglary; motor vehicle theft; and larceny. 1 For the analysis, we analyzed the level of crime for all cities in the region with a population size of at least 4,000. We use this value given that cities with very small populations can have excessive crime rates even with very few crime events. The Southern California region is an area that includes 196 cities in the following counties: 1) Los Angeles; 2) Orange; 3) Riverside; 4) San Bernardino; 5) San Diego; 6) Ventura; 7) Imperial. The region contains 21.7 million people. We present results for cities with the top 10 levels of each crime type, cities with the bottom 10 levels of each crime type, and the top 10 increases and top 10 decreases in each crime type. The last part of the report presents results for each county one at a time. Methodology Throughout the SCCR, we have standardized crime rates to compare crime rates for cities within the Southern California region to the average level of crime for U.S. cities with a population size above 25,000. We refer to these as standardized crime rates. We first compute crime rates by dividing the number of crimes by the most recent estimate of the population in the city. We standardize this value, and therefore a city that has a crime rate at the average value for the nation will have a standardized crime rate value of 100. Cities with standardized crime rates greater than 100 are cities with crime rates greater than the national average; likewise, cities with standardized crime rates less than 100 are cities with crime rates that are below the average for U.S. cities. For example, a city with a value of 150 for the standardized aggravated assault rate measure has 50% more aggravated assaults than the average U.S. city in that year. And a city with a value of 60 has an aggravated assault rate that is only 60% as large as 1 We do not include rape in the analyses. Definitional differences, as well as policy differences, can lead to differences in the reported level of rapes across cities that do not represent true differences in the level of this type of crime. Other crimes are less dependent on such reporting decisions.
8 that of the national average (or, we might say their aggravated assault rate is 40% less than the average for cities in the U.S.). Violent crime combines aggravated assaults, robberies, and homicides. Property crime combines burglaries, motor vehicle thefts, and larcenies. In several analyses in the report, we computed the crime rate averaged over a 3-year period ( ). This is done to smooth out possible random year-to-year fluctuations in crime that might occur. While some year-to-year changes in crime reflect true change in the city, others can be due to idiosyncratic events in a particular year. These 3-year moving averages adjust for these fluctuations. For computing the change in overall violent or property crime rates, we compute the difference in these standardized crime rates. Like last year s SSCR, we have a section (part of Chapter 2) that adjusts crime rates based on the socio-demographic characteristics of the city. Thus, these rankings adjust the level of crime based on certain demographic characteristics that criminologists are well aware link to levels of crime in cities. These adjusted values show the level of crime beyond what might be expected for a city with the sociodemographic characteristics of the particular city. And, like last year, we have a section that forecasts the expected violent and property crime rate for the cities in Southern California. We used a statistical model that allows us to forecast the level of violent crime and property crime in the Southern California cities next year (2018). Our statistical models take into account the level of crime in these cities over the last 15 years, and how it has been changing, to forecast how much violent and property crime there will be in these cities next year. We assessed the quality of our model using crime data from 1970 to 2010, and found that the average correlation between our projection of the property crime rate and the actual property crime rate was.89 over these prior years. The average correlation of our violent crime projection with the actual level was.95 over these prior years. Thus, our model appears to do a reasonable job projecting crime levels forward in time. Nonetheless, we caution the reader that the forecasts for individual cities are simply predictions and estimates. 2
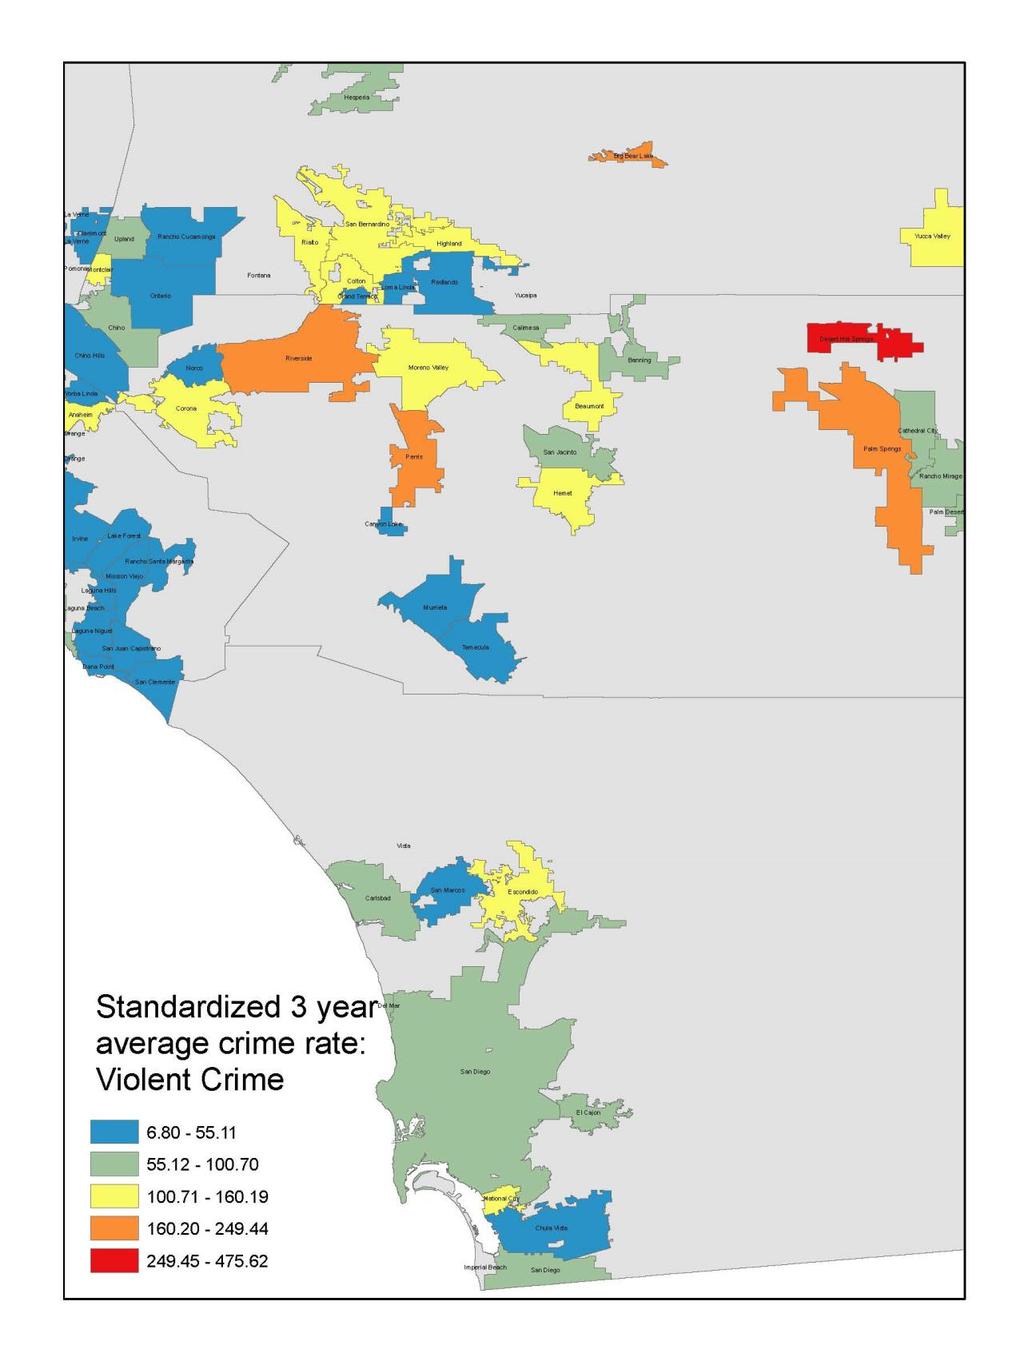
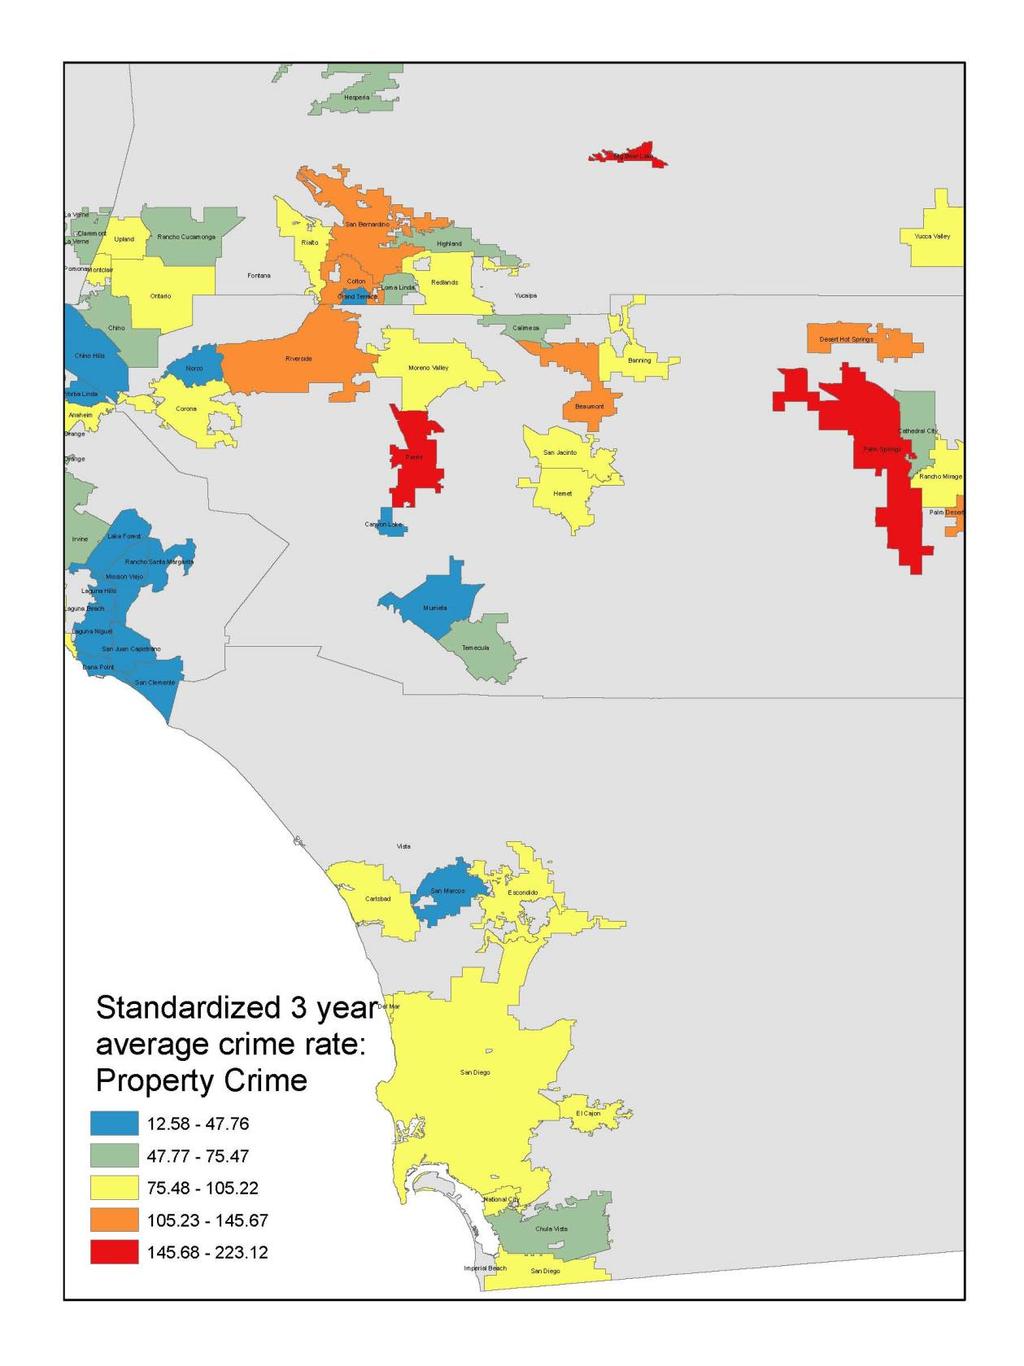
9 Chapter 2. Violent and property crime Top 10 cities with cities with highest violent or property crime rates in 2016 In 2016, the highest violent crime rate was in Barstow. The standardized violent crime rate of 431 indicates that whereas a typical U.S. city had a violent crime rate of 100, Barstow s rate was 331% higher than the average level of violence nationally ( = 331). San Bernardino has the second highest violent crime rate, 278% higher than the average U.S. city. Nine of the ten top violent cities in the Southern California region are either in Los Angeles or San Bernardino County. None of the top ten violent cities are located in Orange County, Imperial County, or Ventura County. In the tables we display the population of each city to give a sense of the city size. Commerce has the highest property crime rate in 2016, with 269% more property crime than a typical U.S. city. The cities with the highest property crime rates come from four of the six counties in the region. Three cities appear in the top 10 list for both violent and property crime: Barstow, Commerce, and West Hollywood. Below we present maps showing which cities have the highest or lowest standardized violent or property crime rates (averaged from ). In these maps, the cities with the highest crime rates are shown in red, the second highest are in orange, the third highest are in yellow, those with the second lowest are shown in green, and those with the lowest are shown in blue. 3
10 Top 10 cities with highest violent crime rate, 2016 City County Violent crime Population 1 BARSTOW San Bernardino SAN BERNARDINO San Bernardino COMPTON Los Angeles COMMERCE Los Angeles NEEDLES San Bernardino ADELANTO San Bernardino DESERT HOT SPRINGS Riverside HUNTINGTON PARK Los Angeles WEST HOLLYWOOD Los Angeles INGLEWOOD Los Angeles Top 10 cities with highest property crime rate, 2016 City County Property crime Population 1 COMMERCE Los Angeles SIGNAL HILL Los Angeles SANTE FE SPRINGS Los Angeles PALM SPRINGS Riverside EL CENTRO Imperial CULVER CITY Los Angeles BARSTOW San Bernardino CERRITOS Los Angeles MONTCLAIR San Bernardino WEST HOLLYWOOD Los Angeles
11 Top 10 cities with highest violent and property crime rates averaged over These lists show the cities with the highest crime rates, averaged over the last three years ( ). This takes into account unusual yearly fluctuations. This list shows that Compton has the highest violent crime rate, with 408% more violent crime events than the typical U.S. city over the last three years. Murrieta has the highest average property crime rate over the last three years (nearly 550% more property crime than the average city in the nation), as well as one of the higher violent crime rates. Top 10 cities with highest violent crime rate (based on average over ) City County Violent crime Population 1 COMMERCE Los Angeles SAN BERNARDINO San Bernardino COMPTON Los Angeles NEEDLES San Bernardino GARDENA Los Angeles LONG BEACH Los Angeles PALMDALE Los Angeles WEST HOLLYWOOD Los Angeles NATIONAL CITY San Diego ADELANTO San Bernardino Top 10 cities with highest property crime rate (based on average over ) City County Property crime Population 1 COMMERCE Los Angeles CERRITOS Los Angeles PERRIS Riverside SAN BERNARDINO San Bernardino SANTE FE SPRINGS Los Angeles MONTCLAIR San Bernardino CALEXICO Imperial EL CENTRO Imperial PALM SPRINGS Riverside SIGNAL HILL Los Angeles
12 Figure 1. Average adjusted violent crime rate ( ) for Southern California cities 6
13 7
14 Top 10 cities with lowest violent or property crime rates in 2016 These lists show the 10 cities with the lowest violent or property crime in Palos Verdes Estates in Los Angeles County has the lowest violent crime rate (just 8.3% as high as the average city in the nation). Other Los Angeles County cities also have very low violent crime rates: Calabasas, Ranchos Palos Verdes, and La Canada Flintridge. Several Orange County cities have very low violent crime rates, as well: Irvine, Aliso Viejo, Yorba Linda, and Villa Park. Imperial has the lowest property crime rate in Like Imperial, several cities are among the lowest in both violent and property crime: Palos Verdes Estates, Aliso Viejo, and Rancho Palos Verdes. Irvine is the only city with more than 200,000 population on these lists. Top 10 cities with lowest violent crime rate, 2016 City County Violent crime Population 1 PALOS VERDES ESTATES Los Angeles IMPERIAL Imperial MURRIETA Riverside IRVINE Orange ALISO VIEJO Orange YORBA LINDA Orange CALABASAS Los Angeles RANCHO PALOS VERDES Los Angeles LA CANADA FLINTRIDGE Los Angeles VILLA PARK Orange Top 10 cities with lowest property crime rate, 2016 City County Property crime Population 1 IMPERIAL Imperial RANCHO SANTA MARGARITA Orange FILLMORE Ventura PALOS VERDES ESTATES Los Angeles ALISO VIEJO Orange MOORPARK Ventura OJAI Ventura LAKE FOREST Orange POWAY San Diego RANCHO PALOS VERDES Los Angeles
15 Top 10 cities with lowest violent and property crime rates averaged over These lists show the cities with the lowest violent and property crime rates averaged over the last three years. Aliso Viejo in Orange County has the lowest violent crime rate. The city of Rancho Santa Margarita has the lowest property crime rate over the last three years. Four cities are among the lowest in both violent and property crime: Aliso Viejo, Calabasas, Chino Hills, and Rancho Santa Margarita. Irvine is the largest city on these lists and the only one with more than 200,000 population. Top 10 cities with lowest violent crime rate (based on average over ) City County Violent crime Population 1 MURRIETA Riverside ALISO VIEJO Orange YORBA LINDA Orange SAN MARINO Los Angeles VILLA PARK Orange RANCHO PALOS VERDES Los Angeles IRVINE Orange LA CANADA FLINTRIDGE Los Angeles PALOS VERDES ESTATES Los Angeles CHINO HILLS San Bernardino Top 10 cities with lowest property crime rate (based on average over ) City County Property crime Population 1 RANCHO SANTA MARGARITA Orange ALISO VIEJO Orange CALABASAS Los Angeles RANCHO PALOS VERDES Los Angeles SAN MARCOS San Diego YORBA LINDA Orange THOUSAND OAKS Ventura SAN CLEMENTE Orange POWAY San Diego VILLA PARK Orange

16 Figure 2. Average adjusted property crime rate ( ) for Southern California cities 10
17 11
18 Adjusted Crime rates based on city characteristics In this section we adjust these crime rates for the characteristics of the city. Criminologists are well-aware that cities with certain characteristics typically have higher rates of crime. For example, cities with high levels of poverty tend to have higher rates of crime. Therefore, in this section we adjust the level of crime in the city for a number of these characteristics. Specifically, we adjust for the following city-level characteristics: 1) percent aged 16 to 29 (the most crime-prone population); 2) racial/ethnic composition (percent Asian, percent black, percent Latino, and the level of racial/ethnic heterogeneity); 3) percent immigrants; 4) average household income; 5) level of income inequality; 6) unemployment rate; 7) percent aged 16 to 19 who are drop outs from school; 8) residential stability (the average length of residence for renters, and for owners); 9) percent vacant units; 10) ratio of adults to children (a measure of social control); 11) population density of the city; 12) population of the city; 13) average age of the housing stock. We are therefore adjusting the level of crime for these factors; this is somewhat analogous to adjusting school performance scores based on the demographic composition of the school. Thus, a city that is particularly advantaged based on these demographic characteristics, and yet has an average level of crime, would actually have a relatively high adjusted level of crime, given that the level of crime is higher than would be expected based on the city s demographic characteristics. So we might refer to this as the unexpected level of crime. That is, these are cities that have either much higher levels of violent or property crime than we might have expected based on their sociodemographic characteristics, or much lower levels of violent or property crime than expected. Why cities might differ from what is expected could be due to many different reasons. We are not able to determine why these cities differ from expectations. Top 10 cities with highest adjusted violent or property crime rates in 2016 There are notable differences between the list in this section and the earlier ones that did not adjust for the city characteristics. On the one hand, we earlier saw that San Bernardino has the second highest violent crime rate in the region. Yet, this list shows that when we adjust for the sociodemographic characteristics of San Bernardino that make it more vulnerable to violence, it in fact is not among the ten highest violent crime cities in the region. On the other hand, Barstow, which has the highest violent crime rate, is still among the highest violent crime cities even after taking into account the city s characteristics. The relatively affluent beach cities of Laguna Beach, Malibu, Hermosa Beach, and Del Mar have relatively high adjusted violent crime rates compared to what we would expect given the characteristics of these cities. 12
19 For property crime, we find similar patterns. Whereas El Centro has the fifth highest unadjusted property crime rate in the region, its level of property crime ranks as the highest in the region after adjusting for the city s socio-demographic characteristics. The relatively advantaged cities of Hermosa Beach and Del Mar have relatively high property crime rates after adjusting for city characteristics. Top 10 cities with highest adjusted violent crime rate in 2016 City County Adjusted violent crime Population 1 LAGUNA BEACH Orange BARSTOW San Bernardino ARTESIA Los Angeles MALIBU Los Angeles WESTLAKE VILLAGE Los Angeles LA PALMA Orange BREA Orange HAWAIIAN GARDENS Los Angeles YUCCA VALLEY San Bernardino ROLLING HILLS ESTATES Los Angeles Top 10 cities with highest adjusted property crime rate in 2016 City County Adjusted property crime Population 1 EL CENTRO Imperial OXNARD Ventura DEL MAR San Diego BARSTOW San Bernardino VENTURA Ventura COACHELLA Riverside WESTLAKE VILLAGE Los Angeles CALEXICO Imperial REDLANDS San Bernardino BREA Orange
20 Top 10 cities with highest adjusted violent and property crime rates averaged over When assessing the cities with the highest average crime rates over the last 3 years, we see that only two of the top ten cities from the unadjusted list appear on this list. After adjusting for the city composition, Murrieta and Hawaiian Gardens are still among the highest violent crime cities over the last three years. Based on these adjusted rates, relatively advantaged cities such as Rolling Hills Estates and Beverly Hills have the highest unexpected average violent crime rates over the last three years. Beach communities such as Oceanside and Laguna Beach also appear on this list. We see many of the same cities with the highest adjusted property crime rates, including Murrieta, Banning, and Beverly Hills. And, cities such as Commerce and San Bernardino, which ranked among the highest cities in the unadjusted property crime 3-year list, do not appear on this list. Top 10 cities with highest adjusted violent crime rate (based on average over ) City County Adjusted violent crime Population 1 LONG BEACH Los Angeles LAGUNA BEACH Orange DEL MAR San Diego PALMDALE Los Angeles CARLSBAD San Diego ROLLING HILLS ESTATES Los Angeles WEST HOLLYWOOD Los Angeles HAWAIIAN GARDENS Los Angeles OCEANSIDE San Diego MANHATTAN BEACH Los Angeles
21 Top 10 cities with highest adjusted property crime rate (based on average over ) City County Adjusted property crime Population 1 LONG BEACH Los Angeles DEL MAR San Diego CERRITOS Los Angeles PERRIS Riverside SAN BERNARDINO San Bernardino LAGUNA BEACH Orange MANHATTAN BEACH Los Angeles CARLSBAD San Diego VENTURA Ventura NEWPORT BEACH Orange Top 10 cities with lowest adjusted violent or property crime rates in 2016 While the cities of Imperial and Murrieta were among the top 5 in low unadjusted violent crime rates in 2016, they are now the top-two cities in low adjusted rates. However, cities such as Palos Verde Estates and Irvine do not appear on this list of lowest violent crime rates after adjusting for city characteristics. The cities of South Pasadena and Coronado have the 3rd and 4th lowest violent crime rates, respectively, after adjusting for their city characteristics. The cities of Imperial and Rancho Santa Margarita were among the top ten in lowest unadjusted property crime list and also appear here after adjusting for city characteristics. However, the cities of Palos Verdes Estates and Aliso Viejo were among the lowest unadjusted property crime rates, but do not appear on this list after adjusting for city characteristics. The cities of Twentynine Palms, Sierra Madre, Cudahy, San Juan Capistrano, Coronado, and Adelanto all appear on this list after not appearing on the list of lowest unadjusted property crime rates in
22 Top 10 cities with lowest adjusted violent crime rate in 2016 City County Adjusted violent crime Population 1 IMPERIAL Imperial MURRIETA Riverside SOUTH PASADENA Los Angeles CORONADO San Diego SEAL BEACH Orange INGLEWOOD Los Angeles HOLTVILLE Imperial PALM DESERT Riverside MONROVIA Los Angeles OJAI Ventura Top 10 cities with lowest adjusted property crime rate in 2016 City County Adjusted property crime Population 1 IMPERIAL Imperial OJAI Ventura TWENTYNINE PALMS San Bernardino FILLMORE Ventura SIERRA MADRE Los Angeles RANCHO SANTA MARGARITA Orange SAN JUAN CAPISTRANO Orange CUDAHY Los Angeles ADELANTO San Bernardino CORONADO San Diego Top 10 cities with lowest adjusted violent and property crime rates averaged over There are sharp differences between this list of lowest adjusted violent crime rates over the last three years and the earlier unadjusted rates. Only one of the top 5 cities (i.e., Aliso Viejo) from the unadjusted list appears here. What s more, Coronado, rather than Aliso Viejo, has the lowest adjusted violent crime rate over the last three years, after taking into account the city s characteristics. The small city of Holtville in Imperial County ranks second in lowest adjusted violent crime rates over the last three years, whereas the big city (over 200,000 population) of Chula Vista in San Diego County ranks third in lowest adjusted violent crime rates. 16
23 Turning to property crime, we see slightly different patterns. On the one hand, the relatively advantaged cities of Rancho Santa Margarita, Lake Forest, and Aliso Viejo are among the top 5 in both adjusted and unadjusted crime rates. On the other hand, relatively disadvantaged cities such as Imperial Beach and Twentynine Palms suddenly appear among the top 5 cities with the lowest average property crime rate over the last three years, after adjusting for city characteristics. Top 10 cities with lowest adjusted violent crime rate (based on average over ) City County Adjusted violent crime Population 1 HOLTVILLE Imperial MURRIETA Riverside RANCHO MIRAGE Riverside PALM DESERT Riverside CORONADO San Diego GLENDORA Los Angeles MENIFEE Riverside MONROVIA Los Angeles SAN FERNANDO Los Angeles MAYWOOD Los Angeles Top 10 cities with lowest adjusted property crime rate (based on average over ) City County Adjusted property crime Population 1 RANCHO SANTA MARGARITA Orange COMPTON Los Angeles LYNWOOD Los Angeles HOLTVILLE Imperial BELL Los Angeles CUDAHY Los Angeles CALABASAS Los Angeles SAN MARCOS San Diego SIERRA MADRE Los Angeles ALISO VIEJO Orange
24 Chapter 3. Change in Violent and Property Crime in last 10 years Top 10 cities with biggest increases in violent crime in last 1, 5, and 10 years These tables focus on the cities showing the largest increases in violent crime in recent years. We display three tables: 1) Top 10 with the largest increase in the last year ( ); 2) Top 10 with the largest increase in the last five years; 3) Top 10 with the largest increase in the last ten years. We also present maps throughout this section, and the following section, showing which cities have experienced the largest changes in standardized crime rates over the last five years. In these maps, the cities with the largest increases are shown in red, the second largest are in orange, the third largest are in yellow, those with the second largest decrease are shown in green, and those with the largest decreases are shown in blue. In the last year, Needles experienced the largest increase in violence. The city s rate of violence went from 62% above the national average to about 168% above the national average from 2015 to But, this is a recent jump, as the city does not appear on the top ten lists for the last 5 years or the last 10 years. Alternatively, Murrieta has experienced the largest increase in violent crime over the last 5 and 10 years, but does not appear on the list for the most recent year. Only two of the top 10 cities with the largest increases in violent crime from (i.e., Commerce and Adelanto) are among the top 10 cities with the largest increases in rates of violence in the last 5 years. However, five of the top 10 cities with the largest increases in violence in the last 5 years (i.e., Murrieta, Lynwood, Long Beach, Compton, and Inglewood) are the top 5 cities with the largest increases in violent crime rates over the last 10 years. The largest increases in violent crime over the last 5 years and last 10 years have overwhelmingly taken place in cities in Los Angeles County. Indeed, eight cities from Los Angeles County appear on the top 10 list as having the largest increases in violence in the last 5 years, while seven Los Angeles County cities appear on the top 10 list for the last 10 years. What s more, four Los Angeles County cities appear on both of these lists (i.e., Compton, Long Beach, Lynwood, and Inglewood). Unlike the County of Los Angeles, Orange County has no cities appearing on these lists. 18
25 Top 10 cities with largest increase in violent crime rate from City County Change First year This year Population 1 NEEDLES San Bernardino COMMERCE Los Angeles MAYWOOD Los Angeles LAGUNA BEACH Orange MALIBU Los Angeles LA PALMA Orange BARSTOW San Bernardino WESTLAKE VILLAGE Los Angeles SIERRA MADRE Los Angeles ADELANTO San Bernardino Top 10 cities with largest increase in violent crime rate in last 5 years (based on three-year moving averages) City County Change First year This year Population 1 GARDENA Los Angeles COMMERCE Los Angeles CALIMESA Riverside NEEDLES San Bernardino LONG BEACH Los Angeles HEMET Riverside MONTEBELLO Los Angeles MONTCLAIR San Bernardino NATIONAL CITY San Diego PERRIS Riverside Top 10 cities with largest increase in violent crime rate in last 10 years (based on three-year moving averages) City County Change First year This year Population 1 SAN BERNARDINO San Bernardino NEEDLES San Bernardino COMMERCE Los Angeles MONTCLAIR San Bernardino PERRIS Riverside LONG BEACH Los Angeles PALMDALE Los Angeles GARDENA Los Angeles HEMET Riverside LANCASTER Los Angeles
26 Figure 3. Change in average adjusted violent crime rate ( ) for Southern California cities 20
27 21
28 Top 10 cities with biggest increases in property crime in last 1, 5, and 10 years These next tables include cities with the biggest increase in property crime. The small city of La Habra Heights experienced the largest increase in property crime over the last year. However, this seems to be a minor blip in the property crime rate for this particular city, given that it is not among the top 10 cities with the largest increases in property crime rates over the last 5 or 10 years. For cities with the largest increase in property crime from 2013 to 2016, it does not follow that such a short-term increase in crime is indicative of a more long-term trend in crime rates. Among the top 10 cities with the largest increase in property crime from 2013 to 2016, we see that only the cities of El Segundo and Beverly Hills have undergone both short-term and more long-term increases in property crime rates. Indeed, whereas Beverly Hills increase in property crime over the last year is only the eighth highest in the Southern California region, in the last five years its level of property crime increased substantially, with the city ranking third among cities in the region. However, Beverly Hills, unlike El Segundo, is not among the top 10 cities with the largest increase in property crime in the last 10 years. Paying closer attention to the top 10 cities with the largest increase in property crime in the last 5 and 10 years, we see that most of the cities appearing on these lists are from the County of Los Angeles. Murrieta, however, tops both lists. Thus, whereas Los Angeles County cities tend to be cities with the largest long-term increases in property crime, Murrieta has experienced the largest increase in property crime over the last 5 years and the last 10 years. Still, Murrieta does not appear on the list for the most recent year. And, although only Los Angeles County cities appear on the list for the most recent year, only two cities from this particular county (i.e., El Segundo and Beverly Hills) have undergone more long-term increases in property crime. Among the cities with more long-term increases in property crime, only six (i.e., Murrieta, Commerce, Palmdale, Pomona, El Segundo, and Long Beach) in the Southern California region have witnessed the largest increases in property crime over the last 5 years and over the last 10 years. What s more, only the cities of Murrieta and Commerce maintain their positions among these top 10 lists with regard to property crime rate increases over the last 5 and 10 years. In terms of long-term crime rate trends, it does not follow that sizeable, and more durable, increases in levels of property crime characterize crime trends for the Southern California region as a whole. 22
29 Top 10 cities with largest increase in property crime rate from City County Change First year This year Population 1 LA HABRA HEIGHTS Los Angeles ARTESIA Los Angeles CERRITOS Los Angeles WALNUT Los Angeles EL SEGUNDO Los Angeles ARCADIA Los Angeles MONTEREY PARK Los Angeles SIGNAL HILL Los Angeles BEVERLY HILLS Los Angeles WEST HOLLYWOOD Los Angeles Top 10 cities with largest increase in property crime rate in last 5 years (based on three-year moving averages) City County Change First year This year Population 1 CERRITOS Los Angeles SAN BERNARDINO San Bernardino HEMET Riverside CALEXICO Imperial ADELANTO San Bernardino CARLSBAD San Diego DESERT HOT SPRINGS Riverside PERRIS Riverside PARAMOUNT Los Angeles SAN DIEGO San Diego Top 10 cities with largest increase in property crime rate in last 10 years (based on three-year moving averages) City County Change First year This year Population 1 CERRITOS Los Angeles SAN BERNARDINO San Bernardino PERRIS Riverside MONTCLAIR San Bernardino CALEXICO Imperial BLYTHE Riverside CARLSBAD San Diego EL MONTE Los Angeles ANAHEIM Orange SANTE FE SPRINGS Los Angeles
30 Figure 4. Change in average adjusted property crime rate ( ) for Southern California cities 24
31 25
32 Top 10 cities with biggest decreases in violent crime in last 1, 5, and 10 years These next tables review the cities experiencing the largest relative decrease in violent crime. The crime levels that are shown are standardized to the national average for a particular year. Therefore, some of the cities on this list appear to have higher crime even though they are among those with the biggest decreases in violent crime. They actually have experienced decreases, and these standardized measures simply obscure this fact. Turning to the table showing the top 10 cities with the largest decrease in violent crime from 2015 to 2016, we see a diverse mix of cities from counties across the Southern California region. The small city of Fillmore in Ventura County has witnessed the largest decrease in violent crime in the last year, going from 163% above the average to 23% below the average. However, unlike Fillmore, the rest of the cities are above the national average in violent crime rates; but, they have experienced sizeable, albeit short-term, drops in levels of violence. Moving on to the table showing the top 10 cities with the largest decrease in violent crime in the last 5 years, we see cities from counties across the Southern California region sustaining more long-term decreases in rates of violence. The small city of Imperial Beach in the County of San Diego has experienced the largest drop in violent crime over the last 5 years, going from nearly 50% above the national average to 33% below the average level of violence for the nation. We see that the City of San Diego has also seen a substantial, and more long-term, decrease in its violent crime rate, going from almost 20% above the national average to almost 40% below the average level of violence for a typical U.S. city. Moreover, four of the top 10 cities experiencing decreases in violent crime rates are in Los Angeles County. And, when turning to the table showing the top 10 cities with the largest decrease in violent crime in the last 10 years, we see similar patterns. Long-term decreases in violent crime rates are taking root across cities in virtually all counties across the Southern California region. We again see that four of the top 10 cities going through these more long-term decreases in violence are in the County of Los Angeles. Still, the city going through the largest decrease in violence in the last 10 years is in Riverside County: while the city of Lake Elsinore was almost 120% higher than the average level of violence for a U.S. city ten years ago, its violent crime rate is now almost 40% lower than the typical U.S. city. Also worth highlighting is that the cities of Imperial Beach, Pasadena, and El Centro have enjoyed sizeable decreases in violent crime rates in the last 5 years and in the last 10 years. These cities are among the top 10 cities with the largest decreases in violence, whether in the last 5 years or in the last 10 years. As such, these particular cities maintain a steady position among cities in the Southern California region with regard to more long-term drops in violent crime rates. 26
33 Top 10 cities with largest decrease in violent crime rate from City County Change First year This year Population 1 YUCCA VALLEY San Bernardino FILLMORE Ventura INDIO Riverside HAWAIIAN GARDENS Los Angeles NATIONAL CITY San Diego BANNING Riverside SOUTH EL MONTE Los Angeles BRAWLEY Imperial PALMDALE Los Angeles LEMON GROVE San Diego Top 10 cities with largest decrease in violent crime rate in last 5 years (based on three-year moving averages) City County Change First year This year Population 1 COMPTON Los Angeles BEAUMONT Riverside BLYTHE Riverside CHINO San Bernardino PALM DESERT Riverside SOUTH EL MONTE Los Angeles SAN FERNANDO Los Angeles CULVER CITY Los Angeles LOMITA Los Angeles VICTORVILLE San Bernardino Top 10 cities with largest decrease in violent crime rate in last 10 years (based on three-year moving averages) City County Change First year This year Population 1 LOS ANGELES Los Angeles ARTESIA Los Angeles HAWTHORNE Los Angeles PALM DESERT Riverside BANNING Riverside SANTA CLARITA Los Angeles HAWAIIAN GARDENS Los Angeles WESTLAKE VILLAGE Los Angeles BEAUMONT Riverside MALIBU Los Angeles
34 Top 10 cities with biggest decreases in property crime in last 1, 5, and 10 years These next tables review the cities experiencing the largest relative decrease in property crime. The crime levels that are shown are standardized to the national average for a particular year. Therefore, some of the cities on this list appear to have higher crime even though they are among those with the biggest decreases in property crime. They actually have experienced decreases, and these standardized measures simply obscure this fact. Looking at the first table, which shows the top 10 cities with the largest decrease in property crime from 2015 to 2016, a few things are worth highlighting. Whereas all cities on this list were either at, or above, the national average in terms of levels of property crime in the first year, this year, three of the top 10 cities (i.e., Orange, Indian Wells, and Adelanto) have property crime rates lower than a typical U.S. city. Thus, we see that while the city of Orange, which tops this list, initially had 20% more property crime than an average U.S. city, now its property crime rate is almost 30% lower. Furthermore, more than half of cities experiencing the largest decreases in property crime rates in the most recent year are from the Inland Empire (i.e., the Counties of Riverside and San Bernardino). On the one hand, looking at the second table, which shows the top 10 cities with the largest decrease in property crime in the last 5 years, we see a diverse mix of Southern California cities undergoing more long-term decreases in crimes against property. What s more, we see that whereas in the first year most cities on this list were above the average level of property crime, this year most cities are overwhelmingly below the national average. Furthermore, we observe that the city of Calexico, which appeared on the previously discussed list, also appears on this list. Thus, Calexico has also undergone more long-term change in its level of crimes against property, going from 36% above the national average to 5% lower than the average property crime rate. On the other hand, turning to the table showing the top 10 cities with the largest decrease in property crime in the last 10 years, we note that the majority of cities going through more long-term decreases in crimes against property are in the Inland Empire. Indeed, the city of Lake Elsinore in the County of Riverside has seen the largest decrease in property crime rates over the last 10 years, going from almost 50% above the national average in property crime to almost 25% below the average. We also note that the city of Imperial Beach in San Diego County, which also appeared on the top 10 list of cities with the largest decrease in property crime in the last 5 years, appears on this list, as well, coming in second place. Indeed, Imperial Beach s property crime rate dropped considerably from an already low baseline, going from almost 40% to over 60% below the national average. While most cities on this list were below the national average ten years ago, this year all cities on this list have property crime rates lower than a typical U.S. city. 28
35 Top 10 cities with largest decrease in property crime rate from City County Change First year This year Population 1 YUCCA VALLEY San Bernardino ORANGE Orange BLYTHE Riverside EL CENTRO Imperial INDIAN WELLS Riverside CALEXICO Imperial ADELANTO San Bernardino PALM SPRINGS Riverside DESERT HOT SPRINGS Riverside SANTE FE SPRINGS Los Angeles Top 10 cities with largest decrease in property crime rate in last 5 years (based on three-year moving averages) City County Change First year This year Population 1 PALM DESERT Riverside BANNING Riverside VICTORVILLE San Bernardino CULVER CITY Los Angeles SANTA ANA Orange SAN FERNANDO Los Angeles LA HABRA Orange CLAREMONT Los Angeles BEVERLY HILLS Los Angeles ARCADIA Los Angeles Top 10 cities with largest decrease in property crime rate in last 10 years (based on three-year moving averages) City County Change First year This year Population 1 LOS ANGELES Los Angeles PALM DESERT Riverside SANTA MONICA Los Angeles HAWTHORNE Los Angeles LYNWOOD Los Angeles CLAREMONT Los Angeles VILLA PARK Orange ESCONDIDO San Diego FULLERTON Orange SAN CLEMENTE Orange
36 Chapter 4. Violent and Property Crime long-term change and projections Changes since 1990 in violent and property crime for U.S. cities Given the discussion in the media about long-term trends in crime rates across U.S. cities, we show how violent and property crime have changed in U.S. cities since The following chart shows how violent and property crime rates have changed since 1990 in U.S. and Southern California cities with at least 10,000 population. The chart highlights that whereas the property and violent crime rates were higher in Southern California cities compared to U.S. cities in 1990, they have exhibited an even sharper downward trajectory compared to the U.S. and are now comparatively lower Long-term trend in crime for U.S. cities and Southern California cities National property crime rate (left axis) So Cal property crime rate (left axis) National violent crime rate (right axis) So Cal violent crime rate (right axis) 0 30
37 Projections of violent and property crime for 2018 We next present forecasted violent and property crime rates in Southern California cities for 2018 based on our statistical model. Based on the model, we first present the expected change in all cities in the region from 2016 to We then describe how the model projects changes in the cities in each county. We remind the reader that the forecasts for individual cities have a confidence interval around the predicted value, and therefore are simply our best guess of the level of crime for County-level changes in violent and property crime In general, our projection model forecasts an overall relative drop in violent and property crime in the region from 2016 levels to Whereas the average city had a violent crime rate in 2016 of 475 violent crime events per 100,000 people, our model projects an average decrease across cities of 17% in 2018 (a decrease of 114 violent crime events per 100,000 people). Our model also projects a 6% decrease in property crime events from 2016 to 2018 (a decrease of 408 property crime events per 100,000 people). Our projection model forecasts decreasing violent and property crime rates in 87% and 71% of Southern California cities, respectively. Turning to the individual counties, our model forecasts that cities in Los Angeles County will generally fare similarly to the region overall, although with slightly larger crime drops. The model forecasts a 25% decrease in violent crime and a 9.5% decrease in property crime in 2018, on average, for cities in Los Angeles County. 93% of cities are projected to experience a decrease in violent crime, whereas 84% are projected to experience a decrease in property crime. The model forecasts that Orange County cities will experience decreases in crime. Cities in Orange County are projected to have, on average, 20% less violent crime and 7% less property crime. 85% of cities are projected to experience decreasing violent crime and 79% are projected to experience decreasing property crime. Riverside County cities are forecasted to tread water for violence, as they are forecasted for a very slight 1.6% increase compared to They are forecasted to have similar levels of property crime compared to Whereas 75% of cities in the County of Riverside are projected to experience fewer crimes against persons, 46% of cities are expected to have fewer crimes against property. 31
38 San Bernardino County cities, on average, are projected to experience a 12% decrease in violent crime but a 1.5% increase in property crime from 2016 to % of the cities are projected to experience a decrease in violent crime, and 36% for property crime. San Diego County cities are forecasted to experience drops in crime levels. Our model forecasts a 14% decrease in violent crime, on average, across San Diego cities, with 94% of cities projected to see decreasing levels of violence. Our model forecasts a 7% decrease in property crime, on average, across cities in San Diego County, with 78% of cities expected to see decreasing levels of non-violent acquisitive crimes. Finally, whereas Ventura County cities are projected to experience a decrease in violent crime of 8% less than 2016, property crime is projected to decrease nearly 5% on average across these 10 cities. Projected change for cities in the counties of the region from 2016 to 2018 County Average projected change in violent crime Average projected change in property crime Percent cities projected decreasing violent crime Percent cities projected decreasing property crime Region -17.3% -6.0% 86.6% 71.1% Los Angeles -25.2% -9.5% 92.5% 83.8% Orange -20.2% -7.1% 84.8% 78.8% Riverside 1.6% 0.4% 75.0% 45.8% San Bernardino -11.6% 1.5% 72.7% 36.4% San Diego -14.1% -7.2% 94.4% 77.8% Ventura -8.3% -4.6% 90.0% 70.0% 32
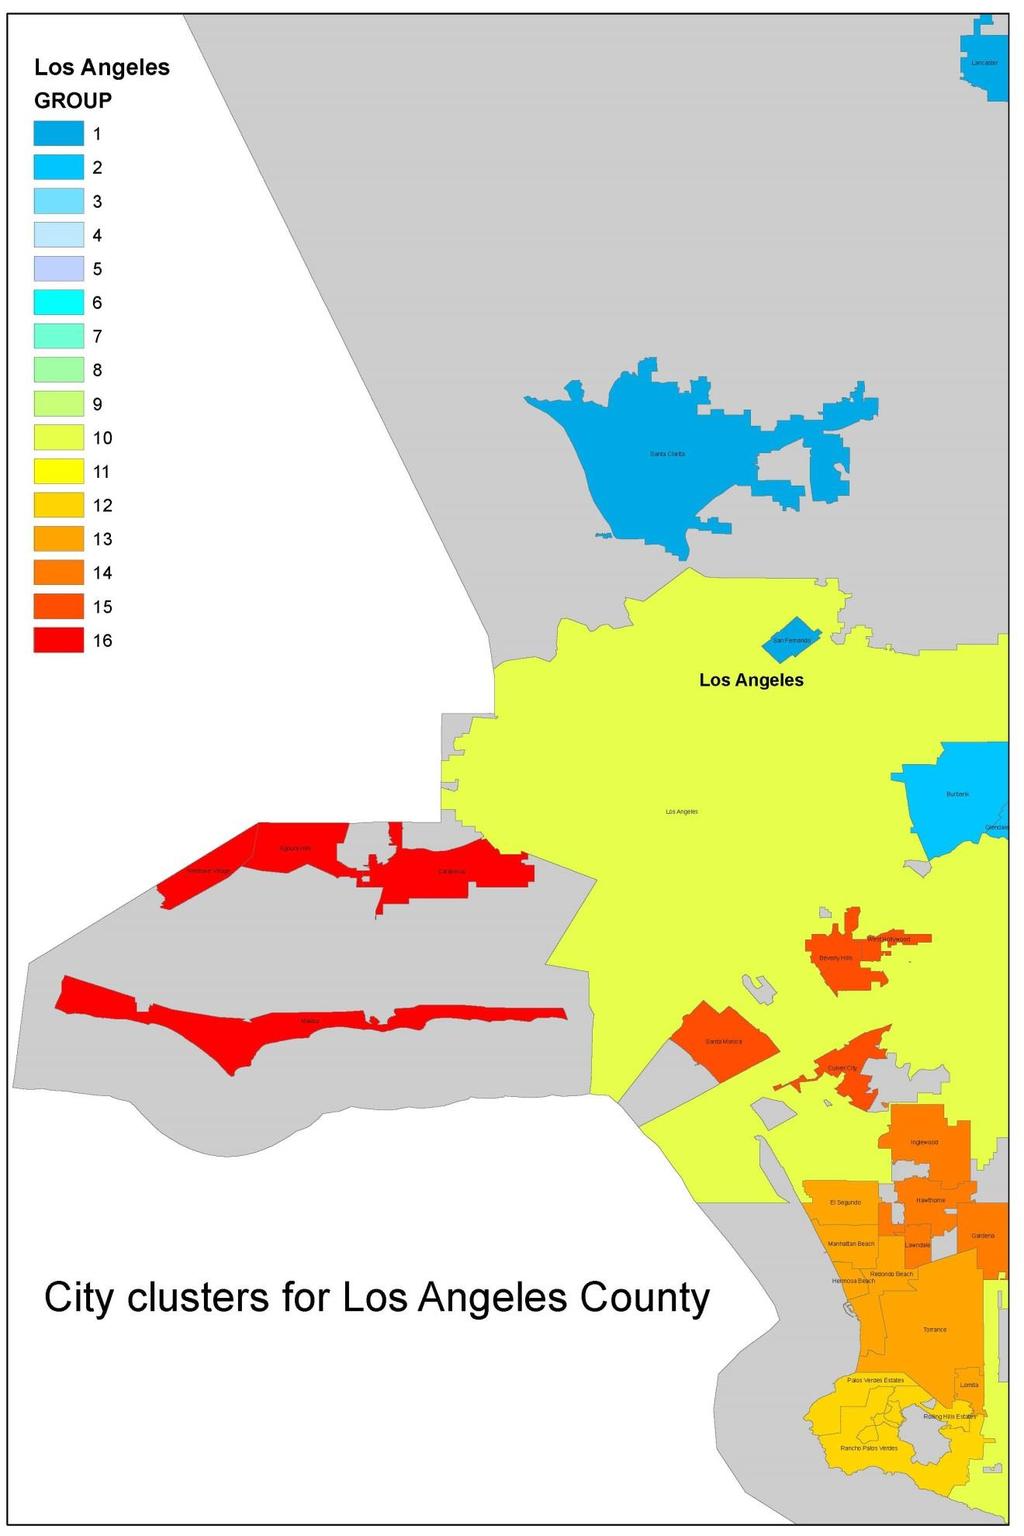
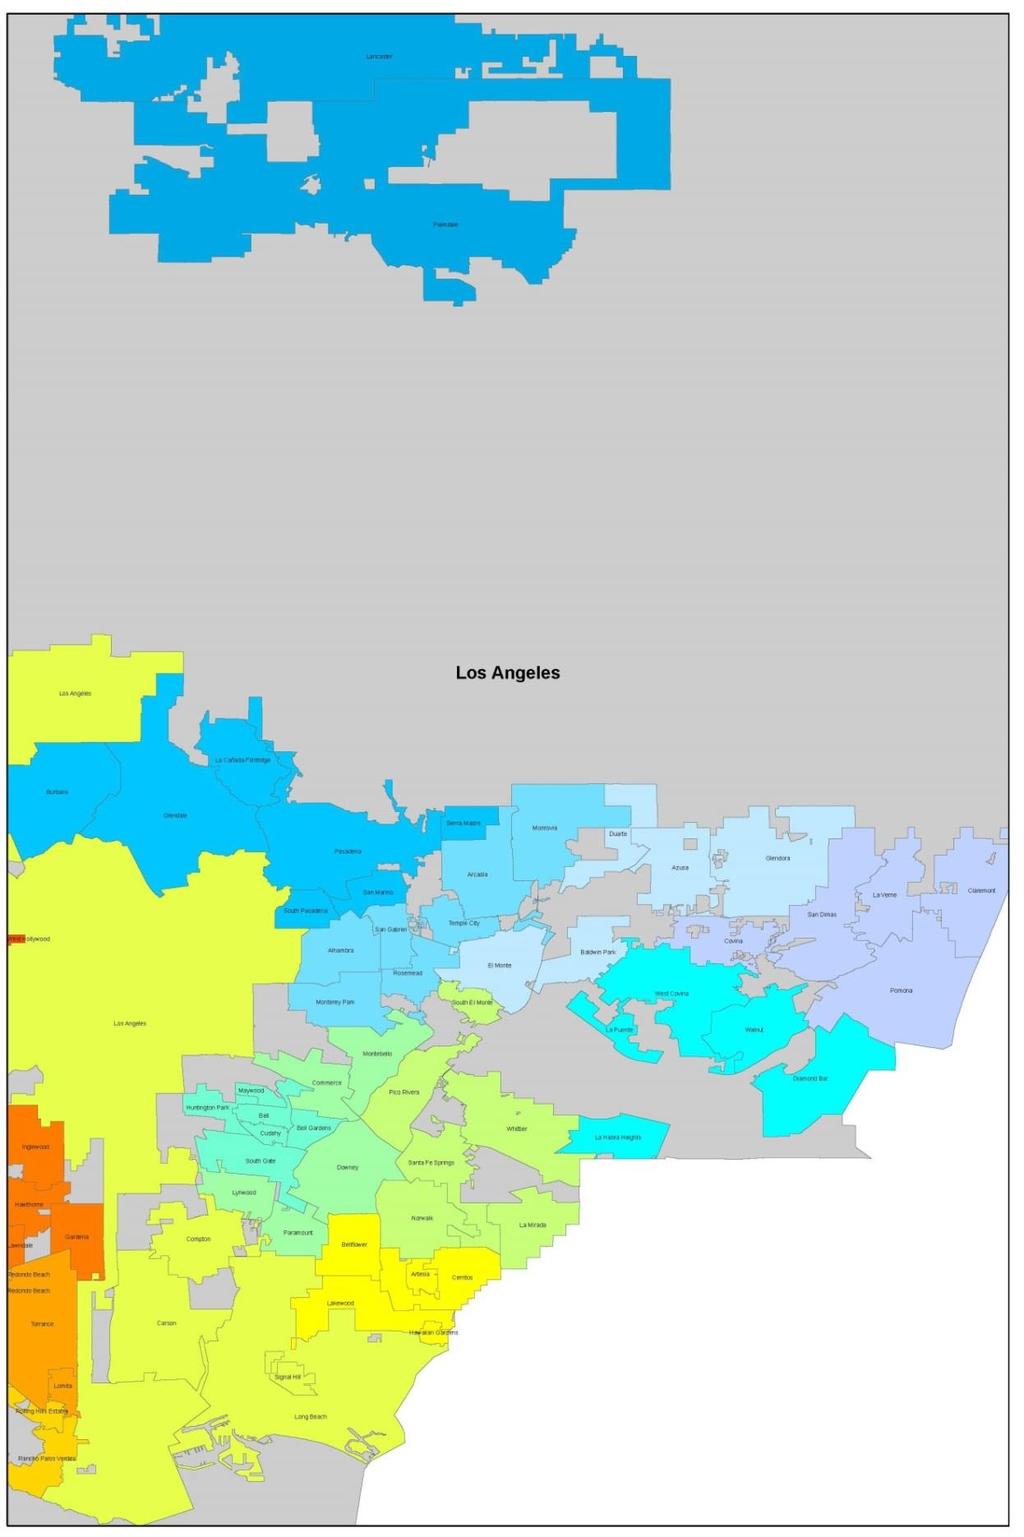
39 Appendix In this Appendix, we display the adjusted crime rates for all cities in each of the six major counties in the region. We present the results for each county separately, beginning with Los Angeles County. The first table for each county shows the adjusted crime rate in the most recent year (2016) for all cities in the county. The second table shows the average adjusted crime rate over the three most recent years ( ) for all cities in the county. After the two tables, we then display Figures showing the 10 year trajectory of the violent crime rate for the cities in the county. Each Figure presents the trajectories for a geographic cluster of cities. A map in each section shows the geographic clustering of cities for these figures. For each Figure, the scale is typically from 0 to 400. Thus, the bottom value is a city with no violent crime, whereas 400 indicates a city with a violent crime rate 300% higher than the regional average ( = 300). For a few of the Figures, we had to extend the scale if certain cities had particularly high violent crime rates. To understand how to interpret the tables, note that in the first table for Los Angeles County, the city of Artesia has a standardized aggravated assault rate of 152, indicating that in 2016 their aggravated assault rate was 52% higher than the average city in the region. The burglary rate in Artesia was 159.5% higher than the average city in the nation ( = 159.5). Artesia s homicide in 2016 was 177.6% higher than the national average. However, its larceny rate was just 10.67% higher than the national average. 33
40 Los Angeles County Standardized crime rates for cities in Los Angeles County, 2016 City Assault Robbery Homicide Burglary Auto Theft Larceny Pop 1 AGOURA HILLS ALHAMBRA ARCADIA ARTESIA AZUSA BALDWIN PARK BELL BELL GARDENS BELLFLOWER BEVERLY HILLS BURBANK CALABASAS CARSON CERRITOS CLAREMONT COMMERCE COMPTON COVINA CUDAHY CULVER CITY DIAMOND BAR DOWNEY DUARTE EL MONTE EL SEGUNDO GARDENA GLENDALE GLENDORA HAWAIIAN GARDENS HAWTHORNE HUNTINGTON PARK INGLEWOOD LA CANADA FLINTRIDGE LA HABRA HEIGHTS LA MIRADA LA PUENTE LA VERNE LAKEWOOD LANCASTER LAWNDALE
41 41 LOMITA LONG BEACH LOS ANGELES LYNWOOD MALIBU MANHATTAN BEACH MAYWOOD MONROVIA MONTEBELLO MONTEREY PARK NORWALK PALMDALE PALOS VERDES ESTATES PARAMOUNT PASADENA PICO RIVERA RANCHO PALOS VERDES REDONDO BEACH ROLLING HILLS ESTATES ROSEMEAD SAN DIMAS SAN FERNANDO SAN GABRIEL SAN MARINO SANTA CLARITA SANTA MONICA SANTE FE SPRINGS SIERRA MADRE SIGNAL HILL SOUTH EL MONTE SOUTH GATE SOUTH PASADENA TEMPLE CITY TORRANCE WALNUT WEST COVINA WEST HOLLYWOOD WESTLAKE VILLAGE WHITTIER WESTLAKE VILLAGE WHITTIER
42 Standardized crime rates for cities in Los Angeles County, average from City Assault Robbery Homicide Burglary Auto Theft Larceny Pop 1 AGOURA HILLS ALHAMBRA ARCADIA ARTESIA AZUSA BALDWIN PARK BELL BELL GARDENS BELLFLOWER BEVERLY HILLS BURBANK CALABASAS CARSON CERRITOS CLAREMONT COMMERCE COMPTON COVINA CUDAHY CULVER CITY DIAMOND BAR DOWNEY DUARTE EL MONTE EL SEGUNDO GARDENA GLENDALE GLENDORA HAWAIIAN GARDENS HAWTHORNE HUNTINGTON PARK INGLEWOOD LA CANADA FLINTRIDGE LA HABRA HEIGHTS LA MIRADA LA PUENTE LA VERNE LAKEWOOD LANCASTER LAWNDALE
43 41 LOMITA LONG BEACH LOS ANGELES LYNWOOD MALIBU MANHATTAN BEACH MAYWOOD MONROVIA MONTEBELLO MONTEREY PARK NORWALK PALMDALE PALOS VERDES ESTATES PARAMOUNT PASADENA PICO RIVERA RANCHO PALOS VERDES REDONDO BEACH ROLLING HILLS ESTATES ROSEMEAD SAN DIMAS SAN FERNANDO SAN GABRIEL SAN MARINO SANTA CLARITA SANTA MONICA SANTE FE SPRINGS SIERRA MADRE SIGNAL HILL SOUTH EL MONTE SOUTH GATE SOUTH PASADENA TEMPLE CITY TORRANCE WALNUT WEST COVINA WEST HOLLYWOOD WESTLAKE VILLAGE WHITTIER WESTLAKE VILLAGE WHITTIER
44 38
45 39
46 Adjusted violent crime rate Adjusted violent crime rate Adjusted violent crime rates for cities in Los Angeles County - last 10 years 400 Adjusted violent crime rates over the last 10 years: North Los Angeles County LAWNDALE PALOS VERDES ESTATES SAN MARINO SANTE FE SPRINGS Adjusted violent crime rates over the last 10 years: Northwest San Gabriel Valley BURBANK GLENDALE 200 LA HABRA HEIGHTS PICO RIVERA SANTA MONICA 150 TORRANCE SOUTH EL MONTE
47 Adjusted violent crime rate Adjusted violent crime rate 400 Adjusted violent crime rates over the last 10 years: North central San Gabriel Valley ALHAMBRA ARCADIA 200 MONTEBELLO NORWALK SAN FERNANDO 150 SANTA CLARITA WALNUT Adjusted violent crime rates over the last 10 years: Central San Gabriel Valley AZUSA BALDWIN PARK DUARTE EL MONTE GLENDORA
48 Adjusted violent crime rate Adjusted violent crime rate 400 Adjusted violent crime rates over the last 10 years: East Los Angeles County COVINA 200 CLAREMONT LAKEWOOD REDONDO BEACH 150 SAN GABRIEL Adjusted violent crime rates over the last 10 years: South San Gabriel Valley DIAMOND BAR LA MIRADA LA VERNE WEST HOLLYWOOD WESTLAKE VILLAGE
49 Adjusted violent crime rate Adjusted violent crime rate 400 Adjusted violent crime rates over the last 10 years: Central Los Angeles County BELL BELL GARDENS CUDAHY INGLEWOOD MONROVIA TEMPLE CITY Adjusted violent crime rates over the last 10 years: Central Los Angeles County COMMERCE DOWNEY MALIBU MONTEREY PARK PASADENA
50 Adjusted violent crime rate Adjusted violent crime rate 400 Adjusted violent crime rates over the last 10 years: Central east Los Angeles County LA PUENTE PALMDALE RANCHO PALOS VERDES SIERRA MADRE SOUTH PASADENA WHITTIER Adjusted violent crime rates over the last 10 years: South central Los Angeles County CARSON 300 COMPTON LOS ANGELES LYNWOOD SOUTH GATE
51 Adjusted violent crime rate Adjusted violent crime rate 400 Adjusted violent crime rates over the last 10 years: East central Los Angeles County ARTESIA BELLFLOWER CERRITOS HAWAIIAN GARDENS LANCASTER Adjusted violent crime rates over the last 10 years: Palos Verdes PARAMOUNT ROLLING HILLS ESTATES SAN DIMAS
52 Adjusted violent crime rate Adjusted violent crime rate 400 Adjusted violent crime rates over the last 10 years: South Bay EL SEGUNDO HUNTINGTON PARK LONG BEACH MAYWOOD ROSEMEAD WEST COVINA Adjusted violent crime rates over the last 10 years: West-central Los Angeles GARDENA HAWTHORNE LA CANADA FLINTRIDGE LOMITA
53 Adjusted violent crime rate Adjusted violent crime rate 400 Adjusted violent crime rates over the last 10 years: Westside Los Angeles BEVERLY HILLS CULVER CITY SIGNAL HILL WHITTIER Adjusted violent crime rates over the last 10 years: Western Los Angeles County AGOURA HILLS CALABASAS MANHATTAN BEACH WESTLAKE VILLAGE
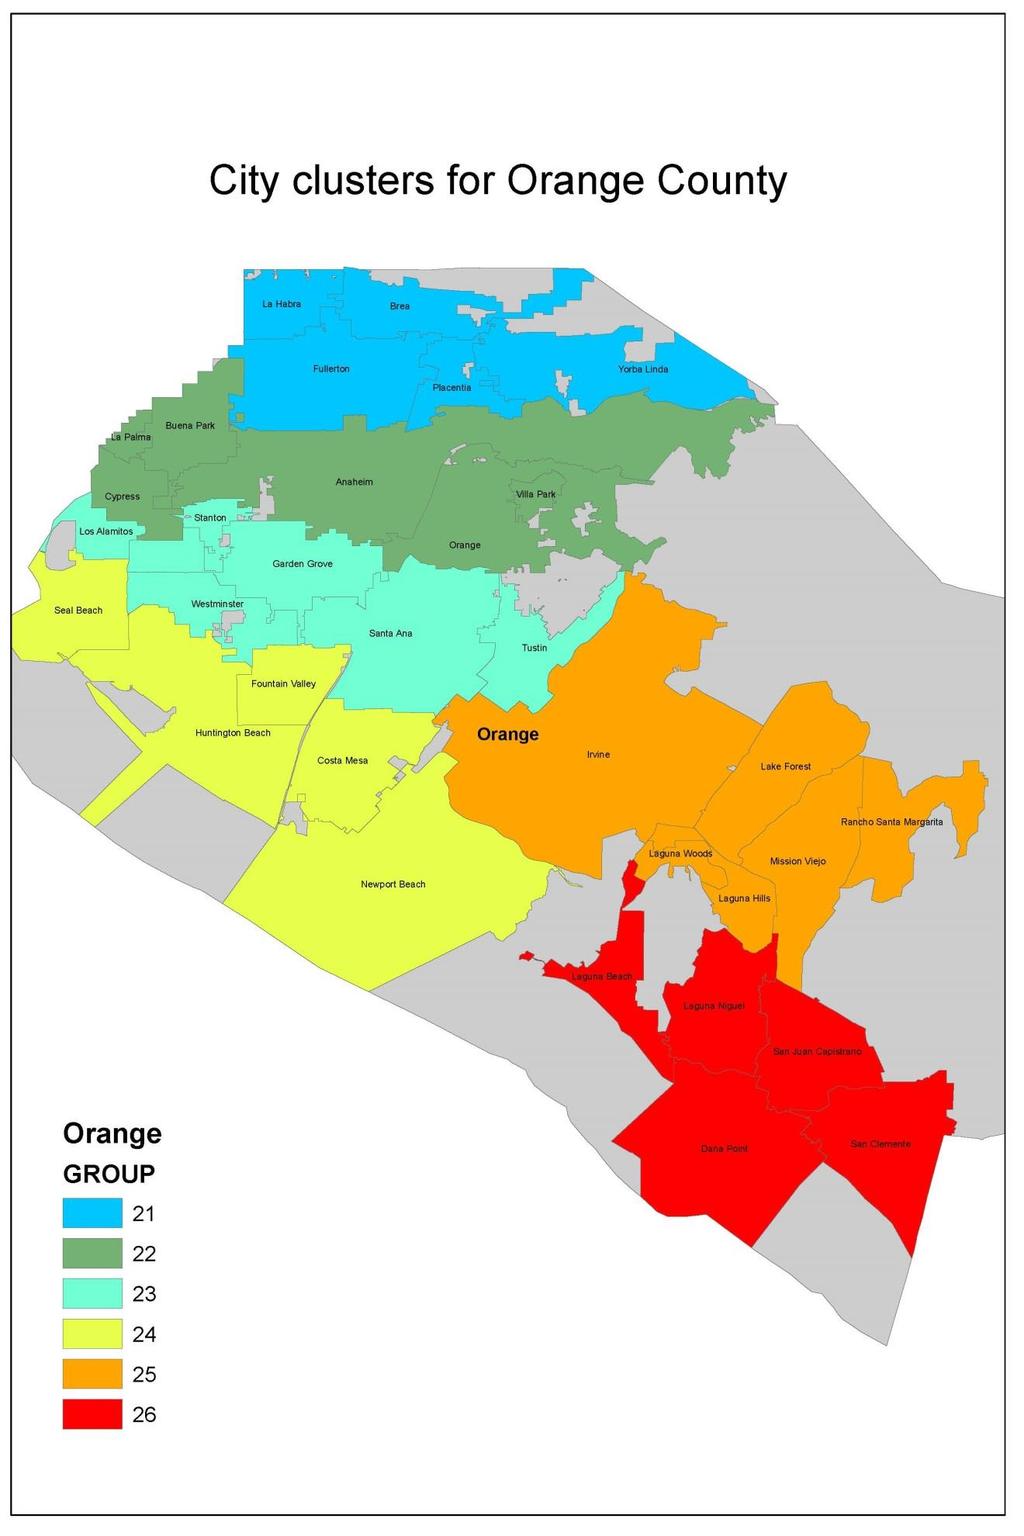
54 Orange County This section shows the crime rate trends for Orange County cities. The first table shows the adjusted crime rate in the most recent year (2016) for all cities. The second table shows the average adjusted crime rate over the three most recent years ( ) for all cities. After the two tables, we then display Figures showing the 10 year trajectory of the violent crime rate for the cities in the county. These cities are clustered geographically into city clusters, and the map shows the clustering of cities for these figures. For each Figure, the scale is typically from 0 to 400. Thus, the bottom value is a city with no violent crime, whereas 400 indicates a city with a violent crime rate 300% higher than the regional average ( = 300). For a few of the Figures, we had to extend the scale if certain cities had particularly high violent crime rates. 48
55 Standardized crime rates for cities in Orange County, 2016 City Assault Robbery Homicide Burglary Auto Theft Larceny Pop 1 ALISO VIEJO ANAHEIM BREA BUENA PARK COSTA MESA CYPRESS DANA POINT FOUNTAIN VALLEY FULLERTON GARDEN GROVE HUNTINGTON BEACH IRVINE LA HABRA LA PALMA LAGUNA BEACH LAGUNA HILLS LAGUNA NIGUEL LAKE FOREST LOS ALAMITOS MISSION VIEJO NEWPORT BEACH ORANGE PLACENTIA RANCHO SANTA MARGARITA SAN CLEMENTE SAN JUAN CAPISTRANO SANTA ANA SEAL BEACH STANTON TUSTIN VILLA PARK WESTMINSTER YORBA LINDA
56 Standardized crime rates for cities in Orange County, average from City Assault Robbery Homicide Burglary Auto Theft Larceny Pop 1 ALISO VIEJO ANAHEIM BREA BUENA PARK COSTA MESA CYPRESS DANA POINT FOUNTAIN VALLEY FULLERTON GARDEN GROVE HUNTINGTON BEACH IRVINE LA HABRA LA PALMA LAGUNA BEACH LAGUNA HILLS LAGUNA NIGUEL LAKE FOREST LOS ALAMITOS MISSION VIEJO NEWPORT BEACH ORANGE PLACENTIA RANCHO SANTA MARGARITA SAN CLEMENTE SAN JUAN CAPISTRANO SANTA ANA SEAL BEACH STANTON TUSTIN VILLA PARK WESTMINSTER YORBA LINDA
57 51
58 Adjusted violent crime rate Adjusted violent crime rate Adjusted violent crime rates for cities in Orange County - last 10 years 400 Adjusted violent crime rates over the last 10 years: North Orange County FULLERTON BREA LA HABRA YORBA LINDA Adjusted violent crime rates over the last 10 years: Central Orange County ANAHEIM LA PALMA BUENA PARK ORANGE CYPRESS VILLA PARK
59 Adjusted violent crime rate Adjusted violent crime rate 400 Adjusted violent crime rates over the last 10 years: West-central Orange County SANTA ANA GARDEN GROVE WESTMINSTER TUSTIN LOS ALAMITOS STANTON Adjusted violent crime rates over the last 10 years: North beaches Orange County SEAL BEACH HUNTINGTON BEACH FOUNTAIN VALLEY NEWPORT BEACH COSTA MESA
60 Adjusted violent crime rate Adjusted violent crime rate 400 Adjusted violent crime rates over the last 10 years: South Orange County IRVINE LAGUNA HILLS LAKE FOREST MISSION VIEJO RANCHO SANTA MARGARITA ALISO VIEJO Adjusted violent crime rates over the last 10 years: South Orange County beaches SAN CLEMENTE SAN JUAN CAPISTRANO DANA POINT LAGUNA BEACH LAGUNA NIGUEL
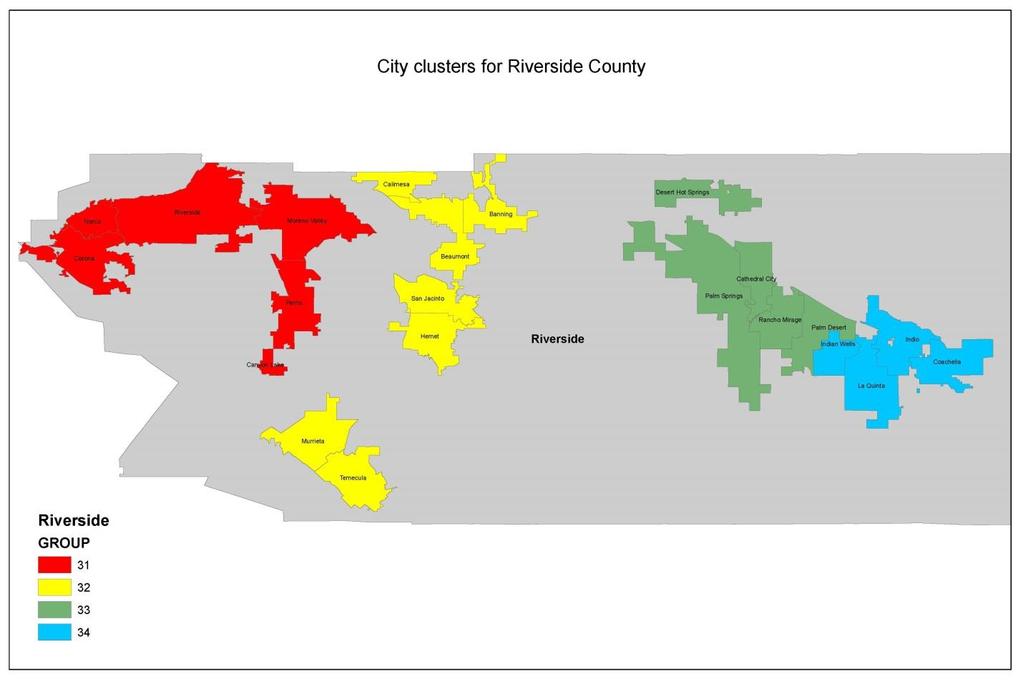
61 Riverside County This section shows the crime rate trends for Riverside County cities. The first table shows the adjusted crime rate in the most recent year (2016) for all cities. The second table shows the average adjusted crime rate over the three most recent years ( ) for all cities. After the two tables, we then display Figures showing the 10 year trajectory of the violent crime rate for the cities in the county. These cities are clustered geographically into city clusters, and the map shows the clustering of cities for these figures. For each Figure, the scale is typically from 0 to 400. Thus, the bottom value is a city with no violent crime, whereas 400 indicates a city with a violent crime rate 300% higher than the regional average ( = 300). For a few of the Figures, we had to extend the scale if certain cities had particularly high violent crime rates. 55
62 Standardized crime rates for cities in Riverside County, 2016 City Assault Robbery Homicide Burglary Auto Theft Larceny Pop 1 BANNING BEAUMONT BLYTHE CALIMESA CANYON LAKE CATHEDRAL CITY COACHELLA CORONA DESERT HOT SPRINGS HEMET INDIAN WELLS INDIO JURUPA VALLEY LA QUINTA LAKE ELSINORE MENIFEE MORENO VALLEY MURRIETA NORCO PALM DESERT PALM SPRINGS PERRIS RANCHO MIRAGE RIVERSIDE SAN JACINTO
63 Standardized crime rates for cities in Riverside County, average from City Assault Robbery Homicide Burglary Auto Theft Larceny Pop 1 BANNING BEAUMONT BLYTHE CALIMESA CANYON LAKE CATHEDRAL CITY COACHELLA CORONA DESERT HOT SPRINGS HEMET INDIAN WELLS INDIO JURUPA VALLEY LA QUINTA LAKE ELSINORE MENIFEE MORENO VALLEY MURRIETA NORCO PALM DESERT PALM SPRINGS PERRIS RANCHO MIRAGE RIVERSIDE SAN JACINTO
64 58
65 Adjusted violent crime rate Adjusted violent crime rate Adjusted violent crime rates for cities in Riverside County - last 10 years 400 Adjusted violent crime rates over the last 10 years: North-western Riverside County CATHEDRAL CITY DESERT HOT SPRINGS MENIFEE MURRIETA PALM SPRINGS RANCHO MIRAGE Adjusted violent crime rates over the last 10 years: South-western Riverside County BANNING BEAUMONT CANYON LAKE INDIO MORENO VALLEY RIVERSIDE SAN JACINTO
66 Adjusted violent crime rate Adjusted violent crime rate 400 Adjusted violent crime rates over the last 10 years: West-central Riverside County COACHELLA HEMET NORCO PALM DESERT PERRIS Adjusted violent crime rates over the last 10 years: East-central Riverside County BLYTHE CORONA JURUPA VALLEY LA QUINTA LAKE ELSINORE
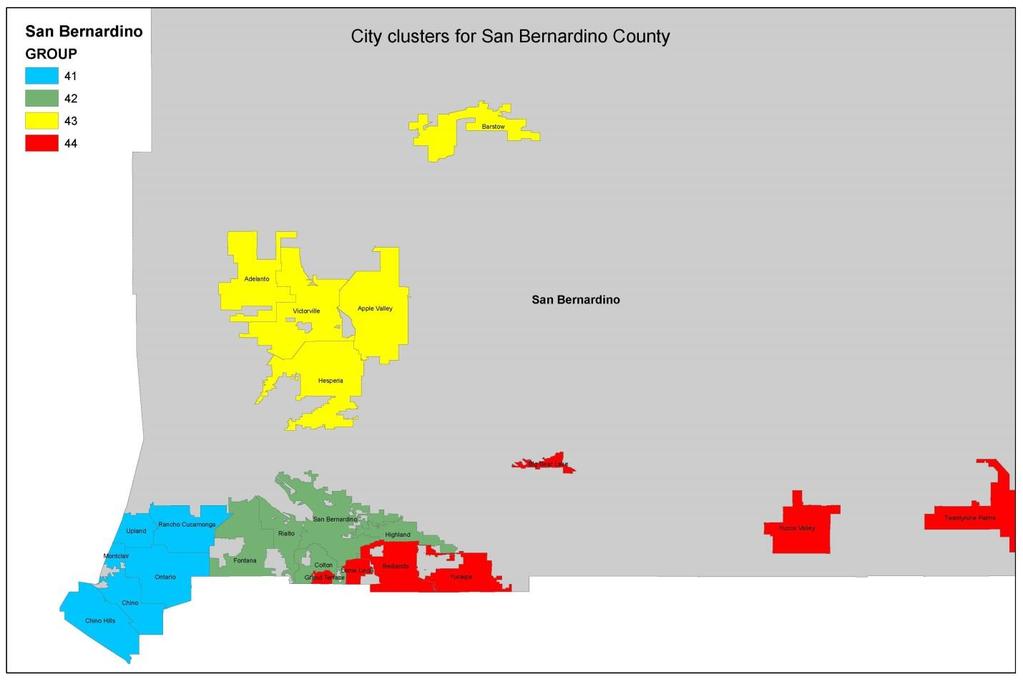
67 San Bernardino County This section shows the crime rate trends for San Bernardino County cities. The first table shows the adjusted crime rate in the most recent year (2016) for all cities. The second table shows the average adjusted crime rate over the three most recent years ( ) for all cities. After the two tables, we then display Figures showing the 10 year trajectory of the violent crime rate for the cities in the county. These cities are clustered geographically into city clusters, and the map shows the clustering of cities for these figures. For each Figure, the scale is typically from 0 to 400. Thus, the bottom value is a city with no violent crime, whereas 400 indicates a city with a violent crime rate 300% higher than the regional average ( = 300). For a few of the Figures, we had to extend the scale if certain cities had particularly high violent crime rates. 61
68 Standardized crime rates for cities in San Bernardino County, 2016 City Assault Robbery Homicide Burglary Auto Theft Larceny Pop 1 ADELANTO APPLE VALLEY BARSTOW BIG BEAR LAKE CHINO CHINO HILLS COLTON GRAND TERRACE HESPERIA HIGHLAND LOMA LINDA MONTCLAIR NEEDLES ONTARIO RANCHO CUCAMONGA REDLANDS RIALTO SAN BERNARDINO TWENTYNINE PALMS UPLAND VICTORVILLE YUCAIPA YUCCA VALLEY YUCCA VALLEY
69 Standardized crime rates for cities in San Bernardino County, average from City Assault Robbery Homicide Burglary Auto Theft Larceny Pop 1 ADELANTO APPLE VALLEY BARSTOW BIG BEAR LAKE CHINO CHINO HILLS COLTON GRAND TERRACE HESPERIA HIGHLAND LOMA LINDA MONTCLAIR NEEDLES ONTARIO RANCHO CUCAMONGA REDLANDS RIALTO SAN BERNARDINO TWENTYNINE PALMS UPLAND VICTORVILLE YUCAIPA YUCCA VALLEY YUCCA VALLEY
70 64
71 Adjusted violent crime rate Adjusted violent crime rate Adjusted violent crime rates for cities in San Bernardino County - last 10 years 400 Adjusted violent crime rates over the last 10 years: South-west San Bernardino County CHINO CHINO HILLS NEEDLES RANCHO CUCAMONGA REDLANDS VICTORVILLE Adjusted violent crime rates over the last 10 years: South-central San Bernardino County COLTON GRAND TERRACE LOMA LINDA SAN BERNARDINO TWENTYNINE PALMS
72 Adjusted violent crime Adjusted violent crime rate 400 Adjusted violent crime rates over the last 10 years: North San Bernardino County ADELANTO APPLE VALLEY BARSTOW HIGHLAND ONTARIO YUCAIPA Adjusted violent crime rates over the last 10 years: Eastern San Bernardino County BIG BEAR LAKE HESPERIA 200 MONTCLAIR RIALTO UPLAND 150 YUCCA VALLEY YUCCA VALLEY
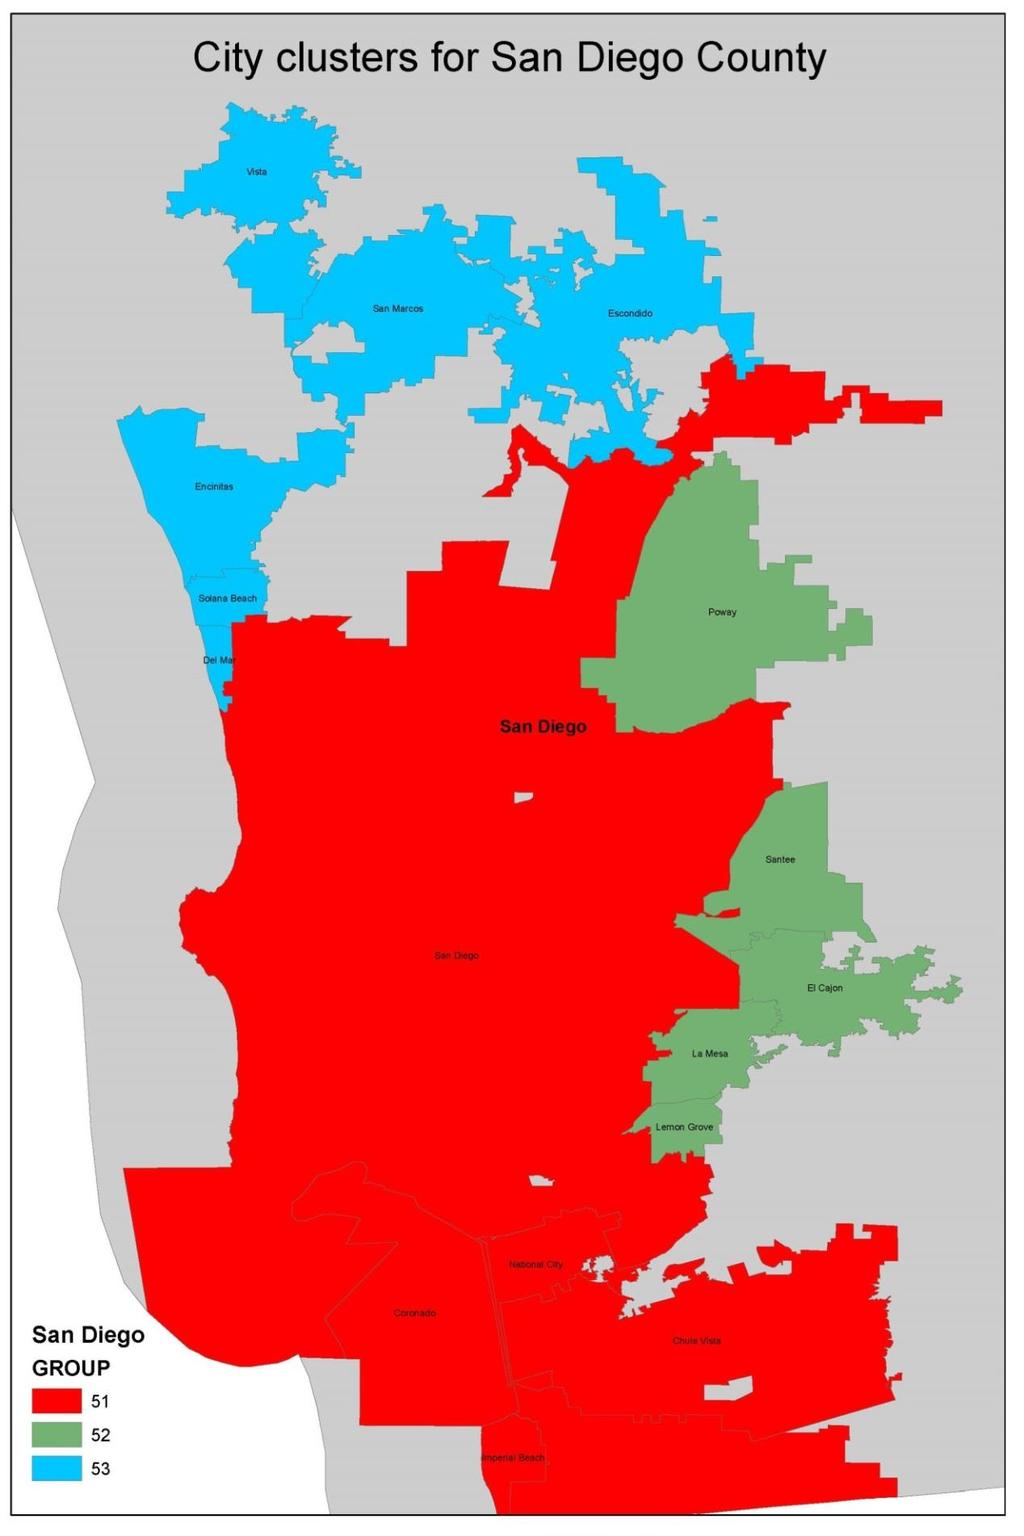
73 San Diego County This section shows the crime rate trends for San Diego County cities. The first table shows the adjusted crime rate in the most recent year (2016) for all cities. The second table shows the average adjusted crime rate over the three most recent years ( ) for all cities. After the two tables, we then display Figures showing the 10 year trajectory of the violent crime rate for the cities in the county. These cities are clustered geographically into city clusters, and the map shows the clustering of cities for these figures. For each Figure, the scale is typically from 0 to 400. Thus, the bottom value is a city with no violent crime, whereas 400 indicates a city with a violent crime rate 300% higher than the regional average ( = 300). For a few of the Figures, we had to extend the scale if certain cities had particularly high violent crime rates. 67
74 Standardized crime rates for cities in San Diego County in 2016 City Assault Robbery Homicide Burglary Auto Theft Larceny Pop 1 CARLSBAD CHULA VISTA CORONADO DEL MAR EL CAJON ENCINITAS ESCONDIDO IMPERIAL BEACH LA MESA LEMON GROVE NATIONAL CITY OCEANSIDE POWAY SAN DIEGO SAN MARCOS SANTEE SOLANA BEACH
75 Standardized crime rates for cities in San Diego County, average from City Assault Robbery Homicide Burglary Auto Theft Larceny Pop 1 CARLSBAD CHULA VISTA CORONADO DEL MAR EL CAJON ENCINITAS ESCONDIDO IMPERIAL BEACH LA MESA LEMON GROVE NATIONAL CITY OCEANSIDE POWAY SAN DIEGO SAN MARCOS SANTEE SOLANA BEACH
76 70
77 Adjusted violent crime rate Adjusted violent crime rate Adjusted violent crime rates for cities in San Diego County - last 10 years 400 Adjusted violent crime rates over the last 10 years: South-west San Diego County CHULA VISTA 200 CORONADO IMPERIAL BEACH NATIONAL CITY 150 POWAY Adjusted violent crime rates over the last 10 years: Eastern San Diego County EL CAJON LA MESA LEMON GROVE OCEANSIDE SAN MARCOS
78 Adjusted violent crime rate 400 Adjusted violent crime rates over the last 10 years: North-west San Diego County CARLSBAD DEL MAR ENCINITAS ESCONDIDO SAN DIEGO SANTEE SOLANA BEACH
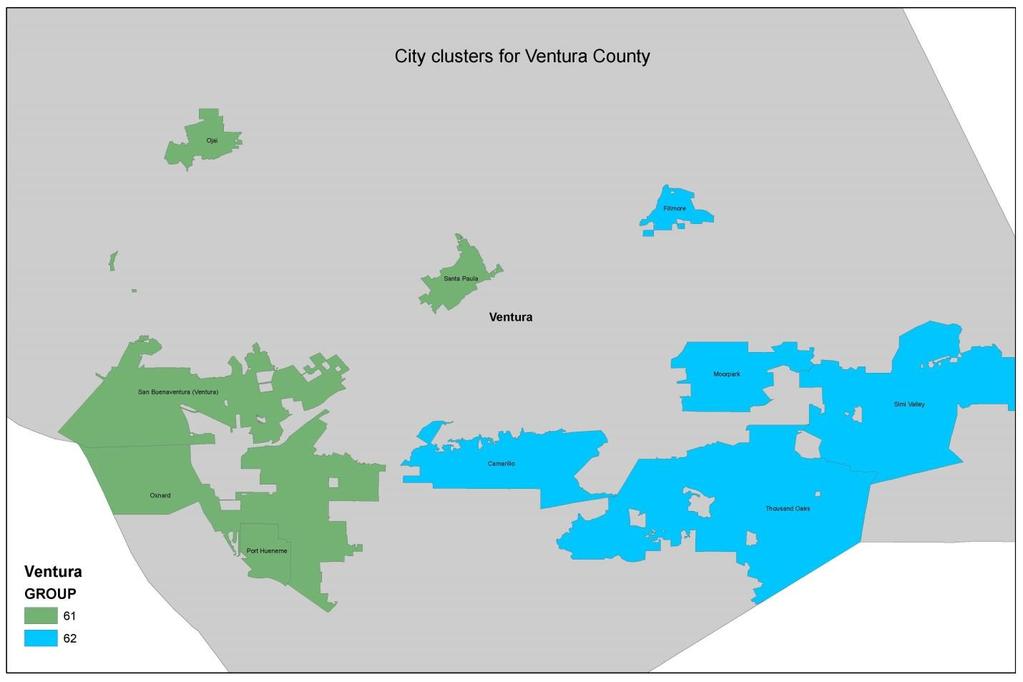
79 Ventura County This section shows the crime rate trends for Ventura County cities. The first table shows the adjusted crime rate in the most recent year (2016) for all cities. The second table shows the average adjusted crime rate over the three most recent years ( ) for all cities. After the two tables, we then display Figures showing the 10 year trajectory of the violent crime rate for the cities in the county. These cities are clustered geographically into city clusters, and the map shows the clustering of cities for these figures. For each Figure, the scale is typically from 0 to 400. Thus, the bottom value is a city with no violent crime, whereas 400 indicates a city with a violent crime rate 300% higher than the regional average ( = 300). For a few of the Figures, we had to extend the scale if certain cities had particularly high violent crime rates. 73
80 Standardized crime rates for cities in Ventura County, 2016 City Assault Robbery Homicide Burglary Auto Theft Larceny Pop 1 CAMARILLO FILLMORE MOORPARK OJAI OXNARD PORT HUENEME SANTA PAULA SIMI VALLEY THOUSAND OAKS VENTURA Standardized crime rates for cities in Ventura County, average from City Assault Robbery Homicide Burglary Auto Theft Larceny Pop 1 CAMARILLO FILLMORE MOORPARK OJAI OXNARD PORT HUENEME SANTA PAULA SIMI VALLEY THOUSAND OAKS VENTURA
81 75
82 Adjusted violent crime rate Adjusted violent crime rate Adjusted violent crime rates for cities in Ventura County - last 10 years 400 Adjusted violent crime rates over the last 10 years: West Ventura County OXNARD 200 PORT HUENEME OJAI SANTA PAULA 150 VENTURA Adjusted violent crime rates over the last 10 years: East Ventura County CAMARILLO FILLMORE MOORPARK SIMI VALLEY THOUSAND OAKS
83 NOTES 77

84 School of Social Ecology Discover Engage Transform The School of Social Ecology is dedicated to interdisciplinary, problem-driven scholarship, teaching, and outreach in the public s interest. Social Ecology s unique focus and expertise has made it a national leader in applying basic theory and empirical research to address complex societal problems. Since 1970, Social Ecology has grown from a few dozen students to more than 2,500, with over 20,000 graduates working in fields as diverse as health care, human services, planning, education, law and public policy. The School is home to three highly ranked departments - Criminology, Law and Society; Urban Planning and Public Policy; and Psychology and Social Behavior - that share a commitment to research that understands human behavior in larger social and institutional contexts, moves beyond traditional disciplinary boundaries, and reaches a diverse and broad audience. UC Irvine School of Social Ecology 5300 Social & Behavioral Sciences Gateway, Irvine, CA secomm@uci.edu
POLITICAL SUBDIVISION 01 DEM 02 REP 03 AI 04 GRN 05 LIB 07 PF 08 MISC 09 DECL Total
 POLITICAL SUBDIVISION COUNTY TOTALS... 191001 1ST SUPERVISORIAL 333,205 107,411 9,241 3,444 2,167 6,344 3,677 119,080 584,569 191002 2ND SUPERVISORIAL 452,314 90,083 10,816 3,529 2,372 5,181 6,772 122,396
POLITICAL SUBDIVISION 01 DEM 02 REP 03 AI 04 GRN 05 LIB 07 PF 08 MISC 09 DECL Total
 POLITICAL SUBDIVISION COUNTY TOTALS... 191001 1ST SUPERVISORIAL 355,485 104,238 9,829 3,099 2,150 5,811 3,734 124,618 608,964 191002 2ND SUPERVISORIAL 473,944 85,948 11,154 3,187 2,210 4,854 6,496 124,642
POLITICAL SUBDIVISION 01 DEM 02 REP 03 AI 04 GRN 05 LIB 07 PF 08 MISC 09 DECL Total
 POLITICAL SUBDIVISION COUNTY TOTALS... 191001 1ST SUPERVISORIAL 353,781 106,422 9,888 3,225 2,189 6,051 3,740 124,849 610,145 191002 2ND SUPERVISORIAL 478,732 88,768 11,422 3,383 2,293 5,116 6,771 127,329
COASTAL SELECT INSURANCE COMPANY
 New business unavailable in the following zip codes: 90001 Los Angeles Los Angeles 90002 Los Angeles Los Angeles 90003 Los Angeles Los Angeles 90004 Los Angeles Los Angeles 90005 Los Angeles Los Angeles
Appendix Table 2 FBI INDEX CRIME RATE PER 1,000 POPULATION BY JURISDICTION San Diego Region, 2000, 2003, and 2004
 Appendix Table 2 FBI INDEX CRIME RATE PER 1,000 POPULATION BY JURISDICTION San Diego Region, 2000, 2003, and 2004 Change 2000 2003 2004 2000-2004 2003-2004 Carlsbad 26.3 27.2 26.2
Percentage and income.
 Blacks The fact that the maps shows a large area of concentrated Black settlement exists in 20 confirms indirectly the fact that Los Angeles County is still quite highly segregated between Blacks and Whites.
COALITION Paid for by Californians Against Higher Taxes
 COALITION California Chamber of Commerce California Taxpayers Association California Association of Independent Business California Restaurant Association California Retailers Association California Small
IS PROPOSITION 47 TO BLAME FOR CALIFORNIA S 2015 INCREASE IN URBAN CRIME?
 IS PROPOSITION 47 TO BLAME FOR CALIFORNIA S 2015 INCREASE IN URBAN CRIME? Mike Males, Ph.D., Senior Research Fellow Center on Juvenile and Criminal Justice March 2016 Research Report Introduction In November
PROPERTY TAX RATES FOR FY FOR TAXING AGENCIES IN ORANGE COUNTY
 Attachment 1 PROPERTY TAX RATES FOR FY 2016-17 FOR TAXING AGENCIES IN ORANGE COUNTY COMPILED UNDER THE SUPERVISION OF ERIC H. WOOLERY, CPA ORANGE COUNTY AUDITOR-CONTROLLER 1 PROPERTY TAX RATES FOR FY 2016-17
LOCAL AGENCY FORMATION COMMISSION MEETING AGENDA. Wednesday, April 25, :00 a.m.
 LOCAL AGENCY FORMATION COMMISSION MEETING AGENDA Wednesday, April 25, 2007 9:00 a.m. Room 381B Kenneth Hahn Hall of Administration 500 West Temple Street, Los Angeles 90012 *************************************************************************
GETTING TO 100% HOW CHANGING THE ELECTION DATE CAN IMPROVE VOTER TURNOUT. February 2015
 GETTING TO 100% HOW CHANGING THE ELECTION DATE CAN IMPROVE VOTER TURNOUT February 2015 i ABOUT COMMON CAUSE AUTHORS With a 40-year track record, chapters in 35 states, and nearly 400,000 supporters and
Cities in Orange County California that have passed ordinances restricting persons required to register under Penal Code 290
 City of Aliso Viejo City of Anaheim City of Brea code Chapter 7.60 Child Safety Zones City of Buena Park 8.50.030 Prohibitions 2012 City of Costa Mesa City of Cypress CHAPTER XIII. SEX OFFENDERS PROHIBITED
Dates underlined are regular election dates established by California Elections Code 1000 & 1500.
 Page Feb. April June 8 Type of City of Lake Elsinore Special Recall Shall Thomas Buckley be recalled (removed) from the office of Member? Special Vacancy Primary 7 th Senatorial District General Municipal
CONTENTS 2. Lancaster Station Patrol Area Map Synopsis Incident and Arrest Summary Incident and Arrest Detail Part I Actual Offenses Cleared
 Introduction CONTENTS INTRODUCTION Statistical Introduction Changes Affecting LASD Statistics DEPARTMENT OVERVIEW Patrol Area Map Organization Chart Part I Crime Clock Synopsis Demographic and Geographic
Population. Table Population Growth and Region of Influence,
 3.11 SOCIOECONOMICS 3.11.1 Environmental Setting The environmental setting for this section presents the baseline population, employment, and housing conditions in the vicinity of the Port of Long Beach.
COUNTY-CITY SPECIAL INDEMNITY AGREEMENT. THIS AGREEMENT ( Agreement ), dated for reference purposes on the
, dated for reference purposes on the") COUNTY-CITY SPECIAL INDEMNITY AGREEMENT THIS AGREEMENT ( Agreement ), dated for reference purposes on the day of, 2009, is made and entered into between the County of Los Angeles, hereinafter referred
COUNTY-CITY SPECIAL INDEMNITY AGREEMENT THIS AGREEMENT ( Agreement ), dated for reference purposes on the day of, 2009, is made and entered into between the County of Los Angeles, hereinafter referred
TENTATIVE ANNUAL ELECTION CALENDAR RIVERSIDE COUNTY 2014
 Page Updated 9// Type of Number To Be March 5 Special State Senator Primary rd Senatorial District (Shared with San Bernardino and Los Angeles) Bill Emmerson resigned April 8 April General Municipal Mail
REGIONS SECTION 15 ACSA POLICIES & PROCEDURES
 2018 REGIONS SECTION 15 POLICIES & PROCEDURES Policies: 15.1 Region Governing Boards Each region governing board shall include at least: president, vice president for legislative action, treasurer and
Quiet Revolution in California Local Government Gains Momentum
 Quiet Revolution in California Local Government Gains Momentum Justin Levitt, Ph.D. Douglas Johnson, Ph.D. With assistance from: Tyler Finn 17 Tim PLummer 17 Ellen Lempres 18 Shivani Pandya 18 Skip Wiltshire-Gordon
2018 ANNUAL ELECTION CALENDAR RIVERSIDE COUNTY
 08 ANNUAL ELECTION CALENDAR Page of April 0 June 5 Number To Be General Municipal Mail Ballot City of Rancho Mirage 3 Consolidated Primary Congressional Offices: United States Senator United States Representative
Dates underlined are regular election dates established by California Elections Code 1000 & 1500.
 Feb. April June 8 ANNUAL ELECTION CALENDAR 00 Type of City of Lake Elsinore Special Recall Shall Thomas Buckley be recalled (removed) from the office of Member? Consolidated Special State Senator Vacancy
First District. Qualifying Zipcodes* (below 200% Federal Poverty Level) for Proposed Local Worker Hiring Program (May 2016)
 for Proposed Local Worker Hiring Program (May 2016)") First District 90005 Koreatown (City of LA) 90006 Pico Heights (City of LA) 90007 South Central (City of LA) 90011 South Central (City of LA) 90012 Civic Center (City of LA)/Chinatown (City of LA) 90013
First District 90005 Koreatown (City of LA) 90006 Pico Heights (City of LA) 90007 South Central (City of LA) 90011 South Central (City of LA) 90012 Civic Center (City of LA)/Chinatown (City of LA) 90013
Understanding Transit s Impact on Public Safety
 Understanding Transit s Impact on Public Safety June 2009 401 B Street, Suite 800 San Diego, CA 92101-4231 Phone 619.699.1900 Fax 619.699.1905 Online www.sandag.org UNDERSTANDING TRANSIT S IMPACT ON PUBLIC
City Crime Rankings
 City Crime Rankings 2008-2009 Methodology The crimes tracked by the UCR Program include violent crimes of murder, rape, robbery, and aggravated assault and property crimes of burglary, larceny-theft, and
REGULAR MEETING of the Board of Directors of the Clean Power Alliance of Southern California Thursday, December 13, 2018, 2:00 p.m.
 REGULAR MEETING of the Board of Directors of the Clean Power Alliance of Southern California Thursday,, 2:00 p.m. Metro Headquarters, 4th Floor, Plaza View Room One Gateway Plaza, Los Angeles, CA 90012
Message from the Registrar of Voters
 Message from the Registrar of Voters October 15, 2013 Dear Voter, The electorate in Los Angeles County accounts for more than one out of every four registered voters in California. On Tuesday, November
info Poverty in the San Diego Region SANDAG December 2013
 info December 2013 SANDAG Poverty in the San Diego Region Table of Contents Overview... 3 Background... 3 Federal Poverty Measurements... 4 Poverty Status for Individuals in the San Diego Region... 6 Demographic
REGULAR MEETING of the Executive Committee of the. Clean Power Alliance of Southern California. Thursday, September 20, :30 p.m.
 REGULAR MEETING of the Executive Committee of the Clean Power Alliance of Southern California Thursday, September 20, 2018 1:30 p.m. 555 West 5 th Street, 35 th Floor Los Angeles, CA 90013 Meetings are
THE STATE OF THE UNIONS IN 2011: A PROFILE OF UNION MEMBERSHIP IN LOS ANGELES, CALIFORNIA AND THE NATION 1
 THE STATE OF THE UNIONS IN 2011: A PROFILE OF UNION MEMBERSHIP IN LOS ANGELES, CALIFORNIA AND THE NATION 1 Lauren D. Appelbaum UCLA Institute for Research on Labor and Employment 2 Ben Zipperer University
ECONOMIC REPORT. Over the 25 year history of the Inland Empire Quarterly Economic INLAND EMPIRE QUARTERLY. 25 th Anniversary Issue:
 INLAND EMPIRE QUARTERLY ECONOMIC REPORT RIVERSIDE & SAN BERNARDINO COUNTIES, CALIFORNIA VOL. 25 NO. 1 JANUARY 2013 $5.00 25 th Anniversary Issue: Major Issues Facing The Inland Empire John E. Husing, Ph.D.
GREATER LOS ANGELES COUNTY VECTOR CONTROL DISTRICT MINUTES NO
 GREATER LOS ANGELES COUNTY VECTOR CONTROL DISTRICT MINUTES NO. 2011-02 A regular meeting of the Board of Trustees of the Greater Los Angeles County Vector Control District was held at 7:00p.m. on Thursday,
Guide to the David Kelley Papers
 http://oac.cdlib.org/findaid/ark:/13030/c8988952 No online items Guide to the David Kelley Papers California State Archives 1020 "O" Street Sacramento, California 95814 Phone: (916) 653-2246 Fax: (916)
Riverside Labor Analysis. November 2018
 November 2018 The City of Labor Market Dynamics and Local Cost of Living Analysis Executive Summary The City of is located in one of the fastest growing parts of California. Over the period 2005-2016,
INFORMATIONAL BULLETIN # 221
 Los Angeles County Office of Education 9300 Imperial Highway, Downey, California 90242-2890 (562) 922-6111 Arturo Delgado, Ed.D., Superintendent INFORMATIONAL BULLETIN # 221 April 4, 2012 TO: FROM: Business
Crime in Oregon Report
 Crime in Report June 2010 Criminal Justice Commission State of 1 Crime in Violent and property crime in has been decreasing since the late s. In ranked 40 th for violent crime and 23 rd for property crime;
Edging Toward Equity? Justice, Scale, and Movement-building in the New Regionalism
 Edging Toward Equity? Justice, Scale, and Movement-building in the New Regionalism University of California, Santa Cruz Cornell University Ithaca, NY December 1, 2006 There s Something Happening Here...
UC POLICE DEPARTMENT REPORTS DASHBOARD
 UC POLICE DEPARTMENT REPORTS DASHBOARD UC SAN DIEGO Annual 1. UC San Diego FBI Part I Crime 2 2. UC San Diego FBI Part II Crime 3 3. UC San Diego Arrests - FBI Crime 4 4. UC San Diego Value of Stolen and
A RESOLUTION IN OPPOSITION TO AB 57 ( QUIRK) CHANGES TO THE APPROVAL PROCESS FOR APPLICATIONS RELATED TELECOMMUNICATION FACILITIES
 CHANGES TO THE APPROVAL PROCESS FOR APPLICATIONS RELATED TELECOMMUNICATION FACILITIES") CITY COUNCIL AUGUST 3, 2015 CONSENT CALENDAR SUBJECT: A RESOLUTION IN OPPOSITION TO AB 57 ( QUIRK) CHANGES TO THE APPROVAL PROCESS FOR APPLICATIONS RELATED TO THE SITING AND CONSTRUCTION OF WIRELESS TELECOMMUNICATION
CITY COUNCIL AUGUST 3, 2015 CONSENT CALENDAR SUBJECT: A RESOLUTION IN OPPOSITION TO AB 57 ( QUIRK) CHANGES TO THE APPROVAL PROCESS FOR APPLICATIONS RELATED TO THE SITING AND CONSTRUCTION OF WIRELESS TELECOMMUNICATION
UC POLICE DEPARTMENT REPORTS DASHBOARD
 UC POLICE DEPARTMENT REPORTS DASHBOARD UC SAN DIEGO Annual 1. UC San Diego FBI Part I Crime. UC San Diego FBI Part II Crime 3 3. UC San Diego Arrests - FBI Crime. UC San Diego Value of Stolen and Recovered
Twenty-Five Years of Crime in the San Diego Region: 1981 through 2005
 bulletin CJ Criminal Justice Research Division, SANDAG Twenty-Five Years of Crime in the San Diego Region: 1981 through 2005 April 2006 Criminal Justice Research Division 401 B Street Suite 800 San Diego,
The California Civic Engagement Project Issue Brief
 Increasing Proportions of Vote-by-Mail Ballots In Millions 14 12 10 8 6 4 2 0 1. VBM Use Rates by Sub-Group Youth and Older Voters: Disparities in VBM Use Only voters age 55 and older use VBM at a rate
Three Strikes Analysis:
 Three Strikes Analysis: Comparison of Offense Types in Urban Counties Jessica Jin 16 Katherine Hill 18 Jennifer Walsh, PhD, Project Supervisor May 5, 2016 850 Columbia Avenue Kravis Center 436 Claremont,
ECONOMIC REPORT. There is little disagreement that U.S. economic policies are entering INLAND EMPIRE QUARTERLY
 INLAND EMPIRE QUARTERLY ECONOMIC REPORT RIVERSIDE & SAN BERNARDINO COUNTIES, CALIFORNIA VOL. 29 NO. 1 JANUARY 2017 $5.00 INLAND EMPIRE JOB GROWTH STRENGTHS & VULNERABILITIES John E. Husing, Ph.D. There
The Crime Drop in Florida: An Examination of the Trends and Possible Causes
 The Crime Drop in Florida: An Examination of the Trends and Possible Causes by: William D. Bales Ph.D. Florida State University College of Criminology and Criminal Justice and Alex R. Piquero, Ph.D. University
SENATE COMMITTEE ON GOVERNANCE AND FINANCE Senator Mike McGuire, Chair Regular
 AMENDED ANALYSIS SENATE COMMITTEE ON GOVERNANCE AND FINANCE Senator Mike McGuire, Chair 2017-2018 Regular Bill No: SB 649 Hearing Date: 4/26/17 Author: Hueso Tax Levy: No Version: 3/28/17 Fiscal: Yes Consultant:
ARRESTS IN THE SAN DIEGO REGION 2000
 ARRESTS IN THE SAN DIEGO REGION 2000 NOVEMBER 2001 Criminal Justice Research Division Deana Piazza Donna Allnutt Susan Pennell MEMBER AGENCIES: Cities of Carlsbad, Chula Vista, Coronado, Del Mar, El Cajon,
The California Civic Engagement Project Issue Brief
 Increasing Proportions of Vote-by-Mail Ballots In Millions 14 12 10 8 6 4 2 0 1. VBM Use Rates by Sub-Group Youth and Older Voters: Disparities in VBM Use Only voters age 55 and older use VBM at a rate
CALIFORNIA S 58 CRIME RATES: REALIGNMENT AND CRIME IN 2012
 CALIFORNIA S 58 CRIME RATES: REALIGNMENT AND CRIME IN 2012 Mike Males, Ph.D., Senior Research Fellow Brian Goldstein, Policy Analyst Center on Juvenile and Criminal Justice JANUARY 2014 Research Report
Agenda GATEWAY CITIES SERVICE SECTOR COUNCIL REGULAR MEETING. Thursday, September 13, :00 p.m.
 Thursday, September 13, 2007 2:00 p.m. Agenda Los Angeles County Metropolitan Transportation Authority GATEWAY CITIES SERVICE SECTOR COUNCIL REGULAR MEETING The Gas Company 9240 Firestone Blvd. Downey,
California Police Chiefs Association
 Membership Issues Report Date: October 5, 2016 To: From: Subject: President Ken Corney CPCA Board of Directors Robert M. Lehner, M.B.A., Chief of Police City of Elk Grove Police Department Effects of the
Follow this and additional works at:
 California Law Review Volume 47 Issue 4 Article 3 October 1959 The Branch Court Arthur K. Marshall Follow this and additional works at: https://scholarship.law.berkeley.edu/californialawreview Recommended
GREATER LOS ANGELES COUNTY VECTOR CONTROL DISTRICT MINUTES NO
 GREATER LOS ANGELES COUNTY VECTOR CONTROL DISTRICT MINUTES NO. 2018-06 The regular meeting of the Board of Trustees of the Greater Los Angeles County Vector Control District held at 7:00 p.m. on Thursday,
THE EFFECTIVENESS AND COST OF SECURED AND UNSECURED PRETRIAL RELEASE IN CALIFORNIA'S LARGE URBAN COUNTIES:
 THE EFFECTIVENESS AND COST OF SECURED AND UNSECURED PRETRIAL RELEASE IN CALIFORNIA'S LARGE URBAN COUNTIES: 1990-2000 By Michael K. Block, Ph.D. Professor of Economics & Law University of Arizona March,
This Could Be the Start of Something Big: Looking for the New America
 This Could Be the Start of Something Big: Looking for the New America Manuel Pastor January 2011 La Conyuntura vs. the Long-run We tend to think about short-term politics and economics... 1 La Conyuntura
Public Safety Realignment and Crime Rates in California
 Public Safety Realignment and Crime Rates in California December 2013 Magnus Lofstrom Steven Raphael Supported with funding from the Smith Richardson Foundation AP Photo/Rich Pedroncelli Summary C alifornia
NOTICE OF THE NEXT REGULAR MEETING OF THE BOARD OF TRUSTEES OF THE LOS ANGELES COUNTY WEST VECTOR & VECTOR-BORNE CONTROL DISTRICT
 Los Angeles County West Vector & Vector-Borne Disease Control District 6750 Centinela Avenue, Culver City, California 90230 (310) 915-7370 ext. 223 Email: rsaviskas@lawestvector.org BOARD OF TRUSTEES President
HOUSTON REGION. NET DISPLACEMENT (Low-Income Change in Tracts with Strong Expansion, )
") HOUSTON REGION The Houston region has undergone significant population growth since 2000. About 13 percent of regional population lives in a census tract that has undergone strong economic expansion, while
HOUSTON REGION The Houston region has undergone significant population growth since 2000. About 13 percent of regional population lives in a census tract that has undergone strong economic expansion, while
AGENDA I. DETERMINATION OF A QUORUM PUBLIC COMMENT
 REGULAR MEETING OF THE INTER-AGENCY COMMITTEE OF THE BOARD OF DIRECTORS WATER REPLENISHMENT DISTRICT OF SOUTHERN CALIFORNIA 12621 E. 166th Street (Corner, Bloomfield & 166th), Cerritos, California 10:00
IMPORTANT ANNOUNCEMENT: MOOSE
 Regional Manager s CNMA Moose Gazette from Charlie Lopez Regional Manager Sent: Tuesday, April 27, 2010 10:57 AM Subject: CNMA GAZETTE IMPORTANT ANNOUNCEMENT: MOOSE of the YEAR, ROOKIE of the YEAR, CO-WORKER
1: HOW DID YOUTH VOTER TURNOUT DIFFER FROM THE REST OF THE 2012 ELECTORATE?
 March 2013 The Califor nia Civic Enga gement Project CALIFORNIA'S 2012 YOUTH VOTER TURNOUT: DISPARATE GROWTH AND REMAINING CHALLENGES Boosted by online registration, the youth electorate (ages 18-24) in
FOR IMMEDIATE RELEASE
 ! FOR IMMEDIATE RELEASE May 3, 2018 Contact: Sage Welch 415.453.0430 New studies track low-wage earners fleeing California, even as the number of low-paying jobs increase High-wage earners continue to
BYLAWS of the CALIFORNIA SOCIETY OF ANESTHESIOLOGISTS (CSA)
") Phone (916) 290 5830 Fax (916) 444 7462 Web csahq.org Address One Capitol Mall, Suite 800 Sacramento, CA 95814 BYLAWS of the CALIFORNIA SOCIETY OF ANESTHESIOLOGISTS (CSA) A Corporation Chartered Under
Phone (916) 290 5830 Fax (916) 444 7462 Web csahq.org Address One Capitol Mall, Suite 800 Sacramento, CA 95814 BYLAWS of the CALIFORNIA SOCIETY OF ANESTHESIOLOGISTS (CSA) A Corporation Chartered Under
California Senate Redistricting Plan
 California Senate Redistricting Plan Submitted July 31, 21 Sacramento, California Mexican American Legal Defense And Educational Fund & William C. Velasquez Institute TABLE OF CONTENTS Executive Summary
REQUEST FOR CITY COUNCIL ACTION
 REQUEST FOR CITY COUNCIL ACTION / MEETING DATE: OCTOBER 10, 2017 TITLE: MEMORANDUM OF UNDERSTANDING BETWEEN THE DEPARTMENT OF PUBLIC SAFETY AND THE TRANSPORTATION CORRIDOR AGENCIES FOR SERGEANT. ~SERVICES
Near Westside Neighborhood Indianapolis, IN
 LISC Sustainable Communities Initiative Neighborhood Quality Monitoring Report Neighborhood Indianapolis, IN Baseline Report: May 2011 With Revisions: June 2014 Neighborhood Table of Contents INTRODUCTION...
August 16, The Honorable Fran Pavley State Capitol, Room 5108 Sacramento, CA 95814
 BizFed's Member Alliance AIA Los Angeles Alhambra Chamber American Beverage Association Antelope Valley Board of Trade Apartment Association, California Southern Cities Apartment Association of Greater
LA Distribution Points
 LA Distribution Points This metro distribution delivers your press releases across the most targeted distribution in the country, reaching traditional, online and social media. Distribution includes print
Three Strikes Analysis: Urban vs. Rur al Counties
 Three Strikes Analysis: Urban vs. Rur al Counties Jessica Jin 16 Jennifer Walsh, PhD, Project Supervisor May 3, 216 85 Columbia Avenue Kravis Center 436 Claremont, CA 91711-642 P: (99) 621-8159 E: roseinstitute@cmc.edu
Southeast Neighborhood Indianapolis, IN
 LISC Sustainable Communities Initiative Neighborhood Quality Monitoring Report Neighborhood Indianapolis, IN Baseline Report: December 2011 With Revisions: June 2014 Neighborhood Table of Contents INTRODUCTION...
AGENDA. 5. WRD EDUCATION OUTREACH Staff Recommendation: For discussion and possible action.
 SPECIAL MEETING OF THE EXTERNAL AFFAIRS COMMITTEE WATER REPLENISHMENT DISTRICT OF SOUTHERN CALIFORNIA 4040 PARAMOUNT BLVD., LAKEWOOD, CA. 90712 12:00 PM, WEDNESDAY, DECEMBER 12, 2018 AGENDA Each item on
Readers Guidance: This chapter includes updates to the subject from that reported in the Draft EIR/EIS in April 2004.
 Readers Guidance: This chapter includes updates to the subject from that reported in the Draft EIR/EIS in April 2004. THIS PAGE INTENTIONALLY BLANK CHAPTER 6 - AGENCY COORDINATION 6-1 FEDERAL AGENCIES
Gentrification is rare in the Orlando region, while a moderate number of neighborhoods are strongly declining.
 ORLANDO REGION Gentrification is rare in the Orlando region, while a moderate number of neighborhoods are strongly declining. One in four regional residents live in an area that experienced strong decline
Community Well-Being and the Great Recession
 Pathways Spring 2013 3 Community Well-Being and the Great Recession by Ann Owens and Robert J. Sampson The effects of the Great Recession on individuals and workers are well studied. Many reports document
CITY OF SANTA ROSA CITY COUNCIL MAYOR AND CITY COUNCIL PROPOSED AMENDMENTS TO LEAGUE OF CALIFORNIA CITIES BYLAWS
 CITY OF SANTA ROSA CITY COUNCIL Agenda Item #10.1 For Council Meeting of: April 16, 2013 TO: SUBJECT: STAFF PRESENTER: MAYOR AND CITY COUNCIL PROPOSED AMENDMENTS TO LEAGUE OF CALIFORNIA CITIES BYLAWS KATHLEEN
TELECONFERENCE MEETING LOCATIONS: Call In Information: Call In Number: Participant Number: #
 MEMBER CITIES Alhambra Apple Valley Azusa Baldwin Park Barstow Bell Bellflower Brea Capitola Carpinteria Carson Chino Claremont Colton Commerce Compton Covina Downey Duarte El Monte Fairfield Fontana Fresno
Orange County Transportation Authority
 Orange County Transportation Authority May 23, 2018 Keeping Orange County Moving Overview OCTA s FY 18-19 Budget SB 1 OC Streetcar Project I-405 Improvement Project I-5 Widening (SR-73 to El Toro) SR-55
CITY OF PUNTA GORDA POLICE DEPARTMENT I N T E R O F F I C E M E M O R A N D U M
 CITY OF PUNTA GORDA POLICE DEPARTMENT I N T E R O F F I C E M E M O R A N D U M To: Howard Kunik, City Manager From: Albert A. Arenal, Chief of Police Date: Subject: Florida Department of Law Enforcement
MINUTES ORANGE COUNTY FIRE AUTHORITY
 MINUTES ORANGE COUNTY FIRE AUTHORITY Board of Directors Regular Meeting Thursday, January 28, 2010 6:30 P.M. Regional Fire Operations and Training Center Board Room 1 Fire Authority Road Irvine, CA 92602-0125
Preliminary Report #1: 49 th Congressional District Strategy Analysis
 Preliminary Report #1: 49 th Congressional District Strategy Analysis February 6, 2017 Steven Koller (JD, PhD) is analyzing the 49 th Congressional District with the objective of providing an information
THE STATE OF THE UNIONS IN 2009: A PROFILE OF UNION MEMBERSHIP IN LOS ANGELES, CALIFORNIA AND THE NATION 1
 THE STATE OF THE UNIONS IN 2009: A PROFILE OF UNION MEMBERSHIP IN LOS ANGELES, CALIFORNIA AND THE NATION 1 Lauren D. Appelbaum UCLA Institute for Research on Labor and Employment Ben Zipperer University
Kia Motors/Los Angeles Clippers Slam Dunk Deal Ticket Offer TERMS AND CONDITIONS
 Kia Motors/Los Angeles Clippers Slam Dunk Deal Ticket Offer TERMS AND CONDITIONS OFFER BEGINS ON NOVEMBER 14, 2014 AND ENDS ON JANUARY 16, 2015 ( OFFER PERIOD ). The Kia Motors America, Inc. ( Kia )/Los
The Inland Empire in Hans Johnson Joseph Hayes
 The Inland Empire in 2015 Hans Johnson Joseph Hayes Inland Empire: Tremendous Growth and Change Strong population growth Increasing diversity Sustained economic growth* 2 PPIC Developed 2015 Projections
COMPARATIVE ANALYSIS OF NEIGHBORHOOD CONTEXTS: ANNIE E. CASEY FOUNDATION CITIES
 ANNIE E. CASEY FOUNDATION MAKING CONNECTIONS INITIATIVE COMPARATIVE ANALYSIS OF NEIGHBORHOOD CONTEXTS: ANNIE E. CASEY FOUNDATION CITIES G. Thomas Kingsley and Kathryn L.S. Pettit December 2003 THE URBAN
RIVERSIDE COMMUNITY COLLEGE DISTRICT BOARD OF TRUSTEES. Subject: CCCT Board of Directors Election 2011
 RIVERSIDE COMMUNITY COLLEGE DISTRICT BOARD OF TRUSTEES Report No.: X-B DATE: Subject: CCCT Board of Directors Election 2011 Background: The nomination for membership on the CCCT Board of Directors are
Preliminary Effects of Oversampling on the National Crime Victimization Survey
 Preliminary Effects of Oversampling on the National Crime Victimization Survey Katrina Washington, Barbara Blass and Karen King U.S. Census Bureau, Washington D.C. 20233 Note: This report is released to
Review of Orange County Detention Facilities
 Review of Orange County Detention Facilities Review of Orange County Detention Facilities SUMMARY The 2010-2011 Grand Jury has completed an inspection of all the detention facilities in Orange County under
FEDERAL RESERVE BANK OF SAN FRANCISCO
 FEDERAL RESERVE BANK OF SAN FRANCISCO 101 MARKET STREET, SAN FRANCISCO, CALIFORNIA 94105 October 8, 2010 ELECTION OF DIRECTORS NOMINATION PROCEDURES To the Member Banks of the Twelfth Federal Reserve District
Rutgers Center on Law, Inequality & Metropolitan Equity
 Rutgers Center on Law, Inequality & Metropolitan Equity Displacement Risk and Gentrification: The CLiME Displacement Risk Indicators Matrix (DRIM) Methodology A CLiME Research Brief November 2017 By David
GREATER LOS ANGELES COUNTY VECTOR CONTROL DISTRICT MINUTES NO
 GREATER LOS ANGELES COUNTY VECTOR CONTROL DISTRICT MINUTES NO. 2012-10 The regular meeting of the Board of Trustees of the Greater Los Angeles County Vector Control District was held at 7:00 p.m. on Thursday,
Arrests 2017: Law Enforcement Response to Crime in the San Diego Region
 Arrests 2017: Law Enforcement Response to Crime in the San Diego Region DECEMBER 2018 CJ Research findings from the Criminal Justice Clearinghouse 401 B STREET, SUITE 800 SAN DIEGO, CA 92101-4231 T (619)
AGENDA. BOARD OF DIRECTORS REGULAR MEETING Thursday, March 15, :00 P.M.
 ORANGE COUNTY FIRE AUTHORITY AGENDA BOARD OF DIRECTORS REGULAR MEETING Thursday, March 15, 2018 6:00 P.M. Regional Fire Operations and Training Center Board Room 1 Fire Authority Road Irvine, CA 92602
C J. Thirty Years of Crime in the San Diego Region: 1983 through April bulletin. Cynthia Burke, Ph.D.
 bulletin C J Criminal Justice Research Division, SANDAG Thirty Years of Crime in the San Diego Region: 1983 through 2012 April 2013 Cynthia Burke, Ph.D. Division Director 401 B Street Suite 800 San Diego,
Report to City Council. Marshall Eyerman, Chief Financial Officer
 Report to City Council TO: FROM: Mayor and City Council Marshall Eyerman, Chief Financial Officer AGENDA DATE: August 4, 2016 TITLE: A RESOLUTION AMENDING RESOLUTION NO. 2016-44 TO RESTATE AND REPLACE
GREATER LOS ANGELES COUNTY VECTOR CONTROL DISTRICT MINUTES NO
 GREATER LOS ANGELES COUNTY VECTOR CONTROL DISTRICT MINUTES NO. 2017-07 The regular meeting of the Board of Trustees of the Greater Los Angeles County Vector Control District was held at 7:00 p.m. on Thursday,
Union Members and Gainful Workers in Los Angeles, 1930 to 1950
 FIGURE 1.1 1000 800 Union Members and Gainful Workers in Los Angeles, 1930 to 1950 Gainful Workers Union Members (Thousands) 600 400 200 0 1930 1933 1934 1935 1938 1939 1940 1943 1944 1945 1946 1947 1948
Great Gatsby Curve: Empirical Background. Steven N. Durlauf University of Wisconsin
 Great Gatsby Curve: Empirical Background Steven N. Durlauf University of Wisconsin 1 changes have taken place in ghetto neighborhoods, and the groups that have been left behind are collectively different
ECONOMIC REPORT INLAND EMPIRE QUARTERLY. Major Forces That Will Economy in 2015
 INLAND EMPIRE QUARTERLY ECONOMIC REPORT RIVERSIDE & SAN BERNARDINO COUNTIES, CALIFORNIA VOL. 27 NO. 1 JANUARY 2015 Major Forces That Will Impact The Inland Empire Economy in 2015 John E. Husing, Ph.D.
Summary and Interpretation of the Federal Bureau of Investigation s Uniform Crime Report, 2005
 Research Corporation September 25, 2006 Summary and Interpretation of the Federal Bureau of Investigation s Uniform Crime Report, 2005 Sandra J. Erickson, MFS Research Associate Rosemary J. Erickson, Ph.D.
Occupa on Overview. Centers of Excellence. Emsi Q Data Set. September Emsi Q Data Set
 Occupa on Overview Emsi Q3 2018 Data Set September 2018 Centers of Excellence 1410 Ethan Way Sacramento, California 95825 Emsi Q3 2018 Data Set www.economicmodeling.com Page 1/14 Parameters Occupa ons
ECONOMIC REPORT. One of the questions constantly asked about the Inland Empire s INLAND EMPIRE QUARTERLY. Strategy
 INLAND EMPIRE QUARTERLY ECONOMIC REPORT R I V E R S I D E & S A N B E R N A R D I N O C O U N T I E S, C A L I F O R N I A VOL. 23 NO. 3 JULY 2011 $5.00 Developing A High-End Inland Empire Economic Strategy