This Could Be the Start of Something Big: Looking for the New America
|
|
|
- Daniella Morris
- 5 years ago
- Views:
Transcription


1 This Could Be the Start of Something Big: Looking for the New America Manuel Pastor January 2011 La Conyuntura vs. the Long-run We tend to think about short-term politics and economics... 1


2 La Conyuntura vs. the Long-run We tend to think about short-term politics and economics... La Conyuntura vs. the Long-run We tend to think about short-term politics and economics But we better look longterm as well. If we do, three trends demographic change, economic transition, and shifting nature of leadership stand out as key 2


3 Change is Gonna Come... Leading the U.S. in Demographic Change California's Changing Demographics, % 90% 80% 5.3% 19.4% 9.2% 26.0% 11.3% 70% 7.5% 32.6% 60% 7.0% 50% 6.5% 40% 30% 20% 67.1% 57.2% 47.1% 10% 0% Anglo African American Latino Asian Pacific Other 3

4 Immigration as a Factor Immigrants are: One in three L.A. County residents 46 percent of the LA County workforce And currently... Children of immigrants are 64 percent of all LA County children Of the children of immigrant parents, nearly ninety percent are US citizens Source: PERE analysis of 2006 ACS data 4


5 Foreign Born Population by Census Tract Ancestry & Migration Migrated Over 30 Years Ago Los Angeles County Chinese, 5.0% Filipino, 4.8% Other, 3.3% Korean, 3.2% Western European, 9.7% Other Latin American, 11.6% Salvadoran, 3.1% Other Eastern European, 2.9% Guatemalan, 1.8% Japanese, 1.7% Other, 8.5% Armenian, 1.5% Other Asian, 1.4% Asian Indian, 1.0% Other Middle Eastern, 1.0% Vietnamese, 0.9% Mexican, 44.6% Iranian, 0.9% African, 0.6% Russian, 0.6% Taiwanese, 0.4% South Asian, 0.2% Source: PERE analysis of 2005 and 2006 ACS data 5
6 Ancestry & Migration Korean, 6.0% Migrated within the Last 10 Years Los Angeles County Guatemalan, 5.3% Salvadoran, 4.8% Armenian, 3.4% Chinese, 7.1% Other, 3.3% Western European, 2.7% Asian Indian, 2.5% Japanese, 2.1% Other Asian, 1.9% Filipino, 7.1% African, 1.6% Iranian, 1.4% Other, 14.0% Other Latin Other Eastern American, 9.5% European, 1.4% Other Middle Eastern, 1.3% Vietnamese, 1.2% Russian, 1.2% Mexican, 36.3% Taiwanese, 1.0% South Asian, 0.9% Source: PERE analysis of 2005 and 2006 ACS data Ancestry & Migration Korean, 6.0% Migrated within the Last 10 Years Los Angeles County Guatemalan, 5.3% Salvadoran, 4.8% Armenian, 3.4% Other, 3.3% Filipino, 7.1% Chinese, 7.1% Western European, 2.7% Asian Indian, 2.5% Japanese, 2.1% Other Asian, 1.9% African, 1.6% Iranian, 1.4% Other, 14.0% Other Latin Other Eastern American, 9.5% European, 1.4% Other Middle Eastern, 1.3% Vietnamese, 1.2% Russian, 1.2% Mexican, 36.3% Taiwanese, 1.0% South Asian, 0.9% Source: PERE analysis of 2005 and 2006 ACS data 6
7 Ancestry & Migration Chinese, 7.1% Migrated within the Last 10 Years Los Angeles County Guatemalan, 5.3% Korean, 6.0% Salvadoran, 4.8% Armenian, 3.4% Other, 3.3% Western European, 2.7% Asian Indian, 2.5% Japanese, 2.1% Other Asian, 1.9% Filipino, 7.1% African, 1.6% Iranian, 1.4% Other, 14.0% Other Latin Other Eastern American, 9.5% European, 1.4% Other Middle Eastern, 1.3% Vietnamese, 1.2% Russian, 1.2% Mexican, 36.3% Taiwanese, 1.0% South Asian, 0.9% Source: PERE analysis of 2005 and 2006 ACS data Ancestry & Migration Migrated within the Last 10 Years Los Angeles County Korean, 6.0% Guatemalan, 5.3% Salvadoran, 4.8% Armenian, 3.4% Chinese, 7.1% Other, 3.3% Western European, 2.7% Asian Indian, 2.5% Japanese, 2.1% Other Asian, 1.9% Filipino, 7.1% African, 1.6% Iranian, 1.4% Other, 14.0% Other Latin Other Eastern American, 9.5% European, 1.4% Other Middle Eastern, 1.3% Vietnamese, 1.2% Russian, 1.2% Mexican, 36.3% Taiwanese, 1.0% South Asian, 0.9% Source: PERE analysis of 2005 and 2006 ACS data 7
8 Ancestry & Migration Korean, 6.0% Migrated within the Last 10 Years Los Angeles County Guatemalan, 5.3% Salvadoran, 4.8% Armenian, 3.4% Chinese, 7.1% Other, 3.3% Western European, 2.7% Asian Indian, 2.5% Japanese, 2.1% Other Asian, 1.9% Filipino, 7.1% African, 1.6% Iranian, 1.4% Other, 14.0% Other Latin Other Eastern American, 9.5% European, 1.4% Other Middle Eastern, 1.3% Vietnamese, 1.2% Russian, 1.2% Mexican, 36.3% Taiwanese, 1.0% South Asian, 0.9% Source: PERE analysis of 2005 and 2006 ACS data South Central Area: Overview Los Angeles Glendale South Central Montebello Inglewood Compton County Boundaries Los Angeles City Boundaries South Central Area Boundaries Long Beach Santa Ana N d:/data/gisca/scag_js_02.apr - field: 2000 counties - view: South Central - layout: SouthCentral_overview Scale equals: 1 to 450,000 8
9 South Central High School Demographics School Year 1% 2% 1% 2% 1% 7% 10% 7% 31% 42% 99% 91% 90% 98% 93% 68% 57% Other Latino African American Crenshaw Washington Prep Jefferson Jordan Locke Manual Arts Fremont South Central High School Demographics School Year 1% 1% 30% 44% 63% 92% 80% 80% 88% 70% 55% 37% Other Latino African American 7% 20% 20% 12% Crenshaw Washington Prep Jefferson Jordan Locke Manual Arts Fremont 9

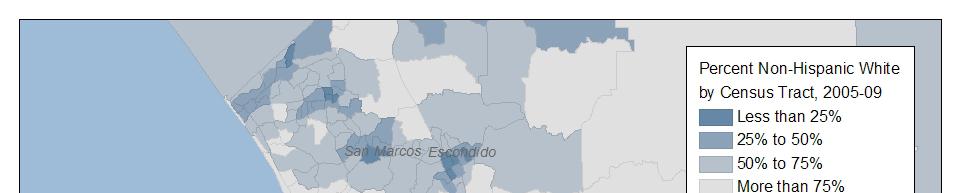


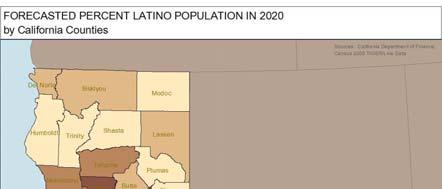
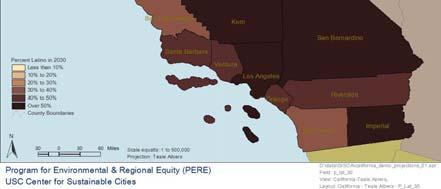
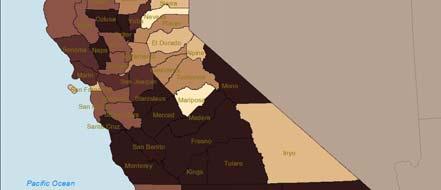
10 San Diego San Diego 10


11 San Diego San Diego 11


12 San Diego San Diego 12
13 California Looking Forward, California Demographic Projections, California Department of Finance 100% 90% 80% 6.5% 6.7% 6.7% 6.6% 6.5% 6.4% 11.0% 12.0% 12.7% 12.8% 12.5% 12.1% Multirace American Indian Percen nt of Total Population 70% 60% 50% 40% 30% 20% 10% 32.6% 47.1% 38.7% 39.2% 43.0% 33.7% 46.8% 29.5% 50.4% 53.6% 26.1% 23.3% Black Pacific Islander Asian Hispanic White 0% Year California Looking Forward, California Demographic Projections, California Department of Finance 60,000,000 Multirace 50,000,000 American Indian Total Population 40,000,000 30,000,000 20,000,000 Black Pacific Islander Asian 10,000,000 Hispanic White Year 13
14 14
15 15
16 16
17 100% The Future is Now... Ethnic Composition by Age for California, % 80% 70% 60% 50% 40% 30% 20% 10% Other or Mixed Race Asian Pacific Latino African American Non Hispanic White 0% >65 The Future is Now... 17


18 As Is the Underinvestment Demographics and State Capital Spending Adjusted for Income capita nding capital outlays adjusted for per c e (100 = average of U.S. states) Per capita state spen income % 5% 10% 15% 20% 25% 30% 35% 40% percent age/ethnic difference Demography and Economic Inclusion Dramatic crack in the economy, with significant policy attention to the Great Recession With skyrocketing unemployment, foreclosures and budget issues, the shortterm focus makes sense But looking long-term, another set of worries emerges around the distribution of opportunity 18
19 The Challenge of Inequality... 25% Income Distribution in the U.S., % percent of income 15% 10% Top 1% (incomes above $398,900 in 2007) 5% Top 5 1% (incomes between $155,400 and $398,900) Top 10 5% (incomes between $109,600 and $155,400) 0% Source: Emmanuel Saez, Striking It Richer: The Evolution of Top Incomes in the United States (Update : August 5, 2009). The Challenge of Inequality... $90,000 Figure 3 1. U.S. Resident Median Family Income (in 2007 Dollars) $80, $70,000 Asian and Pacific Islander $60,000 Non-Hispanic White $50,000 $40,000 $30,000 White Latino $20,000 Black $10,000 $


regional")
 previous income (?)region of U.S.")
20 Putting It Together Unequal Deregulated Disconnected So the new story emerging in our book: equity is key to growth What s the Evidence? Utilizing weighted regression approach to 341 metro areas in the U.S Per capita income as a function of: (+)regional education (-) manufacturing concentration (+)central city presence (-) previous income (?)region of U.S. (-) measure of inequity, including ratio of city to suburb poverty, concentration of poverty, income distribution, black-white segregation 20


21 And From the Federal Reserve Federal Reserve of Cleveland studies almost 120 mid-size regions, looking for factors that predict regional prosperity Usual suspects: skilled workforce, quality of life, industrial decline Unusual suspects: income inequality, racial exclusion, concentration of poverty and they re highly significant It s a Broader Story Underinvestment in each other makes us less competitive as a nation Social tensions over who Social tensions over who will gain and who will lose make us less likely to cohere on what we need to do to thrive 21


22 And a Broader Conversation We set out in the book to generate a catalog of best practices for combining equity & economic growth But when we talked to leaders, the conversation was not about zoning regs, tax-sharing, or policy per se Instead, it was about reframing a local and national conversation about social equity and who we are as a people, a region, a country Starting at Home... Metros offer new scale for doing well and doing good, fusing competitive- ness and inclusion Configuration of metropolitan space and opportunity has become center from racial justice to spatial justice Metros offer new opportunities to bridge difference face-to-face, raceto-race, space-to-space 22


23 Leadership and Governance Need to rethink our cherished beliefs Need to think about inside and outside skills and strategies Need to innovate not just for efficiency but for effectiveness Need to govern not manage & lead by example not position How Do We Lead in These Times? Understanding the distinction between diversity and justice 23

24 How Do We Lead in These Times? Understanding the distinction between diversity and justice Understanding the importance of policy, advocacy and organizing How Do We Lead in These Times? Understanding the distinction between diversity and justice Understanding the importance of policy, advocacy and organizing Understanding the need for unexpected alliances, and new collaborations Understanding that collaboration and conflict can go together 24


25 Can We Meet Our Challenges? Can We Meet Our Challenges? 25
SMART GROWTH, IMMIGRANT INTEGRATION AND SUSTAINABLE DEVELOPMENT
 SMART GROWTH, IMMIGRANT INTEGRATION AND SUSTAINABLE DEVELOPMENT Manuel Pastor 02/04/2012 U.S. Decadal Growth Rates for Population by Race/Ethnicity, 1980-2010 1980-1990 1990-2000 2000-2010 96.3% 57.9%
DOING GOOD AND DOING WELL: WHY EQUITY MATTERS FOR SUSTAINING PROSPERITY IN A CHANGING AMERICA
 DOING GOOD AND DOING WELL: WHY EQUITY MATTERS FOR SUSTAINING PROSPERITY IN A CHANGING AMERICA 11/13 MANUEL PASTOR @Prof_MPastor 1 2 U.S. Change in Youth (
LOOKING FORWARD: DEMOGRAPHY, ECONOMY, & WORKFORCE FOR THE FUTURE
 LOOKING FORWARD: DEMOGRAPHY, ECONOMY, & WORKFORCE FOR THE FUTURE 05/20/2016 MANUEL PASTOR @Prof_MPastor U.S. Change in Youth (
Illegal Immigration: How Should We Deal With It?
 Illegal Immigration: How Should We Deal With It? Polling Question 1: Providing routine healthcare services to illegal Immigrants 1. Is a moral/ethical responsibility 2. Legitimizes illegal behavior 3.
FIVE KEY TRENDS STRUCTURING L.A. S FUTURE AND WHY 2GEN MAKES SENSE
 FIVE KEY TRENDS STRUCTURING L.A. S FUTURE AND WHY 2GEN MAKES SENSE 05/29/2015 MANUEL PASTOR @Prof_MPastor FUTURE-CASTING LOS ANGELES 1. 2. 3. 4. Slowing Demographic Change at Macro-level The Action: Micro-level
Traffic Density and Ethnic Composition in Massachusetts: An Exploratory Study. Rana Charafeddine Boston University School of Public Health
 Traffic Density and Ethnic Composition in Massachusetts: An Exploratory Study Rana Charafeddine Boston University School of Public Health Outline 1. Introduction 2. Research Question 3. Methods 4. Results
Edging Toward Equity? Justice, Scale, and Movement-building in the New Regionalism
 Edging Toward Equity? Justice, Scale, and Movement-building in the New Regionalism University of California, Santa Cruz Cornell University Ithaca, NY December 1, 2006 There s Something Happening Here...
An Equity Assessment of the. St. Louis Region
 An Equity Assessment of the A Snapshot of the Greater St. Louis 15 counties 2.8 million population 19th largest metropolitan region 1.1 million households 1.4 million workforce $132.07 billion economy
Selected National Demographic Trends
 Selected National Demographic Trends Tawara D. Goode Director, Georgetown University National Center for Cultural Competence Assistant Professor, Center for Child and Human Development Spring 2016 University
An Equity Profile of the. Los Angeles Region
 An Equity Profile of the Los Angeles Region Table of contents PolicyLink and PERE 2 3 7 8 14 26 56 66 76 85 89 Summary Foreword Introduction Demographics Economic vitality Readiness Connectedness Neighborhoods
California s Congressional District 37 Demographic Sketch
 4.02.12 California s Congressional District 37 Demographic Sketch MANUEL PASTOR JUSTIN SCOGGINS JARED SANCHEZ Purpose Demographic Sketch Understand the Congressional District s population and its unique
Update to the visible minority classification - a quick overview of the project
 Update to the visible minority classification - a quick overview of the project www.statcan.gc.ca Telling Canada s story in numbers Measuring identity, diversity and inclusion in Canada @ 150 and beyond
Michael Haan, University of New Brunswick Zhou Yu, University of Utah
 The Interaction of Culture and Context among Ethno-Racial Groups in the Housing Markets of Canada and the United States: differences in the gateway city effect across groups and countries. Michael Haan,
An Equity Profile of. Las Cruces
 An Equity Profile of Las Cruces An Equity Profile of Las Cruces PolicyLink and PERE 2 Acknowledgments PolicyLink and the Program for Environmental and Regional Equity (PERE) at the University of Southern
An Equity Profile of the Southeast Florida Region. Summary. Foreword
 An Equity Profile of the Southeast Florida Region PolicyLink and PERE An Equity Profile of the Southeast Florida Region Summary Communities of color are driving Southeast Florida s population growth, and
Labor Force Characteristics by Race and Ethnicity, 2015
 Cornell University ILR School DigitalCommons@ILR Federal Publications Key Workplace Documents 9-2016 Labor Force Characteristics by Race and Ethnicity, 2015 Bureau of Labor Statistics Follow this and additional
Ethno-Racial Inequality in Montreal
 Presentation at the Quebec Inter- Centre for Social Statistics Michael Ornstein Institute for Social Research York 1 February 2008 Quantitative and Qualitative Rich description of ethno-racial groups on
HMDA Race and Ethnicity Reporting Appendix B - Revised as of August 24, 2017
 APPENDIX B TO PART 1003 FORM AND INSTRUCTIONS FOR DATA COLLECTION ON ETHNICITY, RACE, AND SEX * * * * * 8. You must report the ethnicity, race, and sex of an applicant as provided by the applicant. For
Hispanics, Immigration and the Nation s Changing Demographics
 Hispanics, Immigration and the Nation s Changing Demographics Ana Gonzalez-Barrera Senior Researcher Immigration and Demographics U.S. Immigrant Population Reached 45 million in 2015; Projected to be 78.2
An Equity Profile of. Grand Rapids. Supported by: Insert Map
 An Equity Profile of Grand Rapids Supported by: Insert Map An Equity Profile of Grand Rapids Table of contents PolicyLink and PERE 2 3 8 14 24 59 74 85 91 94 Summary Introduction Demographics Economic
Language Needs and Abilities in the Nation s Capital, 2007
 Audrey Singer Senior Fellow Language Needs and Abilities in the Nation s Capital, 2007 Language Access in the District: Five Years in the Making Washington, DC July 15, 2009 Language Major questions Ability
Latinos in Massachusetts Selected Areas: Framingham
 University of Massachusetts Boston ScholarWorks at UMass Boston Gastón Institute Publications Gastón Institute for Latino Community Development and Public Policy Publications 9-17-2010 Latinos in Massachusetts
An Equity Profile of the. City of Detroit. Supported by:
 An Equity Profile of the City of Detroit Supported by: An Equity Profile of the City of Detroit PolicyLink and PERE 2 Acknowledgments PolicyLink and the Program for Environmental and Regional Equity (PERE)
Population Outlook for the Portland-Vancouver Metropolitan Region
 Portland State University PDXScholar Institute of Portland Metropolitan Studies Publications Institute of Portland Metropolitan Studies 2007 Population Outlook for the Portland-Vancouver Metropolitan Region
The Brookings Institution Metropolitan Policy Program Alan Berube, Fellow
 The Brookings Institution Metropolitan Policy Program Alan Berube, Fellow Confronting Concentrated Poverty in Fresno Fresno Works for Better Health September 6, 2006 Confronting Concentrated Poverty in
An Equity Profile of the. Detroit Region
 An Equity Profile of the Detroit Region An Equity Profile of the Detroit Region Table of contents PolicyLink and PERE 2 3 7 13 29 58 68 84 89 Summary Introduction Demographics Economic vitality Readiness
Towards a Policy Actionable Analysis of Geographic and Racial Health Disparities
 Towards a Policy Actionable Analysis of Geographic and Racial Health Disparities Institute of Medicine July 30, 2007 Dolores Acevedo-Garcia, PhD, MPA-URP Associate Professor With funding from W. K. Kellogg
Towards an Asian American, Native Hawaiian and Pacific Islander Health Agenda
 Towards an Asian American, Native Hawaiian and Pacific Islander Health Agenda Deeana Jang, JD Policy Director Asian & Pacific Islander American Health Forum Presentation for AAPCHO Conference March 10,
Le Sueur County Demographic & Economic Profile Prepared on 7/12/2018
 Le Sueur County Demographic & Economic Profile Prepared on 7/12/2018 Prepared by: Mark Schultz Regional Labor Market Analyst Southeast and South Central Minnesota Minnesota Department of Employment and
Racial Disparities in the Direct Care Workforce: Spotlight on Asian and Pacific Islander Workers
 FEBRUARY 2018 RESEARCH BRIEF Racial Disparities in the Direct Care Workforce: Spotlight on Asian and Pacific Islander Workers BY STEPHEN CAMPBELL The final publication in a three-part series focusing on
An Equity Profile of the. Southeast Florida Region
 An Equity Profile of the Southeast Florida Region An Equity Profile of the Southeast Florida Region Table of contents PolicyLink and PERE 2 6 7 8 14 27 55 64 79 83 Foreword Summary Introduction Demographics
The Brookings Institution
 The Brookings Institution Center on Urban and Metropolitan Policy Bruce Katz, Director Census 2000: Key Trends & Implications for Cities Macalester College September 8, 2003 Overview I. II. III. About
Image from: Communities for a Better Environment Website
 The State of Our Neighborhoods Image from: Communities for a Better Environment Website The disproportionate and unequal impact the climate crisis has on people of color and the poor. Pay More for Basic
Patrick Adler and Chris Tilly Institute for Research on Labor and Employment, UCLA. Ben Zipperer University of Massachusetts, Amherst
 THE STATE OF THE UNIONS IN 2013 A PROFILE OF UNION MEMBERSHIP IN LOS ANGELES, CALIFORNIA AND THE NATION 1 Patrick Adler and Chris Tilly Institute for Research on Labor and Employment, UCLA Ben Zipperer
The New U.S. Demographics
 The Brookings Institution Center on Urban and Metropolitan Policy The New U.S. Demographics Audrey Singer Funders Network on Population, Reproductive Health and Rights November 10, 2003 QUESTIONS How has
APPENDIX G DEMOGRAPHICS
 APPENDIX G DEMOGRAPHICS Analyzing current and past demographic data is an important step in defining future transportation needs for individuals living and working in the PPUATS Metropolitan Planning Area.
The EEO Tabulation: Measuring Diversity in the Workplace ACS Data Users Conference May 29, 2014
 The EEO Tabulation: Measuring Diversity in the Workplace ACS Data Users Conference May 29, 2014 Ana J. Montalvo Industry and Occupation Statistics Branch Social, Economic, and Housing Statistics Division
December 12, City of Oxnard Consideration of By-District Elections
 December 12, 2017 City of Oxnard Consideration of By-District Elections Project Timeline 2 Date December 12 January 3 January 5 No later than January 10 January 17 January 29 February 7 February 20 February
Heritage Language Research: Lessons Learned and New Directions
 Heritage Language Research: Lessons Learned and New Directions Terrence G. Wiley President, Center for Applied Linguistics Professor Emeritus, Arizona State University Overview This presentation will provide
Heading in the Wrong Direction: Growing School Segregation on Long Island
 Heading in the Wrong Direction: Growing School Segregation on Long Island January 2015 Heading in the Wrong Direction: Growing School Segregation on Long Island MAIN FINDINGS Based on 2000 and 2010 Census
2013 UCLA Asian American Studies Center. All rights reserved. Asian American Studies Center Bridging Research with Community
 Ford Foundation The Ford Foundation supports visionary leaders and organizations on the frontlines of social change worldwide. Created with gifts and bequests by Edsel and Henry Ford, the foundation is
The New Geography of Immigration and Local Policy Responses
 1 Audrey Singer Senior Fellow The New Geography of Immigration and Local Policy Responses Brookings Mountain West University of Nevada Las Vegas 2 March 9, 2010 The New Geography of Immigration and Policy
Cook County Health Strategic Planning Landscape
 Cook County Health Strategic Planning Landscape Terry Mason, MD COO Cook County Department of Public Health December 21, 2018 1 Cook County Population Change 2000-2010* U.S. Census 2000 population 2010
Regional Data Snapshot
 Regional Data Snapshot Population, Economy & Education Features SET Civic Forum Glacial Lakes Region, South Dakota Table of Contents 01 Overview 03 Human Capital 02 Demography 04 Labor Force 01 overview
VOLUME 31, ARTICLE 20, PAGES PUBLISHED 3 SEPTEMBER DOI: /DemRes
 DEMOGRAPHIC RESEARCH VOLUME 31, ARTICLE 20, PAGES 593 624 PUBLISHED 3 SEPTEMBER 2014 http://www.demographic-research.org/volumes/vol31/20/ DOI: 10.4054/DemRes.2014.31.20 Research Article The residential
February 1, William T Fujioka, Chief Executive Officer. Dean C. Logan, Registrar-Recorder/County Clerk
 January 31, 2012 Page 1 of 13 TO: Supervisor Zev Yaroslavsky, Chair Supervisor Gloria Molina Supervisor Mark Ridley-Thomas Supervisor Don Knabe Supervisor Michael D. Antonovich William T Fujioka, Chief
Indian Migration to the U.S.
 Indian Migration to the U.S. Neil G. Ruiz Associate Director of Global Migration & Demography Pew Research Center is a nonpartisan fact tank that informs the public about the issues, attitudes and trends
Wage Inequality in the Region
 Wage Inequality in the Region Jaison R. Abel, Research Officer Community Advisory Group Meeting November 15, 2017 The views expressed here are those of the presenter and do not necessarily represent those
Asian Americans in New York City. A Decade of Dynamic Change Presented on April 20, 2012 Report from
 Asian Americans in New York City A Decade of Dynamic Change 2000-2010 Presented on April 20, 2012 Report from Asian Americans in New York City: A Decade of Dynamic Change Demographic Changes from 2000-2010
FROM ELLIS ISLAND TO THE QUEEN CITY: IMMIGRATION GEOGRAPHY AND CHARLOTTE IN THE 21 ST CENTURY
 FROM ELLIS ISLAND TO THE QUEEN CITY: IMMIGRATION GEOGRAPHY AND CHARLOTTE IN THE 21 ST CENTURY Owen J. Furuseth, Ph.D. Associate Provost for Metropolitan Studies and Extended Academic Programs; and Professor
The New Geography of Immigration and Local Policy Responses
 1 Audrey Singer Senior Fellow The New Geography of Immigration and Local Policy Responses Brookings Mountain West University of Nevada Las Vegas 2 March 9, 2010 The New Geography of Immigration and Policy
Ethno-Racial Groups in Montreal and Vancouver, : A Demographic and Socio-Economic Profile
 Ethno-Racial Groups in Montreal and Vancouver, 1971-2001: A Demographic and Socio-Economic Profile Michael Ornstein January 2007 Ethno-Racial Groups in Montreal and Vancouver, 1971-2001: A Demographic
Share of Children of Immigrants Ages Five to Seventeen, by State, Share of Children of Immigrants Ages Five to Seventeen, by State, 2008
 Figure 1.1. Share of Children of Immigrants Ages Five to Seventeen, by State, 1990 and 2008 Share of Children of Immigrants Ages Five to Seventeen, by State, 1990 Less than 10 percent 10 to 19 percent
SECTION TWO: REGIONAL POVERTY TRENDS
 SECTION TWO: REGIONAL POVERTY TRENDS Metropolitan Council Choice, Place and Opportunity: An Equity Assessment of the Twin Cities Region Section 2 The changing face of poverty Ebbs and flows in the performance
Regional Data Snapshot
 Regional Data Snapshot Population, Economy & Education Features SET Civic Forum East Central NM, New Mexico Table of Contents 01 Overview 03 Human Capital 02 Demography 04 Labor Force 01 overview East
ECONOMIC IMPACT OF IMMIGRANTS IN LAKE COUNTY, IL. Lake County Chamber of Commerce October 2017 State Bank of the Lakes Grayslake, IL
 ECONOMIC IMPACT OF IMMIGRANTS IN LAKE COUNTY, IL Lake County Chamber of Commerce October 2017 State Bank of the Lakes Grayslake, IL Overview Review of Recent Immigration to Lake County Profile of Immigrants
Salvadorans. in Boston
 Salvadorans in Boston Banda El Salvador at the 2013 Rose Parade in Pasadena, California. Photo by Prayitno Photography, retrieved from flickr.com/ photos/prayitnophotography (Creative Commons Attribution
Setting the Context on South Asian Americans: Demographics, Civic Engagement, Race Relations. Alton Wang & Karthick Ramakrishnan AAPI Data
 Setting the Context on South Asian Americans: Demographics, Civic Engagement, Race Relations Alton Wang & Karthick Ramakrishnan AAPI Data Context #1: Growth and Diversity National Origins (2015) (in Thousands)
An Equity Profile of. Albuquerque
 An Equity Profile of Albuquerque An Equity Profile of Albuquerque PolicyLink and PERE 2 Acknowledgments PolicyLink and the Program for Environmental and Regional Equity (PERE) at the University of Southern
Chairman and Members of the Planning and Development Committee. Thomas S. Mokrzycki, Commissioner of Planning and Building
 CD.15.DAT DATE: TO: FROM: SUBJECT: Chairman and Members of the Planning and Development Committee Thomas S. Mokrzycki, Commissioner of Planning and Building Mississauga: A City of Many Cultures MEETING
Racial integration between black and white people is at highest level for a century, new U.S. census reveals
 Thursday, Dec 16 2010 Racial integration between black and white people is at highest level for a century, new U.S. census reveals By Daily Mail Reporter Last updated at 1:11 PM on 16th December 2010 But
Chapter 1: Objectives
 Chapter 1: Objectives Identify Texas political party activists and government officials to inform participation in the political affairs of the state and its counties, cities, and special districts. Understand
City of Placentia By-District Elections Briefing. February 6, 2018
 www.drawplacentia.org City of Placentia By-District Elections Briefing Tentative Project Timeline 2 Date February 6 February 20 March 11 No later than March 13 March 20 Event 1 st hearing: gather public
Brockton and Abington
 s in Massachusetts Selected Areas Brockton and Abington by Phillip Granberry, PhD and Sarah Rustan September 17, 2010 INTRODUCTION This report provides a descriptive snapshot of selected economic, social,
Racial Inequities in the Washington, DC, Region
 W A S H I N G T O N A R E A R E S E A R C H I N I T I A T V E Racial Inequities in the Washington, DC, Region 2011 15 Leah Hendey December 2017 The Washington, DC, region is increasingly diverse and prosperous,
An Equity Profile of. Sunflower County
 An Equity Profile of Sunflower County An Equity Profile of Sunflower County PolicyLink and PERE 2 Acknowledgments PolicyLink and the Program for Environmental and Regional Equity (PERE) at the University
Environmental Justice Demographic Profile
 CENTRAL PUGET SOUND REGION Environmental Justice Demographic Profile January 2016 Contents INTRODUCTION... 3 OBJECTIVES... 4 DEFINITIONS... 4 Minority Populations... 4 Low-Income Population... 4 Other
Equitable Growth Profile of the. Omaha-Council Bluffs Region 2018 updated analysis
 Equitable Growth Profile of the Omaha-Council Bluffs Region 2018 updated analysis 2 Summary The Omaha-Council Bluffs region continues to undergo a demographic transformation that has major implications
Regional Data Snapshot
 Regional Data Snapshot Population, Economy & Education Features SET Civic Forum Uwharrie Region, NC Table of Contents 01 Overview 03 Human Capital 02 Demography 04 Labor Force 01 overview Uwharrie Region,
An Equity Profile of. Jackson
 An Equity Profile of Jackson An Equity Profile of Jackson PolicyLink and PERE 2 Acknowledgments PolicyLink and the Program for Environmental and Regional Equity (PERE) at the University of Southern California
Ana Celia Zentella Professor Emerita, UCSD. Photo courtesy of:
 Ana Celia Zentella Professor Emerita, UCSD Photo courtesy of: http://activerain.com/blogs/sandiegohomesforsale Welcome to San Diego, California's second largest city. Where blue skies keep watch on 70
COMPARATIVE ANALYSIS OF METROPOLITAN CONTEXTS: ANNIE E. CASEY FOUNDATION CITIES
 ANNIE E. CASEY FOUNDATION MAKING CONNECTIONS INITIATIVE COMPARATIVE ANALYSIS OF METROPOLITAN CONTEXTS: ANNIE E. CASEY FOUNDATION CITIES G. Thomas Kingsley and Kathryn L.S. Pettit December 3 THE URBAN INSTITUTE
In the News: Speaking English in the United States
 Focus Areas Environment HIV/AIDS Population Trends Reproductive Health Topics Aging Education Family Planning Fertility Gender Health Marriage/Family Migration Mortality Policy Poverty Race/Ethnicity Youth
Understanding Residential Patterns in Multiethnic Cities and Suburbs in U.S. and Canada*
 Understanding Residential Patterns in Multiethnic Cities and Suburbs in U.S. and Canada* Lingxin Hao John Hopkins University 3400 N. Charles Street Baltimore, MD 21218 (Tel) 410-516-4022 Email: hao@jhu.edu
Emerging and Established Hispanic Communities: Implications of Changing Hispanic Demographics
 Emerging and Established Hispanic Communities: Implications of Changing Hispanic Demographics October 1, 2015 @NRCHispanic Co-Chairs Michael López, Ph.D. Abt Associates Michelle Blocklin, Ph.D. Abt Associates
Using Data to Address Health Inequities. Iyanrick John Senior Policy Strategist February 12, 2019
 Using Data to Address Health Inequities Iyanrick John Senior Policy Strategist February 12, 2019 About APIAHF The Asian & Pacific Islander American Health Forum is one of the oldest and largest national
Prophetic City: Houston on the Cusp of a Changing America.
 Prophetic City: Houston on the Cusp of a Changing America. Tracking Responses to the Economic and Demographic Transformations through 36 Years of Houston Surveys Dr. Stephen L. Klineberg TACA 63rd Annual
Asian Pacific American Heritage Month: May 2004
 CB04-FF.06 April 19, 2004 Asian Pacific American Heritage Month: May 2004 In 1978, a joint congressional resolution established Asian Pacific American Heritage Week. The first 10 days of May were chosen
December 12, City of Oxnard Consideration of By-District Elections
 December 12, 2017 City of Oxnard Consideration of By-District Elections Project Timeline 2 Date December 12 January 3 January 5 No later than January 10 January 17 January 29 February 7 February 20 February
Cultural Identity of Migrants in USA and Canada
 Cultural Identity of Migrants in USA and Canada golam m. mathbor espacio cultural Introduction ace refers to physical characteristics, and ethnicity usually refers Rto a way of life-custom, beliefs, and
PROTECTING CALIFORNIA S DEMOCRACY: ENSURING COMPLIANCE WITH FEDERAL AND STATE BILINGUAL VOTING ASSISTANCE LAWS
 PROTECTING CALIFORNIA S DEMOCRACY: ENSURING COMPLIANCE WITH FEDERAL AND STATE BILINGUAL VOTING ASSISTANCE LAWS For more information, contact Eugene Lee, Voting Rights Project Director, Asian Pacific American
DEMOGRAPHIC PROFILE Skagit County, Washington. Prepared by: Skagit Council of Governments 204 West Montgomery Street, Mount Vernon, WA 98273
 DEMOGRAPHIC PROFILE 2013 Skagit County, Washington Prepared by: Skagit Council of Governments 204 West Montgomery Street, Mount Vernon, WA 98273 CONTENTS TABLE OF CONTENTS Introduction... 1 Persons and
RETHINKING U.S. CENSUS RACIAL AND ETHNIC CATEGORIES
 RETHINKING U.S. CENSUS RACIAL AND ETHNIC CATEGORIES SHARON M. LEE 1 and SONYA M. TAFOYA 2 1 Direct correspondence to Sharon M. Lee, Department of Sociology, University of Victoria, Victoria, B.C. V8W 3P5,
Racial Disparities in the Direct Care Workforce: Spotlight on Hispanic/Latino Workers
 FEBRUARY 2018 RESEARCH BRIEF Racial Disparities in the Direct Care Workforce: Spotlight on Hispanic/Latino Workers BY STEPHEN CAMPBELL The second in a three-part series focusing on racial and ethnic disparities
American Ethnic Studies
 American Ethnic Studies 137 American Ethnic Studies The United States, California and the Santa Barbara area have a great variety of peoples of different ethnic, racial and cultural backgrounds. All of
REGENERATION AND INEQUALITY IN AMERICA S LEGACY CITIES
 REGENERATION AND INEQUALITY IN AMERICA S LEGACY CITIES Alan Mallach, Senior Fellow Center for Community Progress Washington, DC amallach@communityprogress.net Setting the stage A dramatic reversal of long-term
Racial Inequities in Fairfax County
 W A S H I N G T O N A R E A R E S E A R C H I N I T I A T I V E Racial Inequities in Fairfax County Leah Hendey and Lily Posey December 2017 Fairfax County, Virginia, is an affluent jurisdiction, with
Welfare Policies in California and Wisconsin
 Table 1.1 Welfare Policies in California and Wisconsin Temporary Assistance for California Wisconsin Needy Families Policies Most severe sanction for non-compliance Application of sanction rate, compared
A Community of Contrasts
 A Community of Contrasts Asian Americans and Pacific Islanders in the United States DEMOGRAPHIC PROFILE Principal Researcher Contents Welcome 1 Introduction 2 Key Findings 3 United States 4 Largest Communities
The Changing Racial and Ethnic Makeup of New York City Neighborhoods
 The Changing Racial and Ethnic Makeup of New York City Neighborhoods State of the New York City s Property Tax New York City has an extraordinarily diverse population. It is one of the few cities in the
Advancing Health Equity and Inclusive Growth in. Fresno County
 Advancing Health Equity and Inclusive Growth in Fresno County 2 Summary Fresno County is an agricultural powerhouse, yet it struggles with slow economic growth, high unemployment, and an economy dominated
The Popula(on of New York City Recent PaFerns and Trends
 TM The Popula(on of New York City Recent PaFerns and Trends Presenta(on for the Macaulay Honors College of the City University of New York January 28, 2014 Joseph Salvo POPULATION DIVISION New York City
Equitable Growth Profile of the. Piedmont Triad Region
 Equitable Growth Profile of the Piedmont Triad Region 2 Summary Communities of color are driving the Piedmont Triad s population growth, and their ability to participate in the economy and thrive is central
OFFICE OF THE CONTROLLER. City Services Auditor 2005 Taxi Commission Survey Report
 OFFICE OF THE CONTROLLER City Services Auditor 2005 Taxi Commission Survey Report February 7, 2006 TABLE OF CONTENTS INTRODUCTION 3 SURVEY DATA ANALYSIS 5 I. The Survey Respondents 5 II. The Reasonableness
TOP TEN STATES TOP TEN STATES. subgroups are Vietnamese (16%), Indian (11%) and Filipino (8%).
, Indian (11%) and Filipino (8%).") 13 million Americans identify themselves as Asian alone Chinese are the single largest subgroup of the Asian alone population in the United States, numbering 3.1 million. Among other groups there are 2.5
13 million Americans identify themselves as Asian alone Chinese are the single largest subgroup of the Asian alone population in the United States, numbering 3.1 million. Among other groups there are 2.5
Institute for Public Policy and Economic Analysis
 Institute for Public Policy and Economic Analysis The Institute for Public Policy and Economic Analysis at Eastern Washington University will convey university expertise and sponsor research in social,
Needs and Challenges for. Race/Ethnicity Data
 Disaggregation of Data: Needs and Challenges for Collecting and Reporting Race/Ethnicity Data Suhaila Khan, MD PhD Marguerite Ro, DrPH August 20, 2009 Webinar Topics covered in webinar What is disaggregation
Cities and product variety: evidence from restaurants
 1 / 20 Cities and product variety: evidence from restaurants Nathan Schiff School of Economics Shanghai University of Finance and Economics Urban Land Institute Award Ceremony March 22, 2016 2 / 20 Quality
Migration Information Source - Chinese Immigrants in the United States
 Pagina 1 di 8 Chinese Immigrants in the United States By Aaron Terrazas, Jeanne Batalova Migration Policy Institute May 6, 2010 The United States is home to about 1.6 million Chinese immigrants (including
Percentage and income.
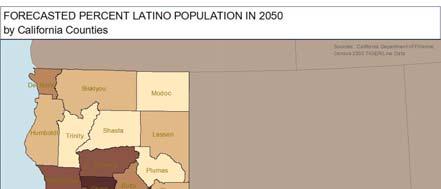
 Blacks The fact that the maps shows a large area of concentrated Black settlement exists in 20 confirms indirectly the fact that Los Angeles County is still quite highly segregated between Blacks and Whites.