First-Time Homebuyers Got Billions in Tax Credits
|
|
|
- Laura Bond
- 6 years ago
- Views:
Transcription

.")
1 First-Time Homebuyers Got Billions in Tax Credits One of the more popular federal recovery programs of 2009 was the tax credit provided to first-time homebuyers. To qualify, the taxpayer needed to prove it was his or her first home purchase and that it would be the primary residence. For the two years 2009 and 2010, income tax credits valued at more than $19.2 billion were granted by the Internal Revenue Service (IRS) to 2.7 million homebuyers. An average tax credit of $7,182 was received by those taxpayers. Utah had the highest average, at $7,617, while Michigan tallied the lowest at $6,308. That s a pretty wide difference of $1,309 from the highest to the lowest averages (see Figure 1). Figure 1: Average Homebuyer s Tax Credit per Taxpayer, 2009 to 2010 Source: IBRC, using Internal Revenue Service data Comparing the popularity of this credit by state, we calculated the number of first-time homebuyers per 1,000 population for each state (based on 2010 Census population figures). Nevada by far had the most claimants of this credit, at 13.7 per 1,000. Nebraska was a bit further behind, at 11.9, along with North Dakota (11.7), Idaho (11.6) and Arizona (11.4). Indiana had a rate of 9.6 claimants per 1,000, putting it close to the middle of the states. Interestingly, although not surprising considering its high housing costs, Hawaii came in last with a rate of only 5 claimants per 1,000. New York also had among the lowest rates of credits (5.2 per 1,000). Figure 2 shows the states in comparison by these rates. Figure 2: Rate of Taxpayers Receiving Homebuyer s Tax Credit per 1,000 population, 2009 to 2010 Source: IBRC, using Internal Revenue Service data
2 Overall, a little more than 62,000 Hoosier homebuyers received $426 million in tax credits in 2009 and 2010, with an average of $6,868 in credit per qualifying taxpayer (see Table 1). Table 1: First-Time Homebuyer Tax Credit in Indiana, 2009 to Total Number of Taxpayers 52,599 9,452 62,051 Value of Credits $ 357,595,336 $ 68,556,490 $ 426,151,826 Average Credit per Taxpayer $ 6,799 $ 7,253 $ 6,868 Source: IBRC, using Internal Revenue Service data While this federal credit is no longer available, the Indiana Housing Authority still has a number of programs available to assist first homebuyers. Notes 1. The IRS is a wonderful source for income and tax credit statistics. These data reflect the First-Time Homebuyer Credit claimed and granted by the IRS after adjustments. Under the American Recovery and Reinvestment Act of 2009 and the Worker, Homeowner, and Business Assistance (WHBA) Act of 2009, taxpayers could claim the credit either on their 2008, 2009 or 2010 tax returns: Carol O. Rogers Deputy Director and Executive Editor, Indiana Business Research Center, Indiana University Kelley School of Business
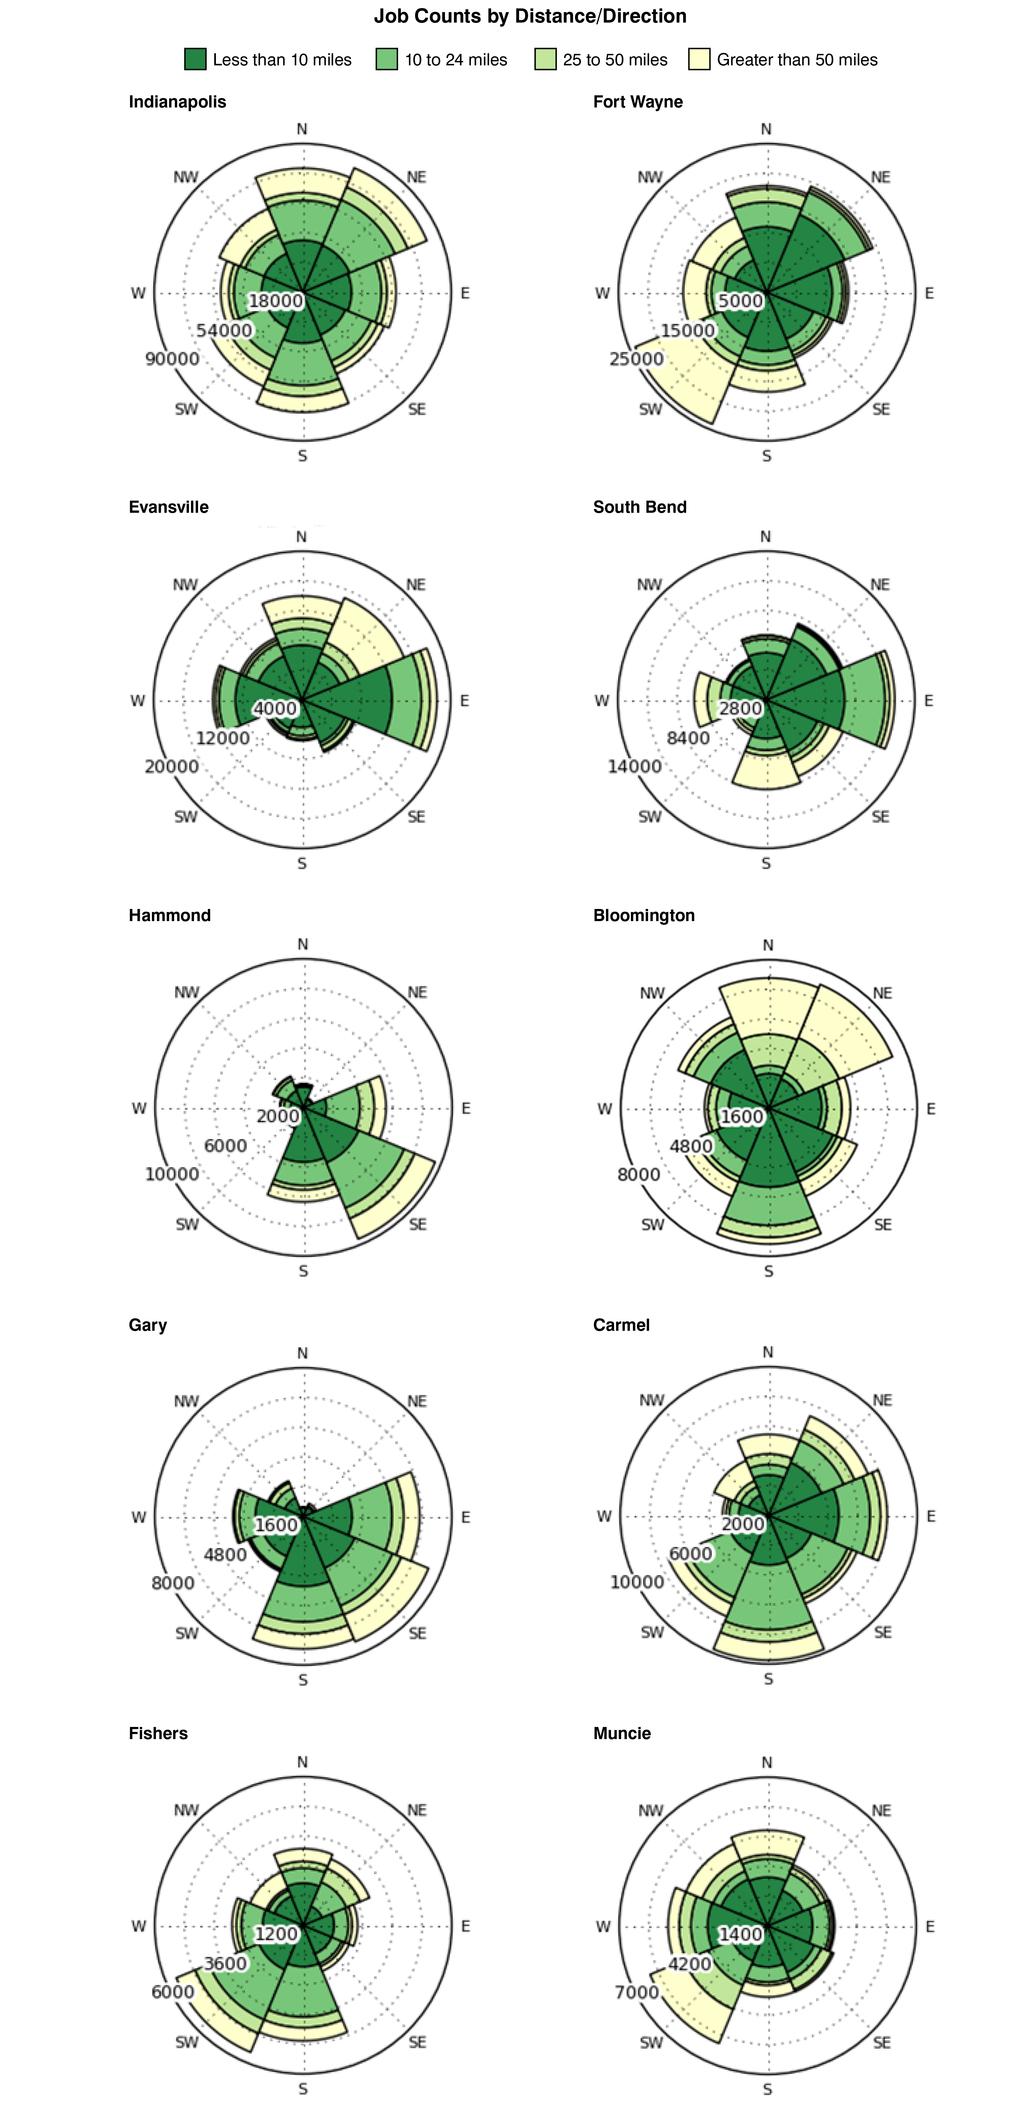
, while 15 percent commute more than 50 miles each way.")

3 How Long Is That Commute? OnTheMap Sheds Light on Distance from Home to Work Nearly half of those who work in Indiana live within 10 miles of their job (see Figure 1), while 15 percent commute more than 50 miles each way. OnTheMap, a web-based tool from the Census Bureau showing the work-residence patterns of workers, was upgraded earlier this year and includes several new analytical capabilities. This article highlights the new distance direction feature using both statewide data and that for Indiana s 10 largest cities. Figure 1: Distance to Primary Job for Indiana Workers, 2010 Note: Distance is calculated from work census block to home census block. Source: IBRC, using Census Bureau data More than half of workers in 6 of the 10 largest cities in the state live within 10 miles of their job (see Figure 2). Who has the shortest commutes? Sixty-three percent of workers employed in Evansville and South Bend travel less than 10 miles (see Table 1). Figure 2: Commuting Distance for Workers in Indiana's 10 Largest Cities, 2010 Note: Cities are sorted by size of workforce. Source: IBRC, using Census Bureau data Table 1: Percent of Workforce Living Less than 10 Miles from Job, Indiana's 10 Largest Cities, 2010 City Percent of Workforce Number of Workers
4 Evansville 63% 54,524 South Bend 63% 35,520 Fort Wayne 58% 75,807 Muncie 54% 17,549 Gary 53% 16,443 Bloomington 51% 23,102 Indiana 49% 1,254,055 Hammond 49% 14,356 Carmel 47% 24,082 Fishers 45% 11,568 Indianapolis 45% 221,971 Source: IBRC, using Census Bureau data At the other end of the spectrum, those working in Bloomington had the highest percentage (21 percent) of commutes exceeding 50 miles (see Table 2). Among the 10 largest cities, Bloomington workers also had the highest percentage of those traveling 25 to 50 miles. Table 2: Percent of Workforce Living More than 50 Miles from Job, Indiana's 10 Largest Cities, 2010 City Percent of Workforce Number of Workers Bloomington 21% 9,217 Fort Wayne 18% 23,833 Muncie 16% 5,112 Indianapolis 15% 75,108 Indiana 15% 375,592 Fishers 14% 3,554 Evansville 14% 11,911 Carmel 14% 6,924 South Bend 12% 6,854 Gary 12% 3,675 Hammond 11% 3,305 Source: IBRC, using Census Bureau data Figure 3 shows the radar charts generated by the OnTheMap application. These charts combine distance and direction into a single visual and illustrate the uniqueness of each city s commuting structure. Figure 3: Distance and Direction to Home for Workers in Indiana's 10 Largest Cities, 2010
5
6 Source: IBRC, using Census Bureau data OnTheMap, now in its 6th version, includes data for 49 states plus the District of Columbia (data for Massachusetts should be available in the near to medium term). It is worth noting that these data do not currently include the self-employed, military and the informally employed (i.e., those not covered by state unemployment insurance laws). 1 Prior users of OnTheMap will notice that the new application is much faster and includes 2010 census blocks and other geographies. View the analysis guides for a step-by-step approach to using each of the report types available in OnTheMap, or simply go to the website and jump in: Notes 1. Federal worker data were released in the summer of 2012 and self-employment data are tentatively planned for Rachel M. Strange Geodemographic Analyst, Indiana Business Research Center, Indiana University Kelley School of Business
7 Mexico, the U.S. and Indiana: Economy and Trade Mexico is inextricably linked to the United States politically, geographically and economically. The expanding Mexican economy is a large market for U.S. goods. Mexico's population is estimated at about 115 million people, roughly a third the size of the U.S. population. 1 As Table 1 shows, Mexico lags the United States considerably in terms of its developed status. In 2011, Mexico received a United Nations Human Development Index ranking of 57, placing it between Saudi Arabia and Panama. The per capita income is also well below the U.S. average, nearly $30,000 below in purchasing power parity (PPP) dollars. Despite the lower standard of living, however, life expectancy in Mexico is about the same as the United States. Table 1: Development Statistics for Mexico and the United States Human Development Index Measures Mexico United States Human Development Index Value 57 4 Life Expectancy at Birth (years) Education Index Gross National Income per Capita (PPP U.S. dollars) $13,245 $43,017 Source: Human Development Reports, 2011 Economy As Figure 1 shows, Mexico's economic growth has exceeded the U.S. rate of growth in every year since 2004, with the exception of 2009 when Mexico suffered considerable economic decline due to the worldwide economic slowdown. In 2010, economic growth bounced back, reaching nearly 6 percent. At $1.66 trillion in 2011, Mexico's economy is the 12th largest in the world. 2 Even though its economy is relatively large, the World Bank ranked Mexico 53rd in 2012 among all nations in ease of doing business in terms of regulatory environment right between St. Lucia and Botswana. More specifically, Mexico ranked 75th in ease of starting a business, 109th in terms of the tax burden, 81st in enforcement of contracts, and 142nd in ease of getting electricity. The regulatory environment has been, and continues to be, a major impediment to economic growth. 3 Figure 1: GDP Growth for Mexico, the United States and the World, 2001 to 2010 Source: IBRC, using World Bank data Trade

8 As Figure 2 shows, Mexico has one major trading partner: the United States. Mexico's exports totaled $309.6 billion in percent of which were U.S. purchases. Rounding out the top five export destinations were Canada, China, Germany and Columbia. The remaining 14 percent of exports were fairly evenly split among many different nations in Central and South America, Europe, and Asia. Mexico's exports, like its overall economy, suffered a severe setback in 2009, but bounced back in 2010 to reach new heights. Between 2006 and 2010, Mexico's exports grew almost 25 percent. Figure 2: Destinations of Mexican Exports, 2010 Source: IBRC, using WISERTrade data Over the past few years, Mexico has exported more to the United States than the United States has to Mexico. This gap narrowed considerably in 2009 but widened again in As of 2010, U.S. exports to Mexico totaled $163 billion, whereas Mexican exports to the United States totaled $230 billion a difference of $67 billion. Figure 3 shows the top 10 states exporting to Mexico over the last three years. Sharing a border with Mexico and the size of a state's overall economy play a large role in determining the volume of exports to Mexico. Texas is far-and-away the leader in exports to Mexico and has seen substantial growth in these exports over the last three years from $56 billion in 2009 to $87 billion in California sits at a distant second, with 2011 exports to Mexico totaling $26 billion. The distribution widens considerably from there, with Michigan, Illinois and Arizona rounding out the top five. Indiana is the ninth-largest exporter to Mexico among the 50 states. Figure 3: Top 10 States Exporting to Mexico, 2009 to 2011

9 Source: IBRC, using WISERTrade data Indiana's exports to Mexico topped $3 billion in As Figure 4 shows, nearly a third of those exports consisted of transportation equipment. Exports to Mexico in this industry have grown considerably over the past three years, rebounding from the significant dip the industry took as a whole in the middle of the last decade. The other major industries exporting to Mexico from Indiana show a strong focus on heavy manufacturing and chemical manufacturing, consistent with Indiana's overall export profile. Interestingly, chemical manufacturing exports, while still hovering around a quarter of a billion dollars, have declined over the last few years. Figure 4 : Top Five Industries Exporting to Mexico from Indiana, 2009 to 2011 Source: IBRC, using WISERTrade data While the trade gap between the United States and Mexico is fairly wide, the gap between Indiana and Mexico is much smaller. Indiana exported $3.3 billion in products and services to Mexico in 2011 while purchasing $3.6 billion in products and services. Figure 5 shows the top five industries exporting to Indiana from Mexico. As one might expect, the data show evidence of the exchange in auto parts (and components) between the two trading partners. Both are key players in automobile manufacturing, and transportation equipment leads all other industries in Mexico's exports to Indiana. Computer and electronics products are a strong second, although this industry's exports to Indiana have decreased over the last three years. As with Indiana's exports, Mexico's exports to Indiana tend to be heavy manufacturing. Figure 5: Top Five Industries Exporting from Mexico to Indiana, 2009 to 2011

10 Source: IBRC, using WISERTrade data Conclusion Often the news coming from Mexico and about the U.S. relation with Mexico distracts from Mexico's importance as a trading partner. Despite arguments over immigration between Mexico and the United States both legal and illegal that may surface in U.S. political discourse, 4 the ongoing drug-motivated violence, 5 and the recent New York Times report revealing that Walmart had engaged in a systematic bribery program to secure building permits for new stores, 6 Mexico will remain an important trading partner for the Hoosier state. In 2011, Mexico represented the United States' second-largest trading partner (after Canada), accounting for roughly 13 percent of total U.S. exports. The United States, on the other hand, represented Mexico's largest trading partner, accounting for nearly threefourths of Mexico's total exports. 7 As such, it is clear that the United States and Mexico are as intricately linked economically as they are geographically. That said, it is also clear that Mexico is more dependent on the United States than vice versa. That could change, however, if Mexico pursued more pro-growth policies, for example, simplifying its regulatory system and fostering a more friendly business environment. To the degree that Mexico can create and expand its own businesses and can attract new business from other countries, its current dependence on the United States will moderate. Notes 1. Central Intelligence Agency, "Mexico," The World Factbook, /geos/mx.html. 2. Central Intelligence Agency, "Country Comparison: GDP (Purchasing Power Parity)," The World Factbook, countrycode=mx®ioncode=noa&rank=12#mx. 3. "Ease of Doing Business in Mexico," Doing Business: Measuring Business Regulations, /data/exploreeconomies/mexico. 4. Padmananda Rama, "Immigration Debate Arrives at Supreme Court amid a Multitude of Voices," It's All Politics Blog, 25 April 2012, 5. Reuters, "Twelve Decapitated near Guadalajara, Drug Gang Suspected," 9 May 2012, /2012/05/09/us-mexico-drugs-idUSBRE84818E David Barstow, "Vast Mexico Bribery Case Hushed Up by Wal-Mart After Top-Level Struggle," New York Times, 21 April 2012, 7. Source: Ryan Krause Research Associate, Indiana Business Research Center, Indiana University Kelley School of Business
Employment debate in the context of NAFTA. September 2017
 Employment debate in the context of NAFTA September 217 1 Take-away points The employment debate in the context of NAFTA Unemployment is mostly a macroeconomic phenomenon; unemployment in the Midwest is
Union Byte By Cherrie Bucknor and John Schmitt* January 2015
 January 21 Union Byte 21 By Cherrie Bucknor and John Schmitt* Center for Economic and Policy Research 1611 Connecticut Ave. NW Suite 4 Washington, DC 29 tel: 22-293-38 fax: 22-88-136 www.cepr.net Cherrie
Growth in the Foreign-Born Workforce and Employment of the Native Born
 Report August 10, 2006 Growth in the Foreign-Born Workforce and Employment of the Native Born Rakesh Kochhar Associate Director for Research, Pew Hispanic Center Rapid increases in the foreign-born population
Foreign Direct Investment in Indiana
 Foreign Direct Investment in Indiana http://www.incontext.indiana.edu/2009/sept-oct/article1_swf.asp 1 of 6 9/15/2009 12:29 PM Sept-Oct 2009, Vol. 10, No. 5 Foreign Direct Investment in Indiana Indiana
TFigure 1. Indiana Population Change in the 1990s: A Graphic View
 Indiana Population Change in the 1990s: A Graphic View TFigure 1 Morton J. Marcus Director, Indiana Business Research Center, Kelley School of Business, Indiana University Figure 2 Indiana's Population
Chapter 1 Introduction
 Chapter 1 Introduction Commerce, which ought naturally to be, among nations, as among individuals, a bond of union and friendship, has become the most fertile source of discord and animosity. Adam Smith,
VOLUME 36 ISSUE 1 JANUARY 2018
 VOLUME 36 ISSUE 1 JANUARY 2018 IN THIS ISSUE Updated Internet Sales Tax Estimates A recent Government Accountability Office study found that state and local governments could collect billions in additional
Components of Population Change by State
 IOWA POPULATION REPORTS Components of 2000-2009 Population Change by State April 2010 Liesl Eathington Department of Economics Iowa State University Iowa s Rate of Population Growth Ranks 43rd Among All
2010 CENSUS POPULATION REAPPORTIONMENT DATA
 Southern Tier East Census Monograph Series Report 11-1 January 2011 2010 CENSUS POPULATION REAPPORTIONMENT DATA The United States Constitution, Article 1, Section 2, requires a decennial census for the
Benefits and Challenges of Trade under NAFTA: The Case of Texas
 Benefits and Challenges of Trade under NAFTA: The Case of Texas AUBER Fall Conference Albuquerque New Mexico October 2017 Jesus Cañas Federal Reserve Bank of Dallas The views expressed in this presentation
STATE OF ENERGY REPORT. An in-depth industry analysis by the Texas Independent Producers & Royalty Owners Association
 STATE OF ENERGY REPORT An in-depth industry analysis by the Texas Independent Producers & Royalty Owners Association About TIPRO The Texas Independent Producers & Royalty Owners Association (TIPRO) is
The Changing Face of Labor,
 The Changing Face of Labor, 1983-28 John Schmitt and Kris Warner November 29 Center for Economic and Policy Research 1611 Connecticut Avenue, NW, Suite 4 Washington, D.C. 29 22-293-538 www.cepr.net CEPR
New data from the Census Bureau show that the nation s immigrant population (legal and illegal), also
, also") Backgrounder Center for Immigration Studies October 2011 A Record-Setting Decade of Immigration: 2000 to 2010 By Steven A. Camarota New data from the Census Bureau show that the nation s immigrant population
Backgrounder Center for Immigration Studies October 2011 A Record-Setting Decade of Immigration: 2000 to 2010 By Steven A. Camarota New data from the Census Bureau show that the nation s immigrant population
WYOMING POPULATION DECLINED SLIGHTLY
 FOR IMMEDIATE RELEASE Wednesday, December 19, 2018 Contact: Dr. Wenlin Liu, Chief Economist WYOMING POPULATION DECLINED SLIGHTLY CHEYENNE -- Wyoming s total resident population contracted to 577,737 in
How Utah Ranks. Utah Education Association Research Bulletin
 2009-2010 How Utah Ranks Utah Education Association Research Bulletin June 2011 2009 2010 HOW UTAH RANKS RESEARCH BULLETIN of the Utah Education Association by Jay Blain - Director of Policy & Research
National Population Growth Declines as Domestic Migration Flows Rise
 National Population Growth Declines as Domestic Migration Flows Rise By William H. Frey U.S. population trends are showing something of a dual personality when viewed from the perspective of the nation
Idaho Prisons. Idaho Center for Fiscal Policy Brief. October 2018
 Persons per 100,000 Idaho Center for Fiscal Policy Brief Idaho Prisons October 2018 Idaho s prisons are an essential part of our state s public safety infrastructure and together with other criminal justice
Map of the Foreign Born Population of the United States, 1900
 Introduction According to the 1900 census, the population of the United States was then 76.3 million. Nearly 14 percent of the population approximately 10.4 million people was born outside of the United
The Great Immigration Turnaround
 The Great Immigration Turnaround New Facts and Old Rhetoric Dowell Myers USC Sol Price School of Public Policy Overview Where is immigration growing fastest? Divided opinion and fears about immigration
Decision Analyst Economic Index United States Census Divisions April 2017
 United States s Arlington, Texas The Economic Indices for the U.S. s have increased in the past 12 months. The Middle Atlantic Division had the highest score of all the s, with an score of 114 for. The
Immigration Policy Brief August 2006
 Immigration Policy Brief August 2006 Last updated August 16, 2006 The Growth and Reach of Immigration New Census Bureau Data Underscore Importance of Immigrants in the U.S. Labor Force Introduction: by
Forecast for International Travel to the United States
 Forecast for International Travel to the United States Presented by: JULIE HEIZER National Travel and Tourism Office International Trade Administration U.S. Department of Commerce February 2014 1 U.S.
The United States Trade Deficit Issue with China and its Economic Effects in 2016
 The United States Trade Deficit Issue with China and its Economic Effects in 2016 Item Type text; Electronic Thesis Authors Jiang, Yuanzhi Publisher The University of Arizona. Rights Copyright is held
NASCO North America s premier transportation corridor coalition promoting a sustainable, secure and efficient trade & transportation system
 NASCO North America s premier transportation corridor coalition promoting a sustainable, secure and efficient trade & transportation system NASCO Purpose NASCO s mission is to increase economic development
VOLUME 33 JOINT ISSUE AUGUST 2015
 VOLUME 33 JOINT ISSUE 15-16 AUGUST 2015 IN THIS ISSUE Federal Spending Traceable to States This issue of Reports provides a summary of detail released by The Pew Charitable Trusts, which has cataloged
2015 ANNUAL OUTCOME GOAL PLAN (WITH FY 2014 OUTCOMES) Prepared in compliance with Government Performance and Results Act
 Prepared in compliance with Government Performance and Results Act") Administration for Children & Families 370 L Enfant Promenade, S.W. Washington, D.C. 20447 Office of Refugee Resettlement www.acf.hhs.gov 2015 ANNUAL OUTCOME GOAL PLAN (WITH FY 2014 OUTCOMES) Prepared
Administration for Children & Families 370 L Enfant Promenade, S.W. Washington, D.C. 20447 Office of Refugee Resettlement www.acf.hhs.gov 2015 ANNUAL OUTCOME GOAL PLAN (WITH FY 2014 OUTCOMES) Prepared
Household Income, Poverty, and Food-Stamp Use in Native-Born and Immigrant Households
 Household, Poverty, and Food-Stamp Use in Native-Born and Immigrant A Case Study in Use of Public Assistance JUDITH GANS Udall Center for Studies in Public Policy The University of Arizona research support
Federal Rate of Return. FY 2019 Update Texas Department of Transportation - Federal Affairs
 Federal Rate of Return FY 2019 Update Texas Department of Transportation - Federal Affairs Texas has historically been, and continues to be, the biggest donor to other states when it comes to federal highway
The Economic Impact of Spending for Operations and Construction by AZA-Accredited Zoos and Aquariums
 The Economic Impact of Spending for Operations and Construction by AZA-Accredited Zoos and Aquariums Prepared for The Association of Zoos and Aquariums Silver Spring, Maryland By Stephen S. Fuller, Ph.D.
How Have Hispanics Fared in the Jobless Recovery?
 How Have Hispanics Fared in the Jobless Recovery? William M. Rodgers III Heldrich Center for Workforce Development Rutgers University and National Poverty Center and Richard B. Freeman Harvard University
Le Sueur County Demographic & Economic Profile Prepared on 7/12/2018
 Le Sueur County Demographic & Economic Profile Prepared on 7/12/2018 Prepared by: Mark Schultz Regional Labor Market Analyst Southeast and South Central Minnesota Minnesota Department of Employment and
State of Local and State Government Workers Engagement in the U.S.
 State of Local and State Government Workers Engagement in the U.S. We change the world one client at a time through extraordinary analytics and advice on everything important facing humankind. JIM CLIFTON,
GDP per capita was lowest in the Czech Republic and the Republic of Korea. For more details, see page 3.
 International Comparisons of GDP per Capita and per Hour, 1960 9 Division of International Labor Comparisons October 21, 2010 Table of Contents Introduction.2 Charts...3 Tables...9 Technical Notes.. 18
The Economic Impact of Spending for Operations and Construction in 2014 by AZA-Accredited Zoos and Aquariums
 The Economic Impact of Spending for Operations and Construction in 2014 by AZA-Accredited Zoos and Aquariums By Stephen S. Fuller, Ph.D. Dwight Schar Faculty Chair and University Professor Center for Regional
1.3. Rankings: imports, exports and overall trade volume Philippines trade with EU Member States Structure and trends by product
 Front Cover Contents 1 Overview 2 1. Trade Relations 1.1. Trade in goods: main trends 1.2. Trade in services 1.3. Rankings: imports, exports and overall trade volume 1.4. Comparison of EU-Philippines
Backgrounder. Immigrants in the United States, 2007 A Profile of America s Foreign-Born Population. Center for Immigration Studies November 2007
 Backgrounder Center for Immigration Studies November 2007 s in the United States, 2007 A Profile of America s Foreign-Born Population By Steven A. Camarota This Backgrounder provides a detailed picture
Assessing the 2014 Election Updated index includes 2014 data. Overview. A brief from Aug 2016
 A brief from Aug 2016 Assessing the 2014 Election Updated index includes 2014 data Overview In 2013, The Pew Charitable Trusts unveiled the Elections Performance Index (EPI), which provided the first comprehensive
Texas and New Jersey are Best States for American E-Government
 Seventh Annual State and Federal E-Government Study Texas and New Jersey are Best States for American E-Government A study of digital government in the 50 states and major federal agencies also finds that
7-45. Electronic Access to Legislative Documents. Legislative Documents
 Legislative Documents 7-45 Electronic Access to Legislative Documents Paper is no longer the only medium through which the public can gain access to legislative documents. State legislatures are using
Comparing GDP among Countries
 OpenStax-CNX module: m48711 1 Comparing GDP among Countries OpenStax College This work is produced by OpenStax-CNX and licensed under the Creative Commons Attribution License 3.0 By the end of this section,
THE CALIFORNIA LEGISLATURE: SOME FACTS AND FIGURES. by Andrew L. Roth
 THE CALIFORNIA LEGISLATURE: SOME FACTS AND FIGURES by Andrew L. Roth INTRODUCTION The following pages provide a statistical profile of California's state legislature. The data are intended to suggest who
MIGRATION STATISTICS AND BRAIN DRAIN/GAIN
 MIGRATION STATISTICS AND BRAIN DRAIN/GAIN Nebraska State Data Center 25th Annual Data Users Conference 2:15 to 3:15 p.m., August 19, 2014 David Drozd Randy Cantrell UNO Center for Public Affairs Research
Investigating the Geology and Geography of Oil
 S t u d e n t H a n d o u t a Investigating the Geology and Geography of Oil Land Area of Oil Countries of Southwest Asia Examine the map at right. It shows the locations of 10 oil countries in Southwest
Charting Singapore s Economy, 1H 2017
 Charting Singapore s Economy, 1H 2017 Designed to help executives interpret economic numbers and incorporate them into company s planning. Publication Date: January 3 rd, 2017 Next Issue: To be published
U ntil the reduction in manufacturing exports
 FEDERAL RESERVE BANK OF ST. LOUIS Comparing Manufacturing Export Growth Across States: What Accounts for the Differences? Cletus C. Coughlin and Patricia S. Pollard U ntil the reduction in manufacturing
The Jus Semper Global Alliance Living Wages North and South
 The Jus Semper Global Alliance Living Wages North and South January 2010 The Jus Semper Global Alliance 2 Table of Contents Argument for wage equalization classic problem scenario 4 Argument for wage equalization
Riverside Labor Analysis. November 2018
 November 2018 The City of Labor Market Dynamics and Local Cost of Living Analysis Executive Summary The City of is located in one of the fastest growing parts of California. Over the period 2005-2016,
Gone to Texas: Migration Vital to Growth in the Lone Star State. Pia Orrenius Federal Reserve Bank of Dallas June 27, 2018
 Gone to Texas: Migration Vital to Growth in the Lone Star State Pia Orrenius Federal Reserve Bank of Dallas June 27, 2018 Roadmap History/Trends in migration to Texas Role in economic growth Domestic migration
TOP TEN STATES TOP TEN STATES. subgroups are Vietnamese (16%), Indian (11%) and Filipino (8%).
, Indian (11%) and Filipino (8%).") 13 million Americans identify themselves as Asian alone Chinese are the single largest subgroup of the Asian alone population in the United States, numbering 3.1 million. Among other groups there are 2.5
13 million Americans identify themselves as Asian alone Chinese are the single largest subgroup of the Asian alone population in the United States, numbering 3.1 million. Among other groups there are 2.5
The 2,000 Mile Wall in Search of a Purpose: Since 2007 Visa Overstays have Outnumbered Undocumented Border Crossers by a Half Million
 The 2,000 Mile Wall in Search of a Purpose: Since 2007 Visa Overstays have Outnumbered Undocumented Border Crossers by a Half Million Robert Warren Center for Migration Studies Donald Kerwin Center for
U.S. Sentencing Commission 2014 Drug Guidelines Amendment Retroactivity Data Report
 U.S. Sentencing Commission 2014 Drug Guidelines Amendment Retroactivity Data Report October 2017 Introduction As part of its ongoing mission, the United States Sentencing Commission provides Congress,
The Impact of Ebbing Immigration in Los Angeles: New Insights from an Established Gateway
 The Impact of Ebbing Immigration in Los Angeles: New Insights from an Established Gateway Julie Park and Dowell Myers University of Southern California Paper proposed for presentation at the annual meetings
Summary of the U.S. Census Bureau s 2018 State-Level Population Estimate for Massachusetts
 Summary of the U.S. Census Bureau s 2018 State-Level Population Estimate for Massachusetts Prepared by: Population Estimates Program For Release December 19, 2018 On December 19, 2018, the U.S. Census
CRS Report for Congress
 Order Code RL32892 CRS Report for Congress Received through the CRS Web Homeland Security Grant Formulas: A Comparison of Formula Provisions in S. 21 and H.R. 1544, 109 th Congress Updated May 13, 2005
Charting Indonesia s Economy, 1H 2017
 Charting Indonesia s Economy, 1H 2017 Designed to help executives interpret economic numbers and incorporate them into company s planning. Publication Date: January 3 rd, 2017 Next Issue: To be published
Chapter 2: The U.S. Economy: A Global View
 Chapter 2: The U.S. Economy: A Global View 1. Approximately how much of the world's output does the United States produce? A. 4 percent. B. 20 percent. C. 30 percent. D. 1.5 percent. The United States
Charting Australia s Economy
 Charting Australia s Economy Designed to help executives catch up with the economy and incorporate macro impacts into company s planning. Annual subscription includes 2 semiannual issues published in June
New Census Estimates Show Slight Changes For Congressional Apportionment Now, But Point to Larger Changes by 2020
 [Type here] Emerywood Court Manassas, Virginia 0 0.00 tel. or 0 0. 0 0. fax Info@electiondataservices.com FOR IMMEDIATE RELEASE Date: December, 0 Contact: Kimball W. Brace Tel.: (0) 00 or (0) 0- Email:
CHINA INTERNATIONAL INBOUND TRAVEL MARKET PROFILE (2015) 2015 U.S. Travel Association. All Rights Reserved.
 2015 U.S. Travel Association. All Rights Reserved.") CHINA INTERNATIONAL INBOUND TRAVEL PROFILE (2015) 2015 U.S. Travel Association. All Rights Reserved. SUMMARY China is one of the fastest-growing inbound travel markets to the United States; it is consistently
CHINA INTERNATIONAL INBOUND TRAVEL PROFILE (2015) 2015 U.S. Travel Association. All Rights Reserved. SUMMARY China is one of the fastest-growing inbound travel markets to the United States; it is consistently
DRUG INTELLIGENCE REPORT
 Drug Enforcement Administration (DEA) Philadelphia Division DRUG INTELLIGENCE REPORT (U) Analysis of Oxycodone, Hydrocodone, and Buprenorphine Orders by Registrants in Pennsylvania and Delaware, - January
Chapter URL:
 This PDF is a selection from an out-of-print volume from the National Bureau of Economic Research Volume Title: Distribution of Union Membership among the States, 1939 and 1953 Volume Author/Editor: Leo
New Americans in. By Walter A. Ewing, Ph.D. and Guillermo Cantor, Ph.D.
 New Americans in the VOTING Booth The Growing Electoral Power OF Immigrant Communities By Walter A. Ewing, Ph.D. and Guillermo Cantor, Ph.D. Special Report October 2014 New Americans in the VOTING Booth:
Offender Population Forecasts. House Appropriations Public Safety Subcommittee January 19, 2012
 Offender Population Forecasts House Appropriations Public Safety Subcommittee January 19, 2012 Crimes per 100,000 population VIRGINIA TRENDS In 2010, Virginia recorded its lowest violent crime rate over
IMMIGRANTS. Udall Center for Studies in Public Policy The University of Arizona
 ECONOMIC CONTRIBUTIONS of IMMIGRANTS IN THE UNITED STATES A Regional and State-by-State Analysis JUDITH GANS Udall Center for Studies in Public Policy The University of Arizona research support provided
INTRODUCTION AND SUMMARY
 Gender Parity Index INTRODUCTION AND SUMMARY - 2017 State of Women's Representation Page 1 INTRODUCTION As a result of the 2016 elections, progress towards gender parity stalled. Beyond Hillary Clinton
Appendix A: Economic Development and Culture Trends in Toronto Data Analysis
 Appendix A: Economic Development and Culture Trends in Toronto Data Analysis Introduction The proposed lenses presented in the EDC Divisional Strategy Conversation Guide are based in part on a data review.
THE NATIONAL ACADEMIES PRESS
 THE NATIONAL ACADEMIES PRESS This PDF is available at http://www.nap.edu/23550 SHARE The Economic and Fiscal Consequences of Immigration DETAILS 508 pages 6 x 9 PAPERBACK ISBN 978-0-309-44445-3 DOI: 10.17226/23550
Charting Singapore s Economy, 1Q 2016 Publication Date: December 8 th, 2015 Number of pages: 58
 Charting Singapore s Economy, 1Q 2016 Publication Date: December 8 th, 2015 Number of pages: 58 Attribution-NonCommercial-NoDerivatives 4.0 International (CC BY-NC-ND 4.0) You are free to: Share copy and
8. REGIONAL DISPARITIES IN GDP PER CAPITA
 8. REGIONAL DISPARITIES IN GDP PER CAPITA GDP per capita varies significantly among OECD countries (Figure 8.1). In 2003, GDP per capita in Luxembourg (USD 53 390) was more than double the OECD average
Oklahoma, Maine, Migration and Right to Work : A Confused and Misleading Analysis. By the Bureau of Labor Education, University of Maine (Spring 2012)
") Oklahoma, Maine, Migration and Right to Work : A Confused and Misleading Analysis By the Bureau of Labor Education, University of Maine (Spring 2012) The recent article released by the Maine Heritage Policy
Oklahoma, Maine, Migration and Right to Work : A Confused and Misleading Analysis By the Bureau of Labor Education, University of Maine (Spring 2012) The recent article released by the Maine Heritage Policy
CHAPTER I: SIZE AND GEOGRAPHICAL DISTRIBUTION OF THE POPULATION
 CHAPTER I: SIZE AND GEOGRAPHICAL DISTRIBUTION OF THE POPULATION 1. Trends in the Population of Japan The population of Japan is 127.77 million. It increased by 0.7% over the five-year period, the lowest
Charting South Korea s Economy, 1H 2017
 Charting South Korea s Economy, 1H 2017 Designed to help executives interpret economic numbers and incorporate them into company s planning. Publication Date: January 3 rd, 2017 Next Issue: To be published
Bulletin. Probation and Parole in the United States, Bureau of Justice Statistics. Revised 7/2/08
 U.S. Department of Justice Office of Justice Programs Revised 7/2/08 Bureau of Justice Statistics Bulletin Probation and Parole in the United States, 2006 Lauren E. Glaze and Thomas P. Bonczar BJS Statisticians
Incarcerated America Human Rights Watch Backgrounder April 2003
 Incarcerated America Human Rights Watch Backgrounder April 03 According to the latest statistics from the U.S. Department of Justice, more than two million men and women are now behind bars in the United
The Road to Work: Commuting in Wyoming
 The Road to Work: Commuting in Wyoming and what it means for Economic Development Community Planning Policy Making Resource Use Employee Recruiting Executive Summary Last year, the Wyoming Workforce Development
Department of Justice
 Department of Justice ADVANCE FOR RELEASE AT 5 P.M. EST BJS SUNDAY, DECEMBER 3, 1995 202/307-0784 STATE AND FEDERAL PRISONS REPORT RECORD GROWTH DURING LAST 12 MONTHS WASHINGTON, D.C. -- The number of
Where U.S. Immigrants Were Born
 Where U.S. Immigrants Were Born 1960 Today Other 1% Canada 2% Europe 12% Other 5% Europe 75% Asia 5% Latin America 9% Canada 10% Latin America 54% Asia 28% Sources: Migration Policy Institute, U.S. Census,
GDP per capita growth
 GDP per capita growth 1980 Index = 100 180 160 140 120 100 After NAFTA United States Canada Mexico 80 80 82 84 86 Source: International Monetary Fund. 88 90 92 94 96 98 00 02 04 06 Job growth: U.S. vs.
BLS Spotlight on Statistics: Union Membership In The United States
 Cornell University ILR School DigitalCommons@ILR Federal Publications Key Workplace Documents 9-2016 BLS : Union Membership In The United States Megan Dunn Bureau of Labor Statistics James Walker Bureau
In the Margins Political Victory in the Context of Technology Error, Residual Votes, and Incident Reports in 2004
 In the Margins Political Victory in the Context of Technology Error, Residual Votes, and Incident Reports in 2004 Dr. Philip N. Howard Assistant Professor, Department of Communication University of Washington
Immigrants and the Direct Care Workforce
 JUNE 2017 RESEARCH BRIEF Immigrants and the Direct Care Workforce BY ROBERT ESPINOZA Immigrants are a significant part of the U.S. economy and the direct care workforce, providing hands-on care to older
US Exports and Employment. Robert C. Feenstra University of California, Davis and NBER
 US Exports and Employment Robert C. Feenstra University of California, Davis and NBER National Press Club, Washington, D.C., October 4, 2018 Global Decline in Manufacturing Employment in manufacturing
An economic profile of Right-to-Work states
 ILLINOIS POLICY JANUARY 2015 An economic profile of Right-to-Work states Paul Kersey, Director of Labor Policy The problem Unions are powerful in Illinois, and the state allows them to sign contracts with
Regional Variations in Public Opinion on the Affordable Care Act
 Journal of Health Politics, Policy and Law Advance Publication, published on September 26, 2011 Report from the States Regional Variations in Public Opinion on the Affordable Care Act Mollyann Brodie Claudia
The EEO Tabulation: Measuring Diversity in the Workplace ACS Data Users Conference May 29, 2014
 The EEO Tabulation: Measuring Diversity in the Workplace ACS Data Users Conference May 29, 2014 Ana J. Montalvo Industry and Occupation Statistics Branch Social, Economic, and Housing Statistics Division
US Undocumented Population Drops Below 11 Million in 2014, with Continued Declines in the Mexican Undocumented Population
 Drops Below 11 Million in 2014, with Continued Declines in the Mexican Undocumented Population Robert Warren Center for Migration Studies Executive Summary Undocumented immigration has been a significant
CENTER FOR URBAN POLICY AND THE ENVIRONMENT MAY 2007
 I N D I A N A IDENTIFYING CHOICES AND SUPPORTING ACTION TO IMPROVE COMMUNITIES CENTER FOR URBAN POLICY AND THE ENVIRONMENT MAY 27 Timely and Accurate Data Reporting Is Important for Fighting Crime What
Asia-Pacific to comprise two-thirds of global middle class by 2030, Report says
 Strictly embargoed until 14 March 2013, 12:00 PM EDT (New York), 4:00 PM GMT (London) Asia-Pacific to comprise two-thirds of global middle class by 2030, Report says 2013 Human Development Report says
THE STATE OF THE UNIONS IN 2011: A PROFILE OF UNION MEMBERSHIP IN LOS ANGELES, CALIFORNIA AND THE NATION 1
 THE STATE OF THE UNIONS IN 2011: A PROFILE OF UNION MEMBERSHIP IN LOS ANGELES, CALIFORNIA AND THE NATION 1 Lauren D. Appelbaum UCLA Institute for Research on Labor and Employment 2 Ben Zipperer University
Program Year (PY) 2017 Workforce Innovation and Opportunity Act (WIOA) Allotments; PY 2017 Wagner-Peyser Act Final Allotments and PY 2017 Workforce
 2017 Workforce Innovation and Opportunity Act (WIOA) Allotments; PY 2017 Wagner-Peyser Act Final Allotments and PY 2017 Workforce") This document is scheduled to be published in the Federal Register on 06/15/2017 and available online at https://federalregister.gov/d/2017-12336, and on FDsys.gov DEPARTMENT OF LABOR Employment and Training
This document is scheduled to be published in the Federal Register on 06/15/2017 and available online at https://federalregister.gov/d/2017-12336, and on FDsys.gov DEPARTMENT OF LABOR Employment and Training
Special Report. TD Economics INTERPROVINCIAL MIGRATION: WHERE ARE CANADIANS HEADED? January 27, 2011
 HIGHLIGHTS With the economic recovery well under way, 2010 had a significant pickup in interprovincial migration. Roughly 1% of Canadians (337,000) were on the move. This was 45,000 more than in 2009 and
Louisville: Immigration Rebirth Matt Ruther, Department of Urban and Public Affairs, University of Louisville
 Louisville: Immigration Rebirth Matt Ruther, Department of Urban and Public Affairs, University of Louisville Germantown. Schnitzelburg. Irish Hill. The names of neighborhoods within Louisville s urban
The term developing countries does not have a precise definition, but it is a name given to many low and middle income countries.
 Trade Policy in Developing Countries KOM, Chap 11 Introduction Import substituting industrialization Trade liberalization since 1985 Export oriented industrialization Industrial policies in East Asia The
Should Politicians Choose Their Voters? League of Women Voters of MI Education Fund
 Should Politicians Choose Their Voters? 1 Politicians are drawing their own voting maps to manipulate elections and keep themselves and their party in power. 2 3 -The U.S. Constitution requires that the
New York County Lawyers Association Continuing Legal Education Institute 14 Vesey Street, New York, N.Y (212)
") New York County Lawyers Association Continuing Legal Education Institute 14 Vesey Street, New York, N.Y. 10007 (212) 267-6646 Who is Who in the Global Economy And Why it Matters June 20, 2014; 6:00 PM-6:50
New York County Lawyers Association Continuing Legal Education Institute 14 Vesey Street, New York, N.Y. 10007 (212) 267-6646 Who is Who in the Global Economy And Why it Matters June 20, 2014; 6:00 PM-6:50
Economic and Demographic Trends
 Economic and Demographic Trends Minden, Kearney County, and the Surrounding Area March 2015 Prepared by: Ken Lemke Nebraska Public Power District Economic Development Department PO Box 499, 1414 15 th
MADE IN THE U.S.A. The U.S. Manufacturing Sector is Poised for Growth
 MADE IN THE U.S.A. The U.S. Manufacturing Sector is Poised for Growth For at least the last century, manufacturing has been one of the most important sectors of the U.S. economy. Even as we move increasingly
In the 1960 Census of the United States, a
 AND CENSUS MIGRATION ESTIMATES 233 A COMPARISON OF THE ESTIMATES OF NET MIGRATION, 1950-60 AND THE CENSUS ESTIMATES, 1955-60 FOR THE UNITED STATES* K. E. VAIDYANATHAN University of Pennsylvania ABSTRACT
Economic Geography Chapter 10 Development
 Economic Geography Chapter 10 Development Development: Key Issues 1. Why Does Development Vary Among Countries? 2. Where Are Inequalities in Development Found? 3. Why Do Countries Face Challenges to Development?
At yearend 2014, an estimated 6,851,000
 U.S. Department of Justice Office of Justice Programs Bureau of Justice Statistics Correctional Populations in the United States, 2014 Danielle Kaeble, Lauren Glaze, Anastasios Tsoutis, and Todd Minton,