Kingdom of Cambodia Study for Poverty Profiles in the Asian Region. Final Report
|
|
|
- Lucinda Park
- 5 years ago
- Views:
Transcription
1 Kingdom of Cambodia Study for Poverty Profiles in the Asian Region Final Report August 2010 JAPAN INTERNATIONAL COOPERATION AGENCY OPMAC Corporation
2 Poverty Indicator Basic data Region (*) Country Year Population, total (millions) Population growth (annual %) GDP, PPP (constant 2007 international $) (billions) GDP per capita, PPP (constant 2007 international $) GDP growth (annual %) Ap Cambodia , (Source) United Nations Development Programme, Human Development Report 2009 (2009) (Note) * AF: Africa, Ap: Asia and Pacific, CLA: Central and Latin America, ME: Middle-east and Europe Poverty incidence (%) National Rural Urban Poverty Gap Index at $1.25 Poverty Poverty Gap Index (National) Source Survey year Inequality Gini index Year Phnom Penh: 0.83 Other Urban: * 7.22 Cambodia Socio-Economic Survey (Source) World Bank, Poverty Profile and Trends in Cambodia (2009) (Note) * Data of Poverty Gap Index at $1.25 is for (World Bank, World Development Indicator 2010 (2010)) Remarks (Areas, populations & social groups considered to be vulnerable and Gini index disadvantageous) Not Specified
3 Map of Cambodia
4 Maps of Social indicator

5

6

7

8
9

10

11

12
13
14 Poverty Indicator Map of Cambodia Maps of Social indicator Table of Contents List of Abbreviations and Acronyms Table of Contents Chapter 1 Income Poverty Analysis Measurement of Income Poverty Source of Data for Poverty Analysis Poverty Line Income Poverty Indicators Poverty Trends at National Level and by Region Poverty Trends by Region and by Province Poverty Trends by Topography Poverty Trends by Socio-economic Characteristics Inequality Lorenz Curve and Gini Coefficient Theil Index... 9 Chapter 2 Non-Income Poverty Analysis Designated Poor Areas and Socially Vulnerable Groups Commune database Identification of Poor Households Programme (ID Poor) Vulnerability Analysis Human Development Index and Human Poverty Index Hazard Analysis: Landmines and Unexploded Ordnances (UXO) Chapter 3 Explanatory Factors of Poverty in Cambodia Domestic Factors National Development and Public Expenditure Industrial Structure and Employment Opportunities Land Distribution and Use Ethnicity Geopolitical Factors Landmine and Explosive Remnants of War (ERW) Natural Disasters Factors related to Globalization Labor Migration, Trafficking and Remittance Trade Liberalization Foreign Investment and the Economic Crisis in Asia Chapter 4 Social Protection Mechanisms Formal Social Protection Systems Social Insurance Programs Health Insurance Programs Policy Papers Quasi-formal Social Security System Regulation and Commercialization of Microfinance Institution Microfinance by Sector Microfinance by Province... 41
15 4.2.4 Microfinance Activities by Formal Financial Sector Micro-insurance Informal Social Security System Chapter 5 Poverty Monitoring Cambodia MDGs CMDG 1: Eradicate Extreme Poverty and Hunger CMDG 2: Achieve universal nine year basic education CMDG 3: Promote gender equality and women's empowerment CMDG 4: Reduce child mortality CMDG 5: Improve maternal health CMDG 6: Combat HIV/AIDS, malaria and other diseases CMDG 7: Ensure environmental sustainability CMDG 8: Forge a global partnership for development CMDG9: De-mining, UXO and Victim Assistance Poverty Monitoring Framework National Strategy Development Plan and Poverty Reduction Data Collection System Harmonization of Data Monitoring Appendix Appendix 1: Poverty and Inequality Indicator Appendix 2: Reference Data and Information Annex (1) List of Major Policy Documents (2) List of Major Statistical Surveys (3) List of Major Microfinance Institutions (4) List of Major NGOs (international and national) and CSOs (5) List of Major Socio-economic Research Institutions (6) List of Other References List of Tables and Figures [Table] Table 1-1: Poverty Lines... 2 Table 1-2: Poverty Estimates by Region... 3 Table 1-3: Poverty Gap and Severity by Region... 3 Table 1-4: Poverty Estimates by Province (2004)... 5 Table 1-5: Poverty Incidence by Zone (2004)... 6 Table 1-6: Poverty Gap and Severity by Topography... 7 Table 1-7: Poverty Incidence by Occupation of Household Head (2004)... 7 Table 1-8: Poverty Incidence by Land Holding Status... 8 Table 1-9: Percentage of Population below the Poverty Line by Size and Distance to the Nearest All-Weather Road (2004)... 8 Table 1-10: Estimated Gini Coefficient of Per Capita Consumption... 9 Table 2-1: Poverty Rate by Province ( ) Table 2-2: Districts with Worst Poverty Rates (2009) Table 2-3: Human Development Index and Human Poverty Index in Cambodia (2004) Table 2-4: List of 21 Districts with Most Casualties of Landmine and ERW Table 3-1: Distribution of Households by Availability of Amenities (2008)... 26
16 Table 3-2: Source of Growth by Main Economic Activity, Table 3-3: Share of Employment by Sector (2008) Table 3-4: Socio-economic Impact of Landmines/ERW on Village (2002) Table 3-5: Achievements in Demining Activities in Cambodia ( ) Table 3-6: Migrants by Previous Residence (1998 and 2008) Table 5-1: Attainment of Millennium Development Goals in Cambodia Table 5-2: Database Structure of CamInfo [Figure] Figure 1-1: Poverty Incidence by Province (2004)... 4 Figure 1-2: Number of the Poor by Zone (2004)... 6 Figure 1-3: Lorenz Curves in Cambodia (1993/94, 2004, 2007)... 9 Figure 1-4: Decomposition of the Theil Index (2004 and 2007) Figure 2-1: Number of District by Poverty Rate ( ) Figure 2-2: Poverty Maps at District Level by CBD Figure 2-3: Poverty Maps at Commune Level by CBD Figure 2-4: Integrated Food Security and Humanitarian Phase Classification in Cambodia (2007) Figure 2-5: Map of Food Insecurity in Cambodia (2008) Figure 2-6: Casualties by Landmine and ERW in Cambodia Figure 2-7: Accident Locations in Figure 2-8: Map of 21 Districts with Most Casualties from Landmines and ERW Figure 3-1: Government Expenditure by Sector ( ) Figure 3-2: Household Amenities by Commune Figure 3-3: Land Distribution in Cambodia (2007) Figure 3-4: Landmine/ERW Contamination Map of Cambodia (2008) Figure 4-1: Transition of Microfinance Usage Purpose Figure 4-2: Provincial Distribution of MFI Outstanding Loan Figure 4-3: Provincial Distribution of Microfinance Borrowers Figure 4-4: Provincial Distribution of ACLEDA Bank Loan Outstanding Figure 4-5: Provincial Distribution of ACLEDA Bank Borrowers Figure 4-6: Source of Funds by Mobility Group... 45
17 List of Abbreviations and Acronyms ADB : Asian Development Bank APM : Anti-personnel mine ATM : Anti-tank mine CARD : Council for Agriculture and Rural Development CBHI : Community Based Health Insurance CDB : Commune Database CDHS : Cambodia Demographic and Health Surveys CIDA : Canadian International Development Agency CMAC : Cambodian Mine Action Centre CMVIS : Cambodia Mine UXO Victim Information System CMDGs : Cambodia Millennium Development Goals CNIP : Cambodia Nutrition Investment Plan CPI : Consumer Price Index CSES : Cambodia Socio-Economic Survey D&D : Decentralization and Deconcentration EIC : Economic Institute of Cambodia EMIS : Education Management Information System ERW : Explosive Remnants of Wars FAO : Food and Agriculture Organization of the United Nations GIS : Geographic Information System GTZ : Deutsche Gesellschaft für Technische Zusammenarbiet GmbH HDI : Human Development Index HEF : Health Equity Fund HIV/AIDS : Human Immunodeficiency Virus / Acquired Immune Deficiency Syndrome HMIS : Health Management Information System HPI : Human Poverty Index ID Poor : Identification of Poor Households Programme IFAD : International Fund for Agricultural Development JICA : Japan International Cooperation Agency JMIs : Joint Monitoring Indicators L1S : National Level 1 Survey MAFF : Ministry of Agriculture, Forestry and Fisheries MDGs : Millennium Development Goals MDI : Microfinance Deposit-taking Institution MEF : Ministry of Economy and Finance MFIs : Microfinance Institutions MOH : Ministry of Health MOL : Ministry of Labor MOSVY : Ministry of Social Affairs, Veteran and Youth Rehabilitation MOP : Ministry of Planning
18 NAR : Net Admission Rate NBC : National Bank of Cambodia NCDD : National Committee for Sub-National Democratic Development NER : Net Enrollment Rate NGO : Non Governmental Organization NIS : National Institute of Statistics NPRS : National Poverty Reduction Strategy NSDP : National Strategic Development Plan NSSF : National Social Security Fund NSSFC : National Social Security Fund for Civil Servants PRSP : Poverty Reduction Strategy Paper RTAVIS : Road Traffic Accident and Victim Information System SESC : Socio-Economic Survey of Cambodia Sida : Swedish International Development Agency TWG : Technical Working Group UNDP : United Nations Development Programe UNFPA : United Nations Population Fund UNHCR : United Nations High Commissioner for Refugees UNICEF : United Nations Children s Fund UNESCAP : United Nations Economic and Social Commission for Asia and the Pacific UNTAC : United Nations Transition Authority in Cambodia UXO : Unexploded Ordnances VAT : Value Added Tax WB : World Bank WFP : United Nations World Food Programme WHO : World Health Organization
19 Chapter 1 Income Poverty Analysis 1.1 Measurement of Income Poverty Source of Data for Poverty Analysis Poverty analyses of Cambodia are based on the Cambodia Socio-Economic Surveys (CSES) which are sample surveys showing the socio economic status of households in the country. In the past, seven CSESs were conducted by the National Institute of Statistics (NIS) with support from the World Bank (WB). However, comparability of data from these CSES is limited because of changes to the geographical sampling frame as well as geographical coverage 1. Another key source of data is the General Population Census of Cambodia. The latest Census (hereinafter referred to as the Census 2008 ) was carried out in 2008 with support from donors (or development partners ), including the Japan International Cooperation Agency (JICA). It provides more reliable data on the population, which is divided into different administrative levels (commune, district and provincial). The poverty analysis presented in this Study is mainly based on a comparison of data from CSES (1993/94) and CSES (2004), since the consumption modules in the questionnaires used by these two surveys have a similar structure. For the reference, the results of CSES (2007), which is not fully comparable to CSES (1993/94) and CSES (2004), are mentioned in this report. The Study also refers to the results of the Census Poverty Line The Government of Cambodia estimates the incidence of poverty based on household consumption data. In the National Poverty Reduction Strategy (NPRS), the food poverty line is estimated by the food consumption basket with a minimum nutritional requirement for survival of 2,100kcal 2. An absolute poverty line 3, which considers non-food consumption plus food consumption, is also defined. The food basket used to compute the minimum consumption level is based on data from the CSES 1993/94 4. Absolute Poverty Line = Food Poverty Line (minimum food consumption) + Minimum non-food consumption In order to compare changes in poverty over time, it is necessary to adjust the poverty lines by changes in prices of the consumption basket as well as spatial price difference. The poverty 1 For details on reliability and comparability of the data from CSES, refer to Chapter 5. 2 The standard minimum requirement of calorie intake by World Health Organization (WHO) and Food and Agriculture Organization (FAO) is 2,000 2,400 kcal for people in developing countries. The standard level is adjusted by country, age and ethnicity. 3 In Cambodia, the poverty line composed of both food and non-food consumption is referred to as the complete poverty line or the overall poverty line. To avoid confusion, it is referred to as the absolute poverty line in this Report. 4 Cambodia s first household survey, the Socio-Economic Survey of Cambodia (SESC), was conducted in 1993/94 with a sample size of 5,578 households. It was in CSES (2004) that had a sampling frame covering the whole country with a sample size of as many as 11,984 households (720 villages). CSES (2004) introduced a month-long diary component to collect information on household income and consumption. CSES surveys in 2007 and 2008 established a small-sample annual survey approach (3,593 households in 360 villages, and 3,548 households in 357 villages respectively). On price data, the new consumer price index has expanded to cover markets in five main provincial centers in addition to Phnom Penh. CSES (2009) had a sample of 12,000 households, but the analysis of this data is not expected to be completed before September or October Analysis on CSES (2008) data had not been completed either as of May
20 line adjusted by 2007 prices are 3,092 Riels (0.76 US dollars) 5 per capita per day in Phnom Penh, 2,704 Riels (0.66 US dollars) in other urban areas, and 2,367 Riels (0.57 US dollars) in rural areas 6. Region Food poverty line (a) Table 1-1: Poverty Lines (current Riel per capita per day) 1993/ * 2007* Non-food consumption (b) Absolute poverty line (c) = (a )+ (b) Food poverty line (a) Non-food consumption (b) Absolute poverty line (c) = (a )+ (b) Food poverty line (a) Non-food consumption (b) Absolute poverty line (c) = (a )+ (b) Phnom Penh 1, ,578 1, ,351 2, ,092 Other Urban ,265 1, ,952 2, ,704 Rural ,118 1, ,753 1, ,367 (Source) World Bank, Poverty Profile and Trends in Cambodia (2009), p.7, p.12 (Note) * In annual average prices However, there is some discussion among Government authorities and their development partners about the extent to which the current poverty lines reflect the reality of poverty in Cambodia because of changes in consumption and living patterns ever since 1993/94 when the present definition of poverty line was introduced. Changes in the parameters for price adjustments are also raised in the said discussion because prices in rural areas have been more precisely reflected since 2004 through applying the rural Consumer Price Index (CPI). 1.2 Income Poverty Indicators Poverty Trends at National Level and by Region Due to the differences in sample size and methodologies, there are constraints on comparisons of poverty estimates based on the CESEs conducted in different years. However, those poverty estimates give some indication of the overall trends in poverty despite some discussions over the actual level of poverty in the country. For the period 1993/94 to 2007, the absolute poverty head count ratio (hereinafter referred to as poverty incidence ) 7 at the national level dropped from 39% to 30%. In Phnom Penh, the population living below the poverty line decreased to less than 1% in In other urban areas, the poverty incidence also declined from 37% to 22%. The poverty incidence in rural areas decreased to 35% from 43% for the same period. On the other hand, reduction in food poverty in the country seems to have been limited between 2004 and 2007, falling only from 19.7% in 2004 to 18.0% in The food poverty incidence in Phnom Penh decreased to a negligible level of 0.1% in In other urban areas, 5 Reference exchange rate (period average) is 1USD = 4,056.2 Riels as of 2007 (International Monetary Fund, International Financial Statistics Yearbook 2009 ) 6 According to the poverty analysis that World Bank conducted based on the outcome of CSES (2008), the poverty line of Phnom Penh as of 2008 is estimated to be 3,994 Riels per person per day, while it is 3,270 Riels for other urban areas and 3,121 Riels for rural areas. It however has not been officially endorsed since it was shared in April In this report, poverty incidence or the poor mean the absolute poverty headcount ratio or the poor population below the absolute poverty line unless other wise stated. 2
21 the food poverty incidence is around 13-14%. The population living below the food poverty line accounts for around 20% in rural areas. Table 1-2: Poverty Estimates by Region Region Poverty headcount Poverty Line Phnom Penh Other Urban Rural Cambodia Food Poverty Line Phnom Penh Other Urban Rural Cambodia (Source) World Bank. Poverty Profile and Trends in Cambodia (2009), p.28, Table 11 For the whole country, the poverty gap index, which shows the gap between the standard of living of the poor and the poverty line, fluctuated between %. Urban areas other than Phnom Penh and rural areas also had the same pattern. However, the poverty gap in other urban areas is lower than the national level while the poverty gap in rural areas is higher. On the other hand, the poverty gap in Phnom Penh continuously dropped from 3.1% in 1993 to 0.08% in It suggests that the average consumption level of the poor in Phnom Penh reached almost the poverty line and the consumption level of the poor in the capital may be much better off. It indicates that the disparity of consumption level of the poor from the poverty line did not obviously improve except Phnom Penh. The poverty severity, which reflects uneven distribution of consumptions among the poor, shows the same pattern as the poverty gap. In Phnom Penh, inequality among the poor had almost disappeared by Although the poverty severity index in other urban areas was higher than the ones in the rural areas in 1993, it decreased to 2.0% in 2007 which is lower than the rural poverty severity of 2.9%. At the national level, inequality among the poor improved from 3.1% in 1993 to 2.6% in 2007 after fluctuating between %. It implies that the consumption level of the poorest in the country may have slightly increased. Table 1-3: Poverty Gap and Severity by Region Region Poverty Gap Phnom Penh Other Urban Rural Cambodia Poverty Severity Phnom Penh Other Urban Rural Cambodia (Source) World Bank. Poverty Profile and Trends in Cambodia (2009), p.28, Table 11 3

22 1.2.2 Poverty Trends by Region and by Province Poverty indicators by province are available in 2004 due to the large sample size of CSES (2004) which can be disaggregated by provincial level 8. A comparison at provincial level indicates a large gap in poverty across the provinces. Phnom Penh, the capital of Cambodia, has the lowest poverty incidence in the country, whereas Kampong Thom and Siem Reap (the Tonle Sap Zone) and Kampong Speu (the Plateau/Mountain Zone) have poverty incidences of more than 50%. In the Plains, the two provinces of Kandal and Takeo have relatively lower poverty incidences of less than 30%, while the poverty incidences of the other three provinces are more than 35%. In the Tonle Sap Zone, all the provinces have a higher poverty incidence than the national average. On the other hand, the provinces in the Coastal Zone have lower poverty incidences of less than 30%. In the provinces in the Plateau/Mountain Zone, the poverty incidence is very high at more than 40%. (Source) World Food Programme and Food and Agriculture Organization, Integrated Food Security and Humanitarian Phase Classification (IPC): Pilot in Cambodia (2007), p.19 Figure 1-1: Poverty Incidence by Province (2004) There are also differences in poverty gap and severity across provinces. As mentioned above, the poverty gap and severity in Phnom Penh are negligible. In provinces with a poverty incidence of more than 50%, the poverty gap and severity are very high while the provinces with lower poverty incidences have lower poverty gaps and severity. Siem Reap, in the Tonle Sap Zone, has the highest poverty gap and severity at 17.3% and 7.46%, respectively. This suggests that the poor in this province have suffered from very low level of consumption and 8 Since the forthcoming CSES (2009) will provide data which can be disaggregated by provincial level with a sample size of 12,000, poverty trends by provincial level can be analyzed for 2004 to Data from the CSES (2007) and CSES (2008) on the other hand cannot be disaggregated by provincial level due to the limited sample size of around 3,500 households. 4
23 that there is serious inequality among the poor. In the Plateau/Mountain Zone, the provinces face a serious poverty gap and poverty severity ratio as well. Table 1-4: Poverty Estimates by Province (2004) (%) Code Province Poverty Headcount Index Poverty Gap Index Poverty Severity Index Phnom Penh Zone 12 Phnom Penh Plains Zone 03 Kampong Cham Kandal Prey Veng Svay Rieng Takeo Tonle Sap Zone 01 Banteay Meanchey Battambang Kampong Thom Siem Reap Kampong Chhnang 15 Pursat Coastal Zone 07 Kampot Preah Sihanouk 23 Kep Koh Kong Plateau / Mountain Zone 05 Kampong Speu Kratie 11 Mondul Kiri 13 Preah Vihear 16 Ratanak Kiri Stung Treng 22 Otdar Meanchey 24 Pailin (Source) Ministry of Planning, A Poverty Profile of Cambodia 2004 (2006), p.55, Table 10.4 (Note) Poverty indicators for seven provinces in the Plateau/Mountain Zone are aggregated wholly into one zone due to insufficient sample size in those provinces caused by limited accessibility Poverty Trends by Topography By topography, besides Phnom Penh, the Coastal Zone has the lowest poverty incidence at 27%, while the Plains have the second lowest poverty incidence at 32.5%. In the Tonle Sap Zone, more than 40% of the population is living below the poverty line. In the Plateau/Mountain Zone, half of the population is suffering from poverty. There are urban/rural gaps within each zone. In the Plains and Coastal Zones, the urban poverty incidence is 14% and 20% respectively, while the rural poverty incidence in those Zones is around 30%. In the Plateau/Mountains Zone, the urban poverty incidence of 33% is much lower than the rural poverty incidence of 56%. However, it is higher than the rural poverty incidence in the Coastal Zone (30%). 5
24 Table 1-5: Poverty Incidence by Zone (2004) Zone Urban Areas Rural Areas Total Phnom Penh Plains Tonle Sap Coastal Plateau/Mountains (Source) World Bank, Cambodia Halving Poverty by 2015? Poverty Assessment 2006 (2006), p.39, Table 3.1 (%) Looking at the number of the poor, a large number of the poor inhabit the Plains Zone and the Tonle Sap Zone, in particular the rural areas. Approximately 70% of the country s poor are concentrated in the rural areas of these zones. Due to the high population density, the Plains Zone has a larger number of the poor despite of the lower poverty incidence. The concentration of poor population in the Tonle Sap Zone is due to the larger population and the higher poverty incidence. On the other hand, the poor in the Plateau/Mountains Zone, which has the highest poverty incidence, only accounts for 14% of the total poor population in the country due to its small-scale population. Distribution of the Poor (%) Phnom Penh 10 Plains 1 39 Tonle Sap 4 33 Zone Coastal 1 4 Urban Rural Plateau/Mountains (Source) World Bank, Cambodia Halving Poverty by 2015? Poverty Assessment 2006 (2006), p.39, Table 3.1 Figure 1-2: Number of the Poor by Zone (2004) 1 14 There are significant gaps in the poverty gap and severity of poverty across the topographical zones. The Plains and Coastal Zones have lower poverty gaps and a less unequal distribution of poverty, while the Tonle Sap and the Plateau/Mountains Zones have higher intensity of poverty and greater inequality among the poor. It means that the poor in the Tonle Sap and the Plateau/Mountains Zones suffer from more serious poverty than the poor in the Plains and Coastal Zones. 6
25 Table 1-6: Poverty Gap and Severity by Topography (%) Zone Poverty Gap Poverty Severity Phnom Penh Plains Tonle Sap Coastal Plateau/Mountains (Source) Ministry of Planning, A Poverty Profile of Cambodia 2004 (2006), p.55, Table Poverty Trends by Socio-economic Characteristics (1) Employment Status Poverty estimates by employment status shows the gaps in poverty incidence across different labor groups. Households headed by domestic workers 9 have the highest poverty incidence at 50%. Households headed by farmers also have a high poverty incidence: more than 40% of farmers lived below the poverty line. The households headed by Domestic workers account for 48% of the total poor households, while 13% of the poor households are headed by farmers. On the other hand, households headed by non-farm self-employed and private wage earner have lower poverty incidences of less than 30%. Among households headed by workers in the public sector, the poverty incidence is only 13% which was the lowest among the different labor groups. Table 1-7: Poverty Incidence by Occupation of Household Head (2004) (%) Occupation Poverty Incidence Public Sector 13 Self-employed, non-farm 28 Private wage 29 Other (unspecified) 32 Not in labor force 32 Unpaid family worker 32 Unemployed 39 Self-employed, farm 41 Domestic worker 50 (Source) World Bank, Cambodia Halving Poverty by 2015? Poverty Assessment 2006 (2006), p.45, Figure 3.9 By gender, in general, women continue to be concentrated in low-wage and low-income economic sectors and are paid less than men for the same work in Cambodia. However, there is no statistical difference in poverty incidence of male and female headed households by the CSES (2004) data: 35% for male headed households and 34% for female headed households. (2) Land Holding Status On average, the landless poor in Cambodia are not necessarily worse off or more disadvantaged than the poor people with land. Despite the fact that land is a critical asset for the rural population in Cambodia, the poverty incidence is higher for rural households with land (35.2%) than for those without (25.3%). In the rural areas of the Coastal Zone, the difference in poverty incidence by land holding is critical: 29.4% for land holders and 7.9% for the landless. In urban areas, the gap between land-holders and the landless is considerable: 28.6% for land holders and 8.9% for landless. 9 According to Cambodia Halving Poverty by 2015? Poverty Assessment 2006, domestic worker indicates those employed population involved in domestic labor at home. It is non-permanent employment in informal sector same as Motodop (moped taxi) drivers, construction workers and small-scale street vendors. However there is no clear definition of domestic worker without details (sex ratio, age distribution etc), which makes further analysis difficult. 7
26 A recent WB s report 10 points out that the landless may have more promising non-land employment or livelihood opportunities than land-holders with very limited size of land and subsistence-oriented farming. In particular, in urban areas, the landless may choose to sell the small plot of their land for financing investment in non-agricultural economic activities, even in informal sector. These plots are often too small to make their living by keeping them as agricultural lands. Table 1-8: Poverty Incidence by Land Holding Status (%) Zone Household with Land Household without land Cambodia Urban Urban Phnom Penh Urban Plains Urban Tonle Sap Urban Coastal Urban Mountains Rural Rural Phnom Penh Rural Plains Rural Tonle Sap Rural Coastal Rural Mountains (Source) World Bank, Sharing Growth: Equity and Development in Cambodia (Equity Report 2007) (2007), p.59, Table 4.1 (3) Location and Size of Village Small villages with less than 1,000 residents, that are located more than 5km to the nearest road, have a higher poverty incidence (52.5%) than small villages with easier access to roads (43.4%). Likewise, larger villages with more than 1,000 residents that are located more than 5km to the nearest all-weather road have a higher poverty incidence (38.0%) than large villages located less than 5km to the nearest road (32.5%) The gap between small and isolated villages and the better connected villages in terms of both volume and access is immense, which suggests that isolation affects poverty and the existing gap between rich and poor underpins inequality. Another look at the same data however gives another implication. Remote but denser villages have slightly less poverty incidence (38.0%) than accessed and sparse villages (43.4%). These results indicate that better and larger access to infrastructure within each village due to the larger volume of population may absorb poverty incidence, but it still remains not too effective compared with better access to main roads. Table 1-9: Percentage of Population below the Poverty Line by Size and Distance to the Nearest All-Weather Road (2004) Village Size Distance to the Nearest All-Weather Road Less than 5km More than 5km More than 1,000 persons 32.5% (±0.7) 38.0% (±1.7) Less than 1,000 persons 43.4% (±0.9) 52.5% (±1.8) (Source) World Bank, Sharing Growth: Equity and Development in Cambodia (Equity Report 2007) (2007), p.59, Table World Bank, Sharing Growth: Equity and Development in Cambodia (Equity Report 2007) (2007), p.53-p.60 8
27 1.3 Inequality Lorenz Curve and Gini Coefficient The Lorenz Curves (Figure 1-2) shows a continuous deterioration of inequality in Cambodia from 1993/94 to 2007 although poverty in the country has reduced overall. The Gini Coefficient also indicates a worsening of inequality in the country: in 2004 and in And the Gini Coefficient in 2007 shows an acute inequality in distribution. By region, inequality in Phnom Penh slightly improved to 0.34 from 0.37 for the same period. Poverty reduction in Phnom Penh with negligible level of poverty gap and severity contribute to reduction of inequality among the people. In rural areas, inequality by the Gini Coefficient increased slightly from 0.34 to 0.36 for the period from 2004 to 2007 while the rural poverty decreased. It implies that the economic growth enabled some rural households to move out of the poverty but not benefited equally to all the rural households. In other urban areas, the situation worsened significantly. The Gini Coefficient increased to 0.47 from 0.43 which indicates a marked rise in inequality amongst the population. Although the urban poverty reduced for the same period, the consumption of the poorer households did not increase as much as that of the higher income households, which worsened the inequality. Share in Total Consumption (%) Bottom Quintile 1993/ degree line 2nd 3rd 4th Top Quintile Consumption Quintile (Source) Data on 1993/94 and 2004 from Ministry of Planning, Poverty Profile of Cambodia 2004 (2006), p.40, Table 9.2 and Data on 2007 from World Bank, World Development Indicator 2010, p.94 Table 1-10: Estimated Gini Coefficient of Per Capita Consumption Region Phnom Penh Other Urban Rural Cambodia (Source) World Bank, Poverty Profile and Trends in Cambodia (2009), Phnom Penh. p.21 Figure 1-3: Lorenz Curves in Cambodia (1993/94, 2004, 2007) Theil Index The Theil Index is another inequality indicator, which shows the weighted average of inequality within subgroups as well as inequality among those subgroups. In other words, the index 9
28 disaggregates the overall Theil index to show the intra-regional (or group) and inter-regional (or group) attributions. This can serve as a helpful tool for the analysis of regional inequality as it suggests the relative importance of spatial dimension of inequality. The Thiel Index also indicates that inequality in the country has increased as the index increased from 0.31 in 2004 to 0.42 in The largest component of overall inequality is inequality with in rural areas, which worsened from 0.17 in 2004 to 0.21 in While inequality within other urban areas and within Phnom Penh changed only slightly, inequality between regions increased and contributed to the overall figure Theil Index Between regions Within rural Whithin other urban Within Phnon Penh Year (Source) World Bank, Poverty Profile and Trends in Cambodia (2009), p.25, Figure 14 Figure 1-4: Decomposition of the Theil Index (2004 and 2007) 10
29 Chapter 2 Non-Income Poverty Analysis 2.1 Designated Poor Areas and Socially Vulnerable Groups In the National Poverty Reduction Strategy (NPRS), the Government of Cambodia targeted 7,500 households or 37,500 people with the aim of improving housing and living conditions, without designating specific geographical target areas. The National Strategic Development Plan (NSDP), which sets clear targets for poverty reduction and progress towards Cambodian Millennium Development Goals (CMDGs), does not identify specific geographical areas to be targeted or prioritized though it does emphasize poverty reduction in rural areas. Despite the fact that the Government is not targeting any specific geographical areas, it has promoted decentralization and de-concentration (D&D) and participatory development, including planning, management and resource mobilization, at the local level through the Commune Councils. It has also tried to address poverty through raising the quality of local development and social services as well as improving the access of the poor to these services Commune database At the Commune level, the Ministry of Planning (MOP) has been developing the Commune Database (CDB) 11. CDB is an information system to support commune / sangkat planning, fund allocation as well as sub-national administration management and development. It is composed of demographic and socio-economic data at the village and commune level and is used to estimate poverty levels in all commune / sangkat to help determine the allocation of Commune / Sangkat Development Fund. The poverty rate by CDB is based on a set of 13 CDB variables of the following categories. Village and commune/sanghat data is collected, re-recorded in December every year, and reported to capital and provincial department of planning to enter the data into computer system. The processed documents to illustrate commune / sangkat situation are feedback to commune / sangkat between March and April every year. Household size Literacy rate Literacy rate for women aged Literacy rate for men aged Ratio of children aged 6-14 not go to school Housing characteristics No latrine per family TV per family Motorbike per family Concrete house per family Thatch house per family Ratio of house with electricity Access to basic services Ratio of family use TBA (Traditional Birth Attendant) Ratio water in home less than 150m 11 The development of CDB has been supported by UNDP for monitoring the CMDGs. 11
30 Data collection depends on village chiefs and commune/sanghat clerks, which does not represent household or individual situation but rather the situation in the village. There hence are issues of data reliability and objectivity. Based on the data in the CDB, poverty has declined in all provinces, although the rate of poverty reduction differs across provinces. In 2010, Phnom Penh had the lowest poverty rate of 0.1% while the three provinces in the Plateau/Mountain Zone of Mondul Kiri, Preah Vihear, Ratanak Kiri have rates of more than 40%. The provinces in the Plain and Costal Zones have relatively lower poverty rates within a range of between 15-25%. The provinces in the Tonle Sap Zone have poverty rates around 30%. In the Plateau/Mountain Zone, provinces have relatively higher poverty rates around 40%, with the exception of the provinces of Kampong Speu and Pailin. Table 2-1: Poverty Rate by Province ( ) Code Province (%) Year Phnom Penh Zone 12 Phnom Penh Plain Zone 03 Kampong Cham Kandal Prey Veng Svay Rieng Takeo Tonle Sap Zone 01 Banteay Meanchey Battambang Kampong Thom Siem Reap Kampong Chhnang Pursat Coastal Zone 07 Kampot Preah Sihanouk Kep Koh Kong Plateau/Mountain Zone 05 Kampong Speu Kratie Mondul Kiri Preah Vihear Ratanak Kiri Stung Treng Otdar Meanchey Pailin (Source) Database provided by the Ministry of Planning and the National Committee for Sub-National Democratic Development (NCDD) 12
31 Taking a look at poverty rate by district (185 in total) from 2004 to 2010, there shows a steady poverty reduction in the country. The number of districts with over 30% of poverty rates decreased from 151 (2004) to 75 (2010), of which a drastic decrease in number of districts with 40 to 50% is the main traction. The worst poverty rates among all districts show a remarkable improvement from 56.5% (2004) to 47.1% (2010), and median also indicates same from 37.4% to 27.6% On the other hand, the number of districts with poverty rates between 20 to 30% sharply increased from 26 (2004) to 75 (2010), which implicates that the poverty rates remain at certain level. No of district Year >50 50>40 40>30 30>20 20>10 10>=0 (Source) Ministry of Planning and the National Committee for Sub-National Democratic Development (NCDD) Figure 2-1: Number of District by Poverty Rate ( ) At the district level, the poverty rates of most districts in the Plain and Coastal Zones decreased to less than 30% for the period from 2004 to In the Tonle Sap Zone, poverty fell to less than 40% in most districts, though some districts still have poverty rates of more than 40%. In the Plateau/Mountain Zone, nine districts located in the Northeast of the country still have high poverty rates of more than 45%, while the only limited districts reduced to less than 30%. 13

32 Poverty Rate by District (2009) Poverty Rate by District (2004) (Source) Ministry of Planning, Poverty and Select CMDGs Maps and Charts (2009), p.8-9, Maps 3-4. Figure 2-2: Poverty Maps at District Level by CBD As of 2009, the worst 15 districts have poverty rates between 42.4 to 48.6%, which are all located in the Plateau/Mountain Zone. Out of 15, as many as 6 districts are from Preah Vihear Province. 14
33 No Table 2-2: Districts with Worst Poverty Rates (2009) District Poverty Rates (%) Province Zone Ta Veaeng Ratanak Kiri Plateau/Mountain Siem Pang Stung Treng Plateau/Mountain Chhaeb Preah Vihear Plateau/Mountain Thala Barivat Stung Treng Plateau/Mountain Sambour Kracheh Plateau/Mountain Veun Sai Ratanak Kiri Plateau/Mountain Chey Saen Preah Vihear Plateau/Mountain Choam Khsant Preah Vihear Plateau/Mountain Sangkom Thmei Preah Vihear Plateau/Mountain Andoung Meas Ratanak Kiri Plateau/Mountain Kaoh Nheaek Mondul Kiri Plateau/Mountain Rovieng Preah Vihear Plateau/Mountain Kaev Seima Mondul Kiri Plateau/Mountain Kuleaen Preah Vihear Plateau/Mountain Aoral Kampong Speu Plateau/Mountain (Source) Ministry of Planning and the National Committee for Sub-National Democratic Development (NCDD) At the commune level, the patterns and trends in poverty reduction is consistent with poverty reduction trends at the district level. 15
34 Poverty Rate by Commune (2009) Poverty Rate by Commune (2004) (Source) Ministry of Planning, Poverty and Select CMDGs Maps and Charts (2009), p.6-7, Maps 1-2. Figure 2-3: Poverty Maps at Commune Level by CBD Identification of Poor Households Programme (ID Poor) Since poverty-oriented development planning and service provision has been well-targeted at the poor who need assistance, the MOP, with the support of Deutsche Gesellschaft für Technische Zusammenarbiet GmbH (GTZ), started the Identification of Poor Households 16
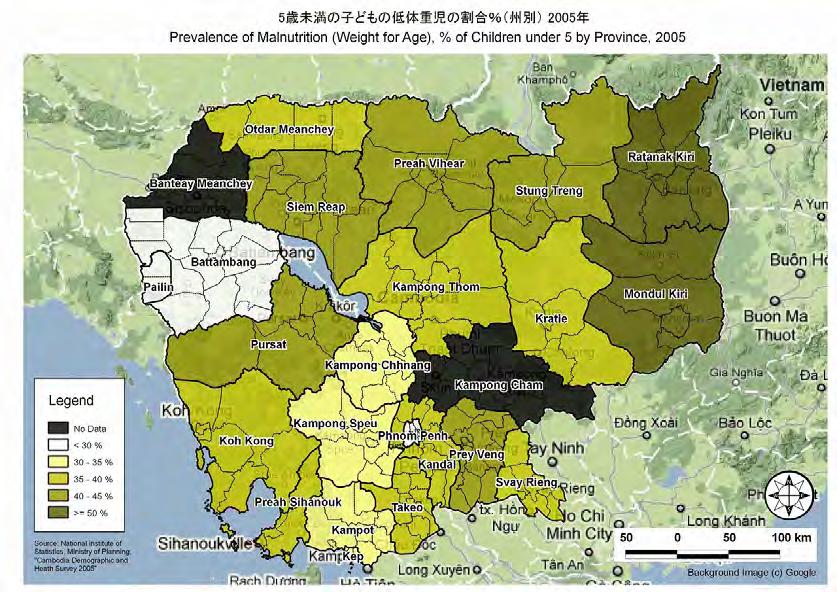
35 Programme (ID Poor) 12. The key objective of ID Poor is to standardize the identification methods of poor households nationwide, promote the use of the collected data by government institutions, non-governmental organizations (NGOs), and sector-specific programs and projects, and Commune Councils to target services and assistance to poor households. The ID Poor data to be collected include observable and verifiable assets which show a income level of household as well as social indicators, such as dependency ratio, school attendance, crises or shocks and household composition, which can used for calculating comparative poverty levels of villages, communes, districts and provinces. In order to increase transparency of the process and the accuracy of the results, the program trains the village representative groups who are responsible to collect data. It also help ensure standardization of survey methods as well as survey quality. The program is still under implementation and will cover all the 23 provinces in the country by Vulnerability Analysis Vulnerability is defined as the exposure and sensitivity of person or household to a risk falling into hunger and livelihood shocks, or a risk to deteriorate food insecurity no matter what the level of poverty of household. Risks are the combination of the probability or frequency of occurrence of a defined hazard and the magnitude of the consequences. The degree of vulnerability depends on the nature of the risk and the degree of household resilience, or ability to recover after a shock(s). Despite recent socio-economic growth, one fifth of the population still suffers from food insecurity in Cambodia. Malnutrition rates in the country are the highest among Asian countries. While the country produces a surplus of paddy rice, household level food insecurity remains at a critical level. The main causes of food insecurity at the household level are: high levels of income poverty, fragile food production due to frequent natural calamity such as flooding and drought, low productive agriculture with low levels of irrigation, lower agricultural technology and skills, poor storage and distribution systems, and poor transportation facilities including roads. According to the Integrated Food Security and Humanitarian Phase Classification (IPC) jointly conducted by the Food and Agriculture Organization (FAO) and World Food Programme (WFP) in 2007, most provinces in the country are chronically food insecure, except Battambang and Phnom Penh. The severity of food insecurity is due to drought and limited economic growth in rural areas compared with urban areas. In particular, drought severely affected food availability in many provinces, causing food prices to rise since Detailed information on ID Poor and the key documents are available on the MOP website ( as of July 2010) 17
 Lao PDR Thailand Otdar Mean Chey Banteay Mean Chey Preah Vihear Stueng Traeng Rotanak Kiri Siem Reab Bat Dambang Krong Pailin Kampong Thum Kracheh Mondol Kiri Pousat Kampong Chhnang Kampong")
36 Integrated Food Security and Humanitarian Phase Classification (Valid until ) in Cambodia (As of ) Lao PDR Thailand Otdar Mean Chey Banteay Mean Chey Preah Vihear Stueng Traeng Rotanak Kiri Siem Reab Bat Dambang Krong Pailin Kampong Thum Kracheh Mondol Kiri Pousat Kampong Chhnang Kampong Cham Gulf of Thailand Kaoh Kong Kampong Spueu Phnom Penh Kandal Prey Veaeng Vietnam Phase Classification General Food Secure Low Chronically Food Insecure High Chronically Food Insecure Early W arning Levels Alert Moderate Risk High Risk Kampot Krong Preah Sihanouk Takaev Svay Rieng Data Source - IPC Study as of 26 Feb Admin Boudaries Produced by Department of Geography - Map Produced by WFP CO February 2007 Boundaries and Riv ers Tonle Sap Lake International Boundary Provincial Boundary Pousat Province Name Krong Kaeb Disclaim The boundaries shown and designation used in this map do not imply official endorsement or acceptance by the United Nations. (Source) World Food Programme and Food and Agriculture Organization, Integrated Food Security and Humanitarian Phase Classification (IPC): Pilot in Cambodia (2007), p.9 Figure 2-4: Integrated Food Security and Humanitarian Phase Classification in Cambodia (2007) According to a report by the Cambodia Development Resource Institute (CDRI) 13, more than 200,000 household face food insecurity across the country. Food insecurity is particularly prevalent in rural areas. However, the pattern of food insecurity incidence by topographical zone is different from the pattern of poverty incidence except Phnom Penh and the Coastal Zone. In Phnom Penh which has the lowest poverty incidence, the percentage of households in food insecurity is only 1.3% which is the lowest rate in the country. The Coastal Zone, which poverty incidence is relatively low, has also lower incidence of food insecurity of 4.8%. The Plateau/Mountain Zone with high poverty incidence, however, has lower incidence of food insecurity than the Plain and Tonle Sap Zones. The proportion of household with poor food consumption in the Plateau/Mountain Zone is 22%. The Tonle Sap Zone has a food insecurity incidence of 35.5% which is lower than the Plain Zone while the poverty incidence in the Tonle Sap is higher than the Plain Zone. The Plains Zone has the highest incidence of food insecurity at 36.5% though the poverty incidence is relatively lower than the Tonle Sap and Plateau Zones. The Government of Cambodia has initiated and promoted poverty reduction policies, among which the Rectangular Strategy has been the core instrument focusing on good governance since its launch in The Rectangular Strategy is comprised of four growth rectangles: enhancement of agricultural sector; private sector growth and employment; continued rehabilitation and construction of physical infrastructure; and capacity building and human resource development, in which the Government makes efforts for ensuring nutritious improvement and food security and thus reduce the vulnerability of poor households. 13 CDRI, Impact of High Food Prices in Cambodia (2008). The report was sponsored and supported by the WFP, NGO Forum on Cambodia, Oxfam America, WB, UNDP and FAO. 18
 Definitions of Food Security are as follows: - Poor Food Consumption: Standard range of 0-21 (New range 0-31) - Borderline Food Consumption: Standard range of 21.5-35 (New range 31.")
37 (Source) Cambodia s Leading Independent Development Policy Research Institute, Impact of High Food Prices in Cambodia (2008), p.41 (Note) Definitions of Food Security are as follows: - Poor Food Consumption: Standard range of 0-21 (New range 0-31) - Borderline Food Consumption: Standard range of (New range ) - Acceptable Food Consumption: Standard range of more than 35 (New range more than 45) Figure 2-5: Map of Food Insecurity in Cambodia (2008) 2.3 Human Development Index and Human Poverty Index The Human Development Index (HDI) and Human Poverty Index (HPI) measure levels of human development composed of multiple factors, including life expectancy, adult literacy, enrollment rate, and income per capita. People are better off when HDI is larger, and they are in severer poverty due to economic / non-economic factors when HPI is larger. In addition to the above two indices, the third index has been calculated at provincial level by United Nations Development Programme (UNDP) since 2007: housing-sensitive HDI. This additional HDI incorporates a housing variable into the existing HDI for two reasons: 1. Communities residing on riverfronts and near flood-prone areas often lose their houses, and a situation of housing uncertainty implies greater resources required or living with uncertain housing tenure; 2. Displaced persons who have migrated within Cambodia often have no permanent abode and become homeless. The modified housing-sensitive HDI takes such fragile housing situations into account which the vulnerable people in Cambodia confront. HDI and HPI of Cambodia are and 39.3, respectively. By region, Phnom Penh had the highest HDI (0.83) and the housing-sensitive HDI (0.87). HDI of the provinces in the Plains Zone and the Tonle Sap Zone were around 0.5, and that of the provinces in the Coastal Zone had slightly higher HDI at around On the other hand, the province in the Plateau/Mountain Zone had relatively lower HDI at the range of 0.31 to The lowest HDI 19
38 was 0.3 for Ratanak Kiri. The housing HDI shows the same pattern of regional difference though the level of housing HDIs in the country were generally higher than the level of HDIs. As per HPI, Phnom Penh has the lowest HPI of HPIs of the provinces in the Plains Zone were less than 40, which was relatively lower than the other zones. In particular, Pery Veng and Svav Rieng had the lower HPI at 23.2 and 25.6 respectively. Most of provinces in the Tonle Sap Zone had HPI at around 40, which were almost same level or slightly higher than the national level. HPIs for most provinces in the Coastal and Plateau/Mountain Zones were around 40 except Preah Sihanouk and Koh Kong which had lower HPI at 33.2 and 34.0 respectively. The highest HPI was 44.8 for Kampong Thom in the Tonle Sap Zone. Table 2-3: Human Development Index and Human Poverty Index in Cambodia (2004) Code Province HDI HDI (Housing) HPI Phnom Penh 12 Phnom Penh Plains 03 Kampong Cham Kandal Prey Veng Svay Rieng Takeo Tonle Sap 01 Banteay Meanchey Battambang Kampong Thom Siem Reap Kampong Chhnang Pursat Coastal 07 Kampot Preah Sihanouk Kep Koh Kong Pleatau/Mountain 05 Kampong Speu Kratie Mondul Kiri Preah Vihear Ratanak Kiri Stung Treng Otdar Meanchey Pailin Cambodia (Source) Ministry of Planning and United Nations Development Programme. Cambodia Human Development Report 2007 (2007), and United Nations Development Programme, Human Development Report 2006, (2006). 20
39 2.4 Hazard Analysis: Landmines and Unexploded Ordnances (UXO) Geographically, Cambodia has borders with Thailand, Vietnam and Lao PDR. Its history is very closely attached to the history of the region, which is associated with many years of political unrest, tension, colonial and civil wars as well as occasional border conflicts. As a consequence of these geopolitical tensions, Cambodia was engaged in many decades of wars, resulting in the loss of millions of lives and severe and extensive damage to the country. In addition, these wars left a negative legacy of unexploded ordnances and landmines which are scattered across the country. Due to heaviest mine laying campaigns by the warring parties between 1979 and , Cambodia is one of the most heavily contaminated countries in the world. As a result, even after the end of the civil war, landmines and Explosive Remnants of War (ERW) cause severe accidents and a large number of casualties. At the peak in 1996, the number of casualties reached more than 4,000 people. According to the National Level 1 Survey (L1S 2002), which assessed the impact of landmines and ERW, 4,544km 2, or 2.5% of the total land area, is contaminated by landmines, unexploded ordnances (UXO), and cluster munitions. The number of villages contaminated was 6,422 with more than 5 million people at risk (45.3% of the total population). Owing to the demining efforts of the Cambodian Mine Action Centre (CMAC) 16, the number of casualties by landmines and ERW had been decreasing over the last decade. However, landmines and ERW still pose a high risk in many parts of the country, particularly along the Thai border. According to the annual report for 2008 of CMAC, there were 269 accidents and 153 casualties caused by both landmine and ERW in Both landmine and ERW casualties have been a serious problem in the North-Western region along the border with Thailand, including the Provinces of Banteay Meanchey, Battambang, Preah Vilhear, Otdar Meanchey and Pailin. Together landmines and ERW have caused not only human casualties but also protracted suffering due to lost lives and limbs. Furthermore, they have a widespread negative impact on the socio-economic, health, and environmental situations in the country. 14 The Civil War was cease-fired by the Paris Peace Accord in October The survey was jointly conducted by the Government of Cambodia and the Canadian International Development Agency (CIDA) 16 After the determination of the civil war, CMAC is established by Cambodia and the United Nations Transition Authority in Cambodia in 1992 in order to clear landmines and unexploded ordnances (UXO). 17 The number of casualties is different from the number shown in Figure 2-6. But there is no explanation in CMAC annual report 2008 about the different numbers of casualties. 21

40 5,000 4,000 No. of Casualties 3,000 2,000 1, ERW 1,573 2,069 2,340 2,603 3,025 1,125 1, Mine ,295 1, Year (Source) Cambodian Mine Action Center, Annual Report 2008 (2008), p.2, Chart 1 Figure 2-6: Casualties by Landmine and ERW in Cambodia (Source) Cambodian Mine Action Center, Annual Report 2008 (2008), p.6, Figure 2 Figure 2-7: Accident Locations in

41 According to L1S 2002, the following 21 districts have the most casualties. Table 2-4: List of 21 Districts with Most Casualties of Landmine and ERW Province Banteay Meanchey Battambang Preah Vihear Pursat Takeo Otdar Meanchey Palin Ou Chrov, Thma Puok, Svay Chek and Malai District Banan, Bavel, Moung Ruessei, Rotonak Mondol, Samlout, Sampov Lun, Phnom Proek, Kamrieng and Koas Krala Choam Khsant Veal Veaeng Samraong Anlong Veaeng, Banteay Ampil and Trapeang Prasat Krong Pailin and Sala Krau (Source) Kingdom of Cambodia and Cambodian Mine Action Centre, Five-Year Strategic Plan Figure 2-8: Map of 21 Districts with Most Casualties from Landmines and ERW 23
42
43 Chapter 3 Explanatory Factors of Poverty in Cambodia 3.1 Domestic Factors National Development and Public Expenditure Since the mid-1990 s, the Government of Cambodia has made continuous efforts to address poverty. The Socio-Economic Development Plans (SEDP I and SEDP II ) were five year national development plans with long-term national goals of poverty reduction. During the implementation of SEDP II, the National Poverty Reduction Strategy (NPRS ) was set forth by the Government to reduce poverty through equitable economic growth. Following SEDP II, the National Strategic Development Plan (NSDP) was formulated for the period of 2006 to 2010 and implemented to achieve the Cambodia Millennium Development Goals (CMDGs) and future equitable development which is pro-poor and pro-rural, and now the NSDP is under implementation. To do this, budgetary allocations and disbursements to the social sectors continuously increased. The Government expenditure on the social sectors expanded from billion Riels ( million US dollars) in 2003 to 1,033.8 billion Riels ( million US dollars) in 2007, accounting for 30-35% of total government expenditure. The expanded public expenditure on the social sectors has led to improved service delivery of health and education. The Government expenditure by sector is shown in the following figure, and their details are in the Appendix 2. Government Expenditure (Riel billion) 3, , , , , , IV. Economy Administrative III. Social Administrative II. Defense and Security I. General Administration IV. Economy Administrative III. Social Administrative ,033.8 II. Defense and Security I. General Administration ,056.9 Fiscal Year (Source) Ministry of Planning National Institute of Statistics, Statistical Yearbook 2008, Table 19.8 (Note) Reference exchange rate (period average) is 1USD = 4,056.2 Riels as of 2007 (IMF, International Financial Statistics Yearbook 2009 Figure 3-1: Government Expenditure by Sector ( ) Public spending on economic sectors, including agriculture, rural development and land management, also increased from billion Riels (42.03 million US dollars) to billion Riels (65.85 million US dollars) for the same period. Compared to the social sectors, the share of economic sectors has been limited around 10% despite the critical role of agriculture and 25
44 rural development in poverty reduction. As mentioned in Chapter 2, the Government promoted decentralization and deconcentration (D&D) in order to implement well-targeted participatory development for poverty reduction. However, local administration bodies at the district and commune levels still have limited capacity in terms of finance and human resources management. There are therefore gaps in access to basic services including water and electricity among the provinces, as well as at the district and commune level. Code Table 3-1: Distribution of Households by Availability of Amenities (2008) Province Total Household Improved Water Source * (%) with Toilet Facility ** (%) Electricity *** (%) Improved Cooking Energy **** (%) Phnom Penh Zone 12 Phnom Penh 250, % 90.3% 94.8% 58.0% Plain Zone 03 Kampong Cham 368, % 24.9% 17.9% 2.4% 08 Kandal 255, % 45.1% 37.1% 6.5% 14 Prey Veng 226, % 15.6% 7.6% 1.4% 20 Svay Rieng 114, % 20.4% 12.1% 3.2% 21 Takeo 183, % 22.9% 11.8% 2.2% Tonle Sap Zone 01 Banteay Meanchey 144, % 34.6% 30.5% 5.0% 02 Battambang 209, % 42.8% 25.1% 3.3% 06 Kampong Thom 133, % 26.5% 12.0% 1.2% 17 Siem Reap 179, % 26.5% 23.4% 7.7% 04 Kampong Chhnang 100, % 17.8% 12.1% 1.3% 15 Pursat 83, % 16.6% 16.4% 1.4% Coastal Zone 07 Kampot 129, % 25.6% 12.9% 1.9% 18 Preah Sihanouk 44, % 48.6% 58.3% 12.3% 23 Kep 7, % 24.0% 19.5% 2.7% 09 Koh Kong 24, % 34.5% 48.3% 13.0% Plateau/Mountain Zone 05 Kampong Speu 149, % 17.2% 11.1% 1.8% 10 Kratie 65, % 24.0% 14.3% 1.4% 11 Mondul Kiri 12, % 16.2% 25.5% 5.4% 13 Preah Vihear 33, % 10.1% 12.0% 0.8% 16 Ratanak Kiri 27, % 18.0% 21.7% 3.4% 19 Stung Treng 20, % 31.6% 22.1% 1.7% 22 Otdar Meanchey 38, % 20.4% 17.6% 2.1% 24 Pailin 14, % 37.8% 42.7% 10.8% (Source) National Institute of Statistics, Ministry of Planning, Population Census of Cambodia 2008 (2009) (Note) * Improved Water Source : Piped Water, Tube Pipe Well, Protected Dug Well and Rain ** With Toilet Facility: Connected to Sewerage, Septic Tank, Pit Latrine *** Electricity: City Power, Generator, City Power and Generator. **** Improved Cooking Energy: LPG, Electricity 26
 Figure 3-2: Household Amenities")

45 (Source) Ministry of Planning National Institute of Statistics, General Population Census of Cambodia 2008 (2009) Figure 3-2: Household Amenities by Commune Industrial Structure and Employment Opportunities Between 1994 and 2004, Cambodia experienced high rates of economic growth. The driving 27
46 force of this growth was the industrial sector, in particular the garment sub-sector. The contribution of the garment sector to GDP growth increased considerably from 2.0% to 45.6%. The service sector also expanded its contribution to GDP growth from 2.6% to 40.7% although its share of GDP remained almost constant. On the other hand, the contribution of the agricultural sector to GDP fell from 49.3% to -8.7% because of the decreases in its GDP share and growth. Table 3-2: Source of Growth by Main Economic Activity, Contribution to GDP Share of GDP (%) Annual Change (%) Sector Growth (%)* Agriculture Industry Manufacturing Garments Agri-business Services Hotels & Restaurants GDP (Source) World Bank, Cambodia Halving Poverty by 2015? Poverty Assessment 2006 (2006), p.57, Table 4.1 (Note) The contribution to GDP growth is calculated as the annual percentage change time the share of GDP in the previous period. GDP growth is set equal to 100 each year. In terms of employment, the agricultural sector is still absorbs more than 70% of the labor force in the country. In rural areas, approximately 85% of workforce is engaged in subsistence farming. Since the agricultural sector as a whole now contribute less to the economy, the rural poor who have no alternative livelihood other than agriculture, face difficulty in moving out the poverty. On the other hand, the urban labor force has more employment opportunities in the industrial or service sectors. More than 80% of the urban labor force is engaged in these sectors, resulting in a lower poverty incidence in urban areas than rural areas. This suggests that employment opportunities are is closely linked with the level of poverty. For example, among the provinces Phnom Penh has the highest share of the workforce in industry and the service sectors, and the lowest poverty incidence. Provinces in the Tonle Sap and Plateau/Mountain Zones which have the highest incidences of poverty have around 80% of their workforces engaged in the agricultural sector. Further, employment opportunities in industry and the service sectors are not evenly distributed, causing inequality among the households. The Government has therefore been trying to facilitate the transition of the population out of agriculture and into higher value-added manufacturing and service sector activities over the long-term. According to the Census 2008, the urbanization promoted compared with the last Census 1998: from 19.1% in 1998 to 23.28% in It is because of not only the natural growth of urban population but also migration from rural to urban areas. As a result, the legally declared urban areas 18 in the country expanded. Such internal migration may affect the labor market in the urban areas and urban poverty. 18 The urban areas of Cambodia are defined by the demographic characteristics of a commune. 28
47 Code Province Table 3-3: Share of Employment by Sector (2008) Poverty Incidence (2004) Primary Secondary Tertiary - Cambodia Urban 24.73* Rural Phnom Penh Zone 12 Phnom Penh Plain Zone 03 Kampong Cham Kandal Prey Veng Svay Rieng Takeo Tonle Sap Zone 01 Banteay Meanchey Battambang Kampong Thom Siem Reap Kampong Chhnang Pursat Coastal Zone 07 Kampot Preah Sihanouk Kep Koh Kong Plateau/Mountain Zone (%) Kampong Speu Kratie Mondul Kiri Preah Vihear Ratanak Kiri Stung Treng Otdar Meanchey Pailin (Source) Ministry of Planning National Institute of Statistics, General Population Census of Cambodia 2008, (2010) (Note 1) Primary sector: agriculture, forestry and fishing. Secondary sector: mining and quarrying, manufacturing, electricity, gas, steam and air conditioner supply, water supply, sewerage, waste management and remediation activities, and construction. Tertiary sector: wholesale and retail trade, repair of motor vehicles, transportation and storage, accommodation and food service activities, information and communication, financial and insurance activities, real estate activities, professional, scientific and technical activities, administrative and support service activities, administrative and support service activities, public administration and defense, compulsory social security, education, human health and social work activities, arts, entertainment and recreation, other service activities/ (Note 2) * The poverty incidence of Urban does include only other urban except Phnom Phen. 29
48 3.1.3 Land Distribution and Use Cambodia is still primarily an agrarian economy: 71% of the labor force is engaged in agriculture. In addition, more than 90% of the poor inhabit in rural areas. However, 40% of rural households lived off less than 0.5ha which only meet about half of per capita milled rice requirement of 165kg/year. Population pressure and hereditary practices induce further fragmentation of land. At the same time, distress land sales have been resulting a polarization in the pattern of land ownership between urban landowners making further speculative investments and rural household with smaller plots. It implies that the rural household cannot have enough size of farm land even for their subsistence rather for cash income. The Government has taken policy initiatives to improve equity and efficiency of agricultural land. One is social land concessions (SLC) which redistributed to unused land originally allocated as large commercial concessions to poor landless households. Another is systematic land titling to improve tenure security, reducing vulnerability. Despite these measures, landlessness increased from 12.6% in CSES 1997 to 19.6% in CSES It may be because that some rural households prefer to sell too small land plot which is no more subsistent in order to obtain cash income for investment in non-agriculture activities. Or the others may have no option other than selling their lands in order to cope with shock such as illness or other emergency. As a survey by Oxfam GB shows (Figure 3-3), land-holding size less than 0.5 ha was shared by 38% of land owners, while 72% of land was owned by only 12% of land owners. This shows the severity of inequality in land distribution in the country % of owners % of land < <3 Size of Land Holding (ha) (Source) World Bank, Sharing Growth: Equity and Development in Cambodia (Equity Report 2007) (2007), p.55 % Figure 3-3: Land Distribution in Cambodia (2007) Rural households have less non-farm employment opportunities due to limited human capital and skills. As a result, land is the most critical asset for the rural poor. On the other hand, as mentioned in Chapter 1, land distribution is not necessarily the best solution for all landless poor households because non-farm employment or livelihood opportunities may contribute more to move out of poverty than subsistence farming on limited land. 30
49 3.1.4 Ethnicity Ethnically, Cambodia is relatively homogenous compared to neighboring countries such as Laos. The majority Khmer ethnic group accounts for more than 95% of the total population. The remaining 4% is a mix of groups with different economic and social characteristics in terms of their relationship to the Khmer majority and mainstream development. Due to their small number, the CSES sampled only a few non-khmer households in their survey, and therefore it may not be a statistically robust source of poverty rates drawn from CSES data. There are, however, other sources which show that other ethnic groups are also affected by poverty. The poorest ethnic groups in the country are the highlanders or highland tribal groups (Khmer Loeu, Chunchiet). They mainly live in forested upland areas, concentrated in the north-eastern provinces of Ratanak Kiri, Mondul Kiri, Kratie and Stung Treng which border the mountainous areas of Vietnam. They are composed of very small groups of between a few hundred and 19,000 members. Collectively, they number around 104,000 persons which account for less than 0.1% of the national population. These highlanders are marginalized and impoverished because of extreme remoteness and low population density. They are also very vulnerable because their livelihoods, based mainly on shifting cultivation, depend heavily on forests. In addition, language barriers hinder their access to social services, including education and health services. 3.2 Geopolitical Factors Landmine and Explosive Remnants of War (ERW) As mentioned in Chapter 2, landmines and ERW cause not only human casualties but also have negative socio-economic impacts closely related to poverty. According to L1S 2002, landmine and ERW seriously affect the livelihoods of the people inhabiting landmine/erw contaminated areas. The following table shows the results of local interviews on villagers views on the impact brought by landmines/erw. One of the most critical problems for the people is limited access to agricultural land and production due to the presence of landmine/erws. At the same time, people are in grave danger because limitations to farming land lead them to forage for food in the contaminated areas. Furthermore, the lack of alternative income sources has driven many people, including children, to scavenge for landmines and ERWs to sell as scrap metal. Table 3-4: Socio-economic Impact of Landmines/ERW on Village (2002) Socio-economic Impact Total Very Severe Severe Less Severe Not enough housing land 1,006 (61.3%) 362 (22.0%) 399 (24.3%) 245 (14.9%) Not enough agriculture land 1,046 (85.7%) 767 (46.7%) 444 (27.0%) 194 (11.8%) High rate of human casualties 1,283 (78.2%) 243 (14.8%) 258 (15.7%) 782 (47.6%) Loss of livestock 929 (56.6%) 55 (3.3%) 172 (14.8%) 701 (42.7%) Water access difficulties 790 (48.1%) 47 (2.8%) 112 (6.8%) 631 (38.4%) Gathering activities 1,201 (73.2%) 96 (5.8%) 215 (13.3%) 890 (54.2%) (Source) Kingdom of Cambodia and Cambodian Mine Action Centre, Five-Year Strategic Plan , p.4, Table 2. 31
 in 2000. Mine action is a part of the NSDP and CMDGs.")
50 Demining and clearance of UXO is therefore a key issue for eliminating the risk of casualty as well as poverty in contaminated areas. The Government of Cambodia is committed to addressing the issue and established the Cambodian Mine Action Authority (CMAA) in Mine action is a part of the NSDP and CMDGs. Demining operators, including CMAC, conduct technical surveys, clearances, and risk education for the people. The total area cleared between 1992 and 2008 totaled km 2. More than 800,000 anti-personnel mines (APMs) and more than 19,000 anti-tank mines (ATMs) were cleared over this period. Also 1.7 million UXO have been demolished since Table 3-5: Achievements in Demining Activities in Cambodia ( ) Outputs CMAC RCAF MAG HALO Total Area in km No. of APM 404, ,636 47, , ,198 No. of ATM 7,657 8, ,530 19,109 No. of UXO 1,370, , , ,318 1,740,831 (Source) Kingdom of Cambodia and Cambodian Mine Action Centre, Five-Year Strategic Plan , p.17 Table 4. (Note) RCAF: Royal Cambodia Armer Force, MAG: Mine Advisory Group, HALO: HALO Trust (Source) Cambodian Mine Action Center, Annual Report 2008 (2008), p.1, Figure 1 Figure 3-4: Landmine/ERW Contamination Map of Cambodia (2008) 32
51 Demining and UXO clearance activities are benefiting poor people both by increasing their access to land for resettlement and production, and by preventing them from becoming victims of landmines and UXO. According to a recent CMAC report 19, they cleared approximately 4,500 minefields and transferred this land to beneficiaries through local authorities. More than 117,900 families and 138,800 students have received safe land for their livelihood activities and schools as a direct result of demining activities. In addition, it is estimated that over half a million families indirectly benefit from demining activities. Since 90% of areas suspected of contamination still remain in the country, demining and clearance of UXO are still critical issues in poverty reduction in Cambodia Natural Disasters The poor in Cambodia are vulnerable to natural shocks as a large share of the population depends on rain-fed agriculture and inhabit the borders of waterways prone to seasonal flooding. The 2000 floods, described as the worst floods recorded in Cambodia, caused damage to agricultural production, including rice production, as well as to rural infrastructure and housing. The affected land accounts for around 444,000 ha of agricultural land, in over half of all provinces. In addition, other natural disasters, including drought, crop failure, and fire also have impacts on the livelihoods of the rural poor. Since the poor population has limited capabilities to mitigate and cope with damage from natural disasters, they are more vulnerable to falling deeper into poverty. 3.3 Factors related to Globalization Labor Migration, Trafficking and Remittance International migration from Cambodia has been limited compared to internal migration. In addition, according to the Census 2008, the number of people emigrating decreased from around 210,000 migrants in 1998 to 94,800 migrants to The main trigger for rural people to migrate is to search better livelihoods since they have limited access to land and income opportunities in their villages. Table 3-6: Migrants by Previous Residence (1998 and 2008) Previous Residence Migrants Number of Migrants 3,597,769 3,552,173 Within the province of enumeration 58.84% 51.34% In another province 35.31% 45.99% Outside Cambodia 5.85% 2.67% Total % % (Source) Ministry of Planning National Institute of Statistics, General Population Census 2008, Table Cambodia Mine Action Centre, Ten Years: Achievement and Perspective: , p.7 33
52 The most important destination for Cambodian migrants is Thailand, although that the majority of this labor migration is undocumented. According to a report by the International Organisation for Migration (IOM) 20, 90% of Cambodian migrants to Thailand are irregular. As of October 2005, the number of officially registered migrants from Cambodia to Thailand was 182,007, which accounted for 13% of total registered migrants to Thailand. While the number of undocumented Cambodian migrants is unknown, it is estimated that it may be as high as that of documented migrants. Since Cambodia shares a long and porous border with Thailand, there have always been local trans-border networks between the Cambodian Northern Provinces and Thai neighboring provinces. Both for registered and undocumented Cambodian migrants in Thailand, the major employment sectors are fisheries, construction and agriculture. Two other important destination countries are Malaysia, in particular for the Muslim Cambodian minority Cham, and the Republic of Korea. Migrants to Malaysia are mostly females employed as domestic workers, while migration to Korea is organized through a trainee system which provides Cambodian migrants new skills which can be used in Cambodia after their return to the country. Undocumented migrant workers include trafficked people. According to a report issued by United Nations High Commissioner for Refugees (UNHCR) 21, Cambodia is a source, transit and destination country for human trafficking for the purpose of commercial sexual exploitation and forced labor, although the Government of Cambodia enacted a law which included anti-trafficking provisions in February On the other hand, international labor migration brings in overseas remittances. The World Bank s Migration and Remittance Factbook 2007 shows that there were approximately 298 million USD of inward remittances to Cambodia per year, which accounted for 4.1% of GDP. Since the formal statistics reflect only registered remittances, it is estimated that the volume of unregistered remittances is as much as 50% of total remittances. Remittances are primarily used for living expenses, including food and heath costs, with a negligible quantity used for productive investments. Remittances by migrant workers can be viewed as having a positive effect on the local economy Trade Liberalization Since 1993, the economy has grown due to market-oriented policies such as liberalization, which attracted private investment, in particular foreign direct investments (FDIs). However, such investments focused primarily on the sub-sectors of garments, tourism and construction. The impact of trade liberalization on employment has been also very concentrated and limited. According to a UNDP report (2004) 22, export sectors, including tourism, employed only about 6-7% of the work force and would be required to maintain a high rate of growth to make a significant impact on rural underemployment. Furthermore, despite having one of the highest growth rates in the economy, the garment industry accounted for only 3% of total employment. Therefore, economic growth is limited to a very narrow number of areas where growth sectors 20 International Organization for Migration, Review of Labor Migration Dynamics in Cambodia, (2006) 21 United Nations High Commissioner for Refugees, Trafficking in Persons Report 2009-Cambodia 22 United Nations Development Programme, The Macro Economics of Poverty Reduction in Cambodia (2004) 34
53 are located. In other words, trade liberalization has had an impact on poverty reduction in some urban areas but a limited impact on poverty reduction in rural areas. On the other hand, export oriented industries have the potential to have a large impact on direct and indirect employment within the sector as well as in related services. However, those export-oriented sectors are vulnerable to external shocks Foreign Investment and the Economic Crisis in Asia The global financial crisis did not spare transition economies like Cambodia, Vietnam and Myanmar. The Cambodian economy, which is largely driven by export markets and foreign direct investment in the garment industry, tourism and the construction sectors, experienced a sharp decline in economic growth from 10.2% in 2007 to 7 percent in The World Bank (2008) observes that shocks have increased uncertainty over the economic outlook in the near future. Real GDP is projected to slide further to 4.9 % in The government has to address substantial challenges to the following growth drivers: (a) rice, (b) garments, (c) construction, and (d) tourism. A surge in food prices has contributed to inflationary pressure but the subsequent fall in fuel and food prices will slow down the rise in consumer price inflation. The impact of the crisis can be seen through the increasing number of factories closing down and lay-offs, as well as a noticeable decrease in income and overseas remittances. While a report on the garment industry by the Economic Institute of Cambodia (EIC) showed that 50 million US dollars of workers salaries in the industry supported rural economic activities in 2008, official figures released by the Ministry of Commerce indicate that growth in garment exports to the United States and the European Union (EU) decreased by 2 % in 2008 as compared to Some garment factories have closed down. Increasing unemployment with the concomitant loss of income is a source of concern as it could increase the number of non-performing loans and loan delinquencies and could also result in increased savings withdrawals. It could also dampen deposit mobilization. 35
54
55 Chapter 4 Social Protection Mechanisms 4.1 Formal Social Protection Systems Social Insurance Programs The Ministry of Social Affairs, Veteran and Youth Rehabilitation (MOSVY), the Ministry of Labor (MOL), and the Ministry of Health (MOH) are the main providers of formal social insurance schemes in Cambodia. Civil servants and veterans, company employees, and the self-employed (including farmers) are the target recipients for pension, health insurance, work injury insurance, invalidity insurance, maternity insurance and other forms of social insurance, while the delivery manner sand benefits of each scheme however vary from each other. (1) Civil Servants and Veterans Pension, invalidity insurance, maternity insurance, death insurance, work injury and dependency insurance are paid to civil servants 23, out of which pension and invalidity insurance are directly covered by the MOSVY as part of their recurrent budget and the rest paid through the ministries and government institutions to which they belong. At the end of 2009, 32,372 people received pensions, while the number of veterans reached 88,661. Civil servants have never been required to pay a monthly premium to receive their pension. Due to the low and slow disbursement, the Government approved the establishment of the National Social Security Fund for Civil Servants (NSSFC) in early 2008, which now has the direct mandate to receive the budget allocation from the Ministry of Economy and Finance for all of the above social protection items. 6% of their monthly basic wage is deducted, on top of which 18% is paid by their employer, i.e., the Government. NSSFC is located inside the MOSVY and still going through a transition period from the previous social security system. (2) Company Employees The Social Security Law was passed in which stipulates guiding principles with respect to mandatory social security provisions for old-age, invalidity, and survivors pensions and employment injury benefits in accordance with the Labor Law (amended in 1997). A sub-decree 25 concerning the establishment of the National Social Security Fund (NSSF) for company employees was passed in The NSSF, a legal entity with autonomy in administration and finance, started to receive the registration of both enterprises and employees at the beginning of 2008 and began collecting enterprise contributions at the end of the same year. As of May 2010, 435,000 employees at 1,390 enterprises were covered by the NSSF 26. Benefits are medical treatment benefit, transportation, temporary disability benefit, nursing care benefit, permanent disability benefit, funeral expand, survivors benefit and rehabilitation benefit. All enterprises/establishments hiring eight employees or more must register. The contribution for the work injury scheme is set at 0.8% 27 of the employee s monthly wage. The health care 23 The number of government employees was found approximately 155,000 in the General Population Census Law on Social Security Schemes for Persons Defined by the Provisions of the Labour Law (September 2002) 25 Sub-Decree No.16 GRD (2007) 26 Nation-wide Establishment Listing of Cambodia 2009 identified 375,095 establishments existed as of 9 February Prakas No. 108 KB/ KRB dated June 16, 2008 on the Determination of the contribution rate and procedure of contribution payment for occupation risk. Under Prakas No.133 KB/KRB dated on 29 June 2009 on the Occupational Risk Contribution by the Garment and Shoe Enterprises and Establishments for the Year , the contribution rate of occupational risk of 0.8 percent was reduced to 0.5 percent for the Garment and Shoes enterprises/establishments for two years (2009 and 2010). The other 0.3 percent is paid by the Government of Cambodia. 37
56 scheme will be start in 2011, and the pension scheme in (3) Self-Employed including Farmers Presently the MOH is implementing social health protection programs for people in the informal sector, such as farmers who often have low and medium levels of income. However, no comprehensive health insurance has been introduced in Cambodia, and the Government is trying to secure the budget for a comprehensive model based on a more sustainable and lower cost system through community involvement Health Insurance Programs One area which is not covered by the formal sector is health and medical insurance in Cambodia. As there is no comprehensive health insurance system, patients have to pay for medical services, which is a big burden especially for poor people. Moreover, extremely poor people live in very remote areas and often cannot afford to pay for transportation to the hospital. Existing health insurance schemes are: (1) Health Equity Funds The Health Equity Funds (HEF) are a new mechanism started in the Health Sector Support Project to reimburse health facilities for treating patients who are classified as too poor to pay. It was initiated by the MOH around 2000, supported by the United States Agency for International Development (USAID), Belgian Development Agency (BTC), WB, Asian Development Bank (ADB), UK Department for International Development (DFID) and Australian Government Overseas Aid Program (AusAID), to bear the medical cost at the hospital, transportation costs, and costs of meals for accompanying people. The HEF has improved access to health services for 31% of poor people under the poverty line who are too poor to pay for services 28. However, HEFs have only reached half of the poor in 50 districts where pilot projects are implemented and there remains no clear road map for scaling up the programs, although universal coverage and access is planned for the future. (2) Community-Based Health Insurance The Community-Based Health Insurance (CBHI) are also operated by local NGOs, international NGOs and MFIs covering approximately 80,000 members in 2008 and 123,000 members in However, coverage is less than 1% of the target population, who are the poor who can afford to pay minimal premium contributions in exchange for a pre-defined health care benefit package. Cambodians must pay high costs to access and use essential health care services. The annual health care expenditure is about 40 US dollars per capita, of which around two thirds is out of pocket spending of individuals Policy Papers The remaining government social protection interventions are implemented by relevant ministries in each sector. For example, the MoEYS offers a Scholarship program, the MoH has a nutrition program, and the MEF administers an emergency food distribution program. They have issued master plans, strategies, and action plans to address these social protection 28 Dr. SOK Kanha, Vice Director of Planning Department, Ministry of Health (Interviewed on 19 June, 2010). 29 Council for Agricultural and Rural Development (2010). National Social Protection Strategy for the Poor and Vulnerable.,P.26, 38
57 issues. Among them, the National Social Protection Strategy for the Poor and Vulnerable is the newest and primary strategy which oversees various arrangements for social protection provision planned and coordinated by the Council for Agricultural and Rural Development (CARD). The CARD was established at the end of 1998, and has implemented the Government s prioritized sector for improving living standard of the rural poor 30. The CARD is mandated by the Government to plan, disseminate and implement the above social protection strategy, and a road map to 2015 has been adopted which promotes investment in social protection both as a contribution to long-term poverty reduction goals and as a short-term emergency / shock response mechanism to address crises. 4.2 Quasi-formal Social Security System Transition countries like Cambodia have underdeveloped formal rural financial markets with the majority of their population still lacking access to formal financial services and dependent on informal credit markets such as moneylenders. The informal credit market, such as money lender, still plays an important role in these areas Regulation and Commercialization of Microfinance Institution The National Bank of Cambodia (NBC) is playing a leading role in the integration of microfinance into the financial mainstream by regulating MFIs and supporting the development of new products. One of its priorities is to support the link between MFIs and commercial banks to get funding for expansion activities. Legal documents such as the Law on Banking and Financial Institutions (1999) spell out the functions, duties and powers of financial institutions as well as the regulatory framework for MFIs. In its Financial Sector Development Strategy , the Government states that it is necessary to have a comprehensive review of banking laws and regulations to further improve the depositor protection system for microfinance and rural finance across the country. Under the above law, MFIs are required to either register with the NBC or obtain a license 31. As of the end of 2008, there were 18 licensed MFIs 32 and 26 registered MFIs (or rural credit operators ) 33. The NBC also allows MFIs, when they meet certain conditions to be licensed as Microfinance Deposit-taking Institutions (MDIs), to mobilize deposits from the public There is a Secretary General (1 person), Deputy Secretary Generals (13 persons), and 7 departments underneath. (Planning and International Cooperation, Food security and Nutrition Statistics, Agriculture, Rural Development and Water Resources etc). 31 See the Appendix 2 for further details. 32 AMRET Microfinance Institution (former EMT), Angkor Mikroheranhvatho (Kampuchea) Co. Ltd (AMK), Cambodian Business Integrated in Rural Development Agency (CBIRD), CHC-Limited (former Credit Program of the Cambodian Health Committee), Cambodia Rural Economic Development Initiatives for Transformation (CREDIT), Entean Akpevath Pracheachun (EAP), Farmer Union Development Fund (FUDF), Farmer Finance Ltd. (FF), Green Central Microfinance (GCMF), Hattha Kaksekar Limited (HKL), Intean Poalroath Rongroeurng (IPR), Maxima Mikroheranhvatho Co.Ltd (MAXIMA), PRASAC MFI Ltd (PRASAC), SATHAPANA Limited (SATHAPANA), SEILANITHIH Limited (SEILANITHIH), Tong Fang Micro Finance Ltd. (TFMF), Thaneakea Phum Cambodia (TPC), VisionFund Cambodia (VisionFund). As of the end of 2009, another two were added: Chamroeun and SAMIC Microfinance (SAMIC). 33 See the Appendix 2 for further details. 34 Since December The minimum capital requirement for MFI is 250 million Riels (62,500 USD), while that of MDIs is 10 billion Riels (2.5 million USD). As of March 2009, two MFIs compliant with the requirements have been granted a license to collect deposits from the public. 39

58 4.2.2 Microfinance by Sector With regard to how the loans distributed by the 18 MFIs are used, agriculture takes the biggest share of microfinance loans at 43.8 % in 2008, followed by trade and commerce at 33.3%. percent 100% 90% 80% 70% others 60% household 50% construction 40% transportation 30% service 20% trade and commerce 10% agriculture 0% Year (Source) Developed based on Banking Supervision Department, National Bank of Cambodia, Annual Report 2008 Figure 4-1: Transition of Microfinance Usage Purpose The microfinance market volume in 2008 is 1,130.5 billion Riels, which is 8 times bigger than that of 2004 (126.2 billion Riels). Among them, the amount of loan outstanding for agriculture purpose has grown 5 times bigger in 2008 (495.3 billion Riels) since 2004 (81.8 billion Riels). The growth of loans for construction, transportation and household has largely exceeded the growth of total loans outstanding 35, which implies that microfinance now meets wider variety of clients needs in more flexible manner, in its bigger market, not only for basic income generation but for housing construction, transportation, emergency needs at home. Box 1: A Fisherman s Story Having the financing to start some small businesses has helped Vanna and his wife, Sroeng, to build a better life for themselves and their four children. Five years ago, this Kandal Province family lived in a tiny house, too small for all of them, and could not afford to feed their children on some days. In 2004, the couple borrowed $75 to buy fishing gear. By 2008, their micro loan increased to $500, and with savings, they were able to buy a boat and more nets, and to start raising pigs and chickens for sale. Before taking out their first loan, Sroeng earned just $.50 to $.75 a day. Now, thanks to the loans, I earn $5 to $7.50 a day, says Sroeng. We have a much better house, a bicycle, a motorbike, and our children go to school like other kids. We no longer feel ashamed for being poor. (Source) (Accessed in June 2010) 35 See the Appendix 2 for further details. 40
The CDB-based Poverty and Select CMDGs Maps and Charts
 An unofficial research report of the Ministry of Planning with support from the United Nations Development Programme, Cambodia. The publication contains findings of the Commune Database analysis and is
Chapter 2 Non-Income Poverty Analysis
 Chapter 2 Non-Income Poverty Analysis 2.1 Designated Poor Areas and Socially Vulnerable Groups In the National Poverty Reduction Strategy 2003-2005 (NPRS), the Government of Cambodia targeted 7,500 households
Otdar Mean Chey Stueng Traeng. Kampong Thum. Kampong Chhnang Kampong Cham. Kandal. Sv ay Rieng. Takaev
 Kingdom of Cambodia A Poverty Profile of Cambodia 2004 Otdar Mean Chey Stueng Traeng Banteay Mean Chey Preah Vihear Siem Reab Rotanak Kiri Bat Dambang Krong Pailin Kampong Thum Kracheh Mondol Kiri Pousat
Cambodia: Atlas of Health Indicators
 Cambodia: Atlas of Health Indicators ORC Macro Calverton, Maryland USA September 2004 Prepared by Melissa Neuman, ORC Macro Produced in collaboration with the Ministry of Health, Cambodia The 2000 Cambodia
CHAPTER 4 ECONOMIC ACTIVITY OF CHILD AND YOUTH
 CHAPTER 4 ECONOMIC ACTIVITY OF CHILD AND YOUTH 4.1 DEFINITION OF CHILD AND YOUTH LABOUR Child labour is recognized as an issue to be eliminated in the world. Children s labour participation reduces their
HOUSEHOLD LEVEL WELFARE IMPACTS
 CHAPTER 4 HOUSEHOLD LEVEL WELFARE IMPACTS The household level analysis of Cambodia uses the national household dataset, the Cambodia Socio Economic Survey (CSES) 1 of 2004. The CSES 2004 survey covers
MICRO-LEVEL ESTIMATION OF THE PREVALENCE OF STUNTING AND UNDERWEIGHT AMONG CHILDREN IN CAMBODIA
 MICRO-LEVEL ESTIMATION OF THE PREVALENCE OF STUNTING AND UNDERWEIGHT AMONG CHILDREN IN CAMBODIA Ministry of Health, Royal Government of Cambodia United Nations World Food Programme MEASURE DHS+ / ORL Macro
Survey of Cambodian Public Opinion. International Republican Institute November 30 December 25, 2011
 Survey of Cambodian Public Opinion International Republican Institute November 30 December 25, 2011 1 Detailed Methodology Face-to-face interviews were conducted November 30 December 25, 2011, by the Center
Chapter 2 Spatial Distribution and Density of Population
 2.1 The Concept of Spatial Distribution Chapter 2 Spatial Distribution and Density of Population One of the major results of a population census is the insight it provides into the patterns of population
CAMBODIA MINE/ERW VICTIM INFORMATION SYSTEM
 អ ជ ញ ធរម នកមព ជ ញ C.M.A.A CAMBODIA MINE/ VICTIM INFORMATION SYSTEM MONTHLY REPORT FOR DECEMBER 7 Background The Cambodia / Victim Information System (CMVIS) established in 99 by the Cambodian Red Cross
Towards a Well-Coordinated National Statistical System in Support of Sustainable Development Goals (SDGs) National Institute of Statistics of Cambodia
 National Institute of Statistics of Cambodia") Towards a Well-Coordinated National Statistical System in Support of Sustainable Development Goals (SDGs) National Institute of Statistics of Cambodia Mission of NIS The mission of the National Institute
Towards a Well-Coordinated National Statistical System in Support of Sustainable Development Goals (SDGs) National Institute of Statistics of Cambodia Mission of NIS The mission of the National Institute
Achieving Cambodia s Millennium
 Kingdom of Cambodia Nation Religion King Royal Government of Cambodia Achieving Cambodia s Millennium Development Goals Update 2010 Prepared by Ministry of Planning foreword i Table of Contents foreword...i
General Population Census of Cambodia 2008
 KINGDOM OF CAMBODIA Nation- Religion- King General Population Census of Cambodia 2008 Provisional Population Totals National Institute of Statistics, Ministry of Planning Phnom Penh, Cambodia Funded by:
CHAPTER A-10 ROAD NETWORK DEVELOPMENT PLAN
 CHAPTER A-10 ROAD NETWORK DEVELOPMENT PLAN 10.1 Road Development Principle As identified in the existing road condition survey, road network system in Cambodia has sufficient coverage from the perspectives
International Republican Institute Survey of Cambodian Public Opinion. October 28 November 10, 2013
 International Republican Institute Survey of Cambodian Public Opinion October 28 November 10, 2013 Methodology Face-to-face interviews were conducted October 28 November 10, 2013 by the Center for Advanced
Visualizing. Rights CE SR. Cambodia. Center for Economic and Social Rights fact sheet no. 7
 Center for Economic and Social Rights fact sheet no. 7 in light of Cambodia s appearance before both the Universal Periodic Review of the UN Human Rights Council in 29 and the UN Committee on Economic,
Managing Risk and Vulnerability in Cambodia: An Assessment and Strategy for Social Protection
 Public Disclosure Authorized Public Disclosure Authorized Public Disclosure Authorized Public Disclosure Authorized Managing Risk and Vulnerability in Cambodia: An Assessment and Strategy for Social Protection
vi. rising InequalIty with high growth and falling Poverty
 43 vi. rising InequalIty with high growth and falling Poverty Inequality is on the rise in several countries in East Asia, most notably in China. The good news is that poverty declined rapidly at the same
KINGDOM OF CAMBODIA Nation Religion King
 KINGDOM OF CAMBODIA Nation Religion King PROTOCOL ON PROHIBITIONS OR RESTRICTIONS ON THE USE OF MINES, BOOBY-TRAPS AND OTHER DEVICES, AS AMENDED ON 3 MAY 1996, ANNEXED TO THE CONVENTION ON PROHIBITIONS
TRAFFIC SURVEY AND ANALYSIS
 CHAPTER A-6 TRAFFIC SURVEY AND ANALYSIS 6.1 Traffic Survey Series of traffic surveys were conducted in nationwide by using the local consultant in order to grasp the current road traffic condition in Cambodia.
CAMBODIA: FLOODS. The context. appeal no. 22/2000 situation report no. 1; Revised budget period covered: September 2000
 CAMBODIA: FLOODS 20 September 2000 appeal no. 22/2000 situation report no. ; Revised budget period covered: 3-9 September 2000 With increasing numbers of people affected by the floods in Cambodia, the
Impact of Migration on Older Age Parents
 Impact of Migration on Older Age Parents: Preliminary Findings from Two Communes of Battambang Province, Cambodia Presentation by Khuon Chandore at the Cambodia Development Research Forum (CDRF) Symposium,
ASSESSING VULNERABILITIES AND RESPONSES TO ENVIRONMENTAL CHANGES IN CAMBODIA THE MIGRATION, ENVIRONMENT AND CLIMATE CHANGE NEXUS
 ASSESSING VULNERABILITIES AND RESPONSES TO ENVIRONMENTAL CHANGES IN CAMBODIA THE MIGRATION, ENVIRONMENT AND CLIMATE CHANGE NEXUS IOM OIM PROJECT INFORMATION Cambodia is being reshaped by increasingly complex
Highlights and key priorities
 Cambodia Situation Report No. 02 (as of 08 October 2013) This report is produced by the, a network of United Nations (UN), non-government organizations (NGOs), and international organizations (IOs) engaged
Poverty profile and social protection strategy for the mountainous regions of Western Nepal
 October 2014 Karnali Employment Programme Technical Assistance Poverty profile and social protection strategy for the mountainous regions of Western Nepal Policy Note Introduction This policy note presents
 i 1 2 3 3 3 4 4 5 5 6 7 7 7 7 8 8 9 10 10 11 12 12 12 12 13 20 20 1 2 INTRODUCTION The results of the Inter-censual Population Survey 2013 (CIPS 2013) and Cambodia Demographic and Health Survey 2014
HOUSEHOLD POPULATION AND HOUSING CHARACTERISTICS
 HOUSEHOLD POPULATION AND HOUSING CHARACTERISTICS 2 This chapter provides a summary of the socioeconomic characteristics of households and respondents surveyed, including age, sex, place of residence, educational
THE STUDY ON IMPROVEMENT OF MARKETING SYSTEM AND POST-HARVEST QUALITY CONTROL OF RICE IN CAMBODIA FINAL REPORT (MAIN REPORT)
") JAPAN INTERNATIONAL COOPERATION AGENCY No. MINISTRY OF COMMERCE MINISTRY OF AGRICULTURE, FORESTRY AND FISHERIES ROYAL GOVERNMENT OF CAMBODIA THE STUDY ON IMPROVEMENT OF MARKETING SYSTEM AND POST-HARVEST
JAPAN INTERNATIONAL COOPERATION AGENCY No. MINISTRY OF COMMERCE MINISTRY OF AGRICULTURE, FORESTRY AND FISHERIES ROYAL GOVERNMENT OF CAMBODIA THE STUDY ON IMPROVEMENT OF MARKETING SYSTEM AND POST-HARVEST
Republic of Kosovo Study for Poverty Profile in European Region. Final Report
 Republic of Study for Poverty Profile in European Region Final Report October 2010 JAPAN INTERNATIONAL COOPERATION AGENCY OPMAC Corporation Poverty Indicator Basic data Region (*) Country Year Population,
Climate Change Vulnerability Mapping for the Greater Mekong Sub-region
 CMU J. Nat. Sci. (2017) Vol. 16(3) 165 Climate Change Vulnerability Mapping for the Greater Mekong Sub-region Kittiwet Kuntiyawichai 1*, Vichian Plermkamon 1, Ramasamy Jayakumar 2 and Quan Van Dau 1 1
9.1 Legal Framework
 CHAPTER 9 GENDER MAINSTREAMING INSTITUTIONAL AND POLICY CONTEXT 9.1 Legal Framework... 147 9.2 Institutional framework... 147 9.2.1 The Ministry of Women s and Veterans Affairs... 148 9.2.2 The Cambodian
SOCIAL SYSTEMS BASELINE ASSESSMENT
 Regional Workshop on SEA Baseline Assessment SOCIAL SYSTEMS BASELINE ASSESSMENT 27-28 January, 2010 in Phnom Penh, Cambodia SOCIAL SYSTEMS Key Issues 1. Poverty, Ethnic Groups & Livelihoods 2. Health &
EUROPEAN COMMISSION DIRECTORATE-GENERAL FOR HUMANITARIAN AID - ECHO. Humanitarian Aid Decision
 EUROPEAN COMMISSION DIRECTORATE-GENERAL FOR HUMANITARIAN AID - ECHO Humanitarian Aid Decision 23 02 01 Title: Humanitarian Aid in favour of the vulnerable population of Cambodia Location of operation:
Implementation Status & Results Cambodia KH-Health Sector Support Project (P070542)
") Public Disclosure Authorized Public Disclosure Authorized The World Bank Implementation Status & Results Cambodia KH-Health Sector Support Project (P070542) Operation Name: KH-Health Sector Support Project
Public Disclosure Authorized Public Disclosure Authorized The World Bank Implementation Status & Results Cambodia KH-Health Sector Support Project (P070542) Operation Name: KH-Health Sector Support Project
Kingdom of Cambodia Nation Religion King SENATE ELECTION
 Kingdom of Cambodia Nation Religion King LAW ON SENATE ELECTION Royal Kram We Majesty Preah Bat Samdech Preah Borom Neat Norodom Sihamony Samean Phoum Chati Sasna Rakhata Katiya Khemera Rath Reas Budthindreatharea
The Cambodian League for the Promotion and Defense of Human Rights. and Its Human Rights Education Program
 The Cambodian League for the Promotion and Defense of Human Rights and Its Human Rights Education Program VANN SOPHATH The Cambodian League for the Promotion and Defense of Human Rights (LICADHO) is a
Poverty in the Third World
 11. World Poverty Poverty in the Third World Human Poverty Index Poverty and Economic Growth Free Market and the Growth Foreign Aid Millennium Development Goals Poverty in the Third World Subsistence definitions
The Cambodia COUNTRY BRIEF
 The Cambodia COUNTRY BRIEF The Country Briefs were prepared by governments ahead of the SWA 2019 Sector Ministers Meeting. They are a snap-shot of the country s current state in terms of water, sanitation
Poverty Profile. Executive Summary. Kingdom of Thailand
 Poverty Profile Executive Summary Kingdom of Thailand February 2001 Japan Bank for International Cooperation Chapter 1 Poverty in Thailand 1-1 Poverty Line The definition of poverty and methods for calculating
ARMENIA COMPREHENSIVE FOOD SECURITY, VULNERABILITY ANALYSIS (CFSVA) UPDATE 2017
 UPDATE 2017") ARMENIA COMPREHENSIVE FOOD SECURITY, VULNERABILITY ANALYSIS (CFSVA) UPDATE 2017 SOCIO-ECONOMIC TRENDS The Armenia Comprehensive Food Security, Vulnerability Analysis (CFSVA) Update presents the current
ARMENIA COMPREHENSIVE FOOD SECURITY, VULNERABILITY ANALYSIS (CFSVA) UPDATE 2017 SOCIO-ECONOMIC TRENDS The Armenia Comprehensive Food Security, Vulnerability Analysis (CFSVA) Update presents the current
EUROPEAN COMMISSION DIRECTORATE-GENERAL FOR HUMANITARIAN AID - ECHO. Humanitarian Aid Decision
 EUROPEAN COMMISSION DIRECTORATE-GENERAL FOR HUMANITARIAN AID - ECHO Humanitarian Aid Decision 23 02 01 Title: Humanitarian aid in favour of the vulnerable population groups of Cambodia Location of operation:
Women s Economic Empowerment: a Crucial Step towards Sustainable Economic Development
 Briefing note National Assembly s Secretariat General Women s Economic Empowerment: a Crucial Step towards Sustainable Economic Development Researcher In charge : Ms. KEM Keothyda July 2016 Parliamentary
CAMBODIA SYSTEMATIC COUNTRY DIAGNOSTIC Public Engagement
 CAMBODIA SYSTEMATIC COUNTRY DIAGNOSTIC Public Engagement Nov Dec 2016 Contents Objectives of the Engagement Country Context Main research questions I. What are the challenges to sustaining economic growth?
5.3 Population Growth by Provinces Demographic Transition in Cambodia Population s interaction 33 Chapter 6 Summary and Conclusions 35
 March 3-6,2013 i ix x 5.3 Population Growth by Provinces 30 5.4 Demographic Transition in Cambodia 32 5.5 Population s interaction 33 Chapter 6 Summary and Conclusions 35 Glossary 38 Appendix 41 Appendix
SUMMARY POVERTY REDUCTION AND SOCIAL STRATEGY
 Greater Mekong Subregion Tourism Infrastructure for Inclusive Growth Project (RRP CAM46293) SUMMARY POVERTY REDUCTION AND SOCIAL STRATEGY Country: Cambodia Project Title: Greater Mekong Subregion Tourism
IPP278 v.1 rev. Cambodia - Second Health Sector Support Project (HSSP2) Indigenous Peoples Planning Framework (IPPF)
 Indigenous Peoples Planning Framework (IPPF)") Public Disclosure Authorized Public Disclosure Authorized Public Disclosure Authorized Public Disclosure Authorized IPP278 v.1 rev. Cambodia - Second Health Sector Support Project (HSSP2) Indigenous Peoples
Public Disclosure Authorized Public Disclosure Authorized Public Disclosure Authorized Public Disclosure Authorized IPP278 v.1 rev. Cambodia - Second Health Sector Support Project (HSSP2) Indigenous Peoples
Under-five chronic malnutrition rate is critical (43%) and acute malnutrition rate is high (9%) with some areas above the critical thresholds.
 and acute malnutrition rate is high (9%) with some areas above the critical thresholds.") May 2014 Fighting Hunger Worldwide Democratic Republic of Congo: is economic recovery benefiting the vulnerable? Special Focus DRC DRC Economic growth has been moderately high in DRC over the last decade,
May 2014 Fighting Hunger Worldwide Democratic Republic of Congo: is economic recovery benefiting the vulnerable? Special Focus DRC DRC Economic growth has been moderately high in DRC over the last decade,
Statistical Yearbook. for Asia and the Pacific
 Statistical Yearbook for Asia and the Pacific 2015 Statistical Yearbook for Asia and the Pacific 2015 Sustainable Development Goal 1 End poverty in all its forms everywhere 1.1 Poverty trends...1 1.2 Data
Kingdom of Cambodia Nation Religion King. Royal Government of Cambodia. National Social Protection Strategy for the Poor and Vulnerable
 Kingdom of Cambodia Nation Religion King Royal Government of Cambodia National Social Protection Strategy for the Poor and Vulnerable Executive Summary The National Social Protection Strategy (NSPS) complements
PRODUCED BY JANUARY 2013
 PRODUCED BY JANUARY 2013 Contents Forward... 1 I. PARTICIPATION AND DEMOCRATIC GOVERNANCE... 2 I.1 Purpose of Survey... 2 I.2 Survey Limitation/Lesson Learned... 2 I.3 Summary/Principle Findings... 4 II.
PERFORMANCE SCORE: AVERAGE
 CAMBODIA PROGRAMME PERFORMANCE 2017 2016 Problem understood 5 5 Target date for completion of cluster munition clearance 5 5 Targeted clearance 6 6 Efficient clearance 5 5 National funding of programme
 Kingdom of Cambodia Nation Religion King National Committee for Disaster Management REPORT ON FLOOD MITIGATION STRATEGY IN CAMBODIA 2004 I. BACKGROUND Cambodia is one of the fourteen countries in Asia
Inclusion and Gender Equality in China
 Inclusion and Gender Equality in China 12 June 2017 Disclaimer: The views expressed in this publication are those of the authors and do not necessarily reflect the views and policies of the Asian Development
Yemen UNDAF PRIORITY AREA 1: Inclusive and diversified economic growth. (UNDP, FAO, IFAD, ILO, UNIDO)
") NATIONAL DEVELOPMENT PRIORITY: Economic diversification through stimulation of non-oil economic growth. Yemen UNDAF PRIORITY AREA 1: Inclusive and diversified economic growth. (UNDP, FAO, IFAD, ILO, UNIDO)
NATIONAL DEVELOPMENT PRIORITY: Economic diversification through stimulation of non-oil economic growth. Yemen UNDAF PRIORITY AREA 1: Inclusive and diversified economic growth. (UNDP, FAO, IFAD, ILO, UNIDO)
Cambodia: Greater Mekong Subregion: Rehabilitation of the Railway in Cambodia Project
 Major Change in Project Project Number: 37269 Loan Numbers: 2288/8228/2602 Grant Number: 0187 September 2014 Cambodia: Greater Mekong Subregion: Rehabilitation of the Railway in Cambodia Project Distribution
Kov Phyrum Va Sothy Kheang Seang Horn
 Social and Economic Impacts of GMS Southern Economic Corridor on Cambodia Kov Phyrum Va Sothy Kheang Seang Horn Economic Institute of Cambodia Suite 234, Phnom Penh Center Corner Street 274&3, Phnom Penh,
Trade and Poverty Link Experiences from trade in garments and fisheries
 Trade and Poverty Link Experiences from trade in garments and fisheries Neak Samsen Researcher 1 Contents 1. Analytical framework 2. Garment industry Overview Effects of trade in garments on poverty 3.
COUNTRY PRESENTATION - CAMBODIA -
 Workshop on Strengthening Transport Connectivity among CLMVT Countries 09-10 October 2018, Yangon, MYANMAR COUNTRY PRESENTATION - CAMBODIA - By KONG Sophal, Deputy Director General of Land Transport Ministry
INCLUSIVE GROWTH AND POLICIES: THE ASIAN EXPERIENCE. Thangavel Palanivel Chief Economist for Asia-Pacific UNDP, New York
 INCLUSIVE GROWTH AND POLICIES: THE ASIAN EXPERIENCE Thangavel Palanivel Chief Economist for Asia-Pacific UNDP, New York Growth is Inclusive When It takes place in sectors in which the poor work (e.g.,
Contents. List of Figures List of Maps List of Tables List of Contributors. 1. Introduction 1 Gillette H. Hall and Harry Anthony Patrinos
 Contents List of Figures List of Maps List of Tables List of Contributors page vii ix x xv 1. Introduction 1 Gillette H. Hall and Harry Anthony Patrinos 2. Indigenous Peoples and Development Goals: A Global
United Nations Development Assistance Framework
 United Nations SRI LANKA United Nations Development Assistance Framework UN Photo / Evan Schneider UN / Neomi UN Photo / Martine Perret UNICEF UNITED NATIONS IN SRI LANKA Working together for greater impact
1. Photo by Sina Brod. Photo by Sina Brod MIGRATIONS
 10 1. Photo by Sina Brod Photo by Sina Brod MIGRATIONS 89 Migration131127.indd 89 1/8/14 7:57 AM MIGRATIONS Context The Royal Government of Cambodia views Number immigrant (1997-2008) Number Emigrant (1997-2008
COUNTRY REPORT OF THE ASEAN ASSESSMENT ON THE SOCIAL IMPACT OF THE GLOBAL FINANCIAL CRISIS: CAMBODIA
 COUNTRY REPORT OF THE ASEAN ASSESSMENT ON THE SOCIAL IMPACT OF THE GLOBAL FINANCIAL CRISIS: CAMBODIA with the support of: This volume is a product resulting from a project jointly implemented by the staff
THAILAND SYSTEMATIC COUNTRY DIAGNOSTIC Public Engagement
 THAILAND SYSTEMATIC COUNTRY DIAGNOSTIC Public Engagement March 2016 Contents 1. Objectives of the Engagement 2. Systematic Country Diagnostic (SCD) 3. Country Context 4. Growth Story 5. Poverty Story 6.
National Baseline on Civil Registration and Vital Statistics in Cambodia
 National Baseline on Civil Registration and Vital Statistics in Cambodia Implemented by the General Department of Identification / Ministry of Interior October 2016-November 2016 Supported by UNICEF Technical
UNDERSTANDING TRADE, DEVELOPMENT, AND POVERTY REDUCTION
 ` UNDERSTANDING TRADE, DEVELOPMENT, AND POVERTY REDUCTION ECONOMIC INSTITUTE of CAMBODIA What Does This Handbook Talk About? Introduction Defining Trade Defining Development Defining Poverty Reduction
Overview of standards for data disaggregation
 Read me first: Overview of for data disaggregation This document gives an overview of possible and existing, thoughts and ideas on data disaggregation, as well as questions arising during the work on this
North Legend Poverty Rate Less than 25% 25% to less than 36% 36% to less than 45% More than 45% Poverty Rates of Different Regions in Cambodia
 HyoWon Jin May 31, 2011 Poverty in Cambodia Poverty in Cambodia Cambodia is known to be one of the world s poorest countries, and the GDP per capita is $1,952 as of 2008. The population living below $1.25,
Impact of Migration on Older Age Parents
 Impact of Migration on Older Age Parents A Case Study of Two Communes in Battambang Province, Cambodia Analyzing Development Issues (ADI) Team and Research Participants in collaboration with the Institute
Poverty Profile. Executive Summary. Malaysia
 Poverty Profile Executive Summary Malaysia February 2001 Japan Bank for International Cooperation Chapter 1 Poverty in Malaysia 1-1 Poverty Line Malaysia s poverty line, called Poverty Line Income (PLI),
Executive Board of the United Nations Development Programme and of the United Nations Population Fund
 United Nations Executive Board of the United Nations Development Programme and of the United Nations Population Fund Distr.: General 15 March 2013 English Original: French Annual session 2013 3-14 June,
Human Trafficking in Cambodia: Using Spatial Statistics to Analyze Population Vulnerability in Victim Source Locations
 Human Trafficking in Cambodia: Using Spatial Statistics to Analyze Population Vulnerability in Victim Source Locations Vanessa M. Damato, MGIS Student Penn State University Advisors: Dr. Melina T. Czymoniewicz-Klippel
Reducing Poverty in the Arab World Successes and Limits of the Moroccan. Lahcen Achy. Beirut, Lebanon July 29, 2010
 Reducing Poverty in the Arab World Successes and Limits of the Moroccan Experience Lahcen Achy Beirut, Lebanon July 29, 2010 Starting point Morocco recorded an impressive decline in monetary poverty over
KINGDOM OF CAMBODIA. FY2014 Seminar for Gender Equality Officers and Women Leaders in the Asia Pacific Region
 KINGDOM OF CAMBODIA FY2014 Seminar for Gender Equality Officers and Women Leaders in the Asia Pacific Country Report Ms. Chim Manavy Ms. Keo Vathna Cambodia 1- Overview of Cambodia Official name: Kingdom
COMPLIANCE REPORTING FORMS COVER PAGE
 REPORTING FORMS pursuant to the Decision of the Third CCW Review Conference on the establishment of a Compliance mechanism applicable to the Convention, as contained in its Final Declaration, Annex II,
National Mine Action Strategy
 Kingdom of Cambodia Nation Religion King National Mine Action Strategy 2010-2019 Approved by the Royal Government of Cambodia On 11 November, 2010 1 FOREWORD Samdech Akka Moha Sena Padei Techo Hun Sen
Policy, Advocacy and Communication
 Policy, Advocacy and Communication situation Over the last decade, significant progress has been made in realising children s rights to health, education, social protection and gender equality in Cambodia.
Economic and Social Council
 United Nations Economic and Social Council Distr.: General 27 December 2001 E/CN.3/2002/27 Original: English Statistical Commission Thirty-third session 5-8 March 2002 Item 7 (f) of the provisional agenda*
Mr. Ali Ahmadov Deputy Prime Minister of the Republic of Azerbaijan, Chairman of the National Coordination Council for Sustainable Development
 Mr. Ali Ahmadov Deputy Prime Minister of the Republic of Azerbaijan, Chairman of the National Coordination Council for Sustainable Development 2 Azerbaijan joined the Millennium Declaration in 2000. To
KINGDOM OF CAMBODIA CONVENTION ON THE PROHIBITION OF THE USE, STOCKPILING, PRODUCTION AND TRANSFER OF ANTI-PERSONNEL MINES AND ON THEIR DESTRUCTION
 KINGDOM OF CAMBODIA CONVENTION ON THE PROHIBITION OF THE USE, STOCKPILING, PRODUCTION AND TRANSFER OF ANTI-PERSONNEL MINES AND ON THEIR DESTRUCTION Reporting Formats for Article 7 STATE PARTY: POINT OF
The Trends of Income Inequality and Poverty and a Profile of
 http://www.info.tdri.or.th/library/quarterly/text/d90_3.htm Page 1 of 6 Published in TDRI Quarterly Review Vol. 5 No. 4 December 1990, pp. 14-19 Editor: Nancy Conklin The Trends of Income Inequality and
Role of Cooperatives in Poverty Reduction. Shankar Sharma National Cooperatives Workshop January 5, 2017
 Role of Cooperatives in Poverty Reduction Shankar Sharma National Cooperatives Workshop January 5, 2017 Definition Nepal uses an absolute poverty line, based on the food expenditure needed to fulfil a
Human Development Indices and Indicators: 2018 Statistical Update. Cambodia
 Human Development Indices and Indicators: 2018 Statistical Update Briefing note for countries on the 2018 Statistical Update Introduction Cambodia This briefing note is organized into ten sections. The
Women and Migration in Cambodia report
 i A CRUMP Series Report Women and Migration in Cambodia Emily Treleaven (University of California, San Francisco) They Kheam (National Institute of Statistics, Ministry of Planning) This report presents
Explanatory note on the 2014 Human Development Report composite indices. Solomon Islands
 Human Development Report 2014 Sustaining Human Progress: Reducing Vulnerabilities and Building Resilience Explanatory note on the 2014 Human Development Report composite indices Solomon Islands HDI values
CAMBODIA: Floods. The context. appeal no. 22/2000 situation report no. 6 period covered: 7 December January 2001.
 CAMBODIA: Floods 9 February 2001 appeal no. 22/2000 situation report no. 6 period covered: 7 December 2000-31 January 2001 Now that displaced villagers have moved back to their homes from safe areas, the
Halve, between 1990 and 2015, the proportion of people whose income is less than $1 a day
 6 GOAL 1 THE POVERTY GOAL Goal 1 Target 1 Indicators Target 2 Indicators Eradicate extreme poverty and hunger Halve, between 1990 and 2015, the proportion of people whose income is less than $1 a day Proportion
POVERTY AND INEQUALITY IN SOUTH WEST BENGAL: AN OVERVIEW
 Jharkhand Journal of Social Development, Vol. V, No.1 & 2, 2013 ISSN 0974 651x POVERTY AND INEQUALITY IN SOUTH WEST BENGAL: AN OVERVIEW Rajarshi Majumder Associate Professor, Department of Economics, University
Economic and Social Council
 United Nations Economic and Social Council Distr.: Limited 12 July 2006 Original: English For action United Nations Children s Fund Executive Board Second regular session 2006 6-8 September 2006 Item 4
BALANCING HUMAN DEVELOPMENT WITH ECONOMIC GROWTH: A STUDY OF ASEAN 5
 Annals of the University of Petroşani, Economics, 10(1), 2010, 335-348 335 BALACIG HUMA DEVELOPMET WITH ECOOMIC GROWTH: A STUDY OF ASEA 5 SWAHA SHOME, SARIKA TODO * ABSTRACT: Economic growth as measured
Kingdom of Cambodia National Committee for Disaster Management (NCDM) M. Saohorn
 M. Saohorn") Kingdom of Cambodia National Committee for Disaster Management (NCDM) M. Saohorn ORGANIZATIONAL STRUCTURE OF NCDM National Committee for Disaster Management (NCDM) Audit Unit DM Working Groups of Ministries/Institutions
Kingdom of Cambodia National Committee for Disaster Management (NCDM) M. Saohorn ORGANIZATIONAL STRUCTURE OF NCDM National Committee for Disaster Management (NCDM) Audit Unit DM Working Groups of Ministries/Institutions
Poverty Status in Afghanistan
 Poverty Status in Afghanistan Based on the National Risk and Vulnerability Assessment (NRVA) 2007-2008 July 2010 A Joint report of the Islamic Republic of Afghanistan Ministry of Economy and the World
Lao People's Democratic Republic
 Human Development Report 2014 Sustaining Human Progress: Reducing Vulnerabilities and Building Resilience Explanatory note on the 2014 Human Development Report composite indices Democratic Republic HDI
Explanatory note on the 2014 Human Development Report composite indices. Cambodia. HDI values and rank changes in the 2014 Human Development Report
 Human Development Report 2014 Sustaining Human Progress: Reducing Vulnerabilities and Building Resilience Explanatory note on the 2014 Human Development Report composite indices Cambodia HDI values and
Chapter 3 Challenges to Make Cambodian SMEs Participate in Global Value Chains: Towards Addressing Poverty and Inequality
 Chapter 3 Challenges to Make Cambodian SMEs Participate in Global Value Chains: Towards Addressing Poverty and Inequality Naomi Hatsukano and Kiyoyasu Tanaka Abstract The inequality within and between
Trade, Growth and Poverty in the context of Lao PDR
 Trade, Growth and Poverty in the context of Lao PDR Dr. Yan Wang Senior Economist The World Bank Ywang2@worldbank.Org Prepared for the joint workshop on Lao PDR: Trade and The Integrated Framework Vientiane
The World Food Programme (WFP) Jordan FOOD SECURITY OUTCOME MONITORING (FSOM) Quarter 3 (Q3) 2017: Summary Report
 Jordan FOOD SECURITY OUTCOME MONITORING (FSOM) Quarter 3 (Q3) 2017: Summary Report") The World Food Programme (WFP) Jordan FOOD SECURITY OUTCOME MONITORING (FSOM) KEY FINDINGS: Food consumption improved amongst Syrian refugee households in quarter 3 (Q3), for both WFP general food assistance
The World Food Programme (WFP) Jordan FOOD SECURITY OUTCOME MONITORING (FSOM) KEY FINDINGS: Food consumption improved amongst Syrian refugee households in quarter 3 (Q3), for both WFP general food assistance
HUMAN SECURITY AND SOCIAL DEVELOPMENT COMPARATIVE RESEARCH IN FOUR ASIAN COUNTRIES
 HUMAN SECURITY AND SOCIAL DEVELOPMENT COMPARATIVE RESEARCH IN FOUR ASIAN COUNTRIES CONFERENCE ON NEW FRONTIERS OF SOCIAL POLICY: DEVELOPMENT IN A GLOBALIZING WORLD ARUSHA, TANZANIA, DECEMBER 14, 2005 James
Global MPI Country Briefing 2018: Cambodia (East Asia and the Pacific) 10 Indicators. Years of schooling (1/6) School attendance (1/6)
 10 Indicators. Years of schooling (1/6) School attendance (1/6)") Oxford Poverty and Human Development Initiative (OPHI) Oxford Department of International Development Queen Elizabeth House, University of Oxford www.ophi.org.uk OPHI Oxford Poverty & Human Development
Oxford Poverty and Human Development Initiative (OPHI) Oxford Department of International Development Queen Elizabeth House, University of Oxford www.ophi.org.uk OPHI Oxford Poverty & Human Development
Decent Work Indicators in the SDGs Global Indicator Framework. ILO Department of Statistics & ILO Regional Office for Asia and the Pacific
 Decent Work Indicators in the SDGs Global Indicator Framework ILO Department of Statistics & ILO Regional Office for Asia and the Pacific Content Introduction Monitoring and reporting Decent Work Agenda