5.3 Population Growth by Provinces Demographic Transition in Cambodia Population s interaction 33 Chapter 6 Summary and Conclusions 35
|
|
|
- Dorcas Goodwin
- 5 years ago
- Views:
Transcription
1 March 3-6,2013
2
3 i ix x
4 5.3 Population Growth by Provinces Demographic Transition in Cambodia Population s interaction 33 Chapter 6 Summary and Conclusions 35 Glossary 38 Appendix 41 Appendix 1. Form A, House-listing 42 Appendix 2. Form B, Household Questionnaires 43 ii
5 FOREWORD By HE. Senior Minister, Minister of Planning, Cambodia I have great pleasure in presenting this report on Spatial Distribution and Population Growth in Cambodia, containing an in-depth analysis of the results of the Cambodia Inter-censal population Survey (CIPS), conducted by the National Institute of Statistics (NIS) in March 2013 under technical and financial support by UNFPA, JICA and Government of Japan. From the point of view of a nationally representative sample survey of 955 Primary Sampling Units and 28,650 households, this survey could be considered as a major statistical exercise in the country in recent time. This database created by the present survey could be useful on an interim basis until the next population census is conducted. This survey is follow-up of the successful Population Census conducted in 2008 after Population Census The census results have been widely disseminated within the line Ministries and among large body of data users and public. The National Population Policy for Cambodia formulated in August 2003 was one of the significant outcomes of the census results. The successful conduct of the next census is crucial to obtain a correct population count and to update the much needed demographic data in the country. Such information is required for planning not only at national and provincial level but also at district, commune and event at village levels. The present survey is in the nature of preparation for the gigantic task of the census. More than a thousand staff of the NIS and Provincial Planning Office was trained in this survey. Their services will be available for the next census to train a large number of enumerators and supervisors who will be recruited. The CIPS 2013 may therefore be called the harbinger of the next Population in Cambodia due in the year On behalf of the Ministry of Planning, I wish to place on record our gratitude to the United Nations Population Fund (UNFPA) for supporting the whole process of CIPS, 2013 including resources and technical assistance program with emphasis on capacity development. Thanks are due to Japan International Cooperation Agency (JICA) for providing technical assistance for mapping villages and Enumeration Area (EAs), and for participating in analysis and dissemination of the results. I appreciate the hard work put in by the staff of the NIS under the guidance and supervision of H.E. Mrs. Hang Lina, Director General, NIS and the Provincial Planning Offices in making the survey a success as well as in the preparation of this report. I wish to take this opportunity to thanks all staff in the National Institute of Statistics as well as all survey field staff who have taken part and contributed to success of the Cambodia iii
6 Inter-censal Population Survey, We are also thankful to technical advisers for the survey: Mr. Nott Rama Rao, Dr. Hans Petterson, Mr. Yi Soktha, Mr. Gregory Martin, Mr. Fumihiko Nishi, Mr. Akihiko Ito and Mr. Akihito Yamauchi. I am sure this report would be welcomed by the line-ministries, international agencies, non-government organization, policy makers, program implementers, development planners, and researchers a publication with a plethora of useful information. We hope to received feedback and comments to improve our subsequent publication. Ministry of Planning Phnom Penh December 2013 CHHAY THAN Senior Minister, Minister of Planning iv
7 PREFACE The Cambodia Inter-censal Population Survey, 2013 was conducted not only to obtain the much-needed demographic data following the census, but also to serve as a means to train the staff of the NIS and Provincial Planning Offices in demographic data collection. We are happy to record that the survey achieved both objectives. This report contains and in-depth analysis on Spatial Distribution and Population Growth in Cambodia based on the results of CIPS, A general report at national level and separate report for each province will be prepared later. There was planned to produce more in-depth studies based on the results of the survey, on other topics of interest. Our special thanks are due to H.E. Chhay Than, Honorable Senior Minister, Minister of Planning, Cambodia whose keen interest in the census and in the survey was always a source of inspiration and encouragement both to the national and international staff of the project. We sincerely thank to the United Nations Population Fund (UNFPA) for supporting the whole process of CIPS, 2013 including resources and technical assistance program with emphasis on capacity development. Thanks are due to Japan International Cooperation Agency (JICA) for providing technical assistance for mapping villages and Enumeration Area (EAs), and for participating in analysis and dissemination of the results. The success of the survey was mainly due to the enthusiastic participation of a large number of staff in fieldwork, data processing and other survey activities. To every one of them our thanks are due. The UNFPA and JICA national project staff closely assisted the NIS and the provincial staff. The names of personnel associated with this report are mentioned separately. We are thankful all of them. Phnom Penh, Cambodia December, 2013 Hang Lina Director General National Institute of Statistics v
8
9 Cambodia Inter-censal Population Survey, 2013 Personnel Associated with this report National Institute of Statistics H.E. Mrs. Hang Lina, Director General Mr. Has Bunton, Deputy Director General Mr. Sok Kosal, Deputy Director General Mr. Try Menseang, Deputy Director of Demographic, Census and Survey Department Mr. Chea Kung, Deputy Director of Demographic, Census and Survey Department Mr. Seang Rith, Vice Bureau Chief Mr. Chap Ratana, PD Assistant vii
10 List of Abbreviations and Acronyms ASFR CDHS CD-ROM CEB CIPS CMDGs CS CWR CSPro DDG DG DUSC EA GIS GRR IMR JICA MOP NGO NIS NSDP PES POPMAP PSU QA REDATAM RGC RS SSU TFR TV U5MR UN UN CensusInfo UNFPA WHO WB WinR+ Age-Specific Fertility Rates Cambodia Demographic and Health Survey Compact Disc Read-only Memory Children Ever Born Cambodia Inter-censal Population Survey Cambodia Millennium Development Goals Children Surviving Child Woman Ratio Census and Survey Processing System Deputy Director General Director General Data Users Service Center Enumeration Area Geographic Information System Gross Reproduction Rate Infant Mortality Rate Japan International Cooperation Agency Ministry of Planning Non-governmental organization National Institute of Statistics National Strategic Development Plan Post Enumeration Survey Population Map Primary Sample Units Quality Assurance Retrieval of Data for Small Areas by Microcomputer Royal Government of Cambodia Rectangular Strategy Secondary Sampling Units Total Fertility Rate Television Under-Five Mortality Rate United Nations United Nation Census Information United Nations Population Fund World Health Organization World Bank Redatam Plus for Windows viii

11 Map 1. CAMBODIA- PROVINCES ix
12 Cambodia Inter-censal Population Survey 2013 Final Result Figures at a Glance Basic Characteristics of administrative Number of municipality 1 Number of provinces 23 Number of cities/krongs 26 Number of khans 9 Number of districts 159 Number of sangkats 204 Number of communes 1,429 Number of villages 14,119 Characteristics Total Males Females Total population 14,676,591 7,121,508 7,555,083 Urban population 3,146,212 1,527,479 1,618,734 Percentage of urban population Annual growth Rate 1.46 % Population density 82/sq.km Percentage of population under Percentage of population Percentage of population Age dependency ratio Total Urban Rural Sex ratio Total 94.3 Urban 94.4 Rural 94.2 Median age Total Urban Rural Number of Households 3,163,226 Percent of female headed households 27.1 Average household size Total 4.6 Urban 4.8 Rural 4.6 Percentage of population aged 15 and over by marital status Never married Married Widowed Divorced Separated Singulate Mean age at Marriage Total Urban Rural Adult literacy rate (population aged 15 and more) Total x
13 Urban Rural Educational attainment of Literate population aged 7+ No educational level Primary not completed Primary completed Lower secondary Secondary/diploma Beyond Secondary Proportion currently attending school/educational institution Aged Aged Aged Aged Aged Percentage of disabled population Percentage of disabled population by type of disability Difficulty in seeing Difficulty in speech Difficulty in hearing Difficulty in movement Mental Mental retardation Mental illness Any other Multiple disabilities Employment and Unemployment Labour force participation rate Employment rate Unemployment rate Economically inactive rate Labour force participation rate aged Total Urban Rural Unemployment rate aged Total Urban Rural Employment rate by industrial sector Primary Secondary Tertiary Employed population aged 5 + with secondary activity Percentage of migrant by place of last residence Total Urban Rural Percentage of internal migrants by migration stream Rural to Rural Rural to Urban xi
14 Urban to Rural Urban to Urban Percentage of buildings by nature of construction Permanent Semi- Temporary Permanent Total Urban Rural Percentages of households by source of drinking water Piped water 19.8 Tube/wipe well 29.5 Protected dug well 6.2 Unprotected dug well 14.3 Rain 1.4 Spring, river, etc 18.7 Bought 8.6 Other 1.4 Percentage of households using electricity as main source of light Total 48.0 Urban 94.0 Rural 36.0 Percentage of households by main type of fuel used for cooking Firewood 77.9 Charcoal 8.4 Kerosene 0.1 Liquefied Petroleum gas (LPG) 12.1 Others 1.4 Percentage of households having toilet facility within premises Total 48.7 Urban 87.5 Rural 38.5 Percentage accessibility to internet facility No Access 94.5 Accessed at home 2.6 Accessed outside home 1.3 Accessed at home and outside home 1.6 Total fertility rate per 1,000 live birth Total 2.8 Urban 2.1 Rural 3.1 Infant mortality rate per 1,000 live birth Total 33 Urban 9 Rural 38 Under five mortality rate per 1,000 live birth Total 53 Urban 15 Rural 60 Life expectancy at birth Total 68.9 Urban 76.8 Rural 67.6 xii
15 Chapter 1 Introduction 1.1 Background The Cambodia Inter-censal Population Survey 2013 (CIPS) was conducted in March The reference time for the survey was the midnight of March 3 (00 hours). This is the second Inter-censal Population Survey to be conducted in Cambodia (CIPS 2013). The first one (CIPS 2004) was conducted in March The Inter-censal Population Survey in March 2013 was planned to take place exactly in the middle of the two censuses held in 2008 and For the first time, the 2013 Inter-censal Population Survey provides estimates up to the provincial level. The target population set for CIPS, 2013 was the normal household population (regular households) of Cambodia. People living in institutions, such as hospitals, hostels, police quarters and prisons as well as homeless populations were not covered in the survey. However, normal households residing within institutional settings were covered. It is a nationally representative sample survey conducted for updating information on population size and growth, fertility, mortality, migration and other population characteristics as well as household facilities and amenities. The process of formulating a National Population Policy has been greatly advanced through the availability of population and demographic data. At the same time data from specialized surveys such as the socio-economic survey and Demographic and Health Survey, labour force surveys and migration studies have complemented the census data and helped build a body of essential statistics to guide the development process. The conduct of the Cambodia Inter-censal Population Survey 2013 is an important step in the creation of a continuous flow of population data that will enable Cambodia prepare plans and programmes of development supported by a strong database. 1.2 Survey Objective The Cambodia Inter-censal Population Survey 2013 was conducted with the objective of providing information on the following characteristics of the population: Population size and distribution; sex, age and marital status; fertility and mortality; migration status; disabled population; literacy and educational level; employment and unemployment; housing and household amenities; and other population and household information. These fresh data will enable calculation of reliable estimates and projections of: Population size and growth, fertility and mortality levels, volume of migration, housing and household amenities and related details.the survey was also intended to train the national staff in sampling, data collection, data processing, analysis and dissemination. 1.3 Survey Content The draft questionnaires for the CIPS 2013 were more or less on the 2008 General Census pattern. Some modifications, however, were made by adding new questions and amending some of the old questions. Two types of questionnaires were used in the CIPS 2013: Form A House-list and Form B Household Questionnaire (see Appendix I and II). 1
16 The Form A was used to collect information on buildings containing one or more households during the preliminary round preceding the survey night (March 3, 2013). Form B which has five parts, was used for the survey enumeration in the period closely following the reference time. 1.4 Survey Organization The sampling design and estimation procedure adopted in the survey are described in Chapter 2.The first preliminary field work for the survey was mapping that was carried out with technical assistance from Japan International Cooperation Agency (JICA). Trained NIS staffs were deputed to draw the sketch map of the villages and detailed EA maps. The Director General of NIS served as the Director of CIPS The provincial planning directors of each of the 23 provinces and Phnom Penh Municipality served as coordinators in their respective areas. About a hundred NIS survey coordinators were drawn from different divisions of NIS and allotted to provinces at the rate of about eight to nine villages per person. They then acted as technical advisors to all survey staff and were responsible for technical aspects of the survey in the allotted province. Their foremost tasks were to train the supervisors and the enumerators, supervise the fieldwork and ensure proper distribution of CIPS materials and collection of completed records. For every selected enumeration area, there was one enumerator and normally the work of three enumerators was monitored and supervised by one supervisor. Enumerators and supervisors were drawn from the cadre of teachers and other civil servants. Preferably those residing within or near the selected villages were appointed by the provincial directors. In all there were 955 enumerators and 318 supervisors busy in the field during early March The Senior Minister, Minister of planning, Secretaries and Under-Secretaries of State, and other Directors of Departments also assisted in supervising the field activities. A technical consultant appointed by UNFPA undertook a few short-term missions at appropriate stages to provide training and overall guidance to the NIS and to ensure proper organization and implementation of the CIPS field undertaking as well as to assist in the preparation of the tabulation plan and reports. A sampling consultant provided guidance on sampling particularly on estimation procedure and computation of sampling errors. Data Processing consultant (DPC) in his short-term missions gave training to the staff in data processing and guided and supervised the processing of CIPS results. 1.5 Training for Field Staff The 100 NIS Survey Coordinators (NIS SC) were first intensively trained at the NIS (November- December 2012) by senior officers on updating village/ea maps, sampling, house-listing, interviewing households and filling-in household questionnaires, concepts and definition. The Province Directors (with their Deputy Directors) were trained on CIPS at NIS for one week in January 2013, since they were expected to be deeply involved in organizing the survey and making field visits to ensure that the survey was proceeding smoothly. The training of appointed enumerators and supervisors on all aspects of the survey, especially questionnaires and concepts (including practice), was conducted at the Provincial Headquarters by NIS survey coordinators assisted by the Provincial Director/Deputy Director for six days (19 to 23 February, 2013). 1.6 Data Collection and Supervision For every selected EA, a field listing was organized in order to make a current and complete listing of households located within it. At the first step the enumerator would have to update sketch maps of 2
17 villages and EA maps. Residential and partly residential buildings were numbered using sticker and marked on map by covering a prescribed path of travel in order to make sure that all buildings in which households resided were accounted for. During the primary operation of the survey (lasting five days from 26 February to 2 March, 2013) building/structures wholly or partly used for residential purpose in selected EAs (955 in all) were listed in the House List called Form A (Appendix 1). After the listing operation was completed in an EA, a fixed sample size of 30 households was selected from the house list by the respective supervisor. This selection was carried out systematically by computing interval in each EA and choosing the random start, by using linear sampling. It was closely supervised by NIS survey coordinators to ensure correctness in the selection process. During the main phase of the survey, the Household Questionnaire called Form B (Appendix II) was completed by the enumerator in each of the 30 sample households selected in his/her EA. Overall, the supervisory teams found that respondents were willingly answering the survey questions. 1.7 Data Processing The completed records ( Form A, Form B, Form I, Form II, Map, and other prescribed Forms) were systematically collected from the provinces by NIS Survey Coordinators on the due dates and submitted to the team receptionist at NIS. Training on editing and coding of filled-in schedules was conducted for senior staff, who in turn trained other editors and coders. The purpose of the editing process was to remove matters of obvious inconsistency, incorrectness and incompleteness, and to improve the quality of data collected. In order to capture the data recorded on Form A (House List), Form B (Household Questionnaire) and Form 2 (Enumerator s Summary), three separate data entry applications using CSPro software package were made. CSPro package was used for tabulation as well. The data entry section consisted of 14 keyboard operators working under two supervisors. They were thoroughly trained on data entry procedures and the CSPro data entry software in the third week of March Tabulation and Analysis Plans In consultation with data users, NIS decided to produce about 78 basic priority tables (see Appendix III) most of which are for both National and provincial levels. The Provincial level Tables are only for Total and not separately for rural and urban areas due to smallness of the sample size. These tables cover most of the topics included in the CIPS 2013 questionnaires and their cross classification should satisfy most of the requirements of all sections of data users. The production of priority tables may be followed by the preparation of additional tables called supplementary tables if proposed by the data users, and other tables produced in the course of in-depth analysis. Analysis of the survey data will include preliminary analysis of provisional population totals, general analysis at the National and Provincial levels of the final survey data as well as in-depth analysis in respect of the following topics by the NIS analysis team with technical assistance by UNFPA and JICA: (i) Fertility and mortality (ii) spatial distribution and Population growth (iii) Nuptiality (iv) Gender and age composition (v) Disability (vi) Migration (vii) Literacy and educational attainment (viii) Economic activity and employment (ix) Housing and household amenities (x) Family and Household (xi) Population Projections (xii) Women in Cambodia and (xiii) Urbanization and development in Cambodia. Some more topics may also be taken up for study if needed. A separate report on each topic is expected to be prepared. For this purpose a workshop may be held for each subject involving the national staff not only within the NIS but also from other line Ministries concerned. This will afford an opportunity to the staff concerned to interact with each other and study deeply the survey results and 3
18 draw conclusions which could be incorporated in the analytical report. Such a system worked very well in the past census analysis programmes. 1.9 Dissemination Plan The reports mentioned under the analysis plan will be printed and published. The preliminary report based on provisional population totals was released in August The present report contains general analysis mostly at the national level, of the data contained in the priority tables. This will be followed by the publication of analytical reports mentioned above in stages. Off-line electronic dissemination products will be mainly in the form of CD-ROM. The project plans to produce a variety of electronic dissemination products based on CD ROMs. These include: a Table Retrieval System, a Community Profile System and a thematic mapping application. Census Info will also be used as dissemination tool. The NIS maintains a web site ( for providing information from population censuses, the results of various types of surveys, periodical publication, etc. The salient results of CIPS 2013 will be put on the web site. Seminars for the presentation of the survey results and workshops to train planners in the line Ministries and other data users may be conducted in the course of in Phnom Penh and every province/district so as to benefit participants down to the district level Quality Assurance Adequate steps were taken to ensure quality of data at every stage of the Survey. For quality assurance in field work, the importance of collecting quality information was stressed in the training classes for enumerators and supervisors. The need to collect accurate data by gender was also emphasized. For every four enumerators, there was a field supervisor who closely checked the work of every enumerator under him/her. The data processing division initially carried out manual coding and editing of filled-in schedules. Computer editing was also carried out to produce clean data sets freed of errors and ready for tabulation. QA was maintained in production of tables also so as to maintain timeliness and security of the tables. In the dissemination of census results accessibility, relevance and user satisfaction is proposed to be ensured Limitations of the Survey The various estimates presented in this report are derived from a sample of the surveyed population. As in any such survey, these estimates are subject to both sampling and non-sampling errors. Although the CIPS 2013 sample was chosen at random, the people who took part in the survey might not necessarily be a representative cross-section of the total population. Like all sample surveys the results of the present survey are estimates of the corresponding figures for the whole population and these results might vary from the true value in the population. Nevertheless the demographic, social and economic indicators produced are broadly comparable with earlier census and survey results contained so as to serve as a measure of change over time, useful for planning and monitoring. 4
19 Chapter 2 Sampling Design, Estimation and Evaluation 2.1 Introduction This is the second Inter-censal Population Survey to be conducted in Cambodia (CIPS 2013). The total sample size determined in order to make reliable estimates at provincial level was 955 out of 28,000 Enumeration Areas (EAs) of the 2008 Census as Primary Sampling Units (PSUs) and 28,650 households as the Secondary Sampling Units (SSUs). The survey was designed to provide reliable estimates for urban and rural areas at the national level but at provincial level, it was expected to provide reliable estimates only for total population disaggregated by sixth sample fraction varied by stratum and data were weighted to correctly represent the population. Usually data would be weighted if the sample design gave each individual an equal chance of being selected. This can be achieved by using survey weights. Weights can also serve other purposes, such as helping to correct for non-response. 2.2 Sampling Frame The sampling frame used for the 2013 CIPS was the complete list of all EAs of the 2008 General Population Census of Cambodia. The list was updated to reflect administrative changes since the last census up to September The main administrative change was the relocation of the boundary between Kandal and Phnom Penh provinces with the result that 20 communes were shifted from Kandal province to Phnom Penh. Twelve new communes were established, six of them in Battambang province. In addition there were less significant changes like shifting of communes from one district to another within a province, splitting and merging of villages etc. and creation of another Khan in Phnom Penh (called Khan Pur Senchey) by annexing some part of Khan Dangkor and Kandal province. Taking into account all aspects, some geographic areas have been re-coded for construction of a revised and updated sampling frame for utilization in the multistage sample design. 2.3 Stratification The main domains of study for the survey are the provinces. Reliable estimates were required for each province. Consequently, the sampling frame was stratified by province. Within province a further stratification by urban and rural was done. There was no explicit stratification of province as urban and rural in the Demographic Survey of 1996 and CIPS The list of EAs was geographically ordered in a serpentine fashion within each stratum. This ordering provided a further implicit stratification on geographical location within the explicit strata as systematic sampling was employed. 2.4 Sample Size and Sample Allocation An approximately almost equal allocation number of households over the provinces were employed, giving a sample of approximately 1,200 households in each province. The size of the provinces (population-wise) varies substantially; the largest province represents 13.1 percent of the total households in the country; the smallest one represents just 0.3 percent of the total households in the country. Within each province the sample was allocated approximately proportionally between urban and rural areas. 5
20 Table 2.1 Distribution of Sample Enumeration Areas (EA) and Households by provinces Province Sample Size Enumeration Areas (EAs) Households (1) (2) (3) Cambodia ,650 BanteayMeanchey 41 1,230 Battambang 41 1,230 Kampong Cham 41 1,230 Kampong Chhnang 40 1,200 Kampong Speu 41 1,230 Kampong Thom 40 1,200 Kampot 40 1,200 Kandal 41 1,230 Koh Kong 39 1,170 Kratie 40 1,200 MondulKiri 37 1,110 Phnom Penh 41 1,230 PreahVihear 39 1,170 Prey Veng 41 1,230 Pursat 40 1,200 Ratanak Kiri 39 1,170 Siem Reap 41 1,230 Preah Sihanouk 40 1,200 Stung Treng 39 1,170 Svay Rieng 40 1,200 Takeo 41 1,230 OtdarMeanchey 40 1,200 Kep 35 1,050 Pailin 38 1, Survey design The sample design for the survey was a stratified two-stage sampling design, where the Enumeration Areas (EAs) were considered as the Primary Sampling Units (PSUs) and the households as Secondary Sampling Units (SSUs) Primary Sampling Units (PSUs) The EAs or the primary sampling units (PSUs) were well-defined geographic units for which reliable population data are available. The EAs were arranged by geographical codes like province code, district code, commune code, and village code village code and enumeration area code. The sample EAs were then selected using the Linear Systematic Sampling without Replacement (LSSWR). Selected EAs with less than 40 regular households were discarded and replaced by a neighboring EA of sufficient size. Altogether 12 EAs were replaced in this manner. This procedure was not strictly correct. It meant that the households in the small EAs had no chance of being included in the sample-a violation of the basic principle in sampling. The proper procedure would be to combine the selected EA with a neighboring EA in a random way. However, the number of replacements being so small, it does not significantly affect the quality of the estimates. 6
21 Large EAs-the number of households exceeding 150-were divided into roughly equal sized segments containing approximately households and one segment was selected randomly. In the case of segmenting, the field team recorded the number of segments that were created and the segment that was selected out of them. The EA map prepared clearly indicated the EA and the segments created within the EA. An important principle followed was that as far as possible the selected sample of EAs should not be tampered with. If a selected EA turned out to have very few households, still this EA was kept in the sample. Still, in a few cases practical considerations might have overruled this principle. There were two cases where whole villages were relocated from one place to another because the old place had to be cleared for development projects (villages and ). In these cases it was decided to keep the villages in the sample Secondary Sampling Units (SSUs) For the purpose of selection of the secondary sampling unit, a household was defined as follows to guide the field staff: It is a group of people who presently live together and take food from a common kitchen. By this definition, a household does not include persons who are currently living elsewhere for purposes of study or work. The household includes domestic workers or temporary visitors. And, in practice, we want to select our respondent from among persons in the household who will be available for interview on that same day. In multi-household dwelling structures (like blocks of flats, compounds with multiple houses, or backyard dwellings for rent, relatives, or household workers), each household was treated as a separate sampling unit. At this stage, sample households in the sample EA were selected, by Linear Systematic Sampling (LSS) with Random start method as described below: R1 = 1 to I: Random start in range between 01 to Interval (R = 1 to I) I = Interval between household to another households in the listing sheet 2.6 Probability Selection Where: I = M hi / m hi Mhi : Actual number households in a listed in EA at the time of survey mhi : ( 30hhs ) the sample of households select from the selected EA Assume R =R1 Random start or the 1 sample household (R = 01 to I) The 30 sample households are calculate as below R =R1, R2 =R1+ I, R3 = R1 + 2I, , R30 = R1 +29I There was no proportional allocation of the sample at the national level. The spreadsheet containing all sampling parameters and selection probabilities were prepared to facilitate the calculation. Sampling was carried out based on separate sampling probabilities for each sampling stage. 7
22 2.6.1 Probability 1 The first-stage sampling probability involved in selection of each i th EA in h th Stratum is: P = n N Where: n hi is the number of EAs selected in h th stratum. N hi is the total number of EAs in the h th stratum Probability 2 The second-stage sampling probability involved in selection of certain households within the selected EA in stratum h is: Where: 2.7 Extrapolation m P = M S m hi is the number of households selected in EA i in stratum h (m hi is usually =30; will be less than 30 if the EA is very small, having less than 30 households in total). M h i is the number households listed in EA (or segment) i in stratum h. S hi is the number of segments created in the EA (in most cases=1, i.e. when no segmentation has been done. If 3 segments have been created then S hi is equal to 3). A spreadsheet containing all sampling parameters and selection probabilities were prepared to facilitate the calculation of sampling weights. Sampling weights were adjusted for household and individual records. The overall selection probability of each household in cluster i of stratum h is the product of the two stages of selection probabilities Basic weight = The sampling weight (design weight) for each household in cluster i of stratum h is the inverse of its overall selection probability: = 1 = 1 1 = = Adjustment weight A study of the sizes of the sampled EAs in terms of number of households showed that the EA sizes (M ) were on the low side. There was probably some confusion in some areas regarding the exact location of the EA boundaries resulting in under listing of households. Furthermore, there could be cases where the EA was segmented but the segmentation was not properly recorded in the sampling 8
23 sheets. It was therefore decided to introduce an adjustment to the design weights with the effect that the sample households in the EA would not be raised to the EA-total (M ) but rather to the number of households per EA in the village where the EA is located. The weights became: = where M is the number of households per EA in the village where the EA is located. These weights were used for estimates of household characteristics based on Form B data. The weights can be expressed in terms of first and second stage weights as: = = The first stage weight (w ) was used for estimates of household characteristics based on the Form A questionnaire. (Form A covered all households in the selected EA so there was no need for the second stage weight). The sum of the first stage weights over the sample constituted an estimate of the total number of regular households in the country. The estimate of total number of households was short of the number of households reported in the Commune Data Base (CDB). It was therefore decided to adjust the first stage household weights slightly upwards so that the estimates would agree with CDB totals. This calibration of the weights was done at the province level by urban/rural. A further adjustment was done in Phnom Penh and Kandal provinces due to the changes in boundaries between the two provinces (20 Kandal communes were transferred to Phnom Penh province in 2011). 2.8 Standard Errors and Confidence Intervals The sample survey is always affected by two types of errors: non-sampling errors and sampling errors. Non-sampling errors are the results of mistakes made in implementing data collection and data processing, such as failure to locate and interview the correct household, misunderstanding of the questions on the part of either the interviewer or the respondent, and data entry errors. To minimize this type of error, non-sampling errors are impossible to avoid and difficult to evaluate statistically. Sampling errors, on the other hand, can be evaluated statistically. It is usually measured in terms of the standard error for a particular statistic (mean, proportion), which is the square root of the variance. The standard error can be used to calculate confidence intervals within which the true value for the population can reasonably be assumed to fall. The standard errors are calculated in the SPSS Complex Samples module. The variance of an estimate of a total is: where: V(Y)= ˆ L m h=1 h nh nh - 1 n h i=1 Yˆ hi Yˆ - n h h 2, Y ˆ = hi W ' hi yhij Yˆ h= Y ˆ j=1 n h i=1 hi 9
24 Some of the estimates from the CIPS will be in the form of proportions or percentages. The variance estimator of a ratio can be expressed as follows: where: V(R)= ˆ 1 Xˆ 2 COV(X,Y)= ˆ ˆ ˆ 2 ˆ V(X) ˆ - 2 Rˆ COV(X,Y) ˆ ˆ, V(Y)+ R L h=1 nh nh - 1 n h i=1 Xˆ hi Xˆ - n h h Yˆ hi Yˆ - n V( Y) ˆ and V( X ˆ ) are calculated according to the formula for the variance of a total Confidence Intervals Table 1 provides standard errors, confidence intervals and coefficients of variation for estimated number of people by province. The overall reliable estimate at 95 percent of confidence interval of population figures at national level of the CIPS, 2013 falls between 14,356,392 and14,996,882.these confidence intervals vary from province to province of Cambodia as may be seen in Table 2.2. Table 2.2 Standard Errors, Confidence Intervals and Coefficient of Variation for estimated number of people by Province Province Estimate Standard Error 95% Confidence Interval Coefficient of Lower Upper Variation Country 14,676, ,166 14,356,392 14,996, Banteay Meanchey 729,624 38, , , Battambang 1,121,001 42,729 1,037,145 1,204, Kampong Cham 1,757,190 66,630 1,626,427 1,887, Kampong Chhnang 523,202 28, , , Kampong Speu 755,465 35, , , Kampong Thom 690,386 39, , , Kampot 611,583 30, , , Kandal 1,115,959 37,863 1,041,652 1,190, Koh Kong 122,258 6, , , Kratie 344,195 14, , , Mondul Kiri 72,680 4,338 64,166 81, Phnom Penh 1,688,040 66,892 1,556,763 1,819, Preah Vihear 235,355 10, , , Prey Veng 1,156,821 34,578 1,088,962 1,224, Pursat 435,562 18, , , Ratanak Kiri 183,699 15, , , Siem Reap 922,975 65, ,665 1,052, Preah Sihanouk 250,180 19, , , Stung Treng 122,791 7, , , Svay Rieng 578,461 21, , , Takeo 923,297 29, , , Otdar Meanchey 231,387 11, , , Kep 38, ,047 40, Pailin 65,795 2,407 61,071 70, h h 10
25 Chapter 3 Size and Distribution of Population 3.1 Concepts and Methodology The spatial distribution of population is one of the most important topics of human development and geography spreading. It is significantly important, because population has brought tremendous change over the territory of the country. The term distribution refers to the way the people are spaced over the earth s surface; the emphasis is that, on the pattern of actual place locations of a population. This spatial distribution can be derived from results of administrative recorded, survey data and commonly from population census is the insight it provides into the patterns of population settlement across the country. The main objective of this for the stratified this spatial distribution is used for generally form of administrative purposed implementation programme and determining the electoral constituencies. There are several methods used for describing spatial distribution of population. The simplest of spatial distribution of population is distribution of population by percent according geographical areas. Another methodology usually adopted is to list the geographical areas of a given class into rank order which enables comparison of ranking from census to census. This provides changes in population trends over time. There are also other methods which are generally used to study population distribution like calculation of median point, the mean point or the centre of population, the point of minimum aggregate travel, and the point of maximum population potential. In this report, however, the simple methods of percentage distribution and population composition of the geographical areas are used to study the population distribution in Cambodia. Population density also have been used to measure the spatial distribution of population is it refer to population per square kilometer (Km 2 ) after excluding area occupied by water. These ratios are known as arithmetic density, physiological or nutritional density, agricultural density, economic density etc. In this chapter the analysis of population density will be confined to the ratio of population of a given geographical or administrative unit to the area occupied by that unit. 3.2 Factors Affected Population Distribution The spatial distribution of population might influent by economic, social and physical reasons lead people migrate, and they can usually be classified into push and pull factors. Push factors are those associated with the residence of origin, while pull factors are those that are associated with the residence of destination. The dominant motive for migration is economic, and pull factors tend to be higher wages and greater demand for labour perhaps found in centers of industry and commerce. This economic pull factors loom large in all human movements, but are particularly important with regards to migration. Better economic opportunities, more jobs, and the promise of a better life often pull people towards a new place of residences. Sometimes this is encouraged by the destination place of residences, such as the employment absorbs in the Phnom Penh, provincial town and other urban residences by garment and other services require of labourers, which actively recruited young men to move for these purpose. The social and political factors also play an important actors pull people from their place of original residence such as better of food or shelter, health care facilities, high standard of living, good and fair in educational opportunities, no religious discrimination, fair legal system, enfranchisement and insecurities. In the last decades an opening sky and rapidly development by government pull young couple to take new land for shelter in some part of the country especially in north part of the country and provinces sharing to the neighbors. 11

26 Economic push factors can include overpopulation and the absence of economic opportunity. Social and physical reasons tend to involve forced migration, and an example of a social push factor would be intolerance towards a certain cultural group. Economic push factors tend to be the exact reversal of the pull factors; a lack of economic opportunity and jobs tend to push people to look out of their residence of origin for their futures due to often work low-wage, long-hour jobs in farming, construction and domestic labour. It is difficult to classify this case purely with push factors however, as often the factors associated with the residence of origin are just as important as the factors associated with the residence of destination. It is also observe that the social and political factors play an important reasons push people from their place of residence such as lack of food or shelter, health care facilities, lower standard of living, educational opportunities, religious discrimination, unfair legal system, disenfranchisement and insecurities. Another factor may called physical factors we are not including things like the promise of fertile lands and natural calamity that prompted compelled people to seek safety elsewhere. 3.3 Population Size According to Cambodia Inter-Censal Population Survey 2013 (CIPS 2013) the populations of Cambodia at 00 hour March 2013 were14.68 million compared to million in In absolute terms, Cambodia population has increased by 1.28 million during haft decade The average annual exponential growth rate in households was 1.83 percent. Considering all the aspects, the growth rate of population in Cambodia during may be the average of the three estimates (1.83 per cent, 1.28 per cent and 1.27 per cent) work out 1.46 per cent. Cambodia population has steadily increased 5.7 million since the 1962 when the first census was conducted after the country attained independence from the French rule. Cambodia s demographic scenario had changed completely after that census due to war and unrest. There were no further censuses until However, the population estimation has been done by various demographer for certain planning and policies. The General Demographic Survey was estimated about 6.59 million. The Socio-Economic Survey of Cambodia conducted by the NIS in April 1994 estimated the country s population as 9.87 million. The NIS carried out the Demographic Survey in March 1996 covering 20,000 households and estimated the population as 10.7 million. This remained as the only source of population until the 1998 census conducted in March 1998.Cambodia s population according to the Census was 11.4 million in This had increased by about 1.96 million during the decade reaching the figure of million. Figure 3.1 Population trends of Cambodia during Sources: First Census, 1962, General Demographic Survey 1980, Socio-Economic Survey of Cambodia, , Demographic Survey of Cambodia, 1996, Second Census, 1998, Cambodia Inter-Censal Population Survey, 2004, Third Census, 2008 and CIPS

27 3.4 Cambodia in Regional Population of the Southeast Asian Countries Southeast Asia consists of eleven countries squeezed between the Indian Ocean and the Pacific Ocean. Southeast Asia one of the most populated regions in the world, an estimated regional population in 2013United Nations, Department of Economic and Social Affairs, Population Division was 618,793 thousand. The population of elevens countries in the region is given in Table 3.1 Their relative share in absolute number and percentage of population is given in Figure 3.2. Map 3.1 Location of Country in South East Asia Among the elevens countries, Indonesia contributed largest population in Southeast Asia region, It s contributed about 249,866thousand or 40.4 per cent, the second largest is Philippines98,394 thousand or 15.9 percent, third is Vietnam 91,680thousand or 14.8 percent, fourth is Thailand67,011 thousand or 10.8percent, fifth is Myanmar 53,259thousand or 8.6percent, sixth is Malaysia 29,717 thousand or 4.8percent while Cambodia contributed only 14,677thousand or 2.4 percent. The rest of the countries are very small in their population size. Table 3.1 Spatial distribution population size in Southeast Asia regional, 2013 Countries Population in thousand Population in Percent Southeast Asia 618, Brunei Darussalam Cambodia 14, Indonesia 249, Lao People s Democratic Republic 6, Malaysia 29, Myanmar 53, Philippines 98, Singapore 5, Thailand 67, Timor-Leste 1, Vietnam 91, Note: United Nations, Department of Economic and Social Affairs, Population Division (2013). World Population Prospects: The 2012 Revision, DVD and Cambodia from CIPS
28 Figure 3.2 Spatial distribution population size in Southeast Asia regional, 2013 Cambodia, 2.4 Lao People s Democratic Republic, 1.1 Singapore, 0.9 Timor-Leste, 0.2 Brunei Darussalam, 0.1 Myanmar, 8.6 Malaysia, 4.8 Thailand, 10.8 Vietnam, 14.8 Indonesia, 40.4 Philippines, Distribution of Population Population and the natural resources are the most important aspects of regional development. In this context distribution of Cambodia population is an important aspect. Cambodia is having firths smallest concentration of population in the Southeast Asia. In 2013, about 21.4 percent of the populations are living in urban areas as compared to 19.5 percent in Between 2008 and 2013, the national population increased 1.28 million, of which urban areas saw an increase of 0.52 million persons (accounting for 41.6 percent) while rural areas saw an increase of 0.75 million persons (accounting for 58.4 percent). Table 3.2Spatial distribution population size by natural regions Region Population Share in Percent Cambodia 11,437,656 13,395,682 14,676, Urban 2,095,074 2,614,027 3,146, Rural 9,342,582 10,781,655 11,530, Plain 5,878,305 6,547,953 7,219, Tonle Sap 3,505,448 4,356,705 4,719, Coastal 844, ,480 1,022, Plateau and Mountain 1,189,042 1,530,544 1,714,

29 The Plain region had a relatively high share of spatial population distribution 49.2 per cent as compared to 2008 when the figure was 48.9 percent, this can be explained by the fact that this region also contains six large province such as Kampong Cham, Kandal, Takeo, Prey Veng, Svay Rieng and the capital city of Phnom Penh. Tonle Sap is the second high shared of spatial population distribution 32.2 percent as compared to 2008 when the figure was 32.5percent accounted a marginal declined. This declined may be due to migration movement and other demographic factors. Plateau and mountain is a high mountain region with difficult transportation conditions and large concentrations of ethnic minority people shared only 11.7 percent of the nation s population. However, during 5 years period this region increased by 0.2 million or 0.3 percentage point. Coastal is the smallest region with the combination of four provinces share to the gulf includes Kampot, Koh Kong, Sihanouk and Kep. This region hared a small population distribution only 7 percent of population of the country. The population in this region had a marginal declined also during Figure 3.3 Distribution of Population (Per cent) by Natural Region of Cambodia, 2008 and Distribution of Population by Provinces Table 3.3and Figure 3.4shows the spatial distribution population size by provinces and sex Cambodia According to CIPS, 2013; there is tremendous variation in the aggregate population size across the province. It varies from 231,390 persons or 0.26 percent in Kep to 1,757,223 persons or 12 per cent in Kampong Cham. Since 2008, Kampong Cham province has the largest share of the population followed by Phnom Penh municipality, Prey Veng, Kandal, Battambang and Siem Reap. Approximately 12 percent of Cambodia s population lives in Phnom Penh.Kep province have the smallest population. Pailin has the second smallest share of the Cambodia population, constituting approximately 0.5 percent of the population. 15

30 Figure 3.4 Distribution of population by province Cambodia,
31 Table 3.3 Spatial distribution population size and sex by province Province Both Both Males Females Sexes Sexes Males Females Cambodia 13,395,682 6,516,054 6,879,628 14,676,591 7,121,508 7,555,083 Bantey Meanchey 677, , , , , ,965 Battambang 1,025, , ,823 1,121, , ,855 Kampong Cham 1,679, , ,330 1,757, , ,258 Kampong Chhnang 472, , , , , ,654 Kampong Speu 716, , , , , ,128 Kampong Thom 631, , , , , ,434 Kampot 585, , , , , ,849 Kandal 1,091, , ,737 1,115, , ,924 Koh Kong 117,481 59,327 58, ,263 61,319 60,944 Kratie 319, , , , , ,770 MondulKiri 61,107 31,372 29,735 72,680 37,098 35,582 Phnom Penh 1,501, , ,926 1,688, , ,900 PreahVihear 171,139 85,319 85, , , ,633 Prey Veng 947, , ,290 1,156, , ,946 Pursat 397, , , , , ,305 RatanakKiri 150,466 76,115 74, ,699 91,265 92,434 Siemreap 896, , , , , ,893 Preah Sihanouk 221, , , , , ,173 Stung Treng 111,671 55,634 56, ,791 62,149 60,641 SvayRieng 482, , , , , ,307 Takeo 844, , , , , ,568 OddarMeanchey 185,819 93,646 92, , , ,299 Kep 35,753 17,674 18,079 38,701 19,016 19,685 Pailin 70,486 36,340 34,146 65,795 32,859 32,936 17


32 Map 3.2 Spatial distribution population sizes by province2008 Map 3.3 Spatial distribution population sizes by province
33 3.7 Ranking of Population by Provinces Table 3.4 provides the population proportion and ranking by province of Cambodia according to CIPS Kampong Cham and Phnom Penh have maintained the first and second rank respectively since 2008 and Kep continues to be the last province in terms of population size. The change in population size of each province during would be analyzed in the main report with reference to fertility; mortality and migration are in fertility, mortality and migration chapters. Prey Veng have shift from rank number 5 in 2008 to rank number 3, Preah Vihear shift from rank number 18 in 2008 to rank number 17, Stung Treng from 21 to 20 and Mondul Kiri from 23 to 22 in 2013 while Kandal and Battambang fall from number 3 and 4 to rank 4 and number 5 respectively. Table 3.4 Spatial Distribution Population Ranking by Province Province Percentage of Population Ranking Kampong Cham Phnom Penh Prey Veng Kandal Battambang Siem Reap Takeo Kampong Speu BanteayMeanchey Kampong Thom Kampot SvayRieng Kampong Chhnang Pursat Kratie Preah Sihanouk PreahVihear OddarMeanchey RatanakKiri Stung Treng Koh Kong MondulKiri Pailin Kep
34 3.8 Spatial Distribution of Population Table 3.5 shows the number of provinces classified by population size. There are 23 provinces and 1municipality. Out of these 24political boundaries, the highest number is in the population size class 1,091,170 and above (47 percent) these figures were increased from 2 provinces with (24 per cent) in However there still remaining 2 provinces which are distributed over the lowest size classes of population less than 70,486with account less than1 percent of the population of Cambodia. However, these figures were decreased from 3 provinces in Table 3.5Spatial Distribution Province by Population Size, Cambodia Population Size Class Number of Province 2008 Number of Province 2013 Total Below 070, ,487 to 117, ,482 to 185, ,820 to 221, ,397 to 397, ,162 to 482, ,789 to 716, ,945 to 947, ,373 to 1,091, ,091,170 and More 2 5 Table 3.5 Spatial Distribution Province by Population Size, Cambodia Population Size 1,091,170 and More 947,373 to 1,091, ,945 to 947, ,789 to 716, ,162 to 482, ,397 to 397, ,820 to 221, ,482 to 185, ,487 to 117,481 Below 070, Number of Provinces Number of Province 2013 Number of Province
35 3.9 Population Density by Regions Population density is one of the important indices of population it s measure the concentration of population. It is refer to the number of persons per square kilometre. According to CIPS 2013, Cambodia s population density stead for 82 per square kilometre. It has increased by 7 points from the population density of 75 as per 2008 Census. However it continues to be much less than 126 for South East Asia. The urban population density of Cambodia 2013 is extremely higher than correspondence to rural. Table 3.6 Distribution of land area, population and population density by natural region, Region Area (%) Population (%) Population density (Persons/km2) Cambodia 181,035* Plain 25, Tonle Sap 67, Coastal 17, Plateau and Mountain 68, Table 3.6 and Figure 3.6present population density by residences for 2008 and Even within a region, population density varied substantially across region of Cambodia. In general, region with large land area were those with the lowest population density in contrast the region with small land area were those with the highest population density. The population density in Plain accounted highest 288 per square kilometre following 70 per square kilometre for Tonle Sap region and Plateau and Mountain have a lowest density that is 25 per square kilometre. Figure 3.6 Distribution of population density by natural region, Population Density (persons/km 2 ) Cambodia Plain Tonle Sap Coastal Plateau and Mountain Natural Region
36 3.10 Population Density by Provinces A thematic map of Cambodia Map 3.4and Table3.7is using shading colours to indicate distribution population density by province. This map also shows political boundaries, provincial borders, provincial names, country capital city, major river systems, and major lakes. Provinces with green colour represented to level of population density less than 20 persons per square kilometre. These shading green colour are mostly located in north part of the country includes Modol Kiri, Preah Vihear, Rattanak Kiri, Stung Treng and another province located in southwest is Koh Kong.The provinces with sky colour is represented to level of population density from per square kilometre, these are spreading in different part of the country which are includes Kratie, Pursat and Otdar Meanchey. The light yellow colour is the medium population density from per square kilometre which are spread in surrounding Tonle Sap Lake includes Kampong Chhnang, Kampong Thom, Siem Reap, Battambang and Pailin. The provinces with dark yellow colour represented to level of population density from per square kilometre, these provinces are mostly located in plain and coastal region such Kampong Cham, Svay Rieng, Kampot, Preah Sihanouk and another is located in neighbour country of Thailand which is Banteay Meanchey. The map also indicates the spatial pattern of development in regions of Cambodia, with high concentration distribution population density such Kandal, Prey Veng, Takeo and especially in Phnom Penh as seen in red and brown colour. Table3.7 Distribution of population density by province Cambodia 2013 Province Population Density Cambododia BanteayMeanchey Battambang Kampong Cham Kampong Chhnang Kampong Speu Kampong Thom Kampot Kandal Koh Kong Kratie MondulKiri Phnom Penh 1, PreahVihear Prey Veng Pursat RatanakKiri Siem Reap Preah Sihanouk Stung Treng SvayRieng Takeo OtdarMeanchey Kep Pailin

37 Figure 3.4 Distribution of population density by province Cambodia Population Concentration by Provinces Distribution and concentration differ from the location and area point of view. Distribution is known as their spatial spared of population in the region and concentration explains the actual location of the particular population in the region applying some statistical techniques. Here the study intended to find out by calculating the actual concentration of population in the provinces through applying location Loren curve called Gini index. The graph measure involves plotting cumulative percentages of population of provinces against the cumulative percentages of the area of the provinces. This has been done after arranging the provinces in the ascending order in terms of density and calculating the percentages of population (xi) and land area (yi) of each province. It is the deviation of the curve from the diagonal line which is the line of equal distribution. CI is the proportion of inequality in the distribution of population in relation to the area. An index of concentration equal to zero would indicate that each province of Cambodia contained a proportion of the country s total population equal to its proportion of the country s total land area. Conversely, an index of concentration equal to 100 would indicate that the entire population of Cambodia was contained in one province only. Another interpretation of the index of concentration (CI=0.42) is that 42 per cent of the Cambodia s population would have to be redistributed in different provinces to produce an exact correspondence between population size and land area. 23
38 The overall concentration found in the curve may also be measured in terms of the ratio of the area between the curve and the diagonal line, on the one hand, and the total area of the triangle formed by the two axes and the diagonal line, on the other, this is called Gini concentration ratio. The Gini concentration ratio works out 0.56 it indicates that 56 per cent of the area under the diagonal line is above the Lorenz curve and denotes a fairly medium degree of segregation or unequal distribution of population, as the Gini index varies between zero and 1. As per the location quotient index, the concentration of population in 2013, the high index value is found in the Phnom Penh municipality and Kandal province and respectively by followed by Takeo, Prey Veng, Svay Rieng, Kampong Cham and Preah Sihanouk. These are the minority provinces where the geographical condition is very low such as Mondul Kiri, Stung Treng, Koh Kong, Ratanak Kiri, Preah Vihear, Kratie, Pursat, Otdar Meanchey and Kampong Thom. Table 3.8 Computation of Index of Concentration and Gini Concentration Ratio for Provinces of Cambodia, 2013 Province Population 2013 Area in Km 2 Density per Km 2 Proportion Index Cumulative Production X i Y i X i /Y i X i Y i Xi-Yi X i Y i X i Y i+1 Y i X i+1 MondulKiri 72,680 14, Stung Treng 122,791 11, Koh Kong 122,263 10, RatanakKiri 183,699 10, PreahVihear 235,370 13, Kratie 344,195 11, Pursat 435,596 12, OtdarMeanchey 231,390 6, Kampong Thom 690,414 13, Pailin 65, Siem Reap 922,982 10, Kampong Chhnang 523,202 5, Battambang 1,121,019 11, Kampong Speu 755,465 7, BanteayMeanchey 729,569 6, Kep 38, Kampot 611,557 4, Preah Sihanouk 250,180 1, Kampong Cham 1,757,223 9, SvayRieng 578,380 2, Prey Veng 1,156,739 4, Takeo 923,373 3, Kandal 1,115,965 3, Phnom Penh 1,688, , Total 14,676, , Concentration Index 0.42 Gini Index
39 Figure 3.7 Lorenz Curve for Population Concentration in Cambodia, 2013 Gini concentration index indicates the spatial inequality in distribution population across the country. Table 3.8 and 3.9 shows that Gini concentration index had declined consistently over the years and indicates the low concentration of population in provinces with large population compare to the provinces with small size of population. Increasing the high annual growth in small provinces shared in spatial distribution population in large provinces. Table 3.9 Concentration Index (CI) and Gini Concentration Index (GCI) of Cambodia 1998, 2008 and 2013 Index Year Concentration Index (CI) Gini Concentration Index (GCI) Table 3.10 shows the distribution of population, land area shared and density level Cambodia, The unevenness in population distribution is also illustrated by the fact that nearly 12 percent of Cambodia s population is concentrated in a little over a quarter of its area (0.3 percent) of the total area of the country with a highest density concentration that is in Phnom Penh 2,468 persons per square kilometre. Likewise about 31.3 percent of the country accounts only for only 22 percent of its population. While only 5 percent of population shared big coverage areas of land in the country (24.8 percent with average 12 persons per square kilometre. All these indices show that there is a significant amount of inequality in the distribution of the population of Cambodia in relation to the area. 25
40 Table 3.10 Distribution of population and Area and density level Cambodia, 2013 Density Number of provinces Percentage share Population Area Average Density Total under and above ,468 26
41 Chapter 4 Distribution Population by Urban and Rural Residence 4.1 Concepts and Classification Urbanization is a global phenomenon transcending various physical, economic, culture, religious and social barriers. Over the years, the entire nations in the world have undergone this process at various levels. Some nations already reached their phase of transition, where as some nation are infancy stage and some in transition stage like Cambodia. Urbanization classification constitutes an important framework for collection and compilation of population in the country. The criterions defining of urban varies from country to country. The urban can be defined in many ways based on social, physical and economic aspects. In general, urban are defined based on two important criteria which are; 1. Statutory Administrative Aspects: The towns identified on the basic of statutory administration or recognised by degrees and laws. These may included all places in the headquarters of the province or districts. 2. Economic and Demographic Aspects: This criteria based on population size, density and percentage of workforce in non-agriculture sector. In Cambodia, special study and classification urban by NIS in both 2004 and 2008 have been used as guidance for measure of urban in this report. Consideration of all relevant aspects, field study and consultation with agencies concerned the study decided to apply the following criteria to every commune so as to treat it as urban: (a) Population density exceeding 200 per km² (b) Percentage of total employment in agriculture sector 50 percent and more (c) Total population of the commune exceeding 2,000. There are various methods to measure the level of urbanization such degree of urbanization, annual growth rate, tempo urbanization and Gini concentration index and Lorentz curve. The degree of urbanization or distribution population by urban and rural residence is common use for measure the spatial distribution of population by scholars and demographers. 4.2 Spatial Distribution of Urban Population in region Southeast Asia s level of urban is fairly low by the world standards. However, it has been gradually rising during the last decades, in 2011, roughly 45 percent of Southeast Asia s population living in urban residence. Whole Singapore absolutely urban, Brunei Darussalam and Malaysia are highly urban, while haft of Indonesia and Philippine lived in urban residence. Timor-Leste, Cambodia and Lao PDR are much low of urban in region. 27
42 Table 4.1 Spatial distribution percent of urban population in Southeast Asia regional, 2010 Countries Percent of urban Southeast Asia 44.7 World 52.1 Brunei Darussalam 76.0 Cambodia 21.4* Indonesia 50.7 Lao People s Democratic Republic 34.3 Malaysia 72.8 Myanmar 32.6 Philippines 48.8 Singapore Thailand 34.1 Timor-Leste 28.3 Vietnam 31.0 Note: United Nations, Department of Economic and Social Affairs, Population Division (2010). World Urbanization Prospects: The 2011 Revision, DVD and * Cambodia from CIPS 2013 Table 4.2and Table 4.3,gives the spatial distribution of population by regions and sexes both Cambodia General Population Census, 2008 and Cambodia Inter-Censal Population Survey, According to the definition the urban population was estimated to be 2.6 million (19.5 percent) in 2008 and 3.2 million (24.4 percent) in2013 that is increased almost 2 percentage point between the years Correspondingly the rural population of the country has risen from about 10.8 million counted in 2008 to about 11.5 million in Still the urbanization level in Cambodia is much less than that for Southeast Asia as a whole (45 percent). 4.3 Spatial Distribution of Urban Population Table 4.2 Population by urban-rural residence and sex, Cambodia Residence Population Both Sex Males Females Both Sex Males Females Total 13,395,682 6,516,054 6,879,628 14,676,591 7,121,508 7,555,083 Urban 2,614,027 1,255,570 1,358,457 3,146,212 1,527,479 1,618,734 Rural 10,781,655 5,260,484 5,521,171 11,530,378 5,594,029 5,936,349 The increase in the level of urbanization in Cambodia has been rather small (2 percentage points) during the haft decade. It may be of interest to know that according to the 1962 Census the urban population constituted 10.3 percent of the total population. At that time Phnom Penh, three other municipalities of Kaeb, Bokor and Sihanouk Ville and 14 urban centres in provinces were treated as urban and the rest of the country as rural. Table 4.3 Population by urban-rural residence and sex, Cambodia Natural Regions Population 2008 Population 2013 Total Male Female Total Male Female Cambodia Plain Tonle Sap Coastal Plateau and Mountain
43 Chapter 5 Population Growth 5.1 National Population Growth The term growth of population is used in its broadest connotation to cover change in population numbers inhabiting a territory during a specific period of time, irrespective of the fact whether the change is positive or negative. This change/ growth can be measured both in terms of absolute numbers and percentages. General Population Census of Cambodia 2008 accounted for million as compare to the extrapolate population of CIPS 2013 is million with this; the annual growth rate of population during works out to 1.83 per cent. The official population projections for Cambodia as of 1 July 2013, is million. By interpolation, as of 3 March 2013, the projected population would be in the order of million. Hence in terms of absolute figures the CIPS 2013 estimated population (14.68 million) is less than the projected population (14.89 million)by about 0.21 million or about 1.4 per cent. However, as was done during the projection exercise, this has to be viewed in the light of under enumeration in the 2008 Census which is officially estimated as 2.77 per cent from the Post Enumeration Survey (PES). Adjusting for this under enumeration in the 2008 Census, the base population in 2008 is given by million. Based on this population the growth rate of population as per CIPS 2013 during is calculated as 1.28 per cent. Another way of looking at the population growth rate is by comparing with the estimated population from CIPS 2004 (13.09 million). If this is done the annual growth rate during the nine years works out to 1.27 per cent. Considering all the aspects, the growth rate of population in Cambodia during may be the average of the three estimates (1.83 per cent, 1.28 per cent and 1.27 per cent), namely 1.46 per cent. The population growth rate at national level was projected as 1.54 per cent in 2013 which is slightly higher than 1.46 per cent arrived at as population growth rate during by the CIPS 2013 estimate. The relatively small difference between the projections and CIPS 2013 estimate may be accounted for by the fact that two different methodologies were adopted in projections and sample survey estimations. Projections are based on several assumptions pertaining to fertility, mortality and migration. Any sample survey is subject to sampling and non-sampling errors. Table 5.1 Population size and population growth by residences and natural region, and Regions Population Growth Rate Annual Growth Rate Cambodia 11,437,656 13,395,682 14,676, * Urban 2,095,074 2,614,027 3,146, Rural 9,342,582 10,781,655 11,530, Plain 5,878,305 6,547,953 7,219, Tonle Sap 3,505,448 4,356,705 4,719, Coastal 844, ,480 1,022, Plateau and Mountain 1,189,042 1,530,544 1,714,

44 5.2 Population Growth by Regions During the period , average annual population growth in urban areas was 3.7 percent /year, while in rural areas it was only 1.34 percent /year. Between 2008 and 2013, the national population increased 1.28 million persons, of which urban areas saw an increase of 0.52 million persons (accounting for percent) while rural areas saw an increase of 0.75 million persons (accounting for percent). The Plateau and Mountain registered highest average annual population growth rate as compared to other region may be due to flow of migration still continue to this areas. These figures are following by plain as the second highest growth and Tonle Sap is the third while coastal is the lowest growth. Compared to the average annual population growth rate all regions have increased except only Tonle Sap has declined. Figure 5.1 Population growth by region of Cambodia, and Population Growth by Provinces Compared to the previous five-year period , the rate of population growth has increased in all provinces and municipality except only Pailin had seen their population declined between, The largest increases in population growth rate were found in PreahVihear, Otdar Meancheay, Rattanak Kiri and Modol Kiri this may due to high fertility rate, absorption of migration from other provinces for available new land settlement, economic opportunities and new development took place in these areas. Of all provinces, Preah Vihear, at 6.37 percent, has experienced the largest population growth between 2008 and As in the previous two census periods (1998 to 2008), Pailin posted the 30
45 highest population growth at percent, almost ten times to the national average (1.54 percent).in contrast, compared to previous five-year period annual population growth rate Pailin has shown the negative growth rate (-1.38 percent). Compared between and , there are sixteen provinces has declined in annual population growth rate these included Banteay Meanchey, Battambang, Kampong Speu, Kampong Thom, Kampot, Kandal, Kratie, Mondul Kiri, Phnom Penh, Ratanak Kiri, Siem Reap, Preah Sihanouk, Stung Treng, Otdar Meanchey, Kep and Pailin. For other remaining eight provinces the annual population growth rate continued increase slightly compared to Table 5.2 Distribution of Population (Percent) by Province of Cambodia, and Cambodia/Province Population Annual Growth Rate Cambodia 11,437,656 13,395,682 14,676, * Banteay Meanchey 577, , , Battambang 793,129 1,025,174 1,121, Kampong Cham 1,608,914 1,679,992 1,757, Kampong Chhnang 417, , , Kampong Speu 598, , , Kampong Thom 569, , , Kampot 528, , , Kandal 1,075,125 1,091,170 1,115, Koh Kong 116, , , Kratie 263, , , MondulKiri 32,407 61,107 72, Phnom Penh 999,804 1,501,725 1,688, PreahVihear 119, , , Prey Veng 926, ,372 1,156, Pursat 360, , , RatanakKiri 94, , , Siem Reap 696, , , Preah Sihanouk 171, , , Stung Treng 81, , , SvayRieng 478, , , Takeo 790, , , Otdar Meanchey 68, , , Kep 28,660 35,753 38, Pailin 22,906 70,486 65,


46 5.4 Demographic Transition in Cambodia Demographic Transition is the results of combination of declines in mortality in the first and declines in fertility in the second. There are changes in large a function of decreases in mortality in the lat few decades, in the first instance, and, later, of declines in fertility. Reduced mortality, child mortality especially, which results from the adoption of improved agricultural production techniques and health care practices, among other things, determine to a great extent the significant population growth that takes place in the early stages of the transition. Children and adolescents make up a relatively large share of the population at this time. The age and sex structure of a population affects the level of social, economic and political structure of any population. The age and sex structure are determined by the past and current trends in fertility, mortality and migration. The shifts in the population age structure have had far reaching consequences on a country s work force, economic prospects, public and personal budgets, security risks, cultural organizations and family structures. Figure 5.2 Demographic Transition Pattern experiences world In the case of Cambodia it is not possible to study the trend in population growth over the past several decades due to lack of data and historical reasons. It can be examined only with reference to the two censuses in 1998 and 2008, Cambodia Inter-censal Population Survey 2004 (CIPS2004), Cambodia Demographic Health Survey (CDHS) 2000, 2005, 2010 and Cambodia Inter-censal Population Survey 2013 (CIPS 2013). The total fertility rate in Cambodia has declined from more than 6 children per woman in the early 1980s to 4.0 in 1998,3.4 in 2004, 3.1 in 2008, 3 in 2010 and around2.8 in 2013.After a period of erratic variations with a high level range, infant and child mortality have also experienced substantial decline. According to census 1998 the infant mortality rate accounted for 93 deaths per 1,000 births declined to 66 in It has further declined to around 60 in 2006 according to the estimate made on the basis of the 2008 census results, then drop to 45 in 2010 and around 33 in The continued decline in the rate of population growth in Cambodia in the most recent years is indicative of the fact that its population is gradually moving towards the end of the third or late expanding change (birth and death rates below 30 and 15 respectively) of demographic transition. 32
47 Figure 5.3 Demographic Transition in Cambodia using data from UNESCAP Rate Crude Birth Rate Crude Death Rate Note: United Nations, Department of Economic and Social Affairs, Population Division (2010). World Urbanization Prospects: The 2010 Revision, DVD 5.5 Population s interaction Big provinces and more development in Cambodia were able to attract the most migrants from rural residence compared to smaller province. Urban population growth or urbanization is expanding rapidly in Cambodia. The number of province with population of 1,091,170 and above in Cambodia has increased from 2 in 2008 to 8 in With an average of 3.7 per cent increase each year saw rapid development of urbanization process in Cambodia. This phenomenon has a direct impact on the spatial distribution, density and concentration of urban centres in Cambodia. This study will attempt to identify the number of urban centres, concentration as well as spatial distribution of urban centres growth in Cambodia. Internal migration is now recognized as an important factor of spatial distribution of population and influencing social and economic development, especially in speed developing of the country. According tocips2013 about4,134,015 persons were migrants based on place of last residence, which constitute about 28.9 percent of the total population of the country. This figure indicates an increase of around 26.5 percent from census 2008 which recorded 3,538,130migrants. Out of total internal migrant about 728,640 of population had moving across Province of Cambodia. Although in-migration and out-migration are enough to measure the amount of net migration, the direction to/from which the migrants moved can be used to explain the spatial distribution of population within the country. From the largest four or five magnitudes pull in migrant sfactors from other provinces, the majority of interaction migrants were founded in Takeo, Pursat, Kandal, Kampong Cham, Prey Venga nd Kampot (please see Table 5.4). Likewise, pull in migration, push out migrant s factors to other province were founded in Pailin, Oddar Meanchey, Sihanouk, Phnom Penh, Ratanak Kiri and Preah Vihear. 33
48 Table 5.4Numbers of in and out and net internal migration all duration by province of Cambodia 2013 Province Population Migrant Net Migrant Percent In Out In Out In Out Cambodia 14,676,592 1,785,171 1,785, , , BanteayMeanchey 729,569 76,469 77, Battambang 1,121, , ,276 51, Kampong Cham 1,757, ,627 92, , Kampong Chhnang 523,202 44,369 25,116 19, KampongSpeu 755,465 69,656 59,671 9, Kampong Thom 690,414 84,012 32,676 51, Kampot 611, ,504 51,911 48, Kandal 1,115, , , , Koh Kong 122,263 15,518 29,330 13, Kratie 344,195 41,122 37,340 3, MondulKiri 72,680 2,190 13,085 10, Phnom Penh 1,688, , , , PreahVihear 235,370 6,166 49,371 43, Prey Veng 1,156, ,758 54,288 91, Pursat 435,596 83,459 25,324 58, RatanakKiri 183,699 2,642 36,660 34, Siemreap 922,982 57,475 67,301 9, Sihanouk 250,180 19,354 76,713 57, Stung Treng 122,791 5,829 24,030 18, SvayRieng 578,380 62,351 72,221 9, Takeo 923, ,115 43, , OddarMeanchey 231,390 11,572 70,347 58, Kep 38,701 1,884 7,512 5, Pailin 65,795 4,919 37,836 32,
49 Chapter 6 Summary and Conclusions Concepts and Methodologies There are several methods have been used for describing spatial distribution of population. The simplest of spatial distribution of population is distribution of population by percent according to geographical areas. Another methodology usually adopted is to list the geographical areas of a given class into rank order which enables comparison of ranking from census to census. This provides changes in population trends over time. Population density also have been used to measure the spatial distribution of population is it refer to population per square kilometer (Km 2 ) after excluding area occupied by water. The spatial spared of population concentration actual location of the particular population in the region applying some statistical techniques. Here the study intended to find out by calculating the actual concentration of population in the provinces through applying location Loren curve called Gini index. Factors Affected Population Distribution The spatial distribution of population might influent from economic, social and physical reasons lead people migrate, and they can usually be classified into push and pull factors. Push factors are those associated with the residence of origin, while pull factors are those that are associated with the residence of destination. Size and Distribution of Population Cambodia s populations in March 2013 were14.68 million compared to million in In absolute terms, Cambodia population has increased by 1.28 million during haft decade The average annual exponential growth rate in households was 1.83 percent. Considering all the aspects, the growth rate of population in Cambodia during may be the average of the three estimates (1.83 per cent, 1.28 per cent and 1.27 per cent) work out 1.46 per cent. Among the elevens countries, Indonesia contributed largest population in Southeast Asia region, It s contributed about 249,866 thousand or 40.4 per cent while Cambodia contributed only 14,677 thousand or 2.4 percent. The urban population was estimated to be 2.61 million (19.5 percent) in 2008 and 3.15 million (24.4 percent) in 2013 that is increased almost 2 percentage point between the years Plain region had a relatively high share of spatial population distribution 49.2 percent as compared to 2008 when the figure was 48.9 percent, this can be explained by the fact that this region also contains six large province and capital city such as Kampong Cham, Kandal, Takeo, Prey Veng, Svay Rieng and Phnom Penh. Tonle Sap is the second largest shared of spatial population distribution 32.2 percent as compared to 2008 when the figure was 32.5percent The evidence available suggests that these factors have had an impact, as the trend for higher demographic dynamism in the large province is on the wane. There is tremendous variation in the aggregate population size across the province of Cambodia. It varies from 231,390 persons or 0.26 percent in Kep to 1,757,223 persons or 12 percent in Kampong Cham. Kampong Cham province had the largest share of the population followed by Phnom Penh municipality, Prey Veng, Kandal, Battambang and Siem Reap. 35
50 Cambodia s population density accounted for 82 per square kilometre in It has increased by 7 points from the population density of 75 in However it continues to be much less than 126 for South East Asia. The urban population density of Cambodia 2013 is extremely higher than correspondence to rural. The population density in Plain accounted highest 288 per square kilometre following 62 per square kilometre for Tonle Sap region and Plateau and Mountain have a lowest density that is 25 per square kilometre. The spatial pattern of development in regions of Cambodia, with high concentration distribution population density such Kandal, Prey Veng, Takeo and especially in Phnom Penh while population density less than 20 persons per square kilometre were mostly located in north part of the country which are includes Modol Kiri, Preah Vihear, Rattanak Kiri, Stung Treng and another province located in southwest is Koh Kong. The index of concentration shows that 42 per cent of the Cambodia s population would have to be redistributed in different provinces to produce an exact correspondence between population size and land area. The Gini concentration ratio works out 0.56 it indicates that 56 per cent of the area under the diagonal line is above the Lorenz curve and denotes a fairly degree of segregation or unequal distribution of population. As per the location quotient index, the concentration of population in 2013, the high index value is found in the Phnom Penh province and Kandal province and respectively by followed by Takeo, Prey Veng, Svay Rieng, Kampong Cham and Preah Sihanouk. These are the minority provinces where the geographical condition is very low such as Mondul Kiri, Stung Treng, Koh Kong, Ratanak Kiri, Preah Vihear, Kratie, Pursat, Otdar Meanchey and Kampong Thom. Concentration index had declines across different years consistently over the years and vindicates the low concentration of population in provinces with large population compare to the provinces with small size of population. Increasing the high annual growth in small provinces shared in spatial distribution population in large provinces. Population Growth The annual growth rate works out to 1.83 per cent during The actual growth rate during would be in the order of 1.46 per cent which is only marginally less than the projected rate of 1.54 per cent. The annual growth rate of the population of Cambodia is higher than that of Southeast Asia as a whole (1.1 per cent). The majority relates to the process of urbanization, which has remained a driving force of movement and spatial distribution of population. The rate of urbanization or the average annual rate of increased in the urban percentage. During the period , average annual population growth in urban areas was 3.7 percent /year, while in rural areas it was only 1.34 percent /year. Between 2008 and 2013, the national population increased 1.28 million persons, of which urban areas saw an increase of 0.52 million persons (accounting for percent) while rural areas saw an increase of 0.75 million persons (accounting for percent). The Plateau and Mountain registered highest average annual population growth rate as compared to other region may be due to flow of migration still continue to this areas. These figures are following by plain as the second highest growth and Tonle Sap is the third while coastal is the lowest growth. Compared to the average annual population growth rate all regions have increased except only Tonle Sap has declined. 36
51 The rate of population growth has increased in all provinces and municipality except Pailin had seen their population declined between, The largest increases in population growth rate were in Preah Vihear, Otda Meancheay, Rattanak Kiri and Modol Kiri this may due to high fertility rate, absorption of migration from other provinces for available new land settlement, economic opportunities and new development took place in these areas. Of all provinces Preah Vihear, at 6.37 percent, has experienced the largest population growth between 2008 and As in the previous two census periods (1998 to 2008), Pailin posted the highest population growth at percent, almost ten times to the national average (1.54 percent).in contrast, compared to previous five-year period annual population growth rate Pailin has the negative growth rate (-1.38 percent). Compared between and , there are sixteen provinces has declined in annual population growth rate these included Banteay Meanchey, Battambang, Kampong Speu, Kampong Thom, Kampot, Kandal, Kratie, Mondul Kiri, Phnom Penh, Ratanak Kiri, Siem Reap, Preah Sihanouk, Stung Treng, Otdar Meanchey, Kep and Pailin. For other remaining eight provinces the annual population growth rate continued increase slightly compared to
52 Glossary Total population sizes Total population is number of usual residents at time-point of 0 hour 3 rd March A person is considered as a usual resident of a household if he/she has actually lived in that household for 6 months or more by the time-point of the survey enumeration. Average annual growth rate Average annual growth rate of population is expressed as a percentage at which a population is increasing or decreasing on average in a year for the period of 5 years between censuses 2008 and intercensal population survey, Household Household comprises either one person living alone or a group of people living in the same dwelling and sharing meals together. For households with 2 persons or over, its members may or may not share a common budget; or be related by blood or not; or in combination of both. Household head is the representative of the household recognized by all household members. Population change Is measured as the difference in population size between two points of time, Can be expressed in terms of absolute change, percentage, average annual absolute change, geometric or exponential growth rate and Can refer to changes in size, distribution, or composition, or to any combination of the three Measures of population change: P t = population at later date P 0 = population at the earlier data y= number of years between P 0 and P t Absolute change = P t P o Percent change = [(P t P 0 )/P 0 ]*100 Annual Arithmetic Growth Rate R a = [(P t /P 0 ) 1]/y Annual Geometric Growth Rate R g = (P t /P 0 ) (1/y) 1 Annual Exponential Growth Rate R e = [ln(p l /P b )]/y 38
53 Fertility Fertility is defined as the childbearing performance of a woman or group of women measured in terms of the actual number of children born. Total Fertility Rate (TFR) The total fertility rate is the number of children which a woman of hypothetical cohort would bear during her life time if she were to bear children throughout her life at the rates specified by the schedule of age specific fertility rates for the particular year and if none of them dies before crossing the age of reproduction. Therefore Total fertility rate is the number of births a woman would have if she experienced a given set of age specific birth rates throughout her reproductive span. It is the sum of agespecific fertility rates. Age-Specific Fertility Rate The number of births to women of a given age group per 1,000 women in that age group Crude Birth Rate (CBR) It is the number of live births in a given year per 1,000 populations. Crude Death Rate It is the number of deaths in a given year per 1,000 populations. Infant Mortality Rate Is the probability of infant death per 1000 live births before reach age one year or the number of deaths of infants under age one year per 1,000 live births in a given years. Under Five Mortality Rate The number of deaths of children age under-five s per 1,000 children age under-five s in a given year. Maternal Mortality Ratio Maternal mortality ratio is the number of women who die as a result of complications of childbearing or pregnancy per 100,000 live births in a given year. Migration This is the process of changing residence from one geographical location to another. In the 2008 Census it meant shifting residence by the person enumerated from another village or country (which was his/her previous residence) to the village in which he/she was enumerated. Lifetime Migration It is the migration status of persons as determined by comparing the place of birth with place of residence. In-migration rate In-migration rate indicates the number of in-migrants from other territorial units arriving in the territorial unit during enumeration period express as percentage at that destination. Out-migration rate Out-migration rate indicates the number of out-migrants departing from a territorial unit during an observed period enumeration period express as percentage in that territory. 39
54 Population Density Population density is the average number of persons residing in a territory, divided by the area of that territory in square kilometres. Sex ratio Sex ratio is expressed as the number of males for every 100 females of population. Sex ratio at birth Sex ratio at birth is expressed as the number of male births for every 100 female births among total births in 12 months prior to the census. Urban Urban areas are based on the criteria adopted in the Reclassification of Urban Areas in Cambodia (November 2011). In Cambodia, special study and classification urban by NIS in both 2004 and 2008 have been used as guidance for measure of urban in this report. Consideration of all relevant aspects, field study and consultation with agencies concerned the study decided to apply the following criteria to every commune so as to treat it as urban: (a) Population density exceeding 200 per km² (b) Percentage of total employment in agriculture sector 50 percent and more (c) Total population of the commune exceeding 2,000. Rural Areas other than urban are treated as Rural. 40
55 APPENDIX
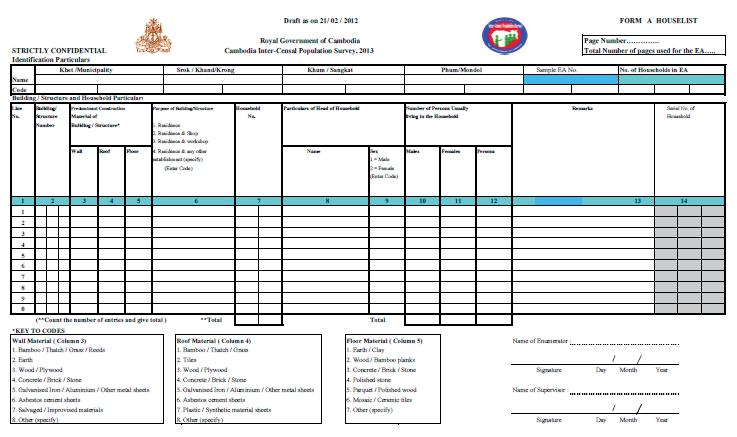
56 42
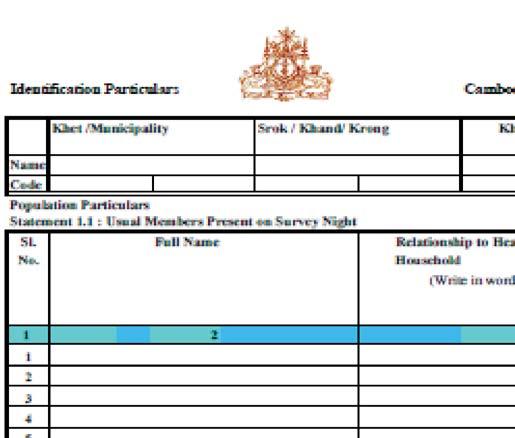


57 43
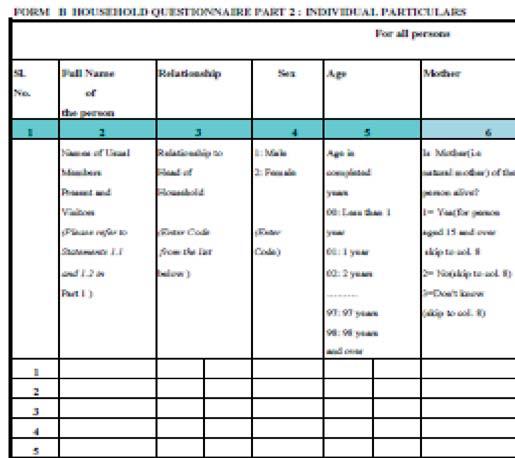


58 44
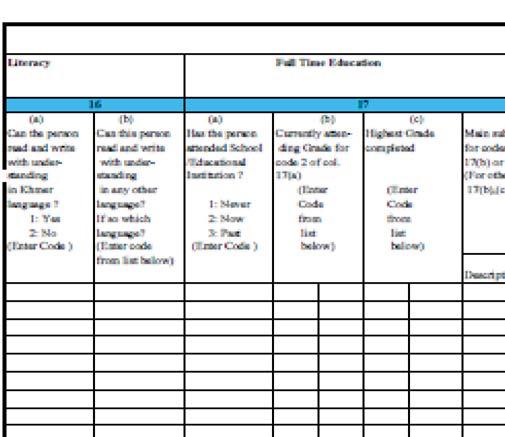


59 45
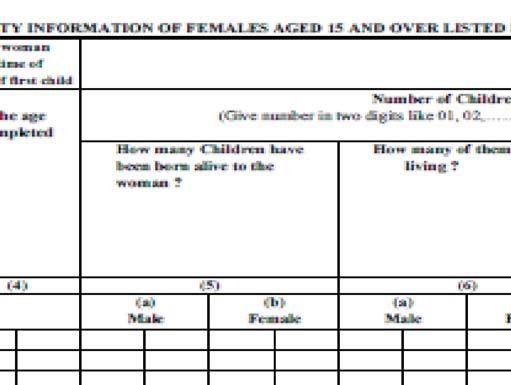


60 46
61 47


62 48
The CDB-based Poverty and Select CMDGs Maps and Charts
 An unofficial research report of the Ministry of Planning with support from the United Nations Development Programme, Cambodia. The publication contains findings of the Commune Database analysis and is
General Population Census of Cambodia 2008
 KINGDOM OF CAMBODIA Nation- Religion- King General Population Census of Cambodia 2008 Provisional Population Totals National Institute of Statistics, Ministry of Planning Phnom Penh, Cambodia Funded by:
CAMBODIA INTER-CENSAL POPULATION SURVEY 2013
 KINGDOM OF CAMBODIA Nation Religion King CAMBODIA INTER-CENSAL POPULATION SURVEY 2013 Analysis of CIPS Results Report 7 Literacy and Educational Attainment National Institute of Statistics, Ministry of
CHAPTER 4 ECONOMIC ACTIVITY OF CHILD AND YOUTH
 CHAPTER 4 ECONOMIC ACTIVITY OF CHILD AND YOUTH 4.1 DEFINITION OF CHILD AND YOUTH LABOUR Child labour is recognized as an issue to be eliminated in the world. Children s labour participation reduces their
Survey of Cambodian Public Opinion. International Republican Institute November 30 December 25, 2011
 Survey of Cambodian Public Opinion International Republican Institute November 30 December 25, 2011 1 Detailed Methodology Face-to-face interviews were conducted November 30 December 25, 2011, by the Center
Chapter 2 Spatial Distribution and Density of Population
 2.1 The Concept of Spatial Distribution Chapter 2 Spatial Distribution and Density of Population One of the major results of a population census is the insight it provides into the patterns of population
Chapter 8 Migration. 8.1 Definition of Migration
 Chapter 8 Migration 8.1 Definition of Migration Migration is defined as the process of changing residence from one geographical location to another. In combination with fertility and mortality, migration
International Republican Institute Survey of Cambodian Public Opinion. October 28 November 10, 2013
 International Republican Institute Survey of Cambodian Public Opinion October 28 November 10, 2013 Methodology Face-to-face interviews were conducted October 28 November 10, 2013 by the Center for Advanced
MICRO-LEVEL ESTIMATION OF THE PREVALENCE OF STUNTING AND UNDERWEIGHT AMONG CHILDREN IN CAMBODIA
 MICRO-LEVEL ESTIMATION OF THE PREVALENCE OF STUNTING AND UNDERWEIGHT AMONG CHILDREN IN CAMBODIA Ministry of Health, Royal Government of Cambodia United Nations World Food Programme MEASURE DHS+ / ORL Macro
Cambodia: Atlas of Health Indicators
 Cambodia: Atlas of Health Indicators ORC Macro Calverton, Maryland USA September 2004 Prepared by Melissa Neuman, ORC Macro Produced in collaboration with the Ministry of Health, Cambodia The 2000 Cambodia
Women and Migration in Cambodia report
 i A CRUMP Series Report Women and Migration in Cambodia Emily Treleaven (University of California, San Francisco) They Kheam (National Institute of Statistics, Ministry of Planning) This report presents
 i 1 2 3 3 3 4 4 5 5 6 7 7 7 7 8 8 9 10 10 11 12 12 12 12 13 20 20 1 2 INTRODUCTION The results of the Inter-censual Population Survey 2013 (CIPS 2013) and Cambodia Demographic and Health Survey 2014
HOUSEHOLD SURVEY FOR THE AFRICAN MIGRANT PROJECT: UGANDA
 HOUSEHOLD SURVEY FOR THE AFRICAN MIGRANT PROJECT: UGANDA 1. Introduction Final Survey Methodological Report In October 2009, the World Bank contracted Makerere Statistical Consult Limited to undertake
Contents. Acknowledgements...xii Leading facts and indicators...xiv Acronyms and abbreviations...xvi Map: Pacific region, Marshall Islands...
 Contents Acknowledgements...xii Leading facts and indicators...xiv Acronyms and abbreviations...xvi Map: Pacific region, Marshall Islands... xii CHAPTER 1: CENSUS ORGANIZATION AND OPERATIONS...1 CHAPTER
Kingdom of Cambodia Nation Religion King SENATE ELECTION
 Kingdom of Cambodia Nation Religion King LAW ON SENATE ELECTION Royal Kram We Majesty Preah Bat Samdech Preah Borom Neat Norodom Sihamony Samean Phoum Chati Sasna Rakhata Katiya Khemera Rath Reas Budthindreatharea
THE ATTACHED DOCUMENT I. COOPERATION BETWEEN JICA AND THE ROYAL GOVERNMENT OF CAMBODIA
 RECORD OF DISCUSSIONS BETWEEN JAPAN INTERNATIONAL COOPERATION AGENCY AND AUTHORITIES CONCERNED OF THE ROYAL GOVERNMENT OF CAMBODIA ON JAPANESE TECHNICAL COOPERATION FOR THE PROJECT ON IMPROVING OFFICIAL
Abbreviations 2. List of Graphs, Maps, and Tables Demographic trends Marital and fertility trends 11
 CONTENTS Abbreviations 2 List of Graphs, Maps, and Tables 3 Introduction 5 1. Demographic trends 7 2. Marital and fertility trends 11 3. Literacy, education and training 20 4. Migration 25 5. Labour force
The Cambodian League for the Promotion and Defense of Human Rights. and Its Human Rights Education Program
 The Cambodian League for the Promotion and Defense of Human Rights and Its Human Rights Education Program VANN SOPHATH The Cambodian League for the Promotion and Defense of Human Rights (LICADHO) is a
PRODUCED BY JANUARY 2013
 PRODUCED BY JANUARY 2013 Contents Forward... 1 I. PARTICIPATION AND DEMOCRATIC GOVERNANCE... 2 I.1 Purpose of Survey... 2 I.2 Survey Limitation/Lesson Learned... 2 I.3 Summary/Principle Findings... 4 II.
HOUSEHOLD LEVEL WELFARE IMPACTS
 CHAPTER 4 HOUSEHOLD LEVEL WELFARE IMPACTS The household level analysis of Cambodia uses the national household dataset, the Cambodia Socio Economic Survey (CSES) 1 of 2004. The CSES 2004 survey covers
The Population of Malaysia. Second Edition
 The Population of Malaysia Second Edition The Institute of Southeast Asian Studies (ISEAS) was established as an autonomous organization in 1968. It is a regional centre dedicated to the study of socio-political,
ANALYTICAL REPORT AT NATIONAL LEVEL
 TRANSITIONAL GOVERNMENT OF ETHIOPIA OFFICE OF THE POPULATION AND HOUSING CENSUS COMMISSION THE 1984 POPULATION AND HOUSING CENSUS OF ETHIOPIA ANALYTICAL REPORT AT NATIONAL LEVEL ADDIS ABABA DECEMBER 1991
PROJECTING THE LABOUR SUPPLY TO 2024
 PROJECTING THE LABOUR SUPPLY TO 2024 Charles Simkins Helen Suzman Professor of Political Economy School of Economic and Business Sciences University of the Witwatersrand May 2008 centre for poverty employment
CHAPTER A-10 ROAD NETWORK DEVELOPMENT PLAN
 CHAPTER A-10 ROAD NETWORK DEVELOPMENT PLAN 10.1 Road Development Principle As identified in the existing road condition survey, road network system in Cambodia has sufficient coverage from the perspectives
The Sudan Consortium African and International Civil Society Action for Sudan. Sudan Public Opinion Poll Khartoum State
 The Sudan Consortium African and International Civil Society Action for Sudan Sudan Public Opinion Poll Khartoum State April 2015 1 Table of Contents 1. Introduction... 3 1.1 Background... 3 1.2 Sample
CONTENTS INTRODUCTION ORIGIN AND REGIONAL SETTING DISTRIBUTION AND GROWTH OF POPULATION SOCIAL COMPOSITION OF POPULATION 46 53
 CONTENTS CHAPTER PAGE NOs. INTRODUCTION 1 8 1 ORIGIN AND REGIONAL SETTING 9 19 2 DISTRIBUTION AND GROWTH OF POPULATION 20 44 3 SOCIAL COMPOSITION OF POPULATION 46 53 4 SEX COMPOSITION OF POPULATION 54
HOUSEHOLD POPULATION AND HOUSING CHARACTERISTICS
 HOUSEHOLD POPULATION AND HOUSING CHARACTERISTICS 2 This chapter provides a summary of the socioeconomic characteristics of households and respondents surveyed, including age, sex, place of residence, educational
Kingdom of Cambodia Study for Poverty Profiles in the Asian Region. Final Report
 Kingdom of Cambodia Study for Poverty Profiles in the Asian Region Final Report August 2010 JAPAN INTERNATIONAL COOPERATION AGENCY OPMAC Corporation Poverty Indicator Basic data Region (*) Country Year
Data base on child labour in India: an assessment with respect to nature of data, period and uses
 Public Disclosure Authorized Public Disclosure Authorized Public Disclosure Authorized Public Disclosure Authorized Understanding Children s Work Project Working Paper Series, June 2001 1. 43860 Data base
Otdar Mean Chey Stueng Traeng. Kampong Thum. Kampong Chhnang Kampong Cham. Kandal. Sv ay Rieng. Takaev
 Kingdom of Cambodia A Poverty Profile of Cambodia 2004 Otdar Mean Chey Stueng Traeng Banteay Mean Chey Preah Vihear Siem Reab Rotanak Kiri Bat Dambang Krong Pailin Kampong Thum Kracheh Mondol Kiri Pousat
Chapter 2 Major Findings
 The 2010 Population and Housing Census (Northeastern Region) Chapter 2 Major Findings General Infomation The Northeastern Region has an area of 168,855.4 square kilometers, It has common boundary with
National Baseline on Civil Registration and Vital Statistics in Cambodia
 National Baseline on Civil Registration and Vital Statistics in Cambodia Implemented by the General Department of Identification / Ministry of Interior October 2016-November 2016 Supported by UNICEF Technical
Comparison of Population Data between Census and Admin Records in Cambodia
 JICA Project on Improving Official Statistics Phase III Comparison of Population Data between Census and Admin Records in Cambodia F. Nishi Statistical Research and Training Institute, Ministry of Internal
Population, Health, and Human Well-Being-- Portugal
 Population, Health, and Human Well-Being-- Portugal EarthTrends Country Profiles Demographic and Health Indicators Portugal Europe World Total Population (in thousands of people) 1950 8,405 548,206 2,519,495
Household Income and Expenditure Survey Methodology 2013 Workers Camps
 Household Income and Expenditure Survey Methodology 2013 Workers Camps 1 Content Introduction 3 Target community: 4 Survey geographical coverage: 4 Sampling method: 4 Survey variables: 5 Survey Questionnaires:
TRAFFIC SURVEY AND ANALYSIS
 CHAPTER A-6 TRAFFIC SURVEY AND ANALYSIS 6.1 Traffic Survey Series of traffic surveys were conducted in nationwide by using the local consultant in order to grasp the current road traffic condition in Cambodia.
Concept note. The workshop will take place at United Nations Conference Centre in Bangkok, Thailand, from 31 January to 3 February 2017.
 Regional workshop on strengthening the collection and use of international migration data in the context of the 2030 Agenda for Sustainable Development Introduction Concept note The United Nations Department
DRIVERS OF DEMOGRAPHIC CHANGE AND HOW THEY AFFECT THE PROVISION OF EDUCATION
 DRIVERS OF DEMOGRAPHIC CHANGE AND HOW THEY AFFECT THE PROVISION OF EDUCATION This paper provides an overview of the different demographic drivers that determine population trends. It explains how the demographic
Impact of Migration on Older Age Parents
 Impact of Migration on Older Age Parents: Preliminary Findings from Two Communes of Battambang Province, Cambodia Presentation by Khuon Chandore at the Cambodia Development Research Forum (CDRF) Symposium,
People. Population size and growth. Components of population change
 The social report monitors outcomes for the New Zealand population. This section contains background information on the size and characteristics of the population to provide a context for the indicators
TABLE OF CONTENTS. Page iii
 TABLE OF CONTENTS ACKNOWLEDGEMENTS... ii LIST OF TABLES AND CHARTS... v LIST OF ABBREVIATIONS... vii ACKNOWLEDGEMENT... viii EXECUTIVE SUMMARY... viii PART ONE: INTRODUCTION... 1 1.1 Background... 1 1.2
Sampling Characteristics and Methodology
 Sampling Characteristics and Methodology The unit of observation for the survey is the household. Interviews were conducted with an equal number of women and men, each representing their households. Additional
CAMBODIA: FLOODS. The context. appeal no. 22/2000 situation report no. 1; Revised budget period covered: September 2000
 CAMBODIA: FLOODS 20 September 2000 appeal no. 22/2000 situation report no. ; Revised budget period covered: 3-9 September 2000 With increasing numbers of people affected by the floods in Cambodia, the
Achieving Cambodia s Millennium
 Kingdom of Cambodia Nation Religion King Royal Government of Cambodia Achieving Cambodia s Millennium Development Goals Update 2010 Prepared by Ministry of Planning foreword i Table of Contents foreword...i
NGO Joint Statistics on CSE Trafficking
 2 ACKNOWLEDGEMENTS It is with great appreciation that ECPAT Cambodia thanks its donor, ANESVAD, for its ongoing support of the Joint Statistics Database Project on Trafficking and Rape. The funding for
Human Trafficking in Cambodia: Using Spatial Statistics to Analyze Population Vulnerability in Victim Source Locations
 Human Trafficking in Cambodia: Using Spatial Statistics to Analyze Population Vulnerability in Victim Source Locations Vanessa M. Damato, MGIS Student Penn State University Advisors: Dr. Melina T. Czymoniewicz-Klippel
Policy Brief on Migration and Urbanization
 The Republic of the Union of Myanmar 2014 Myanmar Population and Housing Census Policy Brief on Migration and Urbanization Department of Population Ministry of Labour, Immigration and Population With technical
Statistical Yearbook. for Asia and the Pacific
 Statistical Yearbook for Asia and the Pacific 2015 Statistical Yearbook for Asia and the Pacific 2015 Sustainable Development Goal 1 End poverty in all its forms everywhere 1.1 Poverty trends...1 1.2 Data
Visualizing. Rights CE SR. Cambodia. Center for Economic and Social Rights fact sheet no. 7
 Center for Economic and Social Rights fact sheet no. 7 in light of Cambodia s appearance before both the Universal Periodic Review of the UN Human Rights Council in 29 and the UN Committee on Economic,
Internal Migration to the Gauteng Province
 Internal Migration to the Gauteng Province DPRU Policy Brief Series Development Policy Research Unit University of Cape Town Upper Campus February 2005 ISBN 1-920055-06-1 Copyright University of Cape Town
Report on Voter Registration Audit (VRA) in Cambodia
 in Cambodia") Report on Voter Registration Audit (VRA) in Cambodia September 2007 COMFREL I. FORWARD REPORT ON VOTER REGISTRATION AUDIT IN CAMBODIA Table of Contents II. III. IV. EXECUTIVE SUMMARY BACKGROUND - History
Report on Voter Registration Audit (VRA) in Cambodia September 2007 COMFREL I. FORWARD REPORT ON VOTER REGISTRATION AUDIT IN CAMBODIA Table of Contents II. III. IV. EXECUTIVE SUMMARY BACKGROUND - History
Impact of Migration on Older Age Parents
 Impact of Migration on Older Age Parents A Case Study of Two Communes in Battambang Province, Cambodia Analyzing Development Issues (ADI) Team and Research Participants in collaboration with the Institute
IPP278 v.1 rev. Cambodia - Second Health Sector Support Project (HSSP2) Indigenous Peoples Planning Framework (IPPF)
 Indigenous Peoples Planning Framework (IPPF)") Public Disclosure Authorized Public Disclosure Authorized Public Disclosure Authorized Public Disclosure Authorized IPP278 v.1 rev. Cambodia - Second Health Sector Support Project (HSSP2) Indigenous Peoples
Public Disclosure Authorized Public Disclosure Authorized Public Disclosure Authorized Public Disclosure Authorized IPP278 v.1 rev. Cambodia - Second Health Sector Support Project (HSSP2) Indigenous Peoples
1. Photo by Sina Brod. Photo by Sina Brod MIGRATIONS
 10 1. Photo by Sina Brod Photo by Sina Brod MIGRATIONS 89 Migration131127.indd 89 1/8/14 7:57 AM MIGRATIONS Context The Royal Government of Cambodia views Number immigrant (1997-2008) Number Emigrant (1997-2008
RESEARCH STUDY. Internal Migration Patterns and Practices of Low-Skilled and Unskilled Workers in Cambodia
 RESEARCH STUDY Internal Migration Patterns and Practices of Low-Skilled and Unskilled Workers in Cambodia Open Institute September 2016 Internal Migration Patterns and Practices of Low-Skilled and Unskilled
Case Study on Youth Issues: Philippines
 Case Study on Youth Issues: Philippines Introduction The Philippines has one of the largest populations of the ASEAN member states, with 105 million inhabitants, surpassed only by Indonesia. It also has
people/hectare Ward Toronto
 Bar Chart showing the rate of population growth between the years 2006 and 2016 for the Ward compared to the City of based on the 2006 and data. For more information, please contact Michael Wright at 416-392-7558
Document jointly prepared by EUROSTAT, MEDSTAT III, the World Bank and UNHCR. 6 January 2011
 Migration Task Force 12 January 2011 Progress Report on the Development of Instruments and Prospects of Implementation of Coordinated Household International Migration Surveys in the Mediterranean Countries
SUMMARY ANALYSIS OF KEY INDICATORS
 SUMMARY ANALYSIS OF KEY INDICATORS from the FSM 2010 Census of Population and Housing DIVISION OF STATISTICS FSM Office of Statistics, Budget, Overseas Development Assistance and Compact Management (S.B.O.C)
People. Population size and growth
 The social report monitors outcomes for the New Zealand population. This section provides background information on who those people are, and provides a context for the indicators that follow. People Population
Report on Survey Findings from the 2012 Commune Council Candidate Debates
 Report on Survey Findings from the 2012 Commune Council Candidate Debates September 2012 Table of Contents I. Executive Summary II. Background 1. Debates Program 2. Radio Stations Selected III. Design
North York City of Toronto Community Council Area Profiles 2016 Census
 Bar Chart showing the rate of population growth between the years 2006 and 2016 for the Ward compared to the City of based on the 2006 and data. For more information, please contact Michael Wright at 416-392-7558
MIGRATION AND URBANIZATION IN VIET NAM
 GENERAL STATISTICS OFFICE THE 2014 VIET NAM INTERCENSAL POPULATION AND HOUSING SURVEY UNITED NATIONS POPULATION FUND THE 2014 VIET NAM INTERCENSAL POPULATION AND HOUSING SURVEY MIGRATION AND URBANIZATION
Policy Brief on Labour Force
 The Republic of the Union of Myanmar 2014 Myanmar Population and Housing Census Policy Brief on Labour Force Department of Population Ministry of Labour, Immigration and Population With technical assistance
Did you sleep here last night? The impact of the household definition in sample surveys: a Tanzanian case study.
 Did you sleep here last night? The impact of the household definition in sample surveys: a Tanzanian case study. Tiziana Leone, LSE Ernestina Coast, LSE Sara Randall, UCL Abstract Household sample surveys
Legal Aid in Cambodia: Practices, Perceptions and Needs
 Council for Legal and Judicial Reform Legal Aid in Cambodia: Practices, Perceptions and Needs December 2006 This publication was made possible through support provided by the U.S Agency for International
Pakistan 2.5 Europe 11.5 Bangladesh 2.0 Japan 1.8 Philippines 1.3 Viet Nam 1.2 Thailand 1.0
 173 People Snapshots Asia and the Pacific accounts for nearly 55% of global population and 6 of the world s 10 most populous economies. The region s population is forecast to grow by almost 1 billion by
11 th World Telecommunication/ICT Indicators Symposium (WTIS-13)
") 11 th World Telecommunication/ICT Indicators Symposium (WTIS-13) Mexico City, México, 4-6 December 2013 Information document Document INF/2-E 21 November 2013 English SOURCE: TITLE: National Institute
11 th World Telecommunication/ICT Indicators Symposium (WTIS-13) Mexico City, México, 4-6 December 2013 Information document Document INF/2-E 21 November 2013 English SOURCE: TITLE: National Institute
SAMPLING PLANS SURVEYS MED-HIMS PROGRAMME
 LEAGUE OF ARAB STATES The programme of regionally coordinated Household International Migration Surveys in the Mediterranean Countries MED-HIMS PROGRAMME November 2013 SAMPLING PLANS FOR MED-HIMS SURVEYS
Tunisian emigration through censuses: Pros and cons
 15 January 2018 Measuring Emigration through censuses Paris, 15 January 2018 Tunisian emigration through censuses: Pros and cons Nadia Touihri Director of Demographic Statistics Chief migration unit National
Economic and Social Council
 United Nations E/CN.3/2014/20 Economic and Social Council Distr.: General 11 December 2013 Original: English Statistical Commission Forty-fifth session 4-7 March 2014 Item 4 (e) of the provisional agenda*
COUNTRY PRESENTATION - CAMBODIA -
 Workshop on Strengthening Transport Connectivity among CLMVT Countries 09-10 October 2018, Yangon, MYANMAR COUNTRY PRESENTATION - CAMBODIA - By KONG Sophal, Deputy Director General of Land Transport Ministry
I AIMS AND BACKGROUND
 The Economic and Social Review, pp xxx xxx To Weight or Not To Weight? A Statistical Analysis of How Weights Affect the Reliability of the Quarterly National Household Survey for Immigration Research in
HOUSEHOLD SURVEY FOR THE AFRICAN MIGRANT PROJECT: KENYA. Manual for Interviewers and Supervisors. October 2009
 0 HOUSEHOLD SURVEY FOR THE AFRICAN MIGRANT PROJECT: KENYA Manual for Interviewers and Supervisors October 2009 1 1. BACKGROUND AND OBJECTIVES This is a field work guide for the household survey. The goal
Artists and Cultural Workers in Canadian Municipalities
 Artists and Cultural Workers in Canadian Municipalities Based on the 2011 National Household Survey Vol. 13 No. 1 Prepared by Kelly Hill Hill Strategies Research Inc., December 2014 ISBN 978-1-926674-36-0;
Ward 17 Davenport City of Toronto Ward Profiles 2016 Census
 Bar Chart showing the rate of population growth between the years 2006 and 2016 for the Ward compared to the City of based on the 2006 and data. For more information, please contact Michael Wright at 416-392-7558
The International Labour Migration Statistics (ILMS) Database in ASEAN
 Database in ASEAN") The International Labour Migration Statistics (ILMS) Database in ASEAN Regional workshop on Strengthening the collection and use of international migration data in the context of the 2030 Agenda for Sustainable
The International Labour Migration Statistics (ILMS) Database in ASEAN Regional workshop on Strengthening the collection and use of international migration data in the context of the 2030 Agenda for Sustainable
Chapter 3 Challenges to Make Cambodian SMEs Participate in Global Value Chains: Towards Addressing Poverty and Inequality
 Chapter 3 Challenges to Make Cambodian SMEs Participate in Global Value Chains: Towards Addressing Poverty and Inequality Naomi Hatsukano and Kiyoyasu Tanaka Abstract The inequality within and between
Ward 4 Etobicoke Centre City of Toronto Ward Profiles 2016 Census
 Bar Chart showing the rate of population growth between the years 2006 and 2016 for the Ward compared to the City of based on the 2006 and data. For more information, please contact Michael Wright at 416-392-7558
Scarborough City of Toronto Community Council Area Profiles 2016 Census
 Bar Chart showing the rate of population growth between the years 2006 and 2016 for the Ward compared to the City of based on the 2006 and data. For more information, please contact Michael Wright at 416-392-7558
June Technical Report: India State Survey. India State Survey Research Program
 June 2016 Technical Report: India State Survey India State Survey Research Program TABLE OF CONTENTS Overview... 3 Sampling Methodology... 3 Target Population/Coverage... 3 Sampling Frame... 3 Stratification/Sample
ANNUAL SURVEY REPORT: REGIONAL OVERVIEW
 ANNUAL SURVEY REPORT: REGIONAL OVERVIEW 2nd Wave (Spring 2017) OPEN Neighbourhood Communicating for a stronger partnership: connecting with citizens across the Eastern Neighbourhood June 2017 TABLE OF
ASPECTS OF MIGRATION BETWEEN SCOTLAND AND THE REST OF GREAT BRITAIN
 42 ASPECTS OF MIGRATION BETWEEN SCOTLAND AND THE REST OF GREAT BRITAIN 1966-71 The 1971 Census revealed 166,590 people* resident in England and Wales who had been resident in Scotland five years previously,
LABOUR AND EMPLOYMENT
 5 LABOUR AND EMPLOYMENT The labour force constitutes a key resource that is vital in the growth and development of countries. An overarching principle that guides interventions affecting the sector aims
KINGDOM OF CAMBODIA Nation Religion King
 KINGDOM OF CAMBODIA Nation Religion King PROTOCOL ON PROHIBITIONS OR RESTRICTIONS ON THE USE OF MINES, BOOBY-TRAPS AND OTHER DEVICES, AS AMENDED ON 3 MAY 1996, ANNEXED TO THE CONVENTION ON PROHIBITIONS
WORLD BANK HOUSEHOLD SURVEYS FOR THE AFRICA MIGRATION PROJECT SOUTH AFRICA MIGRATION PROJECT SHORT REPORT
 WORLD BANK HOUSEHOLD SURVEYS FOR THE AFRICA MIGRATION PROJECT SOUTH AFRICA MIGRATION PROJECT SHORT REPORT February 2011 centre for poverty employment and growth HSRC Human Sciences Research Council February
The Provincial Business Environment Scorecard in Cambodia
 The Provincial Business Environment Scorecard in Cambodia A Measure of Economic Governance and Regulatory Policy November 2009 PBES 2009 1 The Provincial Business Environment Scorecard 1 in Cambodia A
Women s Economic Empowerment: a Crucial Step towards Sustainable Economic Development
 Briefing note National Assembly s Secretariat General Women s Economic Empowerment: a Crucial Step towards Sustainable Economic Development Researcher In charge : Ms. KEM Keothyda July 2016 Parliamentary
Goal 3: Promote Gender Equality and Empower Women
 98 Gender equality in primary school enrollment is high, with most economies having ratios of or more. This is also the case for gender equality in secondary school enrollment, but not so for tertiary
STRENGTHENING RURAL CANADA: Fewer & Older: Population and Demographic Crossroads in Rural Saskatchewan. An Executive Summary
 STRENGTHENING RURAL CANADA: Fewer & Older: Population and Demographic Crossroads in Rural Saskatchewan An Executive Summary This paper has been prepared for the Strengthening Rural Canada initiative by:
Nepal - Living Standards Survey , Third Round
 Microdata Library Nepal - Living Standards Survey 2010-2011, Third Round Central Bureau of Statistics - National Planning Commission Secretariat, Government of Nepal Report generated on: November 21, 2017
1 Dr. Center of Sociology, Ho Chi Minh National Political Academy, Vietnam.
 Conference "Southeast Asia s Population in a Changing Asian Context June 10-13, 2002 Siam City Hotel, Bangkok, Thailand The Patterns of fertility decline and family changes in Vietnam s emerging market
vi. rising InequalIty with high growth and falling Poverty
 43 vi. rising InequalIty with high growth and falling Poverty Inequality is on the rise in several countries in East Asia, most notably in China. The good news is that poverty declined rapidly at the same
The foreign born are more geographically concentrated than the native population.
 The Foreign-Born Population in the United States Population Characteristics March 1999 Issued August 2000 P20-519 This report describes the foreign-born population in the United States in 1999. It provides
Chapter 2 Non-Income Poverty Analysis
 Chapter 2 Non-Income Poverty Analysis 2.1 Designated Poor Areas and Socially Vulnerable Groups In the National Poverty Reduction Strategy 2003-2005 (NPRS), the Government of Cambodia targeted 7,500 households
OPINION POLL ON CONSTITUTIONAL REFORM TOP LINE REPORT SOCIAL INDICATOR CENTRE FOR POLICY ALTERNATIVES
 OPINION POLL ON CONSTITUTIONAL REFORM TOP LINE REPORT SOCIAL INDICATOR CENTRE FOR POLICY ALTERNATIVES MARCH 2017 The Centre for Policy Alternatives (CPA) is an independent, non-partisan organisation that
The Jordanian Labour Market: Multiple segmentations of labour by nationality, gender, education and occupational classes
 The Jordanian Labour Market: Multiple segmentations of labour by nationality, gender, education and occupational classes Regional Office for Arab States Migration and Governance Network (MAGNET) 1 The
EXECUTIVE SUMMARY STUDY ON THE IMPACT OF MIGRATION ON CHILDREN IN THE CAPITAL AND TARGET PROVINCES, CAMBODIA
 EXECUTIVE SUMMARY STUDY ON THE IMPACT OF MIGRATION ON CHILDREN IN THE CAPITAL AND TARGET PROVINCES, CAMBODIA (Phnom Penh, Siem Reap, Battambang, Banteay Meanchey and Prey Veng) May 2017 The effects of
KINGDOM OF CAMBODIA. FY2014 Seminar for Gender Equality Officers and Women Leaders in the Asia Pacific Region
 KINGDOM OF CAMBODIA FY2014 Seminar for Gender Equality Officers and Women Leaders in the Asia Pacific Country Report Ms. Chim Manavy Ms. Keo Vathna Cambodia 1- Overview of Cambodia Official name: Kingdom
Developing a Regional Core Set of Gender Statistics and Indicators in Asia and the Pacific
 Developing a Regional Core Set of Gender Statistics and Indicators in Asia and the Pacific Preparatory Survey Questionnaire REGIONAL CONSULTATIVE WORKSHOP TO DEVELOP A FRAMEWORK AND CORE SET OF GENDER