The Future of North West Sydney
|
|
|
- Angel Fitzgerald
- 5 years ago
- Views:
Transcription

1 The Future of North West Sydney AUGUST 2018
2 2
3 Contents Demographic & Education Trends in Sydney s North West 5 Methodology 7 Sydney s North West 8 Population growth 8 Age profile 9 Student enrolments 12 Household composition 15 Household income 17 Cultural diversity 19 Future population projections 23 Growth in the school aged population 24 3
4 4
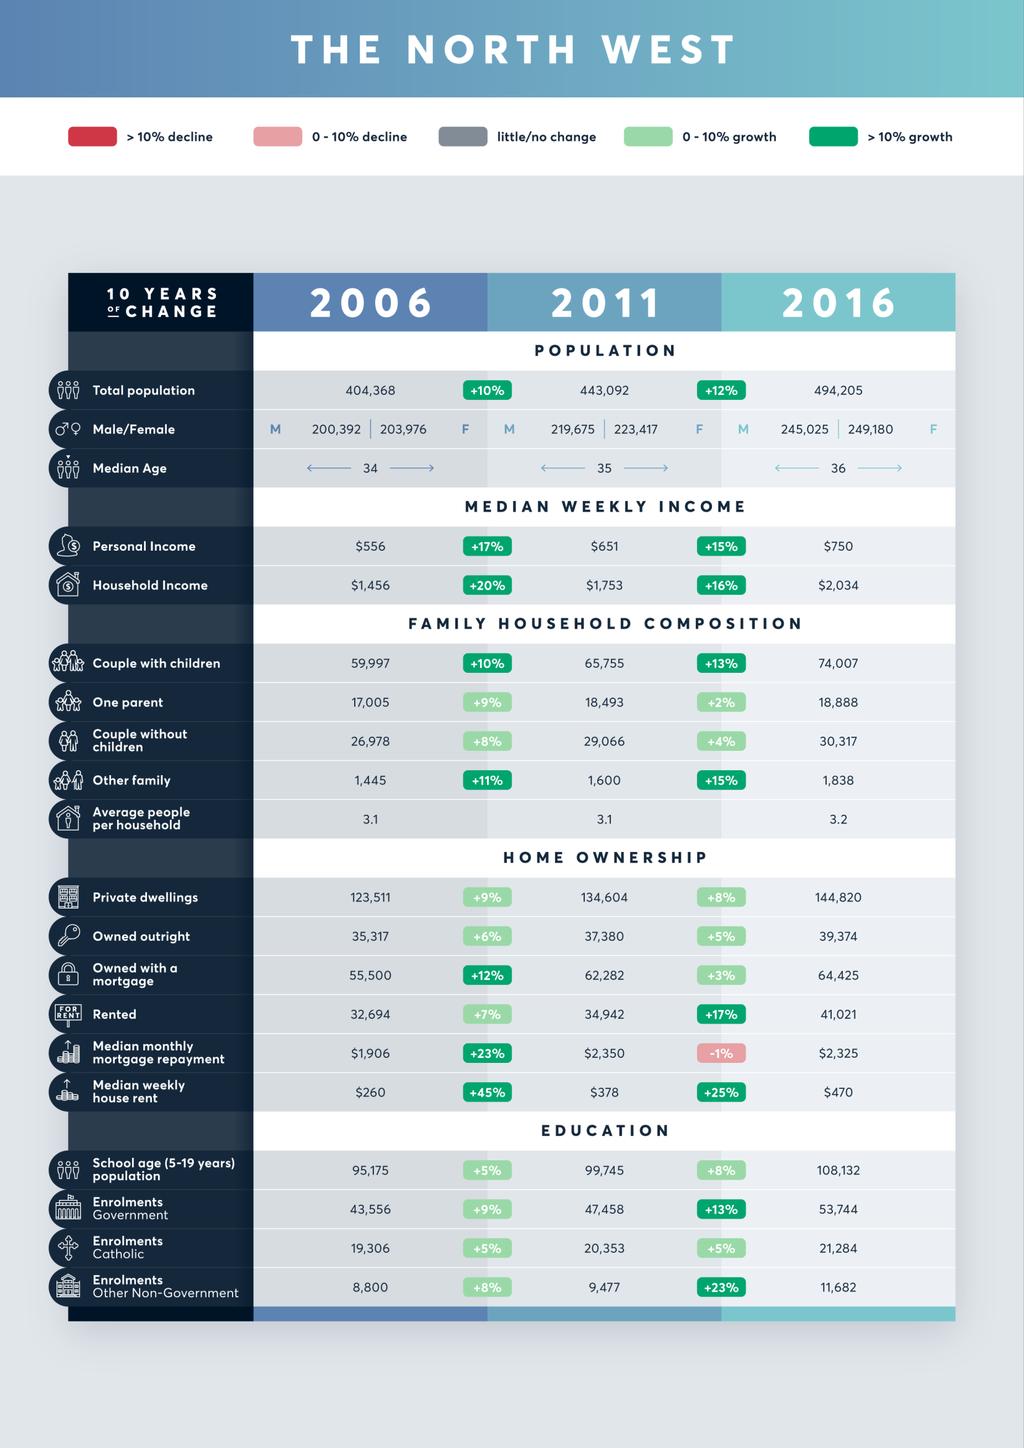
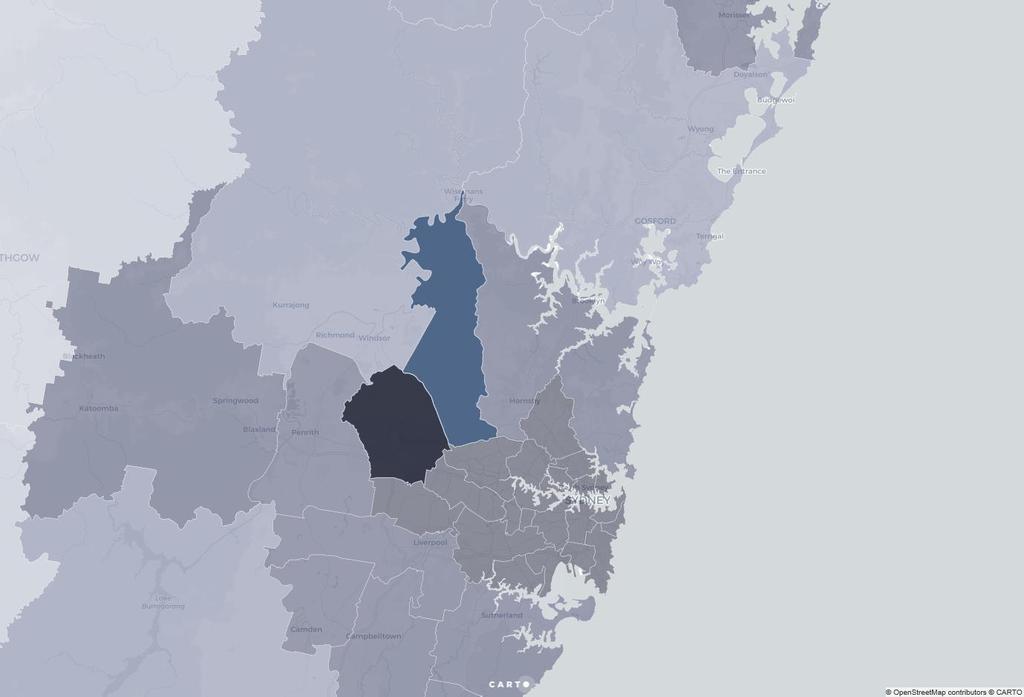
5 Demographic & Education Trends in Sydney s North West Population growth in the North West The North West (which comprises of two LGAs, Blacktown City Council and The Hills Shire Council) is home to half a million people (495,205) and is one of Sydney s primary population growth corridors. Over the past decade the population of the North West has increased by 89,837 people growing at a rate of 22% over ten years. There is development of significant infrastructure in the North West including the Sydney Metro North West Rail Link, new housing developments in areas such as McGraths Hills, Box Hills, Riverstone and Marsden Park, and planned growth of the Norwest Business Park. The Department of Planning and Environment projects that the area s population will be on its way to reaching 1 million people in 2036 (812,250). Family focused The area s growth is in part a result of its strong family demographic. Six in ten households (60%) in the region contain children (both couple families with children and single parents) which is above average for both Sydney (45%) and NSW (43%). Over the past ten years, families with children have not only been the most common household type, but they have also been the largest growing households, increasing by 15,893 households. An increasing number of households with children undergirds the growing number of children in the North West. Since 2006, the number of children under the age of 20 has increased from 126,695 (2006) up to 144,832 (2016). This has caused a subsequent rise in the total number of students living in the North West area. Total student enrolments have increased from 71,662 (2006) to 86,710 (2016), an additional 15,048 students living in the North West. Educational preferences Two in five students are enrolled in nongovernment education (38%). This consists of a quarter who are enrolled in a Catholic education (25%) and over one in eight who are enrolled in independent school education (13%). Independent school education is the fastest growing education affiliation in the North West, growing by 33% over the past ten years, compared to 26% growth in government enrolments and 10% growth in Catholic enrolments. Growth in the number of non-government school students is partly linked to rising household incomes across the North West region and growing disposable income. Since 2006 median household income in the North West has risen from $75,686 up to $105,768 in This is highest in The Hills Shire where median household income is $122,668 compared to $94,484 in Blacktown. Rising cultural diversity As the North West has grown it has become increasingly culturally diverse. In 2006 a third of the total population was born overseas (33%). Today this proportion has increased to 39% of the population. People moving into the North West from overseas are most likely to come from Asian countries. The top three migrant countries of birth are India (6%), Philippines (5%) and China (3%). Just these three countries alone 5
6 represent 14% of the population. These three countries are also the largest growing migrant countries of birth with the number of people born in India increasing by 21,764 people over the past ten years at a rate of 224%. Diversity of language has also been increasing. The proportion of the population that speaks a language other than English at home has increased from 29% in 2006 to 38% in The most commonly spoken non-english languages in the North West are Hindi (3%), Mandarin (3%) and Tagalog (3%). Apart from Arabic, which is the 5th most commonly spoken non-english language, all ten of the most commonly spoken non-english languages in the North West area are Asian languages. The two largest growing are Mandarin (spoken by 14,833 people) and Punjabi (9,797). Population projections for the North West The population projections for the North West are likely to have a lasting impact on the educational landscape in the area. The total number of school aged children is projected to increase from 108,132 (2016) to 171,400 (2036). This is an increase of 59% over the next 20 years and gives an average annual increase in the student population of 3,164. The region s growing cultural diversity, growing preference for non-government education and rising household incomes are all likely to impact the future of independent education in the North West. 6
7 Methodology Geographical boundaries The data used in this report relates to Sydney s North West Region which, for this report, is comprised of The Hills Shire Council Local Government Area (LGA) and the Blacktown City Council Local Government Area (LGA). Census results The demographic data used in this report has been obtained from the Australian Bureau of Statistics Census of Population and Housing 2006, 2011 and Population projections Future population projections for the North West are based on the New South Wales Department of Planning and Environment s document: 2016 New South Wales State and Local Government Area Population Projections. The projections outlined by the New South Wales Department of Planning and Environment have been compared to current Census data to calculate expected growth rates and future population figures. Terminology Throughout this report the two Local Government Areas, The Hills Shire Council and Blacktown City Council, have been referred to as the North West. The individual Local Government Areas in this report, including The Hills Shire Council and the Blacktown City Council, been referred to as The Hills Shire and Blacktown. 7
8 Sydney s North West Population growth The Hills Shire and Blacktown combined have a total population of nearly half a million people (494,205) which is more than the current population of Canberra (415,900). Over past decade (2006 to 2016) this population has grown by 89,837 people at a rate of 22% over ten years. That s an average of 9,000 new people every year (8,984), which is like adding new Stanhope Gardens (9,160) or Beaumont Hills (9,038) every year. Population growth in the North West has been accelerating in recent years growing at a fiveyear rate of 12% (2011 to 2016) compared to 10% during the previous five-year period (2006 to 2011). North West population growth (2006 to 2016) 600, , , , , , , , ,
9 Age profile Average median age in the North West is 36- year-old, which is two years below both the state and national medians (38). Over the past decade the average median age in the area has risen by two years from 34-years-old in The rise in average median age has been driven by a slightly ageing population in The Hills Shire. Median age in The Hills Shire is on par with the national median at 38-years-old and has risen by three years over the past ten years (35 in 2006). In Blacktown the median age is much lower, just 33-years-old and this has only changed by one year since 2006 (32). Median age Area # Change The Hills Shire Blacktown New South Wales Population growth by age While the Hills has a large and growing population of retirees, the lower median age than comparable areas is due to a large population of children and growth in young families. Blacktown has an even higher proportion of children. There are 144,832 children (aged 0 to 19) living in the North West. As a proportion of the total population children represent nearly three in ten people (29%). Over the past decade the number of children in the North West has grown by 18,137 from 126,695 (2006) up to 144,832 (2016) at a rate of 14% over ten years. At the other end of the age spectrum, in 2006 the number of retirement aged residents in the North West represented less than one-tenth of the total population (8%). Today this proportion has grown by three percentage points reaching 11% (2016). While the proportions of the population have shifted slightly over the past ten years, there has been numerical growth in every single age bracket. Proportionally, the fastest growing age brackets are all over the age of 60. The fastest growing age bracket in the North West is 85+ (85%). This rapid proportional growth, however, is a result of the relatively small base population in 2006 (5,553 people), increasing by 2,550 between 2006 and Most other age groups have increased by a numerically larger amount. The second fastest growing age group, aged 65 to 69, has grown by 83% over ten years. In addition to the fastest growth, the number of 65 to 69-year-olds has increased by the largest numerical amount (9,477). Looking at numerical growth by age, the impact of Gen Alpha (those born from 2010) can be observed. Since 2006 the number of children under the age of 10 has grown by 11,211 children from 64,267 (2006) up to 75,478 (2016). This emerging peak in the population distribution by age will continue to impact the North West educational landscape over the coming years. 9
10 Proportion of the population by age (2016) 9% 8% 7% 6% 7% 8% 7% 7% 7% 6% 7% 8% 7% 7% 6% 6% 5% 5% 4% 4% 3% 3% 2% 1% 2% 1% 1% 0% Number of people by age (2006 to 2016) 45,000 40,000 35,000 30,000 25,000 20,000 15,000 10,000 5,
11 Proportional growth in the population by age (2006 to 2016) 90% 83% 85% 80% 70% 72% 60% 50% 40% 43% 44% 39% 30% 20% 16% 18% 9% 13% 14% 18% 21% 23% 19% 16% 18% 17% 10% 0% Numerical growth in the population by age (2006 to 2016) 10,000 9,477 9,000 8,000 7,000 6,000 5,000 4,000 3,000 5,180 6,031 2,999 4,844 3,976 3,927 6,472 7,111 5,970 4,679 4,701 4,167 7,277 5,939 2,866 2,550 2,000 1,676 1,
12 Student enrolments The North West is home to 86,710 school students. Nearly two in five students living in the North West are enrolled in a nongovernment school (38%). A quarter are enrolled in a Catholic affiliated school (25%) and one in eight are enrolled in an independent school (13%). In the Hills Shire, 42% of school students are enrolled in a non-government school with 24% enrolled in Catholic education and 18% enrolled in independent. The proportions are slightly lower overall in Blacktown with Catholic enrolments representing 27% and independent enrolments comprising 11%. Independent education in the North West is the fastest growing educational affiliation. Over the past decade the number of students enrolled in an independent school has grown by 33% from 8,800 in 2006 to 11,682 in 2016, an increase of 2,882. Government enrolments have grown by 10,188 students over the past ten years compared to 4,860 additional non-government students with most of this growth from primary school students. The total number of government affiliated primary school students increased by 6,666 over the past decade compared to 1,952 non-government primary enrolments. In the secondary school sector, however, growth has been more even across the sectors. Over ten years secondary government enrolments have increased by 3,522 from 16,820 (2006) up to 20,342 (2016). Meanwhile non-government enrolments have grown by 2,908 (just 614 less) from 14,060 (2006) up to 16,968 (2016). Student enrolments by affiliation (2016) 13% 25% 62% Government Catholic Other Non Government 12
13 Student enrolments by affiliation (2006 to 2016) North West # Change % Change Preschool 8,113 9,306 9,757 1,644 20% Primary Government 26,736 28,578 33,402 6,666 25% Catholic 9,958 10,076 10, % Independent 4,088 4,477 5,640 1,552 38% Total (Primary) 40,782 43,131 49,400 8,618 21% Secondary Government 16,820 18,880 20,342 3,522 21% Catholic 9,348 10,277 10,926 1,578 17% Independent 4,712 5,000 6,042 1,330 28% Total (Secondary) Total school enrolments (Primary/Secondary) 30,880 34,157 37,310 6,430 21% 71,662 77,288 86,710 15,048 21% Number of students by affiliation (2006 to 2016) 60,000 53,744 50,000 43,556 47,458 40,000 30,000 28,106 29,830 32,966 20,000 10, Government Non-government 13
14 Primary enrolments by affiliation (2006 to 2016) ,046 26, ,553 28, ,998 33, ,000 10,000 15,000 20,000 25,000 30,000 35,000 40,000 Government (primary) Non-government (primary) Secondary enrolments by affiliation (2006 to 2016) ,060 16, ,277 18, ,968 20, ,000 10,000 15,000 20,000 25,000 Government (secondary) Non-government (secondary) 14
15 Household composition There are 154,749 households in the North West and half are couple families with children (48%). This is 13 percentage points higher than the average for Sydney (35%) and higher again than the average across New South Wales (32%). When couple families with children are combined with one parent families, the proportion of households that are home to children is 60% (cf. 45% Sydney and 43% NSW). Not only do households with children in North West represent the largest proportion of households, but they are also the largest growing household type. Over the past ten years the number of couple families and one parent families combined has increased by 15,893 families (14,010 couples with children and 1,883 single parents) compared to an increase of only 3,339 of couples without children and an increase of 2,079 of lone persons. Household composition (2006 to 2016) 60% 50% 48% 46% 46% 40% 30% 20% 21% 21% 20% 13% 13% 12% 14% 14% 13% 10% 1% 1% 1% 2% 3% 2% 2% 3% 4% 0% Couple family without children Couple family with children One parent family Other family Lone person houshold Group household Other household
16 Comparison of household composition (2016) North West, Sydney and New South Wales. 60% 50% 48% 40% 35% 32% 30% 20% 10% 0% 24% 22% 20% Couple family without children Couple family with children 12% 10% 11% One parent family 1% 1% 1% Other family 13% 22% 20% Lone person houshold 4% 6% 6% 4% 4% 2% Group household Other household North West Sydney New South Wales Growth in household types in North West (2006 to 2016) Numerical change between 2006 and ,000 14,000 14,010 12,000 10,000 8,000 6,000 4,000 3,339 2,000 0 Couple family without children Couple family with children 1,883 One parent family 393 Other family 2,079 Lone person houshold 486 Group household 1,297 Other household 16
17 Household income Median household income in the North West has risen by 40% over the past ten years. From $75,686 p.a. in 2006 up to $105,768 p.a. per household in While median household income has been increasing over the past decade, so too has median household expenditure. Median rental prices have risen by 81% over the past ten years, from $260 per week (2006) to $470 per week (2016). Median monthly mortgage repayments have also gone up from $1,906 (2006) to $2,352 (2016), an increase of 22%. Selected medians (income) North West # Change % Change Median personal income $28,912 $33,852 $38,974 $10,062 35% Median family income $80,834 $97,474 $111,306 $30,472 38% Median household income $75,686 $91,156 $105,768 $30,082 40% The Hills Shire # Change % Change Median personal income $33,228 $38,324 $43,004 $9,776 29% Median family income $98,800 $117,364 $128,128 $29,328 30% Median household income $93,288 $110,240 $122,668 $29,380 31% Blacktown # Change % Change Median personal income $24,596 $29,380 $34,944 $10,348 42% Median family income $62,868 $77,584 $94,484 $31,616 50% Median household income $58,084 $72,072 $88,868 $30,784 53% 17
18 Selected medians (expenditure) North West Median monthly mortgage repayments # Change % Change $1,906 $2,350 $2,325 $419 22% Median weekly rent $260 $378 $470 $210 81% 18
19 Cultural diversity Two in five people living in the North West were born outside of Australia (39%). This has increased from a third of the population in 2006 (33%). Today there are 191,543 residents of the North West who were born overseas. This has grown by 60,000 people over the past ten years an increase of 46%. This means that the North West migrant community is growing 24 percentage points faster than overall population growth (22%). The top three countries of birth of North West residents born overseas are all Asian countries. The top three countries alone (India, Philippines and China) represent 14% of the total population. The top five largest growing countries of birth of North West residents are India (+21,764), China (+8,086), Philippines (+6,215), Sri Lanka (+3,304) and Pakistan (+2,913). Proportion of the population born overseas % 39% 67% 61% Top 10 largest growing migrant countries of birth (2006 to 2016) By numerical increase (2006 to 2016). India China Philippines Sri Lanka Pakistan Fiji Iran New Zealand South Korea South Africa 3,304 2,913 1,859 1,546 1,504 1,415 1,275 6,215 8,086 21,
20 Top 10 migrant countries of birth Philippines (4%) Philippines (5%) India (6%) 2. United Kingdom (3%) India (4%) Philippines (5%) 3. India (2%) United Kingdom (3%) China (3%) 4. New Zealand (2%) New Zealand (2%) United Kingdom (3%) 5. Fiji (1%) Fiji (2%) New Zealand (2%) 6. China (1%) China (2%) Fiji (2%) 7. Sri Lanka (1%) Sri Lanka (1%) Sri Lanka (1%) 8. Malta (1%) South Africa (1%) Pakistan (1%) 9. South Africa (1%) South Korea (1%) South Africa (1%) 10. Italy (1%) Malta (1%) South Korea (1%) Top 10 largest growing migrant countries of birth Country # Change % Change India 9,700 18,720 31,464 21, % 2. China 4,639 6,839 12,725 8, % 3. Philippines 18,088 2, ,303 6,215 34% 4. Sri Lanka 3,925 5,413 7,229 3,304 84% 5. Pakistan 1,882 2,998 4,795 2, % 6. Fiji 6,008 7,191 7,867 1,859 31% 7. Iran 1,679 2,220 3,225 1,546 92% 8. New Zealand 8,817 9,634 10,321 1,504 17% 9. South Korea 2,526 3,109 3,941 1,415 56% 10. South Africa 2,962 3,971 4,237 1,275 43% 20
21 Language diversity As the number of people who were born overseas has increased, so too has the number of people who speak a language other than English at home. Today 38% of the population in the North West speak a language other than English at home. This is an increase of nearly 10 percentage points since 2006 (29%). Proportion of the population that speak a language other than English % 38% 71% 62% Top 10 largest growing non-english languages (2006 to 2016) By numerical increase. Hindi 16,436 Mandarin Tagalog 14,833 14,689 Punjabi Arabic 13,346 12,919 Cantonese 8,870 Filipino Tamil Urdu 7,244 6,742 6,457 Korean 4, ,000 4,000 6,000 8,000 10,000 12,000 14,000 16,000 18,000 21
22 Top 10 non-english languages Arabic (3%) Tagalog (3%) Hindi (3%) 2. Tagalog (3%) Hindi (3%) Mandarin (3%) 3. Hindi (2%) Arabic (3%) Tagalog (3%) 4. Cantonese (2%) Cantonese (2%) Punjabi (3%) 5. Filipino (2%) Punjabi (2%) Arabic (3%) 6. Italian (1%) Mandarin (2%) Cantonese (2%) 7. Mandarin (1%) Filipino (2%) Filipino (1%) 8. Spanish (1%) Tamil (1%) Tamil (1%) 9. Punjabi (1%) Italian (1%) Urdu (1%) 10. Samoan (1%) Spanish (1%) Korean (1%) Top 10 largest growing non-english languages Language # Change % Change Mandarin 4,475 7,056 14,833 10, % 2. Punjabi 3,549 7,894 13,346 9, % 3. Hindi 8,416 12,729 16,436 8,020 95% 4. Urdu 2,429 4,118 6,457 4, % 5. Tagalog 10,739 12,993 14,689 3,950 37% 6. Tamil 2,838 4,426 6,742 3, % 7. Bengali 1,571 2,442 3,939 2, % 8. Persian 2,001 2,713 3,964 1,963 98% 9. Arabic 11,029 12,243 12,919 1,890 17% 10. Korean 3,066 3,851 4,940 1,874 61% 22
23 Future population projections The New South Wales Department of Planning and Environment projects that the combined population of the North West (The Hills Shire and Blacktown) will be 812,250 in That s an additional 318,045 people and an increase of 64% over 20 years. By 2036, Blacktown is projected to reach 521,400 people and The Hills Shire is projected to reach 290,850. In 2026 the population is projected to be 658,750 which is an increase of 164,545 at a rate of 33% over ten years. Blacktown is projected to reach 433,550 in 2026 and The Hills Shire is projected to be 225,200 in the same year. Growth in the North West (2016 to 2036) 900, , , , , , , , , , , , , , Growth in the North West by LGA (2016 to 2036) 600, , , , , , , , , , , , , , , , The Hills Shire Blacktown 23
24 Growth in the school aged population The school aged population (those age 5 to 19) is also projected to continue growing over the next 20 years. In 2036 there will be 171,400 school aged children living in the North West (110,000 Blacktown and 61,400 The Hills Shire). Growth is projected to be faster in the Hills where the school aged population is projected to grow by 75% over the next 20 years. In Blacktown, growth will still be strong, increasing at a rate of 51% over 20 years. Numerically, growth is projected to be largest in Blacktown where the school aged population is projected to increase by 36,973 children while the number of children in The Hills Shire is projected to increase by 26,295 over 20 years. Growth in school aged children in the North West (2016 to 2036) 180, , , , , , , , , ,000 80,000 60,000 40,000 20, Growth in school aged population by LGA (2016 to 2036) 120, ,000 92, , ,000 80,000 73,027 82,300 60,000 40,000 35,105 40,350 48,200 54,850 61,400 20, The Hills Shire Blacktown 24
25 25
26 26
27 27
28 28
29 29
30 30
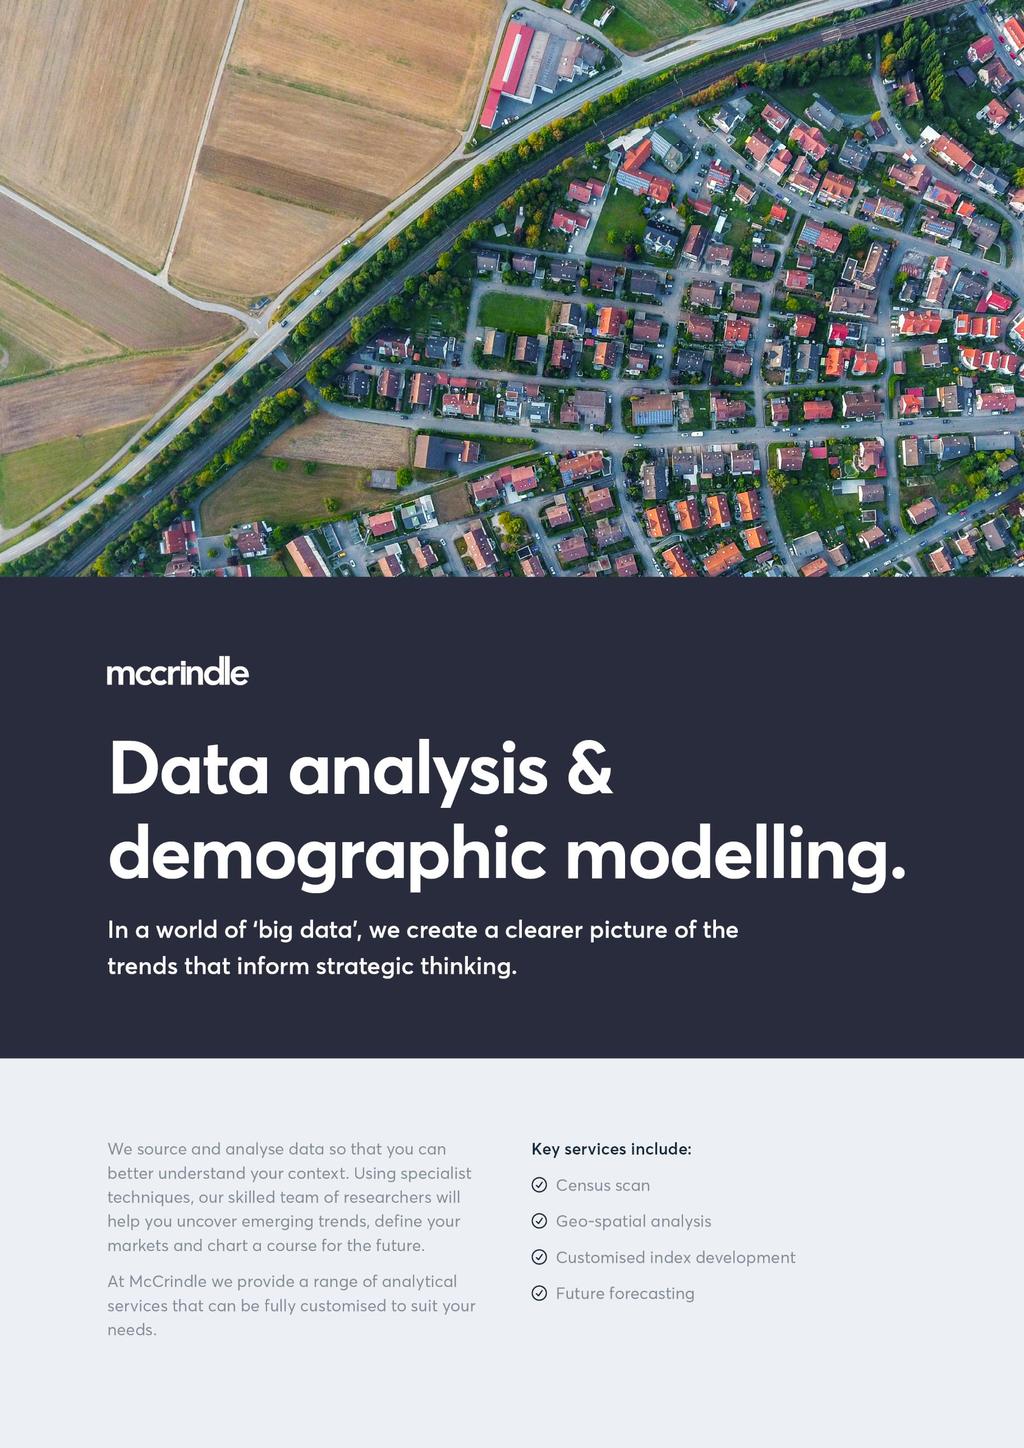
31 McCrindle Research Pty Ltd August 2018 Sydney, Australia McCrindle Research is an independent social and market research advisory consultancy. We are regularly commissioned to undertake demographic and market research for Australia s leading brands and organisations. Disclaimer This demographic projection document is prepared by McCrindle Research Pty Ltd in our capacity as independent researchers. The statements in this report may provide current expectations of future events based on certain assumptions. These statements involve known and unknown risks, uncertainties and other factors which are not exhaustive. The material contained in this publication is made available on the understanding that the McCrindle Research Pty Ltd is not providing professional advice, and that users exercise their own skill and care with respect to its use, and seek independent advice if necessary. McCrindle Research Pty Ltd makes no representations or warranties as to the contents or accuracy of the information contained in this publication. To the extent permitted by law, McCrindle Research Pty Ltd disclaims liability to any person or organisation in respect of anything done, or omitted to be done, in reliance upon information contained in this publication. 31
32 Get in touch. Phone mccrindleresearch info@mccrindle.com.au markmccrindle Website mccrindle.com.au mccrindleresearch Blog blog.mccrindle.com.au company/mccrindle-research Address Suite 105, 29 Solent Circuit, Norwest, NSW
2011 National Household Survey Profile on the Town of Richmond Hill: 1st Release
 2011 National Household Survey Profile on the Town of Richmond Hill: 1st Release Every five years the Government of Canada through Statistics Canada undertakes a nationwide Census. The purpose of the Census
Culturally and Linguistically Diverse People Living in NSW: Selected characteristics
 Culturally and Linguistically Diverse People Living in NSW: Selected characteristics Contents Introduction 3 Countries people were born in 4 Most common ethnic groups 6 Trends in the number of arrivals
Study Area Maps. Profile Tables. W Broadway & Cambie St, Vancouver, BC Pitney Bowes 2016 Estimates and Projections. W Broadway & Cambie St
 Powered by PCensus Page 1 Study Area Maps Profile Tables 2016 Demographic Snapshot Population Trends Household Trends Population by Age and Sex Comparison Population by Age and Sex Household Maintainers
Social and Demographic Trends in Burnaby and Neighbouring Communities 1981 to 2006
 Social and Demographic Trends in and Neighbouring Communities 1981 to 2006 October 2009 Table of Contents October 2009 1 Introduction... 2 2 Population... 3 Population Growth... 3 Age Structure... 4 3
Our Changing City: Cultural and linguistic diversity in Greater Western Sydney
 Our Changing City: Cultural and linguistic diversity in Greater Western Sydney Written by Dr Olivia Hamilton Acknowledgment of Country / Statement of Commitment We respectfully acknowledge the traditional
CITY OF MISSISSAUGA. Overview 2-1. A. Demographic and Cultural Characteristics
 Portraits of Peel Overview 2-1 A. Demographic and Cultural Characteristics Population: Size, Age and Growth 2-2 Immigrants 2-3 Visible Minorities 2-4 Language 2-5 Religion 2-6 Mobility Status 2-7 B. Household
North York City of Toronto Community Council Area Profiles 2016 Census
 Bar Chart showing the rate of population growth between the years 2006 and 2016 for the Ward compared to the City of based on the 2006 and data. For more information, please contact Michael Wright at 416-392-7558
people/hectare Ward Toronto
 Bar Chart showing the rate of population growth between the years 2006 and 2016 for the Ward compared to the City of based on the 2006 and data. For more information, please contact Michael Wright at 416-392-7558
Immigrant DELTA, B.C Delta Immigrant Demographics I
 Immigrant demographics DELTA, B.C. - 2018 Immigrant Demographics I Page 1 DELTA IMMIGRANT DEMOGRAPHICS Your quick and easy look at facts and figures around immigration. Newcomers are an important and growing
Planning Study Area 1 Burnaby Heights
 Neighbourhood Profiles 2006 Census Planning Study Area 1 Heights is bounded by Burrard Inlet to the north, Willingdon Avenue to the east, Hastings Street to the south and Boundary Road to the west. PLANNING
TABLE OF CONTENTS. Department of Immigration and Citizenship Settlement Database
 TABLE OF CONTENTS Eastern Region Department of Immigration and Citizenship Settlement Database Settlement in the Eastern Region by Migration Stream - July 1 2002 to June 30 2007 Settlement in the Eastern
The Planning & Development Department recommends that Council receive this report for information.
 CORPORATE REPORT NO: R237 COUNCIL DATE: November 19, 2018 REGULAR COUNCIL TO: Mayor & Council DATE: November 15, 2018 FROM: General Manager, Planning & Development FILE: 6600-01 SUBJECT: Surrey Community
BRAMALEA. Overview A. Demographic and Cultural Characteristics
 The Social Planning Council of Peel Portraits of Peel BRAMALEA Overview 13-1 A. Demographic and Cultural Characteristics Population: Size, Age and Growth 13-2 Immigrants 13-3 Visible Minorities 13-4 Language
Saanich A District Municipality in Capital Regional District
 Produced by Stats for Population Total Immigrants Change in Change in Immigrants Population Number Percent Population Number Percent 1991 95,583 20,285 21.2 1991 to 1996 5,805 755 3.7 1996 101,388 21,040
Ward 4 Etobicoke Centre City of Toronto Ward Profiles 2016 Census
 Bar Chart showing the rate of population growth between the years 2006 and 2016 for the Ward compared to the City of based on the 2006 and data. For more information, please contact Michael Wright at 416-392-7558
Nanaimo A City in Nanaimo Regional District
 A City in Regional District Produced by Stats for Population Total Immigrants Change in Change in Immigrants Population Number Percent Population Number Percent 1991 6,129 8,885 14.8 1991 to 1996,1 2,44
North Vancouver, City of A City in Greater Vancouver Regional District
 Global Non-Response Rate: 25.8 Population Total Immigrants Change in Change in Immigrants Population Number Percent Population Number Percent 1991 38,436,8 28.2 1991 to 1996 3,39 2,46 22.7 1996 41,475
Scarborough City of Toronto Community Council Area Profiles 2016 Census
 Bar Chart showing the rate of population growth between the years 2006 and 2016 for the Ward compared to the City of based on the 2006 and data. For more information, please contact Michael Wright at 416-392-7558
Ward 14 Parkdale-High Park City of Toronto Ward Profiles 2016 Census
 Bar Chart showing the rate of population growth between the years 2006 and 2016 for the Ward compared to the City of based on the 2006 and data. For more information, please contact Michael Wright at 416-392-7558
2011 CENSUS & NATIONAL HOUSEHOLD SURVEY CITY OF BRAMPTON - WARD 4 PROFILE
 2011 CENSUS & NATIONAL HOUSEHOLD SURVEY CITY OF BRAMPTON WARD 4 PROFILE WARD HIGHLIGHTS Population 9.51% of total population 49,850 2011 Population 34 Median Age 50.5% Females 49.5% Males 2011 Population
Burnaby A City in Greater Vancouver Regional District
 Produced by Stats for Global Non-Response Rate: 23.6 Population Total Change in Change in Population Number Percent Population Number Percent 1991 158,858 49,5 31.2 1991 to 1996,351 24,5 49.1 1996 179,9
2011 CENSUS & NATIONAL HOUSEHOLD SURVEY CITY OF BRAMPTON - WARD 3 PROFILE
 2011 CENSUS & NATIONAL HOUSEHOLD SURVEY CITY OF BRAMPTON WARD 3 PROFILE WARD HIGHLIGHTS Population 47,500 2011 Population 50.7% Females 2011 Population by Age Group 13% 18% 014 9.07% of total population
2011 CENSUS & NATIONAL HOUSEHOLD SURVEY CITY OF BRAMPTON - WARD 10 PROFILE
 2011 CENSUS & NATIONAL HOUSEHOLD SURVEY CITY OF BRAMPTON WARD 10 PROFILE WARD HIGHLIGHTS Population 10.72% of total population 56,185 2011 Population 33 Median Age 50.1% Females 49.9% Males 2011 Population
(Note: These are inititial neighbourhood estimates and are subject to change.) NEI Score. 1,000 Female 52%
 NEI Score. 1,000 Female 52%") 0-4 5-9 10-14 15-19 20-24 25-29 30-34 35-39 40-44 45-49 50-54 55-59 60-64 65-69 70-74 75-79 80-84 85-89 90-94 95-99 100+ 2011 Neighbourhood Demographic Estimates EGLINTON AVE E C P R DON VALLEY PARKWAY
0-4 5-9 10-14 15-19 20-24 25-29 30-34 35-39 40-44 45-49 50-54 55-59 60-64 65-69 70-74 75-79 80-84 85-89 90-94 95-99 100+ 2011 Neighbourhood Demographic Estimates EGLINTON AVE E C P R DON VALLEY PARKWAY
People. Population size and growth. Components of population change
 The social report monitors outcomes for the New Zealand population. This section contains background information on the size and characteristics of the population to provide a context for the indicators
Dufferin Grove: Neighbourhood Profile
 I. Population and Age Population 21 Neighbourhood Population: 12693 12% of Catchment Area Population: Change in population growth (1996-21): # 145 % 1% same as pop change in the catchment area Population
Ward 17 Davenport City of Toronto Ward Profiles 2016 Census
 Bar Chart showing the rate of population growth between the years 2006 and 2016 for the Ward compared to the City of based on the 2006 and data. For more information, please contact Michael Wright at 416-392-7558
View Royal A Town in Capital Regional District
 Produced by Stats for Global NonResponse Rate: 18.4 Population Total Immigrants Change in Change in Immigrants Population Number Percent Population Number Percent 1991 5,996 9 15.6 1991 to 1996 445 315
2011 CENSUS & NATIONAL HOUSEHOLD SURVEY CITY OF BRAMPTON - WARD 1 PROFILE
 CENSUS & NATIONAL HOUSEHOLD SURVEY CITY OF BRAMPTON WARD 1 PROFILE WARD HIGHLIGHTS Population 53,130 Population 51.0% Females Population by Age Group 9% 20% 014 10.14% of total population 36 Median Age
Grand Forks A City in Kootenay-Boundary Regional District
 A City in KootenayBoundary Regional District Produced by Stats for Global NonResponse Rate: 45.8 Population Total Immigrants Change in Change in Immigrants Population Number Percent Population Number Percent
Castlegar A City in Central Kootenay Regional District
 Produced by Stats for Population Total Immigrants Change in Change in Immigrants Population Number Percent Population Number Percent 1991 6,579 885 13.5 1991 to 1996 448 45 5.1 1996 7,27 93 13.2 1996 to
AVERAGE HOUSEHOLD INCOME $103,177 ($93,586) RENTERS 21% (29%) UNEMPLOYMENT RATE 5% (7%) TAKE TRANSIT TO WORK 6% (15%)
 RENTERS 21% (29%) UNEMPLOYMENT RATE 5% (7%) TAKE TRANSIT TO WORK 6% (15%)") CITY OF COMMUNITY PROFILES 2016 Census Data City of Surrey Statistics WHALLEY CITY CENTRE GUILDFORD FLEETWOOD NEWTON AREA 4,917 ha (32,621 ha) AVERAGE HOUSEHOLD INCOME $103,177 ($93,586) SOUTH POPULATION
CITY OF COMMUNITY PROFILES 2016 Census Data City of Surrey Statistics WHALLEY CITY CENTRE GUILDFORD FLEETWOOD NEWTON AREA 4,917 ha (32,621 ha) AVERAGE HOUSEHOLD INCOME $103,177 ($93,586) SOUTH POPULATION
new westminster, B.C New Westminster Immigrant Demographics I
 Immigrant demographics new westminster, B.C. - 2018 Immigrant Demographics I Page 1 new westminster IMMIGRANT DEMOGRAPHICS Your quick and easy look at facts and figures around immigration. Newcomers are
AVERAGE HOUSEHOLD INCOME $97,637 ($93,586) RENTERS 22% (29%) UNEMPLOYMENT RATE 7% (7%) TAKE TRANSIT TO WORK 15% (15%)
 RENTERS 22% (29%) UNEMPLOYMENT RATE 7% (7%) TAKE TRANSIT TO WORK 15% (15%)") CITY OF COMMUNITY PROFILES 2016 Census Data City of Surrey Statistics WHALLEY CITY CENTRE GUILDFORD NEWTON CLOVERDALE AREA 1,809 ha (32,621 ha) AVERAGE HOUSEHOLD INCOME $97,637 ($93,586) SOUTH POPULATION
CITY OF COMMUNITY PROFILES 2016 Census Data City of Surrey Statistics WHALLEY CITY CENTRE GUILDFORD NEWTON CLOVERDALE AREA 1,809 ha (32,621 ha) AVERAGE HOUSEHOLD INCOME $97,637 ($93,586) SOUTH POPULATION
TABLE OF CONTENTS. Settlement in the City of Whitehorse by Migration Stream - July to June
 TABLE OF CONTENTS City of Whitehorse Department of Immigration and Citizenship Settlement Database Settlement in the City of Whitehorse by Migration Stream - July 1 2002 to June 30 2007 Settlement by Country
(Note: These are inititial neighbourhood estimates and are subject to change.) SCARBOROUGH SHORELINE. NEI Score. 1,500 Female 53%
 SCARBOROUGH SHORELINE. NEI Score. 1,500 Female 53%") 0-4 5-9 10-14 15-19 20-24 25-29 30-34 35-39 40-44 45-49 50-54 55-59 60-64 65-69 70-74 75-79 80-84 85-89 90-94 95-99 100+ 2011 Neighbourhood Demographic Estimates HIGHLAND CREEK WEST HIGHLAND CREEK KINGSTON
0-4 5-9 10-14 15-19 20-24 25-29 30-34 35-39 40-44 45-49 50-54 55-59 60-64 65-69 70-74 75-79 80-84 85-89 90-94 95-99 100+ 2011 Neighbourhood Demographic Estimates HIGHLAND CREEK WEST HIGHLAND CREEK KINGSTON
Immigrant. coquitlam, B.C Coquitlam Immigrant Demographics I
 Immigrant demographics coquitlam, B.C. - 2018 Immigrant Demographics I Page 1 coquitlam IMMIGRANT DEMOGRAPHICS Your quick and easy look at facts and figures around immigration. Newcomers are an important
Strathcona A Regional District in British Columbia
 Produced by Stats for Population Total Immigrants Change in Change in Immigrants Population Number Percent Population Number Percent 1991 - - - 1991 to 1996 - - - 1996 - - - 1996 to 1 - - - 1 - - - 1 to
COMMUNITY PROFILE BURNABY
 COMMUNITY PROFILE BURNABY Burnaby Demographics I Page 1 BURNABY IMMIGRANT DEMOGRAPHICS Your quick and easy look at facts and figures around immigration. Newcomers are an important and growing part of your
Victoria A City in Capital Regional District
 Produced by Stats for Global Non-Response Rate: 24.6 Population Total Immigrants Change in Change in Immigrants Population Number Percent Population Number Percent 1991 71,228 14,665 20.6 1991 to 1996
East Kootenay A Regional District in British Columbia
 Produced by Stats for Global Non-Response Rate: 35.5 Population Total Immigrants Change in Change in Immigrants Population Number Percent Population Number Percent 1991 52,368 5,9 11.3 1991 to 1996 3,998-55
Skeena-Queen Charlotte A Regional District in British Columbia
 Global NonResponse Rate: 34.7 Population Total Immigrants Change in Change in Immigrants Population Number Percent Population Number Percent 1991 24,287 3,125 12.9 1991 to 1996 58 27 8.6 1996 24,795 2,855
(Note: These are inititial neighbourhood estimates and are subject to change.) C N R. NEI Score. Female 54%
 C N R. NEI Score. Female 54%") 0-4 5-9 10-14 15-19 20-24 25-29 30-34 35-39 40-44 45-49 50-54 55-59 60-64 65-69 70-74 75-79 80-84 85-89 90-94 95-99 100+ 2011 Neighbourhood Demographic Estimates STANSBURY CRES MIDLAND AVE CITADEL DR WEST
0-4 5-9 10-14 15-19 20-24 25-29 30-34 35-39 40-44 45-49 50-54 55-59 60-64 65-69 70-74 75-79 80-84 85-89 90-94 95-99 100+ 2011 Neighbourhood Demographic Estimates STANSBURY CRES MIDLAND AVE CITADEL DR WEST
CENSUS ANALYSIS. St. BRENDAN s PARISH, FLEMINGTON 2011 Census Details
 CENSUS ANALYSIS The Pastoral Research Office of the Australian Catholic Bishops Conference, auspiced by the Australian Catholic University in Fitzroy, has in January released the 2011 census data for each
TOWNSHIP OF LANGLEY, B.C Township of Langley Immigrant Demographics I
 Immigrant demographics TOWNSHIP OF LANGLEY, B.C. - 2018 Township of Langley Immigrant Demographics I Page 1 TOWNSHIP OF LANGLEY IMMIGRANT DEMOGRAPHICS Your quick and easy look at facts and figures around
Corporate. Report COUNCIL DATE: April 28, 2008 NO: R071 REGULAR COUNCIL. TO: Mayor & Council DATE: April 28, 2008
 Corporate NO: R071 Report COUNCIL DATE: April 28, 2008 REGULAR COUNCIL TO: Mayor & Council DATE: April 28, 2008 FROM: General Manager, Planning and Development FILE: 6600-01 SUBJECT: 2006 Census Information
CENSUS RESULTS WARD 10 PROFILE
 2011 CENSUS RESULTS WARD 10 PROFILE Town of Halton Hills City of Brampton Hwy. 407 Finch Ave. Town of Milton Hwy. 407 ETR Ninth Line 10 Derry Rd. Winston Churchill Blvd. 9 Erin Mills Pkwy. Mississauga
COMMUNITY PROFILE COQUITLAM. Coquitlam Immigrant Demographics I Page 1
 COMMUNITY PROFILE COQUITLAM Coquitlam Demographics I Page 1 COQUITLAM IMMIGRANT DEMOGRAPHICS Your quick and easy look at facts and figures around immigration. Newcomers are an important and growing part
$58,761 ($93,586) 57% (29%) 8% (7%) 36% (15%)
 57% (29%) 8% (7%) 36% (15%)") CITY OF COMMUNITY PROFILES 2016 Census Data City of Surrey Statistics CITY WHALLEY GUILDFORD FLEETWOOD NEWTON CLOVERDALE AREA 548 ha (32,621 ha) AVERAGE HOUSEHOLD INCOME $58,761 ($93,586) SOUTH POPULATION
CITY OF COMMUNITY PROFILES 2016 Census Data City of Surrey Statistics CITY WHALLEY GUILDFORD FLEETWOOD NEWTON CLOVERDALE AREA 548 ha (32,621 ha) AVERAGE HOUSEHOLD INCOME $58,761 ($93,586) SOUTH POPULATION
Immigrant PORT COQUITLAM, B.C Port Coquitlam Immigrant Demographics I
 Immigrant demographics PORT COQUITLAM, B.C. - 2018 Immigrant Demographics I Page 1 PORT COQUITLAM IMMIGRANT DEMOGRAPHICS Your quick and easy look at facts and figures around immigration. Newcomers are
AVERAGE HOUSEHOLD INCOME $83,026 ($93,586) RENTERS 37% (29%) UNEMPLOYMENT RATE 7% (7%) TAKE TRANSIT TO WORK 20% (15%)
 RENTERS 37% (29%) UNEMPLOYMENT RATE 7% (7%) TAKE TRANSIT TO WORK 20% (15%)") CITY OF COMMUNITY PROFILES 2016 Census Data City of Surrey Statistics CITY CENTRE GUILDFORD FLEETWOOD NEWTON CLOVERDALE AREA 3,131 ha (32,621 ha) AVERAGE HOUSEHOLD INCOME $83,026 ($93,586) SOUTH POPULATION
CITY OF COMMUNITY PROFILES 2016 Census Data City of Surrey Statistics CITY CENTRE GUILDFORD FLEETWOOD NEWTON CLOVERDALE AREA 3,131 ha (32,621 ha) AVERAGE HOUSEHOLD INCOME $83,026 ($93,586) SOUTH POPULATION
North Okanagan A Regional District in British Columbia
 Population Total Immigrants Change in Change in Immigrants Population Number Percent Population Number Percent 1991 61,744 7,855 12.7 1991 to 1996 9,863 685 8.7 1996 71,67 8,54 11.9 1996 to 1 1,6-28 -
CENSUS RESULTS WARD 8 PROFILE
 2011 CENSUS RESULTS WARD 8 PROFILE Town of Halton Hills City of Brampton Hwy. 407 Finch Ave. Town of Milton Hwy. 407 ETR Ninth Line 10 Derry Rd. Winston Churchill Blvd. 9 Erin Mills Pkwy. Mississauga Rd.
Housing and Older Immigrants in Australia: Issues for the 21st Century
 Housing and Older Immigrants in Australia: Issues for the 21st Century Andrew Beer and Debbie Faulkner Centre for Housing, Urban and Regional Planning, University of Adelaide, 2 nd International Conference
Powell River A City in Powell River Regional District
 A City in Regional District Produced by Stats for Population Total Immigrants Change in Change in Immigrants Population Number Percent Population Number Percent 1991 12,991 1,965 15.1 1991 to 1996 14 4
COMMUNITY PROFILE TOWNSHIP OF LANGLEY. Township of Langley Immigrant Demographics I Page 1
 COMMUNITY PROFILE TOWNSHIP OF LANGLEY Township of Langley Demographics I Page 1 TOWNSHIP OF LANGLEY IMMIGRANT DEMOGRAPHICS Your quick and easy look at facts and figures around immigration. Newcomers are
CENSUS RESULTS WARD 3 PROFILE
 2011 CENSUS RESULTS WARD 3 PROFILE Town of Halton Hills City of Brampton Hwy. 407 Finch Ave. Town of Milton Hwy. 407 ETR Ninth Line 10 Derry Rd. Winston Churchill Blvd. 9 Erin Mills Pkwy. Mississauga Rd.
(Note: These are inititial neighbourhood estimates and are subject to change.) 1,000 Female 54%
 1,000 Female 54%") LAWRENCE AVE E 0-4 5-9 10-14 15-19 20-24 25-29 30-34 35-39 40-44 45-49 50-54 55-59 60-64 65-69 70-74 75-79 80-84 85-89 90-94 95-99 100+ 2011 Neighbourhood Demographic Estimates RAILSIDE RD C P R DON RIVER
LAWRENCE AVE E 0-4 5-9 10-14 15-19 20-24 25-29 30-34 35-39 40-44 45-49 50-54 55-59 60-64 65-69 70-74 75-79 80-84 85-89 90-94 95-99 100+ 2011 Neighbourhood Demographic Estimates RAILSIDE RD C P R DON RIVER
Osoyoos A Town in Okanagan-Similkameen Regional District
 A Town in OkanaganSimilkameen Regional District Produced by Stats for Global NonResponse Rate: 38.5 Population Total Immigrants Change in Change in Immigrants Population Number Percent Population Number
Salmon Arm A City in Columbia-Shuswap Regional District
 Produced by Stats for Global NonResponse Rate: 22.8 Population Total Change in Change in Population Number Percent Population Number Percent 1991 12,115 1,365 11.3 1991 to 1996 2,549 25 18.3 1996 14,664
IMMIGRANTS AND VISIBLE MINORITIES IN PEEL
 THE SOCIAL PLANNING COUNCIL OF PEEL ISSN #1198-5976 I n f o S h a r e VOLUME 11, NUMBER 1 MAY 2003 IMMIGRANTS AND VISIBLE MINORITIES IN PEEL Information on cultural diversity within a population is important
Creston A Town in Central Kootenay Regional District
 Produced by Stats for Global NonResponse Rate: 32.4 Population Total Immigrants Change in Change in Immigrants Population Number Percent Population Number Percent 1991 4,27 655 15.6 1991 to 1996 69 175
Quesnel A City in Cariboo Regional District
 Produced by Stats for Global NonResponse Rate:.4 Population Total Immigrants Change in Change in Immigrants Population Number Percent Population Number Percent 1991 8,8 1,35 16.4 1991 to 1996 26 5.4 1996
Port McNeill A Town in Mount Waddington Regional District
 Produced by Stats for Global NonResponse Rate: 35.1 Population Total Immigrants Change in Change in Immigrants Population Number Percent Population Number Percent 1991 2,641 225 8.5 1991 to 1996 284 5
a c d c Diversity in Victoria and Selected Victorian Hospitals An Overview of Country of Birth and Language Preference Data Vicky Totikidis
 a c d c acute care diversity collaboration, CEH Centre for Culture Ethnicity and Health Diversity in Victoria and Selected Victorian Hospitals An Overview of Country of Birth and Language Preference Data
Harrison Hot Springs A Village in Fraser Valley Regional District
 Global NonResponse Rate: 42.4 Population Total Immigrants Change in Change in Immigrants Population Number Percent Population Number Percent 1991 655 17 26. 1991 to 1996 243 3 17.6 1996 898 2 22.3 1996
Cache Creek A Village in Thompson-Nicola Regional District
 A Village in ThompsonNicola Regional District Produced by Stats for Global NonResponse Rate: 39.1 Population Total Immigrants Change in Change in Immigrants Population Number Percent Population Number
Visit our Publications and Open Data Catalogue to find our complete inventory of our freely available information products.
 Welcome to Mississauga Data This report and other related documents can be found at www.mississauga.ca/data. Mississauga Data is the official City of Mississauga website that contains urban planning related
People. Population size and growth
 The social report monitors outcomes for the New Zealand population. This section provides background information on who those people are, and provides a context for the indicators that follow. People Population
CENSUS RESULTS WARD 9 PROFILE
 2011 CENSUS RESULTS WARD 9 PROFILE Town of Halton Hills City of Brampton Hwy. 407 Finch Ave. Town of Milton Hwy. 407 ETR Ninth Line 10 Derry Rd. Winston Churchill Blvd. 9 Erin Mills Pkwy. Mississauga Rd.
CENSUS RESULTS WARD 6 PROFILE
 2011 CENSUS RESULTS WARD 6 PROFILE Town of Halton Hills City of Brampton Hwy. 407 Finch Ave. Town of Milton Hwy. 407 ETR Ninth Line 10 Derry Rd. Winston Churchill Blvd. 9 Erin Mills Pkwy. Mississauga Rd.
CENSUS RESULTS WARD 7 PROFILE
 2011 CENSUS RESULTS WARD 7 PROFILE Town of Halton Hills City of Brampton Hwy. 407 Finch Ave. Town of Milton Hwy. 407 ETR Ninth Line 10 Derry Rd. Winston Churchill Blvd. 9 Erin Mills Pkwy. Mississauga Rd.
Northern Rockies Regional Municipality A Regional Municipality in Northern Rockies Regional District
 Produced by Stats for Global NonResponse Rate: 39.2 Population Total Immigrants Change in Change in Immigrants Population Number Percent Population Number Percent 1991 1991 to 1996 1996 1996 to 21 21 21
Culturally and Linguistically Diverse Seniors in Western Australia: Trends and Issues
 Culturally and Linguistically Diverse Seniors in Western Australia: Trends and Issues Disclaimer: The information and advice within this document is provided voluntarily by the Office of Multicultural
Lake Country A District Municipality in Central Okanagan Regional District
 Produced by Stats for Population Total Immigrants Change in Change in Immigrants Population Number Percent Population Number Percent 1991 1991 to 1996 1996 9,7 1,275 14.2 1996 to 1 26 7 5.5 1 9,267 1,345
Canada at 150 and the road ahead A view from Census 2016
 Canada at 150 and the road ahead A view from Census 2016 Dr. Doug Norris Senior Vice President and Chief Demographer 2017 Environics Analytics User Conference November 8, 2017 Canada continues to lead
Parksville A City in Nanaimo Regional District
 Produced by Stats for Global NonResponse Rate: 2.3 Population Total Immigrants Change in Change in Immigrants Population Number Percent Population Number Percent 1991 7,381 1,27 17.2 1991 to 1996 2,91
Survey of Awareness, Use and Satisfaction of Human Services in York Region:
 Survey of Awareness, Use and Satisfaction of Human Services in York Region: Selected Preliminary Findings David Northrup Institute for Social Research Paul Anisef Department of Sociology York University
Alice According to You: A snapshot from the 2011 Census
 Research Brief 201301 Alice According to You: A snapshot from the 2011 Census Pawinee Yuhun, Dr Andrew Taylor & James Winter The Northern Institute Charles Darwin University (Image source: Alice Springs
Data Brief Vol. 1, No. 1
 Asian Americans and Pacific Islanders in the United States Aged 55 Years and Older: Population, Nativity, and Language Asian Americans and Pacific Islanders (AAPIs) are one of the fastest growing populations
Migrant Youth: A statistical profile of recently arrived young migrants. immigration.govt.nz
 Migrant Youth: A statistical profile of recently arrived young migrants. immigration.govt.nz ABOUT THIS REPORT Published September 2017 By Ministry of Business, Innovation and Employment 15 Stout Street
Crescent Town & Oakridge NEIGHBOURHOOD PROFILE: TAYLOR MASSEY
 & NEIGHBOURHOOD PROFILE: TAYLOR MASSEY February 2017 Neighbourhood Profile: Taylor Massey Located within the inner suburbs of, the Taylor Massey neighbourhood 1 is rich in its ethnic and cultural diversity.
Enderby A City in North Okanagan Regional District
 Produced by Stats for Global NonResponse Rate: 44.3 Population Total Immigrants Change in Change in Immigrants Population Number Percent Population Number Percent 1991 2,128 23.8 1991 to 1996 626 3 13.
FAQ 7: Why Origins totals and percentages differs from ONS country of birth statistics
 FAQ 7: Why totals and percentages differs from ONS country statistics 7 December 2016 Purpose of Information Note When the numbers and percentages of names by are compared with the numbers and percentages
CHAPTER I: SIZE AND GEOGRAPHICAL DISTRIBUTION OF THE POPULATION
 CHAPTER I: SIZE AND GEOGRAPHICAL DISTRIBUTION OF THE POPULATION 1. Trends in the Population of Japan The population of Japan is 127.77 million. It increased by 0.7% over the five-year period, the lowest
Changing Faces Profile of Burlington Newcomers. November 2010
 Changing Faces Profile of Burlington Newcomers November 2010 2010 Community Development Halton, all rights reserved. Copies of this document may be reproduced non-commercially for the purpose of community
Nelson A City in Central Kootenay Regional District
 Produced by Stats for Global NonResponse Rate: 28.3 Population Total Immigrants Change in Change in Immigrants Population Number Percent Population Number Percent 1991 8,849 1,175 13.3 1991 to 1996 736
Community Profile of Adelaide Metropolitan area
 Paper# : 2079 Session Title : GIS - Supporting Decisions in Public Policy Community Profile of Adelaide Metropolitan area By adipandang.yudono@postgrads.unisa.edu.au Abstract The paper presents a community
Highlands A District Municipality in Capital Regional District
 Produced by Stats for Global NonResponse Rate: 33 Population Total Immigrants Change in Change in Immigrants Population Number Percent Population Number Percent 1991 1,94 1991 to 1996 329 1996 1,423 21
Keelesdale-Eglinton West
 BLACK CREEK DR 0-4 5-9 10-14 15-19 20-24 25-29 30-34 KEELE ST 35-39 40-44 45-49 50-54 -59 KANE AVE 60-64 65-69 70-74 75-79 80-84 85-89 90-94 95-99 100+ 2011 Neighbourhood Demographic Estimates EGLINTON
The Demography of the Territory s
 The Demography of the Territory s Midtowns : Jabiru (Issue No.201401) The Northern Institute, 2013: This material is submitted for peer review. Correct citation is necessary. KEY FINDINGS The West Arnhem
Immigrant Seniors in British Columbia
 Immigrant Seniors in British Columbia December 2010 Immigrant Seniors in British Columbia Most people who immigrate as seniors come to B.C. to reunite with their families. In fact, 86.2% of the 5,733 new
Australian Catholic Bishops Conference Pastoral Research Office
 Australian Bishops Conference Pastoral Research Office Mass attendance in Australia: A critical moment A report based on the National Count of Attendance, the National Church Life Survey and the Australian
A Multicultural Northern Territory Statistics from the 2016 Census (and more!) Andrew Taylor and Fiona Shalley
 Andrew Taylor and Fiona Shalley") A Multicultural Northern Territory Statistics from the 2016 Census (and more!) Andrew Taylor and Fiona Shalley Todays discussion Part I Background and the NT s multicultural make-up Part II Key statistics,
A Multicultural Northern Territory Statistics from the 2016 Census (and more!) Andrew Taylor and Fiona Shalley Todays discussion Part I Background and the NT s multicultural make-up Part II Key statistics,
Immigration and Ethno-Cultural Diversity
 2016 London Census: Fact Sheet 7 Immigration and Ethno-Cultural Diversity On October 25, 2017 Statistics Canada released the 2016 Census data on Immigration and Ethno-Cultural Diversity. This summary highlights
DEMOGRAPHICS IN CANADIAN SOCIETY. Unit 2
 DEMOGRAPHICS IN CANADIAN SOCIETY Unit 2 WHAT I M LEARNING TODAY Explore how Canada s diversity impacts how society functions Understand how money and power influence who is in control of society Explore
Levels and trends in international migration
 Levels and trends in international migration The number of international migrants worldwide has continued to grow rapidly over the past fifteen years reaching million in 1, up from million in 1, 191 million
Economic Activity in London
 CIS2013-10 Economic Activity in London September 2013 copyright Greater London Authority September 2013 Published by Greater London Authority City Hall The Queens Walk London SE1 2AA www.london.gov.uk
February 1, William T Fujioka, Chief Executive Officer. Dean C. Logan, Registrar-Recorder/County Clerk
 January 31, 2012 Page 1 of 13 TO: Supervisor Zev Yaroslavsky, Chair Supervisor Gloria Molina Supervisor Mark Ridley-Thomas Supervisor Don Knabe Supervisor Michael D. Antonovich William T Fujioka, Chief
Mapping migrants: Australians wide-ranging experiences of immigration
 No. 13 December 2018 Mapping migrants: Australians wide-ranging experiences of immigration Charles Jacobs Mapping migrants: Australians wide-ranging experiences of immigration Charles Jacobs POLICY Paper