The Planning & Development Department recommends that Council receive this report for information.
|
|
|
- Wendy Wheeler
- 5 years ago
- Views:
Transcription

1 CORPORATE REPORT NO: R237 COUNCIL DATE: November 19, 2018 REGULAR COUNCIL TO: Mayor & Council DATE: November 15, 2018 FROM: General Manager, Planning & Development FILE: SUBJECT: Surrey Community Profiles 2016 Census Data RECOMMENDATION The Planning & Development Department recommends that Council receive this report for information. INTENT The intent of this report is to provide a demographic profile of each of Surrey s distinct communities created from the 2016 Canadian Census ( the census ). BACKGROUND Every five years Statistics Canada conducts a Census of Canada. The census provides demographic and statistical data that is used to plan public services and support evidence-based decision-making. It provides guidance for the planning of future amenities, housing, schools, transportation infrastructure, as well as social, recreational and public safety policies and programs that affect all Surrey residents. The most recent census was conducted May 10, Since that time, Statistics Canada has released all of the data variables, including detailed information on population, demographics, dwellings, language, culture, mobility, education, and employment. On January 18, 2018, Council received Corporate Report No. R015; 2018 (attached as Appendix I ) which provided general citywide highlights from the 2016 census. Following that report, staff have undertaken additional analysis of available data to understand Surrey communities and to inform planning decisions. Similar analysis and community profiles were undertaken following the 2006 Census and 2011 National Household Survey. DISCUSSION A community profile is a demographic snapshot that provides an overview of key statistics and trends. It is used by City staff, residents, and the business community to inform decisions about living, working, and investing in Surrey. Seven community profiles have been created for each of Surrey s communities: Whalley, City Centre, Guildford, Fleetwood, Newton, Cloverdale and South Surrey. An additional city-wide profile has also been created which compares Surrey s demographics with that of the Metro Vancouver region. These profiles are attached as Appendices II through IX to this report.
2 - 2 - The document created for each community profile is organized in a user-friendly format with accessible infographics and visuals, enabling easy referencing and comparison between communities. Each profile includes a summary page with highlights of the community, followed by nine thematic content sections: Population and Families; Immigration; Language; Indigenous; Housing; Inc0me; Education; Labour Force; and Journey to Work. Community profiles will be made available publically via the City s website shortly following Council receiving this information. CONCLUSION Data from the 2016 Census will be used to inform, support, and guide City strategies, policy frameworks, and program development. It will also be used by residents, community groups, and the business community to guide decision-making that will impact Surrey residents. The attached community profiles have been created to support user-friendly access to census data. These profiles will be made available publically via the City s website. Original signed by Jean Lamontagne General Manager, Planning & Development PH/PK/ar Appendix I Corporate Report No. R015; 2018 Appendix II Surrey Community Profile Appendix III City Centre Community Profile Appendix IV Cloverdale Community Profile Appendix V Fleetwood Community Profile Appendix VI Guildford Community Profile Appendix VII Newton Community Profile Appendix VIII South Surrey Community Profile Appendix IX Whalley Community Profile c:\users\ar4\appdata\roaming\opentext\otedit\ec_eim\c \surrey community profiles 2016 census data.docx :42 PM ar
3 Appendix "I"
4
5
6
7
8
9
10
11
12
13
14
15
16
17
18 Appendices available upon request.
 OCCUPIED PRIVATE DWELLINGS 169,970 (960,895) Metro Vancouver statistics in brackets.")
19 Appendix "II" CITY OF CITY PROFILE 2016 Census Data City of Surrey Statistics AREA 32,621 ha (228,268 ha) AVERAGE HOUSEHOLD INCOME $93,586 ($96,423) POPULATION 517,885 (2,463,431) IMMIGRANT POPULATION 43% (40%) OCCUPIED PRIVATE DWELLINGS 169,970 (960,895) Metro Vancouver statistics in brackets. JOB CENTRE RENTERS 29% (36%) UNEMPLOYMENT RATE 7% (6%) TAKE TRANSIT TO WORK 15% (20%) Due to rounding, figures may be slightly lower or higher than stated and percentages may not add up to 100%. Surrey is one of 21 municipalities that along with one electoral area and one Treaty First Nation make up Metro Vancouver. Among these 23 local authorities Surrey is largest in land area and second most populous after the City of Vancouver. Surrey comprises urban areas as well as significant agricultural and rural areas. The City of Surrey is located centrally within Metro Vancouver on the south side of the Fraser River and shares a border with the United States of America to the south.
20 POPULATION & FAMILIES POPULATION In 2016, the population of Surrey was 517,885 or 21% of Metro Vancouver s total population (2,463,431). METRO VANCOUVER 2,463,431 (100%) 517,885 (21%) METRO VANCOUVER POPULATION BY FAMILY SIZE Overall in 2016, Surrey had a larger percentage of families that consisted of 3 or more people than Metro Vancouver. 48% of families in Metro Vancouver consisted of just 2 people, compared with 42% in Surrey. By comparison, 35% of Surrey families consisted of 4 or more people, compared with 29% in Metro Vancouver. METRO VANCOUVER 48% 42% 23% 23% 22% 25% 7% 10% 2 PERSONS 3 PERSONS 4 PERSONS 5 PERSONS 2 CITY OF PROFILE 2016 CENSUS DATA AND CITY OF STATISTICS
21 - 3 - POPULATION GROWTH Metro Vancouver s population grew by 7% between 2011 and This was down from a previous high of 9% between 2006 and This was much lower than Surrey s growth rates. The city s population grew by 11% between 2011 and 2016, down from 19% between 2006 and Population growth between 2011 and % 11% METRO VANCOUVER POPULATION BY AGE GROUP In 2016, the composition of Surrey s and Metro Vancouver s populations was quite similar. The one age group where there was a noticeable difference was the 0-19 age group. 20% of Metro Vancouver s population fell into this category, compared with 25% in Surrey. 50% METRO VANCOUVER 42% 41% 40% Percentage of Total Population 30% 20% 10% 0% 25% 20% % 20% % 14% 65+ Age Groups CITY OF PROFILE: 2016 CENSUS DATA AND CITY OF STATISTICS 3
22 IMMIGRATION TOP 4 ETHNIC GROUPS In 2016, 51% of the population in Metro Vancouver was Caucasian. This was much higher than Surrey, where 42% of the population was Caucasian. *South Asian includes East Indian, Pakistani, Sri Lankan, etc. Chinese 20% Other 12% Caucasian 51% South Asian* 12% Filipino 5% Other 11% Filipino 6% Caucasian 42% Chinese 8% South Asian* 33% METRO VANCOUVER IMMIGRANTS * BY PERIOD OF IMMIGRATION In 2016, 142,535 Metro Vancouver residents were considered recent immigrants having immigrated to Canada between 2011 and At the same time there were 36,335 recent immigrants living in Surrey. * Immigrants include all residents who have been granted the right to live in Canada permanently by immigration authorities. METRO VANCOUVER 209,975 37, ,730 25, ,835 52, ,470 68, ,535 36,335 IMMIGRATION POPULATION BEFORE CITY OF PROFILE 2016 CENSUS DATA AND CITY OF STATISTICS
23 -5- TOP 5 PLACES OF ORIGIN OF RECENT IMMIGRANTS In 2016, the top place of origin of recent immigrants to Metro Vancouver was China (25%). By comparison, the top place of origin of recent immigrants to Surrey was India (41%). * Recent immigrants represent those residents who became a landed immigrant between January 2011 and Census Day on May 13, 2016 CHINA 25% IRAN 6% SOUTH KOREA 5% INDIA 15% PHILIPPINES 14% METRO VANCOUVER Map illustrates the top five places of origin of recent immigrants living in Metro Vancouver in 2016, which equates to 65% of recent immigrants. The remaining 35% were not mapped. IRAQ 3% CHINA 13% INDIA 41% SOUTH KOREA 3% PHILIPPINES 15% Map illustrates the top five places of origin of recent immigrants living in Surrey in 2016, which equates to 75% of recent immigrants. The remaining 25% were not mapped. CITY OF PROFILE: 2016 CENSUS DATA AND CITY OF STATISTICS 5
24 LANGUAGE MOST COMMON LANGUAGE SPOKEN AT HOME In 2016, 72% of Metro Vancouver s residents spoke English at home, higher than Surrey where only 66% spoke English. Other Languages 10% Korean 1% Punjabi (Panjabi) 5% English 72% Mandarin 6% Cantonese 6% METRO VANCOUVER Mandarin 4% Tagalog (Pilipino, Filipino) 2% English 66% Other Languages 9% Hindi 2% Punjabi (Panjabi) 17% 6 CITY OF PROFILE 2016 CENSUS DATA AND CITY OF STATISTICS
25 - 7 - LANGUAGE INDIGENOUS & EDUCATION INDIGENOUS POPULATION BY COMMUNITY In 2016, there were 61,455 people that identified as aboriginal* living in Metro Vancouver. Of those 13,460 or 22% lived in Surrey. * Aboriginal Identity refers to persons who report being Aboriginal, which includes First Nations, Métis or Inuit and/or Registered or Treaty Indian, and/or a member of a First Nations or Indian Band. METRO VANCOUVER 61,455 (100%) 13,460 (22%) METRO VANCOUVER PERCENTAGE OF TOTAL POPULATION THAT IS INDIGENOUS In 2016, the percentage of Metro Vancouver s and Surrey s population that was indigenous was 3%. METRO VANCOUVER 3% 3% CITY OF PROFILE: 2016 CENSUS DATA AND CITY OF STATISTICS 7
26 HOUSING NUMBER OF EACH TYPE OF DWELLING UNIT In 2016, single family homes remained the dominant residential building type in Metro Vancouver and in Surrey. In 2016 there were 444,685 single and two family dwellings in Metro Vancouver, which represented 46% of all private dwellings. This was much lower than in Surrey, where 58% (99,235) of the private dwellings were single family in TYPE Single Family Dwelling Row/Townhouses Low Rise Apartments High Rise Apartments METRO VANCOUVER 46% (444,685) 12% (113,945) 25% (242,205) 17% (160,060) 58% (99,060) 18% (30,440) 20% (34,520) 4% (5,950) Total Dwellings Units 960, ,970 TENURE Ownership remained the predominant form of tenure in Metro Vancouver and in Surrey. In 2016, 64% of Metro Vancouver residents owned their home, compared with 71% in Surrey. However, in Metro Vancouver and in Surrey the percentage of renters increased as ownership decreased between 2006 and In Metro Vancouver, the percentage of households who rented increased from 35% to 36% and from 25% to 29% in Surrey. METRO VANCOUVER Percentage of Each Type of Tenure 100% 90% 80% 70% 60% 50% 40% 30% 20% 10% 0% 36% 29% Renters Between , the percentage of households who owned decreased and the percentage who rented increased in Surrey and Metro Vancouver. 64% 71% Owners 8 CITY OF PROFILE 2016 CENSUS DATA AND CITY OF STATISTICS
27 - 9 - AVERAGE VALUE OF DWELLINGS The average value of dwellings* continued to increase in Metro Vancouver and in Surrey between 2006 and In 2016, the average value of a dwelling in Metro Vancouver was $1,005,920 compared with $757,863 in Surrey. * The average value of a dwelling refers to the value of the entire dwelling, including the value of the land it is on and of any other structure, such as a garage, which is on the property. If the dwelling is located in a building which contains several dwellings, or a combination of residential and business premises, all of which the household owns, the value is estimated as a portion of the market value that applies only to the dwelling in which the household resides. METRO VANCOUVER $520,937 $446,307 $691,550 $544,819 $1,005,920 $757, HOUSING AFFORDABILITY In Canada, housing is considered unaffordable if it costs more than 30% of a household s before-tax income. In 2016, 44% of renters in Metro Vancouver and 37% in Surrey spent more than 30% of their income on rent. In comparison, 25% of home owners in Metro Vancouver and in Surrey spent 30% or more of their household income on housing. Unaffordable to Own Unaffordable to Rent Owner households who spent more than 30% of their household income on housing. 25% 25% METRO VANCOUVER 44% 37% Renter households who spent more than 30% of their household income on rent. OWNERS RENTERS CITY OF PROFILE: 2016 CENSUS DATA AND CITY OF STATISTICS 9
28 INCOME AVERAGE HOUSEHOLD INCOME In 2015, the average household income in Metro Vancouver was $96,423 and $93,586 in Surrey. METRO VANCOUVER $96,423 $93,586 METRO VANCOUVER AVERAGE INCOME BY HOUSEHOLD TYPE In 2015 the family type with the highest average household income* was couples with children, with an income of $135,322 in Metro Vancouver and $119,698 in Surrey. For each census family type, the average income in Metro Vancouver was higher than those for Surrey. TYPE METRO VANCOUVER Couple Families Without Children $109,780 $95,517 Couple Families with Children $135,322 $119,698 Lone-Parent Families $67,562 $62,818 Persons 15 Years and Over Not in Families $43,593 $39,475 All Households $96,423 $93,586 * Household income is the sum of the total income of all members of the household. Income data for families refers to all persons living in the same home who are related by blood, marriage, common-law or adoption. 10 CITY OF PROFILE 2016 CENSUS DATA AND CITY OF STATISTICS
29 INCOME DISTRIBUTION In 2015, the breakdown of incomes were fairly similar in Metro Vancouver and in Surrey. The most noticeable difference was the percentage of household incomes under $30,000 with 19% of Metro Vancouver households in this category compared with 15% in Surrey. 50% METRO VANCOUVER 40% Percentage of Households 30% 20% 10% 0% 19% 15% under $30,000 22% 23% 24% 26% 18% 20% 17% 16% $30,00-59,999 $60,000-99,999 $100, ,000 $150,000+ PERSONS IN LOW INCOME In 2015, 16% of Metro Vancouver s and 15% of Surrey s population were considered low income*. *Persons in low income are based on the Low-Income Measure, After Tax, (LIM-AT). METRO VANCOUVER 398,715 (16%) METRO VANCOUVER 75,595 (15%) CITY OF PROFILE: 2016 CENSUS DATA AND CITY OF STATISTICS 11
30 EDUCATION HIGHEST LEVEL OF EDUCATION ATTAINED Overall in 2016, a larger percentage of Metro Vancouver s population had completed higher levels of education than those in Surrey. 37% of Metro residents had a university certificate, diploma or degree, compared with 27% in Surrey. University certificate diploma or degree at bachelor level or above 34% No certificate, diploma or degree 14% METRO VANCOUVER High school diploma or equivalent 29% College or other non-university certificate or diploma 17% Apprenticeship or trades certificate or diploma 6% University certificate diploma or degree at bachelor level or above 27% No certificate, diploma or degree 12% High school diploma or equivalent 30% College or other non-university certificate or diploma 24% Apprenticeship or trades certificate or diploma 7% 12 CITY OF PROFILE 2016 CENSUS DATA AND CITY OF STATISTICS
31 LABOUR FORCE TOP 5 MAJOR OCCUPATIONS The breakdown of occupations in Metro Vancouver in 2016 was fairly similar to the breakdown for Surrey. 30% 25% 25% 26% 24% 23% METRO VANCOUVER Percentage of Employed Labour Force 20% 15% 10% 5% 0% Sales and service occupations 12% 9% Mangement occupations 16% 14% Business finance and adminstration occupations 11% 9% Occupations in education, law and social, community and government services 12% 19% Trades, transport and equipment operators and related occupations All other occupations Employment The overall labour force participation rate* in Metro Vancouver and in Surrey in 2016 was 66%. Self-Employed In 2016, 14% (180,510) of the employed labour force in Metro Vancouver was self-employed, compared with 12% (31,800) in Surrey. Unemployment Rate In 2016, 6% (78,620) of those participating in the labour force in Metro Vancouver were unemployed. This was lower than the unemployment rate for Surrey, which was 7% (17,810). JOB CENTRE 66% 14% 6% METRO VANCOUVER METRO VANCOUVER METRO VANCOUVER 66% 12% 7% * Participation Rate refers to the labour force, both employed and unemployed individuals, in the week of Sunday, May 1 to Saturday, May 7, 2016, expressed as a percentage of the population aged 15 years and over. CITY OF PROFILE: 2016 CENSUS DATA AND CITY OF STATISTICS 13
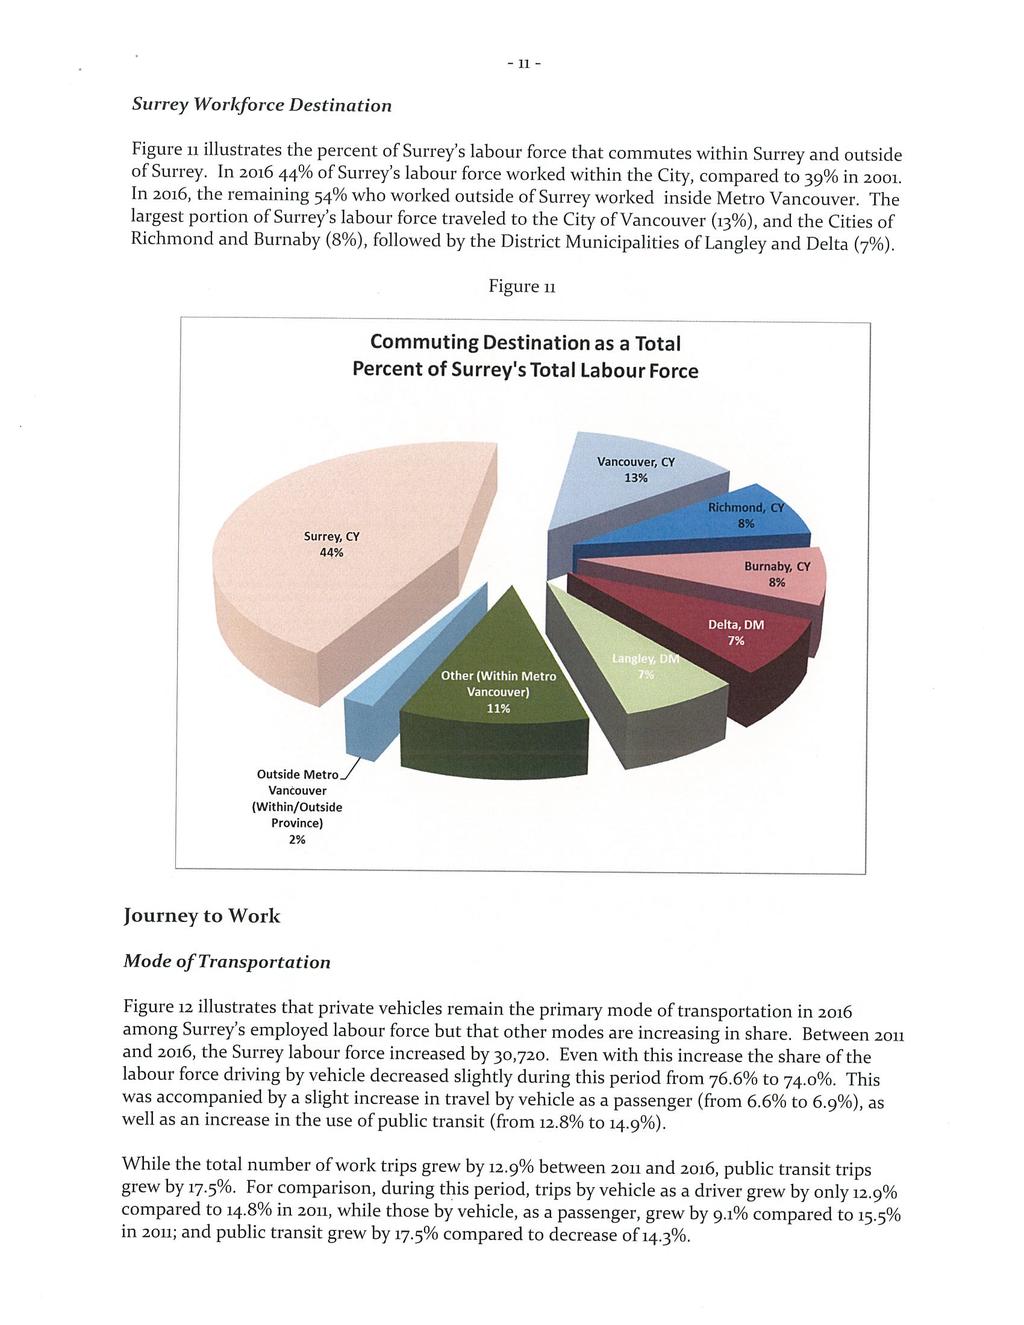
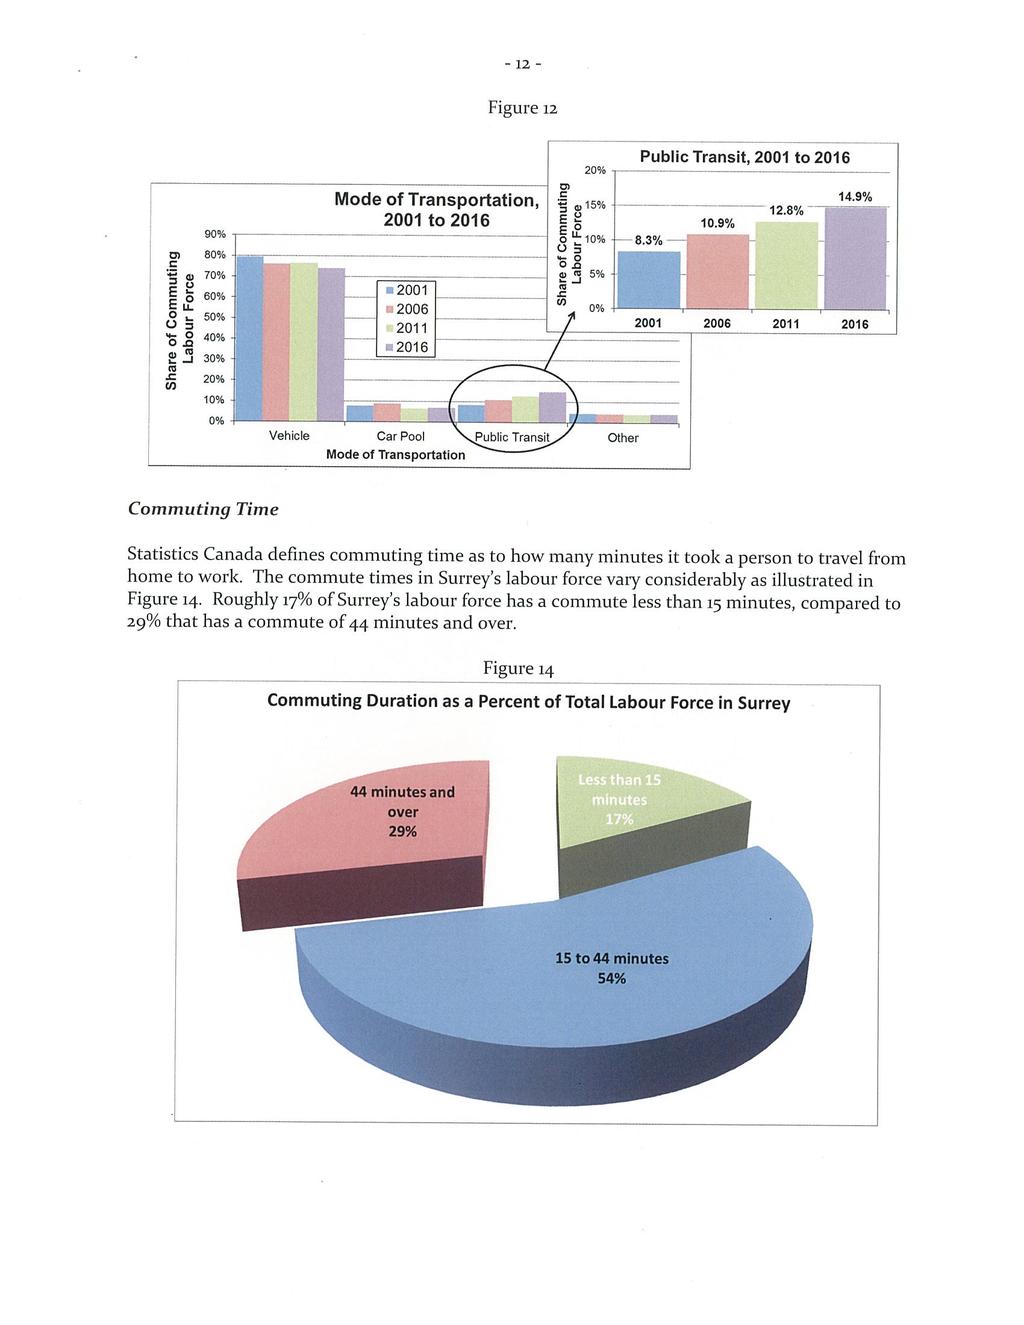
32 JOURNEY TO WORK GETTING TO WORK In 2016 driving remained the predominant mode of transportation to work. In 2016, 69% of Metro Vancouver residents drove to work, which was quite a bit lower than in Surrey where 81% of residents drove to work. WALKED OR CYCLED 10% (119,375) 4% (10,125) METRO VANCOUVER DROVE CAR 69% (803,860) 81% (193,255) METRO VANCOUVER USED PUBLIC TRANSIT 20% (235,985) 15% (35,560) METRO VANCOUVER 14 CITY OF PROFILE 2016 CENSUS DATA AND CITY OF STATISTICS
33 COMMUTE TIME FOR WORK In 2016, half of the workforce in Metro Vancouver commuted less 30 minutes and the other half commuted more than 30 minutes to work. This was similar to Surrey, where 46% commuted less 30 minutes and 54% commuted more than 30 minutes to work. LESS THAN 30 MINUTES 30 TO 59 MINUTES 60 MINUTES AND OVER 50% 39% 11% 46% 38% 16% METRO VANCOUVER PLACE OF WORK STATUS In 2016, 8% (104,865) of the employed labour force in Metro Vancouver and 6% (16,085) in Surrey worked from home. WORKED FROM HOME 8% (104,865) 6% (16,085) METRO VANCOUVER CITY OF PROFILE: 2016 CENSUS DATA AND CITY OF STATISTICS 15
34 - 16 -
 SOUTH POPULATION 26,945 (517,885) IMMIGRANT POPULATION 30% (43%) OCCUPIED PRIVATE DWELLINGS 12,100 (169,970) City of Surrey statistics in brackets JOB CENTRE RENTERS 57%")
35 Appendix "III" CITY CENTRE CITY OF COMMUNITY PROFILES 2016 Census Data City of Surrey Statistics CITY CENTRE WHALLEY GUILDFORD FLEETWOOD NEWTON CLOVERDALE AREA 548 ha (32,621 ha) AVERAGE HOUSEHOLD INCOME $58,761 ($93,586) SOUTH POPULATION 26,945 (517,885) IMMIGRANT POPULATION 30% (43%) OCCUPIED PRIVATE DWELLINGS 12,100 (169,970) City of Surrey statistics in brackets JOB CENTRE RENTERS 57% (29%) UNEMPLOYMENT RATE 8% (7%) TAKE TRANSIT TO WORK 36% (15%) Due to rounding, figures may be slightly lower or higher than stated and percentages may not add up to 100%. Surrey City Centre is in the midst of a significant transformation; what was once a suburban town centre is developing into a walkable transit-oriented downtown core for business, culture and entertainment activity. City Centre is bookended between 132 Street and 140 Street to the west and east, and extends as far north as 112 Avenue and as far south as 94th Avenue.
36 POPULATION & FAMILIES POPULATION In 2016, the population of City Centre was 26,945, 5% of Surrey s total population. : 517,885 (100%) CITY CENTRE 26,945 (5%) CITY CENTRE POPULATION BY FAMILY SIZE The breakdown of family sizes in City Centre in 2016 was quite different than the breakdown for Surrey. In 2016, 55% of families in City Centre consisted of 2 people, much higher than the percentage citywide, (42%). Similarly, 15% of families in City Centre consisted of 4 people, much lower than the percentage citywide (25%). CITY CENTRE 55% 42% 23% 23% 15% 25% 7% 10% 2 PERSONS 3 PERSONS 4 PERSONS 5 PERSONS 2 CITY CENTRE COMMUNITY PROFILE: 2016 CENSUS DATA AND CITY OF STATISTICS
37 - 3 - POPULATION GROWTH City Centre s population grew by 18% between 2011 and This was down from a previous high of 31% between 2006 and This was much higher than the rate of growth citywide, which grew 11% between 2011 and 2016, down from 19% between 2006 and Population growth between 2011 and % 11% CITY CENTRE POPULATION BY AGE GROUP In 2016, 17% of City Centre s population was 0-19, much lower than the percentage for Surrey, which was 25%. In comparison, 29% of City Centre s population was 20-34, much higher than the percentage for Surrey, which was 20%. 50% CITY CENTRE 40% 41% 41% Percentage of Total Population 30% 20% 10% 0% 25% 17% % % % 14% 65+ Age Groups CITY CENTRE COMMUNITY PROFILE: 2016 CENSUS DATA AND CITY OF STATISTICS 3
38 IMMIGRATION TOP 4 ETHNIC GROUPS In 2016, 43% of the population in City Centre and 42% citywide were Caucasian. *South Asian includes East Indian, Pakistani, Sri Lankan, etc. Other 21% Chinese 11% Caucasian 43% South Asian* 14% Filipino 11% Other 11% Filipino 6% Caucasian 42% Chinese 8% South Asian* 33% CITY CENTRE IMMIGRANTS * BY PERIOD OF IMMIGRATION In 2016, 2,085 of City Centre s residents were considered recent immigrants having immigrated to Canada between 2011 and At the same time there were 36,335 recent immigrants living citywide in Surrey. * Immigrants include all residents who have been granted the right to live in Canada permanently by immigration authorities. 1,305 37,055 CITY CENTRE 1,245 25,490 2,880 52,570 4,225 68,705 2,085 36,335 IMMIGRATION POPULATION BEFORE CITY CENTRE COMMUNITY PROFILE: 2016 CENSUS DATA AND CITY OF STATISTICS
39 -5- TOP 5 PLACES OF ORIGIN OF RECENT IMMIGRANTS In 2016, the top place of origin of recent immigrants to City Centre was the Philippines (25%). By comparison, the top place of origin of recent immigrants to the City was India (41%). * Recent immigrants represent those residents who became a landed immigrant between January 2011 and Census Day on May 13, 2016 AFGHANISTAN 2% CHINA 12% INDIA 14% SOUTH KOREA 9% PHILIPPINES 25% CITY CENTRE Map illustrates the top five places of origin of recent immigrants living in City Centre in 2016, which equates to 62% of recent immigrants. The remaining 38% were not mapped. IRAQ 3% CHINA 13% INDIA 41% SOUTH KOREA 3% PHILIPPINES 15% Map illustrates the top five places of origin of recent immigrants living in Surrey in 2016, which equates to 75% of recent immigrants. The remaining 25% were not mapped. CITY CENTRE COMMUNITY PROFILE: 2016 CENSUS DATA AND CITY OF STATISTICS 5
40 LANGUAGE MOST COMMON LANGUAGE SPOKEN AT HOME In 2016, 68% of City Centre residents spoke English at home, similar to the city where 66% spoke English. Korean 3% Mandarin 6% Other Languages 15% English 68% Punjabi (Panjabi) 4% Tagalog (Pilipino, Filipino) 4% CITY CENTRE Mandarin 4% Tagalog (Pilipino, Filipino) 2% English 66% Other Languages 9% Hindi 2% Punjabi (Panjabi) 17% 6 CITY CENTRE COMMUNITY PROFILE: 2016 CENSUS DATA AND CITY OF STATISTICS
41 LANGUAGE INDIGENOUS & EDUCATION INDIGENOUS POPULATION BY COMMUNITY In 2016, there were 13,460 people that identified as aboriginal* living in Surrey. Of those 1,230 or 5% lived in City Centre * Aboriginal Identity refers to persons who report being Aboriginal, which includes First Nations, Métis or Inuit and/or Registered or Treaty Indian, and/or a member of a First Nations or Indian Band. WHALLEY: EXCLUDING CITY CENTRE 2,280 CITY CENTRE 1,230 GUILDFORD 1,575 FLEETWOOD 1,240 NEWTON 3,280 CLOVERDALE 2,295 SOUTH 1,565 PERCENTAGE OF TOTAL POPULATION THAT IS INDIGENOUS In 2016, the percentage of City Centre s population that was aboriginal was 5% compared to 3% for the city. CITY CENTRE 5% 3% CITY CENTRE COMMUNITY PROFILE: 2016 CENSUS DATA AND CITY OF STATISTICS 7
42 HOUSING NUMBER OF EACH TYPE OF DWELLING UNIT In 2016, the majority of dwelling units in City Centre were low and high rise apartment units. In 2016 there were 9,345 apartment units, which represented 77% of the private dwellings. This was significantly higher than the total percentage of apartment units citywide, which was 24% (40,615). TYPE CITY CENTRE Single Family Dwelling Row/Townhouses Low Rise Apartments High Rise Apartments 15% (1,770) 8% (1,020) 40% (4,810) 37% (4,500) 58% (99,060) 18% (30,440) 20% (34,520) 4% (5,950) Total Dwellings Units 12, ,970 TENURE In City Centre, the majority of households rented rather than owned in % of City Centre residents owned their home, compared with 71% for the City. Between 2006 and 2016, the percentage of households who owned decreased while the percentage of households who rented increased. In City Centre, the percentage of households who rented increased from 50% to 57% and Citywide from 25% to 29% between 2006 and CITY CENTRE Percentage of Each Type of Tenure 100% 90% 80% 70% 60% 50% 40% 30% 20% 10% 0% 57% 29% Renters Between , the percentage of households who owned decreased and the percentage who rented increased in City Centre and citywide. 43% 71% Owners 8 CITY CENTRE COMMUNITY PROFILE: 2016 CENSUS DATA AND CITY OF STATISTICS
43 - 9 - AVERAGE VALUE OF DWELLINGS The average value of dwellings* continued to increase in City Centre and citywide between 2006 and In 2016, the average value of a dwelling in City Centre was $360,013, compared with $757,863 citywide. *The average value of a dwelling refers to the value of the entire dwelling, including the value of the land it is on and of any other structure, such as a garage, which is on the property. If the dwelling is located in a building which contains several dwellings, or a combination of residential and business premises, all of which the household owns, the value is estimated as a portion of the market value that applies only to the dwelling in which the household resides. CITY CENTRE $246,526 $446,307 $299,216 $544,819 $360,013 $757, HOUSING AFFORDABILITY In Canada, housing is considered unaffordable if it costs more than 30% of a household s before-tax income. In 2016, 43% of renters in City Centre and 37% citywide spent more than 30% of their income on rent. In comparison 30% of home owners in City Centre and 25% citywide spent 30% or more of their household income on housing. Unaffordable to Own Unaffordable to Rent Owner households who spent more than 30% of their household income on housing. 30% 25% CITY CENTRE 43% 37% Renter households who spent more than 30% of their household income on rent. OWNERS RENTERS CITY CENTRE COMMUNITY PROFILE: 2016 CENSUS DATA AND CITY OF STATISTICS 9
44 INCOME AVERAGE HOUSEHOLD INCOME In 2015, the average household income in City Centre was $58,761, which was much lower than the city s average income ($93,586). WHALLEY: EXCLUDING CITY CENTRE $83,026 CITY CENTRE $58,761 GUILDFORD $87,256 FLEETWOOD $97,637 NEWTON $90,049 CLOVERDALE $103,177 SOUTH $115,119 AVERAGE INCOME BY HOUSEHOLD TYPE In 2015 in City Centre, the family type with the highest average household income* was couples with children, with an income of $80,853. For each family type, the average income in City Centre was much lower than those for the city. TYPE CITY CENTRE Couple Families Without Children $72,955 $95,517 Couple Families with Children $80,853 $119,698 Lone-Parent Families $52,596 $62,818 Persons 15 Years and Over Not in Families $35,079 $39,475 All Households $58,761 $93,586 * Household income is the sum of the total income of all members of the household. Income data for families refers to all persons living in the same home who are related by blood, marriage, common-law or adoption. 10 CITY CENTRE COMMUNITY PROFILE: 2016 CENSUS DATA AND CITY OF STATISTICS
45 INCOME DISTRIBUTION In 2015, the percentage of households in City Centre with an income of more than $150,000 was 3%, much less than the city with 16%. 30% 28% 31% 27% 26% CITY CENTRE 25% 23% 20% Percentage of Households 20% 15% 10% 5% 0% 15% under $30,000 $30,00-59,999 $60,000-99,999 11% $100, ,000 16% 3% $150,000+ PERSONS IN LOW INCOME In 2015, about 1 in 4 people, or 25% of the population in City Centre were considered to be low income*. This was much higher than the percentage for the city, which was 15%. *Persons in low income are based on the Low-Income Measure, After Tax, (LIM-AT). CITY CENTRE 6,510 persons (25%) GUILDFORD WHALLEY FLEETWOOD NEWTON CLOVERDALE 75,595 persons (15%) SOUTH CITY CENTRE COMMUNITY PROFILE: 2016 CENSUS DATA AND CITY OF STATISTICS 11
46 EDUCATION HIGHEST LEVEL OF EDUCATION ATTAINED In 2016, 27% of the City s and the City Centre s population aged 25 to 64 had a university degree. University certificate diploma or degree at bachelor level or above 27% No certificate, diploma or degree 13% CITY CENTRE High school diploma or equivalent 26% College or other non-university certificate or diploma 26% Apprenticeship or trades certificate or diploma 8% University certificate diploma or degree at bachelor level or above 27% No certificate, diploma or degree 12% High school diploma or equivalent 30% College or other non-university certificate or diploma 24% Apprenticeship or trades certificate or diploma 7% 12 CITY CENTRE COMMUNITY PROFILE: 2016 CENSUS DATA AND CITY OF STATISTICS
47 LABOUR FORCE MAJOR OCCUPATIONS The breakdown of occupations in City Centre in 2016 was very similar to the breakdown for Surrey. 30% 27% 26% 25% CITY CENTRE Percentage of Employed Labour Force 20% 15% 10% 5% 0% Sales and service occupations 7% 10% Mangement occupations 15% 15% Business finance and adminstration occupations 7% 9% Occupations in education, law and social, community and government services 19% 17% Trades, transport and equipment operators and related occupations 7% 5% Natural and applied sciences and related occupations 16% 16% All other occupations Employment In 2016, the overall labour force participation rate* in City Centre was 68%, very similar to the city at 66%. Self-Employed In 2016, 8% (1,185) of the employed labour force in City Centre were self-employed, compared with 12% (31,800) citywide. Unemployment Rate In 2016, 8% of those participating in the labour force in City Centre were unemployed. This was higher than the percentage for the city, which was 7%. JOB CENTRE 68% CITY CENTRE 8% CITY CENTRE 8% CITY CENTRE 66% 12% 7% * Participation Rate refers to the labour force, both employed and unemployed individuals, in the week of Sunday, May 1 to Saturday, May 7, 2016, expressed as a percentage of the population aged 15 years and over. CITY CENTRE COMMUNITY PROFILE: 2016 CENSUS DATA AND CITY OF STATISTICS 13
48 JOURNEY TO WORK GETTING TO WORK In 2016 driving remained the predominant mode of transportation to work, however City Centre had a much lower percentage of commuters driving to work (56%) than citywide (81%). WALKED OR CYCLED 8% (1,025) 4% (10,125) CITY CENTRE DROVE CAR 56% (7,485) 81% (193,255) CITY CENTRE USED PUBLIC TRANSIT 36% (4,880) 15% (35,560) CITY CENTRE 14 CITY CENTRE COMMUNITY PROFILE: 2016 CENSUS DATA AND CITY OF STATISTICS
49 COMMUTE TIME FOR WORK In 2016 in City Centre, 65% (43% + 22%) of those in the workforce commuted more than 30 minutes and of those, 22% commuted more than an hour to work. In comparison, 54% (38% + 16%) of Surrey s workforce commuted more than 30 minutes and of those, 16% commuted more than an hour to work. LESS THAN 30 MINUTES 30 TO 59 MINUTES 60 MINUTES AND OVER 35% 43% 22% 46% 38% 16% CITY CENTRE PLACE OF WORK STATUS In 2016, 4% (595) of the employed labour force in City Centre worked from home, compared with 6% (16,085) citywide. WORKED FROM HOME 4% (595) 6% (16,085) CITY CENTRE CITY CENTRE COMMUNITY PROFILE: 2016 CENSUS DATA AND CITY OF STATISTICS 15
50 - 16 -
 SOUTH POPULATION 65,645 (517,885) IMMIGRANT POPULATION 23% (43%) OCCUPIED PRIVATE DWELLINGS 22,745 (169,970) City of Surrey statistics in brackets JOB CENTRE RENTERS 21% (29%)")
51 Appendix "IV" CLOVERDALE CITY OF COMMUNITY PROFILES 2016 Census Data City of Surrey Statistics CITY CENTRE GUILDFORD FLEETWOOD NEWTON CLOVERDALE AREA 4,917 ha (32,621 ha) AVERAGE HOUSEHOLD INCOME $103,177 ($93,586) SOUTH POPULATION 65,645 (517,885) IMMIGRANT POPULATION 23% (43%) OCCUPIED PRIVATE DWELLINGS 22,745 (169,970) City of Surrey statistics in brackets JOB CENTRE RENTERS 21% (29%) UNEMPLOYMENT RATE 5% (7%) TAKE TRANSIT TO WORK 6% (15%) Due to rounding, figures may be slightly lower or higher than stated and percentages may not add up to 100%. Cloverdale is characterized by a mix of historic and newer neighbourhoods, such as West Cloverdale and Clayton Heights. Drawing on its rich agricultural and pioneer heritage, Cloverdale is home to the annual Cloverdale Rodeo. Cloverdale is the third largest community in Surrey. The western border runs along 160th Street and connects with 48th Avenue, which is the southern border. To the east is Langley and to the north are Guildford and Cloverdale, separated by 84th Avenue and 76th Avenue respectively.
52 POPULATION & FAMILIES POPULATION In 2016, the population of Cloverdale was 65,645 or 13% of Surrey s total population. : 517,885 (100%) CLOVERDALE 65,645 (13%) CLOVERDALE POPULATION BY FAMILY SIZE The breakdown of family sizes in Cloverdale in 2016 was fairly similar to the breakdown for Surrey. CLOVERDALE 43% 42% 22% 23% 25% 25% 9% 10% 2 PERSONS 3 PERSONS 4 PERSONS 5 PERSONS 2 CLOVERDALE COMMUNITY PROFILE: 2016 CENSUS DATA AND CITY OF STATISTICS
53 - 3 - POPULATION GROWTH Cloverdale s population grew by 21% between 2011 and This was down from a previous high of 44% between 2006 and This was much higher than the overall city growth rates. The city s population grew by 11% between 2011 and 2016, down from 19% between 2006 and Population growth between 2011 and % 11% CLOVERDALE POPULATION BY AGE GROUP In 2016 the average age in Cloverdale was 37, 2 years younger than the average age for the city which was 39. In 2016, only 11% of Cloverdale s population was 65 and over, compared with 14% citywide. 50% CLOVERDALE 40% 41% 41% Percentage of Total Population 30% 20% 10% 0% 27% 25% % 20% % % Age Groups CLOVERDALE COMMUNITY PROFILE: 2016 CENSUS DATA AND CITY OF STATISTICS 3
54 IMMIGRATION TOP 4 ETHNIC GROUPS In 2016, 69% of the population in Cloverdale was Caucasian. This was much higher than the city, where 42% of the population was Caucasian in *South Asian includes East Indian, Pakistani, Sri Lankan, etc. Other 10% Chinese 3% Caucasian 69% South Asian* 14% Filipino 4% Other 11% Filipino 6% Caucasian 42% Chinese 8% South Asian* 33% CLOVERDALE IMMIGRANTS * BY PERIOD OF IMMIGRATION Immigration has steadily risen in Cloverdale and in the city in the last 40 years. 1,985 immigrants moved into Cloverdale between 2011 and During the same time period 36,335 immigrants moved into the city. * Immigrants include all residents who have been granted the right to live in Canada permanently by immigration authorities. 3,930 37,055 CLOVERDALE 1,945 25,490 3,190 52,570 4,260 68,705 1,985 36,335 IMMIGRATION POPULATION BEFORE CLOVERDALE COMMUNITY PROFILE: 2016 CENSUS DATA AND CITY OF STATISTICS
55 -5- TOP 5 PLACES OF ORIGIN OF RECENT IMMIGRANTS In 2016, the top place of origin of recent immigrants to Cloverdale was India (22%). By comparison, the top place of origin of recent immigrants to the City was India (41%). * Recent immigrants represent those residents who became a landed immigrant between January 2011 and Census Day on May 13, 2016 UNITED KINGDOM 6% UNITED STATES 3% INDIA 22% SOUTH KOREA 10% PHILIPPINES 16% CLOVERDALE Map illustrates the top five places of origin of recent immigrants living in Cloverdale in 2016, which equates to 57% of recent immigrants. The remaining 43% were not mapped. IRAQ 3% CHINA 13% INDIA 41% SOUTH KOREA 3% PHILIPPINES 15% Map illustrates the top five places of origin of recent immigrants living in Surrey in 2016, which equates to 75% of recent immigrants. The remaining 25% were not mapped. CLOVERDALE COMMUNITY PROFILE: 2016 CENSUS DATA AND CITY OF STATISTICS 5
56 LANGUAGE MOST COMMON LANGUAGE SPOKEN AT HOME In 2016, 87% of Cloverdale s residents spoke English at home, much higher than the percentage for the city, where only 66% spoke English. Korean 2% Other Languages 4% English 87% Punjabi (Panjabi) 5% Mandarin 1% Spanish 1% CLOVERDALE Mandarin 4% Tagalog (Pilipino, Filipino) 2% English 66% Other Languages 9% Hindi 2% Punjabi (Panjabi) 17% 6 CLOVERDALE COMMUNITY PROFILE: 2016 CENSUS DATA AND CITY OF STATISTICS
57 LANGUAGE INDIGENOUS & EDUCATION INDIGENOUS POPULATION BY COMMUNITY In 2016, there were 13,460 people that identified as aboriginal* living in Surrey. Of those 2,295 or 17% lived in Cloverdale * Aboriginal Identity refers to persons who report being Aboriginal, which includes First Nations, Métis or Inuit and/or Registered or Treaty Indian, and/or a member of a First Nations or Indian Band. WHALLEY: EXCLUDING CITY CENTRE 2,280 CITY CENTRE 1,230 GUILDFORD 1,575 FLEETWOOD 1,240 NEWTON 3,280 CLOVERDALE 2,295 SOUTH 1,565 PERCENTAGE OF TOTAL POPULATION THAT IS INDIGENOUS In 2016, the percentage of Cloverdale s population that was aboriginal was 4% compared to 3% for the city. CLOVERDALE 4% 3% CLOVERDALE COMMUNITY PROFILE: 2016 CENSUS DATA AND CITY OF STATISTICS 7
58 HOUSING NUMBER OF EACH TYPE OF DWELLING UNIT Single family homes remained the dominant residential building type in Cloverdale. In 2016 there were 14,415 single and two family dwellings in Cloverdale, which represented 63% of all private dwellings. This was comparable with the city, where 58% (99,235) of the private dwellings were single family in TYPE CLOVERDALE Single Family Dwelling Row/Townhouses Apartments 63% (14,395) 25% (5,685) 12% (2,665) 58% (99,060) 18% (30,440) 24% (40,470) Total Dwellings Units 22, ,970 TENURE Ownership remained the predominant form of tenure in Cloverdale and citywide. In 2016, 79% of Cloverdale residents owned their home, compared with 71% for the City. However, between 2006 and 2016, the percentage of households who owned decreased while the percentage of households who rented increased. In Cloverdale, the percentage of households who rented increased from 14% to 21% and Citywide from 25% to 29% between 2006 and CLOVERDALE Percentage of Each Type of Tenure 100% 90% 80% 70% 60% 50% 40% 30% 20% 10% 0% 21% 29% Renters Between , the percentage of households who owned decreased and the percentage who rented increased in Cloverdale and citywide. 79% 71% Owners 8 CLOVERDALE COMMUNITY PROFILE: 2016 CENSUS DATA AND CITY OF STATISTICS
59 - 9 - AVERAGE VALUE OF DWELLINGS The average value of dwellings* continued to increase in Cloverdale and citywide between 2006 and In 2016, the average value of a dwelling in Cloverdale was $667,482, compared with $757,863 citywide. *The average value of a dwelling refers to the value of the entire dwelling, including the value of the land it is on and of any other structure, such as a garage, which is on the property. If the dwelling is located in a building which contains several dwellings, or a combination of residential and business premises, all of which the household owns, the value is estimated as a portion of the market value that applies only to the dwelling in which the household resides. CLOVERDALE $441,867 $446,307 $511,786 $544,819 $667,482 $757, HOUSING AFFORDABILITY In Canada, housing is considered unaffordable if it costs more than 30% of a household s before-tax income. In 2016, 36% of renters in Cloverdale and 37% citywide spent more than 30% of their income on rent. In comparison 18% of home owners in Cloverdale and 25% citywide spent 30% or more of their household income on housing. Unaffordable to Own Unaffordable to Rent Owner households who spent more than 30% of their household income on housing. 18% 25% CLOVERDALE 36% 37% Renter households who spent more than 30% of their household income on rent. OWNERS RENTERS CLOVERDALE COMMUNITY PROFILE: 2016 CENSUS DATA AND CITY OF STATISTICS 9
60 INCOME AVERAGE HOUSEHOLD INCOME In 2015, Cloverdale had the second highest average household income of all seven Surrey communities, with an average household income of $103,177. WHALLEY: EXCLUDING CITY CENTRE $83,026 CITY CENTRE $58,761 GUILDFORD $87,256 FLEETWOOD $97,637 NEWTON $90,049 CLOVERDALE $103,177 SOUTH $115,119 AVERAGE INCOME BY HOUSEHOLD TYPE In 2015 in Cloverdale, the family type with the highest average household income* was couples with children, with an income of $131,163. For each census family type, the average income in Cloverdale was higher than those for the city. TYPE CLOVERDALE Couple Families Without Children $100,137 $95,517 Couple Families with Children $131,163 $119,698 Lone-Parent Families $71,122 $62,818 Persons 15 Years and Over Not in Families $47,735 $39,475 All Households $103,177 $93,586 * Household income is the sum of the total income of all members of the household. Income data for families refers to all persons living in the same home who are related by blood, marriage, common-law or adoption. 10 CLOVERDALE COMMUNITY PROFILE: 2016 CENSUS DATA AND CITY OF STATISTICS
61 INCOME DISTRIBUTION In 2015, Cloverdale had a larger percentage of households in the higher income brackets than citywide. Percentage of Households 30% 25% 20% 15% 10% 5% 0% 10% 15% under $30,000 19% 23% $30,00-59,999 26% 26% $60,000-99,999 25% 20% $100, ,000 20% 16% $150,000+ CLOVERDALE PERSONS IN LOW INCOME In 2015, 8% of the population in Cloverdale was considered low income*. This was much lower than the percentage for the city, which was 15%. Persons in low income are based on the Low-Income Measure, After Tax, (LIM-AT). WHALLEY CITY CENTRE GUILDFORD FLEETWOOD NEWTON CLOVERDALE 5,495 persons (8%) 75,595 persons (15%) SOUTH CLOVERDALE COMMUNITY PROFILE: 2016 CENSUS DATA AND CITY OF STATISTICS 11
62 EDUCATION HIGHEST LEVEL OF EDUCATION ATTAINED In 2016, 23% of Cloverdale s population aged 25 to 64 had a university degree, compared with 27% for the city. University certificate diploma or degree at bachelor level or above 23% No certificate, diploma or degree 8% CLOVERDALE High school diploma or equivalent 32% College or other non-university certificate or diploma 28% Apprenticeship or trades certificate or diploma 9% University certificate diploma or degree at bachelor level or above 27% No certificate, diploma or degree 12% High school diploma or equivalent 30% College or other non-university certificate or diploma 24% Apprenticeship or trades certificate or diploma 7% 12 CLOVERDALE COMMUNITY PROFILE: 2016 CENSUS DATA AND CITY OF STATISTICS
63 LABOUR FORCE TOP 5 MAJOR OCCUPATIONS The breakdown of occupations in Cloverdale in 2016 was fairly similar to the breakdown for Surrey. CLOVERDALE Percentage of Employed Labour Force 30% 25% 20% 15% 10% 5% 0% 26% 23% Sales and service occupations 11% 9% Mangement occupations 17% 14% Business finance and adminstration occupations 11% 9% Occupations in education, law and social, community and government services 18% 19% 20% Trades, transport and equipment operators and related occupations 23% All other occupations Employment In 2016, the overall labour force participation rate* in Cloverdale was 73% participation, compared with 66% citywide. Self-Employed In 2016, 10% (3,860) of the employed labour force in Cloverdale was selfemployed, compared with 12% (31,800) citywide. Unemployment Rate In 2016, 5% (1,760) of those participating in the labour force in Cloverdale were unemployed. This was slightly lower than the percentage for the city, which was 7% (17,810). JOB CENTRE 73% CLOVERDALE 10% CLOVERDALE 5% CLOVERDALE 66% 12% 7% * Participation Rate refers to the labour force, both employed and unemployed individuals, in the week of Sunday, May 1 to Saturday, May 7, 2016, expressed as a percentage of the population aged 15 years and over. CLOVERDALE COMMUNITY PROFILE: 2016 CENSUS DATA AND CITY OF STATISTICS 13
64 JOURNEY TO WORK GETTING TO WORK Driving remained the predominant mode of transportation to work. In 2016, 90% of Cloverdale residents drove to work, higher than the city rate of 81%. However, between 2011 and 2016, transit ridership increased more than any other mode of transportation. During this period there was a 42% increase in transit ridership in Cloverdale and a 32% increase citywide. WALKED OR CYCLED 4% (1,375) 4% (10,125) CLOVERDALE DROVE CAR 90% (29,820) 81% (193,255) CLOVERDALE USED PUBLIC TRANSIT 6% (2,130) 15% (35,560) CLOVERDALE 14 CLOVERDALE COMMUNITY PROFILE: 2016 CENSUS DATA AND CITY OF STATISTICS
65 COMMUTE TIME FOR WORK In 2016 in Cloverdale, 45% (33% + 12%) of those in the workforce commuted more than 30 minutes and of those, 12% commuted more than an hour to work. In comparison, 54% (38% +16%) of Surrey s workforce commuted more than 30 minutes and of those, 16% commuted more than an hour to work. LESS THAN 30 MINUTES 30 TO 59 MINUTES 60 MINUTES AND OVER 55% 33% 12% 46% 38% 16% CLOVERDALE PLACE OF WORK STATUS In 2016, 7% (2,385) of the employed labour force in Cloverdale and 8% (16,085) citywide worked from home. WORKED FROM HOME 7% (2,385) 6% (16,085) CLOVERDALE CLOVERDALE COMMUNITY PROFILE: 2016 CENSUS DATA AND CITY OF STATISTICS 15
66 - 16 -
 SOUTH POPULATION RENTERS 62,735 (517,885) IMMIGRANT POPULATION 47% (43%) OCCUPIED PRIVATE DWELLINGS 18,840 (169,970) JOB CENTRE 22% (29%) UNEMPLOYMENT RATE 7% (7%) TAKE")
67 Appendix "V" FLEETWOOD CITY OF COMMUNITY PROFILES 2016 Census Data City of Surrey Statistics WHALLEY CITY CENTRE GUILDFORD FLEETWOOD NEWTON CLOVERDALE AREA 1,809 ha (32,621 ha) AVERAGE HOUSEHOLD INCOME $97,637 ($93,586) SOUTH POPULATION RENTERS 62,735 (517,885) IMMIGRANT POPULATION 47% (43%) OCCUPIED PRIVATE DWELLINGS 18,840 (169,970) JOB CENTRE 22% (29%) UNEMPLOYMENT RATE 7% (7%) TAKE TRANSIT TO WORK 15% (15%) Fleetwood is a largely residential community centered on the Fraser Highway and Fleetwood Town Centre. It is characterized by it s beautiful parks, friendly neighbourhoods and agricultural lowlands. Fleetwood is located at the centre of the northern half of the City, with Whalley to the west, Newton and Fleetwood to the south and Guildford to the east and north. City of Surrey statistics in brackets Due to rounding, figures may be slightly lower or higher than stated and percentages may not add up to 100%.
68 POPULATION & FAMILIES POPULATION In 2016, the population of Fleetwood was 62,735 or 12% of Surrey s total population. : 517,885 (100%) FLEETWOOD 62,735 (12%) FLEETWOOD POPULATION BY FAMILY SIZE In 2016, 38% of Fleetwood families consisted of 2 people, which was lower than the City with 42%. FLEETWOOD 38% 42% 24% 23% 27% 25% 11% 10% 2 PERSONS 3 PERSONS 4 PERSONS 5 PERSONS 2 FLEETWOOD COMMUNITY PROFILE: 2016 CENSUS DATA AND CITY OF STATISTICS
69 - 3 - POPULATION GROWTH Fleetwood s population grew by 6% between 2011 and This was down from a previous high of 18% between 2006 and This was lower than the city, which grew 11% between 2011 and 2016, down from 19% between 2006 and Population growth between 2011 and % 11% FLEETWOOD POPULATION BY AGE GROUP In 2016, the age composition of the population in Fleetwood and citywide was very similar. The average age in Fleetwood was 40 and 39 for the city. 50% FLEETWOOD 42% 41% 40% Percentage of Total Population 30% 20% 10% 0% 25% 25% % 20% % 14% 65+ Age Groups FLEETWOOD COMMUNITY PROFILE: 2016 CENSUS DATA AND CITY OF STATISTICS 3
70 IMMIGRATION TOP 4 ETHNIC GROUPS In 2016, 33% of the population in Fleetwood was Caucasian. This was lower than the city, where 42% of the population was Caucasian in *South Asian includes East Indian, Pakistani, Sri Lankan, etc. Chinese 10% Other 16% Caucasian 33% South Asian* 32% Filipino 9% Other 11% Filipino 6% Caucasian 42% Chinese 8% South Asian* 33% FLEETWOOD IMMIGRANTS * BY PERIOD OF IMMIGRATION In ,160 of Fleetwood s residents were considered recent immigrants having immigrated to Canada between 2011 and At the same time there were 36,335 recent immigrants living citywide in Surrey. * Immigrants include all residents who have been granted the right to live in Canada permanently by immigration authorities. 4,945 37,055 FLEETWOOD 3,905 25,490 7,570 52,570 8,765 68,705 4,160 36,335 IMMIGRATION POPULATION BEFORE FLEETWOOD COMMUNITY PROFILE: 2016 CENSUS DATA AND CITY OF STATISTICS
71 -5- TOP 5 PLACES OF ORIGIN OF RECENT IMMIGRANTS In 2016 the top place of origin of recent immigrants* to Fleetwood was India (35%). By comparison, the top place of origin of recent immigrants to the city was India (41%). * Recent immigrants represent those residents who became a landed immigrant between January 2011 and Census Day on May 13, 2016 PAKISTAN 3% INDIA 35% CHINA 14% SOUTH KOREA 4% PHILIPPINES 21% FLEETWOOD Map illustrates the top five places of origin of recent immigrants living in Fleetwood in 2016, which equates to 77% of recent immigrants. The remaining 23% were not mapped. IRAQ 3% CHINA 13% INDIA 41% SOUTH KOREA 3% PHILIPPINES 15% Map illustrates the top five places of origin of recent immigrants living in Surrey in 2016, which equates to 75% of recent immigrants. The remaining 25% were not mapped. FLEETWOOD COMMUNITY PROFILE: 2016 CENSUS DATA AND CITY OF STATISTICS 5
72 LANGUAGE MOST COMMON LANGUAGE SPOKEN AT HOME In 2016, 62% of Fleetwood residents spoke English at home, compared with 66% citywide. Other Languages 12% Korean 2% Punjabi (Panjabi) 16% English 62% Mandarin 5% Tagalog (Pilipino, Filipino) 3% FLEETWOOD Mandarin 4% Tagalog (Pilipino, Filipino) 2% English 66% Other Languages 9% Hindi 2% Punjabi (Panjabi) 17% 6 FLEETWOOD COMMUNITY PROFILE: 2016 CENSUS DATA AND CITY OF STATISTICS
73 LANGUAGE INDIGENOUS & EDUCATION INDIGENOUS POPULATION BY COMMUNITY In 2016, there were 13,460 people that identified as aboriginal* living in Surrey. Of those 1,240 or 9% lived in Fleetwood * Aboriginal Identity refers to persons who report being Aboriginal, which includes First Nations, Métis or Inuit and/or Registered or Treaty Indian, and/or a member of a First Nations or Indian Band. WHALLEY: EXCLUDING CITY CENTRE 2, 280 CITY CENTRE 1,230 GUILDFORD 1,575 FLEETWOOD 1,240 NEWTON 3,280 CLOVERDALE 2,295 SOUTH 1,565 PERCENTAGE OF TOTAL POPULATION THAT IS INDIGENOUS In 2016, the percentage of Fleetwood s total population that was indigenous was 2% compared to 3% for the city. FLEETWOOD 2% 3% FLEETWOOD COMMUNITY PROFILE: 2016 CENSUS DATA AND CITY OF STATISTICS 7
74 HOUSING NUMBER OF EACH TYPE OF DWELLING UNIT In 2016, single family homes remained the dominant residential building type in Fleetwood and citywide. In 2016 there were 12,755 (68%) single and two family dwellings in Fleetwood, and 99,235 (58%) in Surrey. TYPE FLEETWOOD Single Family Dwelling Row/Townhouses Apartments 68% (12,760) 21% (3,950) 11% (2,130) 58% (99,060) 18% (30,440) 24% (40,470) Total Dwellings Units 18, ,970 TENURE Ownership remained the predominant form of tenure in Fleetwood and citywide. In 2016, 78% of Fleetwood residents owned their home, compared with 71% for the City. However, between 2006 and 2016, the percentage of households who owned decreased while the percentage of households who rented increased. In Fleetwood, the percentage of households who rented increased from 17% to 22% and Citywide from 25% to 29% between 2006 and FLEETWOOD Percentage of Each Type of Tenure 100% 90% 80% 70% 60% 50% 40% 30% 20% 10% 0% 22% 29% Renters Between , the percentage of households who owned decreased and the percentage who rented increased in Fleetwood and citywide. 78% 71% Owners 8 FLEETWOOD COMMUNITY PROFILE: 2016 CENSUS DATA AND CITY OF STATISTICS
75 - 9 - AVERAGE VALUE OF DWELLINGS The average value of dwellings* continued to increase in Fleetwood and citywide between 2006 and In 2016, the average value of a dwelling in Fleetwood was $714,686, compared with $757,863 citywide. *The average value of a dwelling refers to the value of the entire dwelling, including the value of the land it is on and of any other structure, such as a garage, which is on the property. If the dwelling is located in a building which contains several dwellings, or a combination of residential and business premises, all of which the household owns, the value is estimated as a portion of the market value that applies only to the dwelling in which the household resides. FLEETWOOD $431,685 $446,307 $518,764 $544,819 $714,686 $757, HOUSING AFFORDABILITY In Canada, housing is considered unaffordable if it costs more than 30% of a household s before-tax income. In 2016, 35% of renters in Fleetwood and 37% citywide spent more than 30% of their income on rent. In comparison 23% of home owners in Fleetwood and 25% citywide spent 30% or more of their household income on housing. Unaffordable to Own Unaffordable to Rent Owner households who spent more than 30% of their household income on housing. 23% 25% FLEETWOOD 35% 37% Renter households who spent more than 30% of their household income on rent. OWNERS RENTERS FLEETWOOD COMMUNITY PROFILE: 2016 CENSUS DATA AND CITY OF STATISTICS 9
76 INCOME AVERAGE HOUSEHOLD INCOME In 2015, Fleetwood had the third highest average household income of all seven Surrey communities, with an average household income of $97,637, which was higher than the city s average income ($93,586). WHALLEY: EXCLUDING CITY CENTRE $83,026 CITY CENTRE $58,761 GUILDFORD $87,256 FLEETWOOD $97,637 NEWTON $90,049 CLOVERDALE $103,177 SOUTH $115,119 AVERAGE INCOME BY HOUSEHOLD TYPE In 2015 in Fleetwood, the family type with the highest average household income* was couples with children, with an income of $118,201. TYPE FLEETWOOD Couple Families Without Children $90,791 $95,517 Couple Families with Children $118,201 $119,698 Lone-Parent Families $68,379 $62,818 Persons 15 Years and Over Not in Families $37,931 $39,475 All Households $97,637 $93,586 * Household income is the sum of the total income of all members of the household. Income data for families refers to all persons living in the same home who are related by blood, marriage, common-law or adoption.. 10 FLEETWOOD COMMUNITY PROFILE: 2016 CENSUS DATA AND CITY OF STATISTICS
77 INCOME DISTRIBUTION In 2015, the income breakdown in Fleetwood varied slightly from the breakdown for the city. The percentage of households with incomes under $100,000 was slightly lower for Fleetwood than the city and slightly higher for households with incomes over $100, % FLEETWOOD Percentage of Households 25% 20% 15% 10% 5% 0% 13% 15% under $30,000 21% 23% $30,00-59,999 25% 26% 23% 20% $60,000-99,999 $100, ,000 18% 16% $150,000+ PERSONS IN LOW INCOME In 2015, 13% of the population in Fleetwood was considered low income*. This was lower than the percentage for the city, which was 15%. * Persons in low income are based on the Low-Income Measure, After Tax, (LIM-AT). WHALLEY CITY CENTRE GUILDFORD NEWTON FLEETWOOD 7,710 persons (13%) CLOVERDALE 75,595 persons (15%) SOUTH FLEETWOOD COMMUNITY PROFILE: 2016 CENSUS DATA AND CITY OF STATISTICS 11
78 EDUCATION HIGHEST LEVEL OF EDUCATION ATTAINED In 2016, the levels of education attained in Fleetwood mirrored the city rates. University certificate diploma or degree at bachelor level or above 28% No certificate, diploma or degree 12% FLEETWOOD High school diploma or equivalent 29% College or other non-university certificate or diploma 24% Apprenticeship or trades certificate or diploma 7% University certificate diploma or degree at bachelor level or above 27% No certificate, diploma or degree 12% High school diploma or equivalent 30% College or other non-university certificate or diploma 24% Apprenticeship or trades certificate or diploma 7% 12 FLEETWOOD COMMUNITY PROFILE: 2016 CENSUS DATA AND CITY OF STATISTICS
79 LABOUR FORCE MAJOR OCCUPATIONS The breakdown of occupations in Fleetwood in 2016 was very similar to the breakdown for Surrey. 30% 25% 26% 26% 24% 23% FLEETWOOD Percentage of Employed Labour Force 20% 15% 10% 5% 0% Sales and service occupations 8% 9% Mangement occupations 15% 14% Business finance and adminstration occupations 9% 9% Occupations in education, law and social, community and government services 18% 19% Trades, transport and equipment operators and related occupations All other occupations Employment In 2016, the overall labour force participation rate* in Fleetwood mirrored the city at 66%. Self-Employed In 2016, 11% (3,440) of the employed labour force in Fleetwood was selfemployed, compared with 12% (31,800) citywide. Unemployment Rate In 2016, 7% of those participating in the labour force were unemployed in Fleetwood and citywide. JOB CENTRE 66% FLEETWOOD 11% FLEETWOOD 7% FLEETWOOD 12% 66% 7% * Participation Rate refers to the labour force, both employed and unemployed individuals, in the week of Sunday, May 1 to Saturday, May 7, 2016, expressed as a percentage of the population aged 15 years and over. FLEETWOOD COMMUNITY PROFILE: 2016 CENSUS DATA AND CITY OF STATISTICS 13
80 JOURNEY TO WORK GETTING TO WORK Driving remained the predominant mode of transportation to work. In 2016, 82% of Fleetwood residents drove to work, higher than the city rate of 81%. However, between 2011 and 2016, transit ridership increased more than any other mode of transportation. During this period there was a 21% increase in transit ridership in Fleetwood and a 32% increase citywide. WALKED OR CYCLED 3% (945) 4% (10,125) FLEETWOOD DROVE CAR 82% (24,170) 81% (193,255) FLEETWOOD USED PUBLIC TRANSIT 15% (4,415) 15% (35,560) FLEETWOOD 14 FLEETWOOD COMMUNITY PROFILE: 2016 CENSUS DATA AND CITY OF STATISTICS
81 COMMUTE TIME FOR WORK In 2016 in Fleetwood, 51% of those in the workforce commuted more than 30 minutes and of those, 16% commuted more than an hour to work. In comparison, 54% of Surrey s workforce commuted more than 30 minutes and of those, 16% commuted more than an hour to work. LESS THAN 30 MINUTES 30 TO 59 MINUTES 60 MINUTES AND OVER 49% 35% 16% 46% 38% 16% FLEETWOOD PLACE OF WORK STATUS In 2016, 5% (1,695) of the employed labour force in Fleetwood and 6% (16,085) citywide worked from home. WORKED FROM HOME 5% (1,695) 6% (16,085) FLEETWOOD FLEETWOOD COMMUNITY PROFILE: 2016 CENSUS DATA AND CITY OF STATISTICS 15
82 - 16 -
 SOUTH POPULATION 60,745 (517,885) IMMIGRANT POPULATION 50% (43%) OCCUPIED PRIVATE DWELLINGS 20,460 (169,970) City of Surrey statistics in brackets JOB CENTRE RENTERS 30%")
83 Appendix "VI" GUILDFORD CITY OF COMMUNITY PROFILES 2016 Census Data City of Surrey Statistics WHALLEY CITY CENTRE GUILDFORD FLEETWOOD NEWTON CLOVERDALE AREA 4,421 ha (32,621 ha) AVERAGE HOUSEHOLD INCOME $87,256 ($93,586) SOUTH POPULATION 60,745 (517,885) IMMIGRANT POPULATION 50% (43%) OCCUPIED PRIVATE DWELLINGS 20,460 (169,970) City of Surrey statistics in brackets JOB CENTRE RENTERS 30% (29%) UNEMPLOYMENT RATE 7% (7%) TAKE TRANSIT TO WORK 19% (15%) Due to rounding, figures may be slightly lower or higher than stated and percentages may not add up to 100%. Guildford is comprised of mature urban neighbourhoods that grew up around the Guildford Town Centre shopping mall as well as the newer Fraser Heights subdivision which slopes down toward the Fraser River. Tynehead and Surrey Bend Regional Parks are significant natural environments in Guildford. Located in the northeast corner of the city. The Fraser River surrounds the northern edge of the community with Whalley to the west, Langley to the east, and the southern border jogging from 96th down to 84th Avenue.
84 POPULATION & FAMILIES POPULATION In 2016, the population of Guildford was 60,745 or 12% of Surrey s total population. : 517,885 (100%) GUILDFORD 60,745 (12%) GUILDFORD POPULATION BY FAMILY SIZE The breakdown of family sizes in Guildford in 2016 was quite similar to the breakdown for Surrey. 24% 23% GUILDFORD 41% 42% 24% 23% 24% 25% 11% 10% 2 PERSONS 3 PERSONS 4 PERSONS 5 PERSONS 2 GUILDFORD COMMUNITY PROFILE: 2016 CENSUS DATA AND CITY OF STATISTICS
85 - 3 - POPULATION GROWTH Guildford s population grew by 4% between 2011 and This was down from a previous high of 11% between 2006 and This was lower than the city, which grew 11% between 2011 and 2016, down from 19% between 2006 and Population growth between 2011 and % 11% GUILDFORD POPULATION BY AGE GROUP In 2016, the age composition of the population in Guildford and citywide was very similar. 50% GUILDFORD 43% 41% 40% Percentage of Total Population 30% 20% 10% 0% 24% 25% % % % 14% 65+ Age Groups GUILDFORD COMMUNITY PROFILE: 2016 CENSUS DATA AND CITY OF STATISTICS 3
86 IMMIGRATION TOP 4 ETHNIC GROUPS In 2016, 39% of the population in Guildford was Caucasian. This was lower than the city, where 42% of the population was Caucasian in * South Asians include East Indian, Pakistani, Sri Lankan, etc. Other 22% Chinese 16% Caucasian 39% South Asian* 12% Filipino 11% Other 11% Filipino 6% Caucasian 42% Chinese 8% South Asian* 33% GUILDFORD IMMIGRANTS * BY PERIOD OF IMMIGRATION In 2016, 5,285 of Guildford s residents were considered recent immigrants having immigrated to Canada between 2011 and At the same time there were 36,335 recent immigrants living citywide in Surrey. 4,410 37,055 GUILDFORD 3,420 25,490 6,935 52,570 4,225 68,705 5,285 36,335 IMMIGRATION POPULATION BEFORE GUILDFORD COMMUNITY PROFILE: 2016 CENSUS DATA AND CITY OF STATISTICS
87 -5- TOP 5 PLACES OF ORIGIN OF RECENT IMMIGRANTS In 2016, the top place of origin of recent immigrants to Guildford was the Philippines (26%). By comparison, the top place of origin of recent immigrants to the City was India (41%). IRAQ 17% CHINA 18% INDIA 6% SOUTH KOREA 6% PHILIPPINES 26% GUILDFORD Map illustrates the top five places of origin of recent immigrants living in Guildford in 2016, which equates to 73% of recent immigrants. The remaining 27% were not mapped. IRAQ 3% CHINA 13% INDIA 41% SOUTH KOREA 3% PHILIPPINES 15% Map illustrates the top five places of origin of recent immigrants living in Surrey in 2016, which equates to 75% of recent immigrants. The remaining 25% were not mapped. GUILDFORD COMMUNITY PROFILE: 2016 CENSUS DATA AND CITY OF STATISTICS 5
88 LANGUAGE MOST COMMON LANGUAGE SPOKEN AT HOME In 2016, 65% of Guildford residents spoke English at home, very similar to the percentage for the city, where 66% spoke English. Mandarin 10% Korean 4% Other Languages 14% English 65% Punjabi (Panjabi) 3% Tagalog (Pilipino, Filipino) 4% GUILDFORD Mandarin 4% Tagalog (Pilipino, Filipino) 2% English 66% Other Languages 9% Hindi 2% Punjabi (Panjabi) 17% 6 GUILDFORD COMMUNITY PROFILE: 2016 CENSUS DATA AND CITY OF STATISTICS
89 LANGUAGE INDIGENOUS & EDUCATION INDIGENOUS POPULATION BY COMMUNITY In 2016, there were 13,460 people that identified as aborginal* living in Surrey. Of those, 1,575 or 12% lived in Guildford. *Aboriginal Identity refers to persons who report being Aboriginal, which includes First Nations, Métis or Inuit and/or Registered or Treaty Indian, and/ or a member of a First Nations or Indian Band WHALLEY: CITY EXCLUDING CENTRE CITY CENTRE 1,230 2,280 GUILDFORD 1,575 FLEETWOOD 1,240 NEWTON 3,280 CLOVERDALE 2,295 SOUTH 1,565 PERCENTAGE OF TOTAL POPULATION THAT IS INDIGENOUS In 2016, 3% of Guildford s and the city s population was indigenous. GUILDFORD 3% 3% GUILDFORD COMMUNITY PROFILE: 2016 CENSUS DATA AND CITY OF STATISTICS 7
90 HOUSING NUMBER OF EACH TYPE OF DWELLING UNIT Single family homes remained the dominant residential building type in Guildford. In 2016 there were 10,990 single and two family dwellings in Guildford, which represented 54% of the private dwellings. This was lower than the city, where 58% (99,235) of the private dwellings were single family in TYPE GUILDFORD Single Family Dwelling Row/Townhouses Low Rise Apartments 54% (10,985) 11% (2,185) 32% (6,615) 58% (99,060) 18% (30,440) 20% (34,520) High Rise Apartments 3% (675) 4% (5,950) Total Dwellings Units 20, ,970 TENURE Ownership remained the predominant form of tenure in Guildford and citywide. In 2016, 70% of Guildford residents owned their home, compared with 71% for the City. However, between 2006 and 2016, the percentage of households who owned decreased while the percentage of households who rented increased. In Guildford, the percentage of households who rented increased from 29% to 30% and Citywide from 25% to 29% between 2006 and GUILDFORD Percentage of Each Type of Tenure 100% 90% 80% 70% 60% 50% 40% 30% 20% 10% 0% 30% 29% Renters Between , the percentage of households who owned decreased and the percentage who rented increased in Guildford and citywide. 70% 71% Owners 8 GUILDFORD COMMUNITY PROFILE: 2016 CENSUS DATA AND CITY OF STATISTICS
91 - 9 - AVERAGE VALUE OF DWELLINGS The average value of dwellings* continued to increase in Guildford and citywide between 2006 and In 2016, the average value of a dwelling in Guildford was $689,348, compared with $757,863 citywide. *The average value of a dwelling refers to the value of the entire dwelling, including the value of the land it is on and of any other structure, such as a garage, which is on the property. If the dwelling is located in a building which contains several dwellings, or a combination of residential and business premises, all of which the household owns, the value is estimated as a portion of the market value that applies only to the dwelling in which the household resides. GUILDFORD $401,616 $446,307 $498,806 $544,819 $689,348 $757, HOUSING AFFORDABILITY In Canada, housing is considered unaffordable if it costs more than 30% of a household s before-tax income. In 2016, 43% of renters in Guildford and 37% citywide spent more than 30% of their income on rent. In comparison, 25% of home owners in Guildford and citywide spent 30% or more of their household income on housing. Unaffordable to Own Unaffordable to Rent Households spending 30% or more of its income on shelter 25% GUILDFORD 43% Households spending 30% or more of its income on shelter 25% 37% OWNERS RENTERS GUILDFORD COMMUNITY PROFILE: 2016 CENSUS DATA AND CITY OF STATISTICS 9
92 INCOME AVERAGE HOUSEHOLD INCOME In 2015, the average household income in Guildford was $87,256, which was lower than the city s average income ($93,586). WHALLEY: EXCLUDING CITY CENTRE $83,026 CITY CENTRE $58,761 GUILDFORD $87,256 FLEETWOOD $97,637 NEWTON $90,049 CLOVERDALE $103,177 SOUTH $115,119 AVERAGE INCOME BY HOUSEHOLD TYPE In 2015 in Guildford, the family type with the highest average household income* was couples with children, with an income of $113,802. For each family type, the average income in Guildford was lower than those for the city. TYPE GUILDFORD Couple Families Without Children $82,317 $95,517 Couple Families with Children $113,802 $119,698 Lone-Parent Families $58,449 $62,818 Persons 15 Years and Over Not in Families $37,134 $39,475 All Households $87,256 $93,586 * Household income is the sum of the total income of all members of the household. Income data for families refers to all persons living in the same home who are related by blood, marriage, common-law or adoption. 10 GUILDFORD COMMUNITY PROFILE: 2016 CENSUS DATA AND CITY OF STATISTICS
93 INCOME DISTRIBUTION The breakdown of household incomes in Guildford was fairly similar to the breakdown for the city. Percentage of Households 30% 25% 20% 15% 10% 5% 0% 18% 15% under $30,000 24% 23% 25% 26% $30,00-59,999 $60,000-99,999 19% 20% $100, ,000 GUILDFORD 16% 14% $150,000+ PERSONS IN LOW INCOME In 2015, about 1 in 5, or 20% of the people in Guildford were considered low income*. This was higher than the percentage for the city, which was 15%. *Persons in low income are based on the Low-Income Measure, After Tax, (LIM-AT). WHALLEY CITY CENTRE GUILDFORD 11,955 persons (20%) FLEETWOOD NEWTON CLOVERDALE 75,595 persons (15%) SOUTH GUILDFORD COMMUNITY PROFILE: 2016 CENSUS DATA AND CITY OF STATISTICS 11
94 EDUCATION HIGHEST LEVEL OF EDUCATION ATTAINED In 2016, 29% of Guildford s population aged 25 to 64 had a university degree (or above), compared with 27% for the city. University certificate diploma or degree at bachelor level or above 29% No certificate, diploma or degree 11% GUILDFORD High school diploma or equivalent 27% College or other non-university certificate or diploma 25% Apprenticeship or trades certificate or diploma 8% University certificate diploma or degree at bachelor level or above 27% No certificate, diploma or degree 12% High school diploma or equivalent 30% College or other non-university certificate or diploma 24% Apprenticeship or trades certificate or diploma 7% 12 GUILDFORD COMMUNITY PROFILE: 2016 CENSUS DATA AND CITY OF STATISTICS
95 LABOUR FORCE TOP 5 MAJOR OCCUPATIONS The breakdown of occupations in Guildford in 2016 was fairly similar to the breakdown for Surrey. 30% 28% 26% 25% 24% 23% GUILDFORD Percentage of Employed Labour Force 20% 15% 10% 5% 0% Sales and service occupations 9% 9% Mangement occupations 15% 14% Business finance and adminstration occupations 9% 9% Occupations in education, law and social, community and government services 15% 19% Trades, transport and equipment operators and related occupations All other occupations Employment The overall labour force participation rate* in Guildford in 2016 was 64%, compared with 66% for the city. Self-Employed In 2016, 12% of the employed labour force in Guildford and citywide were self-employed. Unemployment Rate In 2016, 7% of those participating in the labour force in Guildford and citywide were unemployed. JOB CENTRE 64% GUILDFORD 12% GUILDFORD 7% GUILDFORD 66% 12% 7% * Participation Rate refers to the labour force, both employed and unemployed individuals, in the week of Sunday, May 1 to Saturday, May 7, 2016, expressed as a percentage of the population aged 15 years and over. GUILDFORD COMMUNITY PROFILE: 2016 CENSUS DATA AND CITY OF STATISTICS 13
96 JOURNEY TO WORK GETTING TO WORK Driving remained the predominant mode of transportation to work. In 2016, 75% of Guildford residents drove to work, lower than the city rate of 81%. However, between 2011 and 2016, transit ridership increased more than any other mode of transportation. During this period there was an 18% increase in transit ridership in Guildford and a 32% increase citywide. WALKED OR CYCLED 6% (1,580) 4% (10,125) GUILDFORD DROVE CAR 75% (20,920) 81% (193,255) GUILDFORD USED PUBLIC TRANSIT 19% (5,415) 15% (35,560) GUILDFORD 14 GUILDFORD COMMUNITY PROFILE: 2016 CENSUS DATA AND CITY OF STATISTICS
97 COMMUTE TIME FOR WORK In 2016 in Guildford, 57% (39% + 18%) of those in the workforce commuted more than 30 minutes and of those, 18% commuted more than an hour to work. In comparison, 54% (38% + 16%) of Surrey s workforce commuted more than 30 minutes and of those, 16% commuted more than an hour to work. LESS THAN 30 MINUTES 30 TO 59 MINUTES 60 MINUTES AND OVER 43% 39% 18% 46% 38% 16% GUILDFORD PLACE OF WORK STATUS In 2016, 7% (1,980) of the employed labour force in Guildford worked from home, compared with 6% (16,085) citywide. WORKED FROM HOME 7% (1,980) 6% (16,085) GUILDFORD GUILDFORD COMMUNITY PROFILE: 2016 CENSUS DATA AND CITY OF STATISTICS 15
98 GUILDFORD COMMUNITY PROFILE: 2016 CENSUS DATA AND CITY OF STATISTICS
 SOUTH POPULATION 149,040 (517,885) IMMIGRANT POPULATION 49% (43%) OCCUPIED PRIVATE DWELLINGS 43,905 (169,970) JOB CENTRE RENTERS 31% (29%) UNEMPLOYMENT RATE 7% (7%) TAKE TRANSIT TO WORK 13%")
99 NEWTON CITY OF COMMUNITY PROFILES 2016 Census Data City of Surrey Statistics WHALLEY CITY CENTRE GUILDFORD FLEETWOOD NEWTON CLOVERDALE AREA 5,871 ha (32,621 ha) AVERAGE HOUSEHOLD INCOME $90,049 ($93,586) SOUTH POPULATION 149,040 (517,885) IMMIGRANT POPULATION 49% (43%) OCCUPIED PRIVATE DWELLINGS 43,905 (169,970) JOB CENTRE RENTERS 31% (29%) UNEMPLOYMENT RATE 7% (7%) TAKE TRANSIT TO WORK 13% (15%) Newton is a vibrant and culturally diverse community that is home to the region s largest South Asian community. Among the variety of educational, recreational and cultural facilities located in Newton are the main Surrey campus of Kwantlen Polytechnic University, the Bell Performing Arts Centre and the Newton Cultural Centre. Every year Newton plays host to one of the largest Vaisakhi Parades outside India. City of Surrey statistics in brackets Due to rounding, figures may be slightly lower or higher than stated and percentages may not add up to 100%.
100 POPULATION & FAMILIES -2 - POPULATION In 2016, the population of Newton was 149,040 or 29% of Surrey s total population : 517,885 (100%) NEWTON 149,040 (29%) NEWTON POPULATION BY FAMILY SIZE The breakdown of family sizes in Newton in 2016 was fairly similar to the breakdown for Surrey. NEWTON 38% 42% 23% 23% 28% 25% 11% 10% 2 PERSONS 3 PERSONS 4 PERSONS 5 PERSONS 2 NEWTON COMMUNITY PROFILE: 2016 CENSUS DATA AND CITY OF STATISTICS
101 -3 - POPULATION GROWTH Newton s population grew by 12% between 2011 and This was down from a previous high of 21% between 2006 and This was comparable with the city, which grew 11% between 2011 and 2016, down from 19% between 2006 and Population growth between 2011 and % 11% NEWTON POPULATION BY AGE GROUP The breakdown of family sizes in Newton in 2016 was fairly similar to the breakdown for Surrey. 50% NEWTON 40% 39% 41% Percentage of Total Population 30% 20% 10% 0% 26% 25% % % % 14% 65+ Age Groups NEWTON COMMUNITY PROFILE: 2016 CENSUS DATA AND CITY OF STATISTICS 3
102 IMMIGRATION TOP 4 ETHNIC GROUPS In 2016, 25% of the population in Newton was Caucasian. This was much lower than the city where 42% of the population was Caucasian in *South Asians include East Indian, Pakistani, Sri Lankan, etc. Other 9% Caucasian 25% South Asian* 58% Filipino 5% Chinese 3% Other 11% Filipino 6% Caucasian 42% Chinese 8% South Asian* 33% NEWTON IMMIGRANTS * BY PERIOD OF IMMIGRATION In 2016, 12,765 of Newton s residents were considered recent immigrants having immigrated to Canada between 2011 and At the same time there were 36,335 recent immigrants living citywide in Surrey. 10,065 37,055 NEWTON 8,205 25,490 18,685 52,570 23,445 68,705 12,765 36,335 IMMIGRATION POPULATION BEFORE NEWTON COMMUNITY PROFILE: 2016 CENSUS DATA AND CITY OF STATISTICS
103 -5- TOP 5 PLACES OF ORIGIN OF RECENT IMMIGRANTS In 2016, the top place of origin of recent immigrants to Newton was the India (70%). Similarly, the top place of origin of recent immigrants to the City was India (41%). SYRIA 1% PAKISTAN 3% INDIA 70% PHILIPPINES 8% SOMALIA 2% NEWTON Map illustrates the top five places of origin of recent immigrants living in Newton in 2016, which equates to 84% of recent immigrants. The remaining 16% were not mapped. IRAQ 3% CHINA 13% INDIA 41% SOUTH KOREA 3% PHILIPPINES 15% Map illustrates the top five places of origin of recent immigrants living in Surrey in 2016, which equates to 75% of recent immigrants. The remaining 25% were not mapped. NEWTON COMMUNITY PROFILE: 2016 CENSUS DATA AND CITY OF STATISTICS 5
104 LANGUAGE MOST COMMON LANGUAGE SPOKEN AT HOME In 2016, 54% of Newton residents spoke English at home, compared with 66% citywide. Other Languages 7% Hindi 2% Punjabi (Panjabi) 34% English 54% Other 2% Tagalog (Pilipino, Filipino) 1% NEWTON Mandarin 4% Tagalog (Pilipino, Filipino) 2% English 66% Other Languages 9% Hindi 2% Punjabi (Panjabi) 17% 6 NEWTON COMMUNITY PROFILE: 2016 CENSUS DATA AND CITY OF STATISTICS
105 LANGUAGE INDIGENOUS & EDUCATION INDIGENOUS POPULATION BY COMMUNITY In 2016, there were 13,460 people that identified as aboriginal* living in Surrey. Of those 25% or 3,280 lived in Newton *Aboriginal Identity refers to persons who report being Aboriginal, which includes First Nations, Métis or Inuit and/or Registered or Treaty Indian, and/or a member of a First Nations or Indian Band. WHALLEY: EXCLUDING CITY CENTRE 2,280 CITY CENTRE 1,230 GUILDFORD 1,575 FLEETWOOD 1,240 NEWTON 3,280 CLOVERDALE 2,295 SOUTH 1,565 PERCENTAGE OF TOTAL POPULATION THAT IS INDIGENOUS In 2016, the percentage of Newton s population that was indigenous was 2% compared to 3% for the city. NEWTON 2% 3% NEWTON COMMUNITY PROFILE: 2016 CENSUS DATA AND CITY OF STATISTICS 7
106 HOUSING NUMBER OF EACH TYPE OF DWELLING UNIT In 2016, single family homes remained the dominant residential building type in Newton and citywide. In 2016 there were 25,235 (58%) single and two family dwellings in Newton, and 99,235 (58%) in the Surrey. TYPE NEWTON Single Family Dwelling Row/Townhouses Apartments 57% (25,000) 20% (8,745) 23% (10,160) 58% (99,060) 18% (30,440) 24% (40,470) Total Dwellings Units 43, ,970 TENURE Ownership remained the predominant form of tenure in Newton and citywide. In 2016, 69% of Newton residents owned their home, compared with 71% for the City. However, between 2006 and 2016, the percentage of households who owned decreased while the percentage of households who rented increased. In Newton, the percentage of households who rented increased from 27% to 31% and Citywide from 25% to 29% between 2006 and NEWTON Percentage of Each Type of Tenure 100% 90% 80% 70% 60% 50% 40% 30% 20% 10% 0% 31% 29% Renters Between , the percentage of households who owned decreased and the percentage who rented increased in Newton and citywide. 69% 71% Owners 8 NEWTON COMMUNITY PROFILE: 2016 CENSUS DATA AND CITY OF STATISTICS
107 - 9 - AVERAGE VALUE OF DWELLINGS The average value of dwellings* continued to increase in Newton and citywide between 2006 and In 2016, the average value of a dwelling in Newton was $682,999, compared with $757,863 citywide. *The average value of a dwelling refers to the value of the entire dwelling, including the value of the land it is on and of any other structure, such as a garage, which is on the property. If the dwelling is located in a building which contains several dwellings, or a combination of residential and business premises, all of which the household owns, the value is estimated as a portion of the market value that applies only to the dwelling in which the household resides. NEWTON $412,067 $446,307 $503,927 $544,819 $682,999 $757, HOUSING AFFORDABILITY In Canada, housing is considered unaffordable if it costs more than 30% of a household s before-tax income. In 2016, 33% of renters in Newton and 37% in Surrey spent more than 30% of their income on rent. In comparison, 27% of home owners in Newton and 25% citywide spent 30% or more of their household income on housing Unaffordable to Own Unaffordable to Rent Households spending 30% or more of its income on shelter 27% NEWTON 33% Households spending 30% or more of its income on shelter 25% 37% OWNERS RENTERS NEWTON COMMUNITY PROFILE: 2016 CENSUS DATA AND CITY OF STATISTICS 9
108 INCOME AVERAGE HOUSEHOLD INCOME In 2015, the average household income in Newton was $90,049, which was lower than the city s average income ($93,586). WHALLEY: EXCLUDING CITY CENTRE $83,026 CITY CENTRE $58,761 GUILDFORD $87,256 FLEETWOOD $97,637 NEWTON $90,049 CLOVERDALE $103,177 SOUTH $115,119 AVERAGE INCOME BY HOUSEHOLD TYPE In 2015 in Newton, the family type with the highest average household income* was couples with children, with an income of $111,616. For each family type, the average income in Newton was lower than those for the city. TYPE NEWTON Couple Families Without Children $84,631 $95,517 Couple Families with Children $111,616 $119,698 Lone-Parent Families $62,269 $62,818 Persons 15 Years and Over Not in Families $34,737 $39,475 All Households $90,049 $93,586 * Household income is the sum of the total income of all members of the household. Income data for families refers to all persons living in the same home who are related by blood, marriage, common-law or adoption. 10 NEWTON COMMUNITY PROFILE: 2016 CENSUS DATA AND CITY OF STATISTICS
109 INCOME DISTRIBUTION The breakdown of household incomes in Newton was fairly similar to the breakdown for the city. 30% 25% 23% 23% 28% 26% NEWTON 21% 20% Percentage of Households 20% 15% 10% 5% 0% 14% 15% under $30,000 $30,00-59,999 $60,000-99,999 $100, ,000 16% 14% $150,000+ PERSONS IN LOW INCOME In 2015, 15% of Newton s and the city s population were considered low income*. *Persons in low income are based on the Low-Income Measure, After Tax, (LIM-AT). WHALLEY: CITY EXCLUDING CITY CENTRE CENTRE GUILDFORD FLEETWOOD NEWTON 21,535 persons (15%) CLOVERDALE 75,595 persons (15%) SOUTH NEWTON COMMUNITY PROFILE: 2016 CENSUS DATA AND CITY OF STATISTICS 11
110 EDUCATION HIGHEST LEVEL OF EDUCATION ATTAINED In 2016, 48% (16% +32%) of Newton s residents did not have a high school diploma, certificate or degree. This was higher than the city where 42% (12% +30%) of residents did not have a high school diploma, certificate or degree. University certificate diploma or degree at bachelor level or above 25% No certificate, diploma or degree 16% NEWTON High school diploma or equivalent 32% College or other non-university certificate or diploma 21% Apprenticeship or trades certificate or diploma 6% University certificate diploma or degree at bachelor level or above 27% No certificate, diploma or degree 12% High school diploma or equivalent 30% College or other non-university certificate or diploma 24% Apprenticeship or trades certificate or diploma 7% 12 NEWTON COMMUNITY PROFILE: 2016 CENSUS DATA AND CITY OF STATISTICS
111 LABOUR FORCE TOP 5 MAJOR OCCUPATIONS The breakdown of occupations in Newton in 2016 was fairly similar to the breakdown for Surrey. 30% 25% 26%26% 22% 23%23% NEWTON Percentage of Employed Labour Force 20% 15% 10% 5% 0% Sales and service occupations 8% 9% Mangement occupations 14% 13% Business finance and adminstration occupations 8% 9% Occupations in education, law and social, community and government services 19% Trades, transport and equipment operators and related occupations All other occupations Employment The overall labour force participation rate* in Newton in 2016 was 64%, compared with 66% for the city. Self-Employed In 2016, 11% (8,275) of the employed labour force in Newton was self-employed, compared with 12% (31,800) citywide. Unemployment Rate In 2016, 7% of those participating in the labour force were unemployed in Newton and citywide. JOB CENTRE 64% NEWTON 11% NEWTON 7% NEWTON 12% 66% 7% * Participation Rate refers to the labour force, both employed and unemployed individuals, in the week of Sunday, May 1 to Saturday, May 7, 2016, expressed as a percentage of the population aged 15 years and over. NEWTON COMMUNITY PROFILE: 2016 CENSUS DATA AND CITY OF STATISTICS 13
112 JOURNEY TO WORK GETTING TO WORK Driving remained the predominant mode of transportation to work. In 2016, 84% of Newton residents drove to work, higher than the city rate of 81%. However, between 2011 and 2016, transit ridership increased more than any other mode of transportation. During this period there was a 38% increase in transit ridership in Newton and a 32% increase citywide. WALKED OR CYCLED 3% (2,195) 4% (10,125) NEWTON DROVE CAR 84% (57,740) 81% (193,255) NEWTON USED PUBLIC TRANSIT 13% (9,305) 15% (35,560) NEWTON 14 NEWTON COMMUNITY PROFILE: 2016 CENSUS DATA AND CITY OF STATISTICS
113 COMMUTE TIME FOR WORK In 2016, commute times in Newton and in the city were very similar with close to 45% of the population spending less than 30 minutes commuting and the remaining 55% commuting more than 30 minutes. LESS THAN 30 MINUTES 30 TO 59 MINUTES 60 MINUTES AND OVER 45% 39% 16% 46% 38% 16% NEWTON PLACE OF WORK STATUS In 2016, 4% (3,110) of the employed labour force in Newton worked from home, compared with 6% (16,085) citywide. WORKED FROM HOME 4% (3,110) 6% (16,085) NEWTON NEWTON COMMUNITY PROFILE: 2016 CENSUS DATA AND CITY OF STATISTICS 15
114 NEWTON COMMUNITY PROFILE: 2016 CENSUS DATA AND CITY OF STATISTICS
 SOUTH POPULATION RENTERS 77,170 (517,885) IMMIGRANT POPULATION 30% (43%) OCCUPIED PRIVATE DWELLINGS JOB CENTRE 17% (29%) UNEMPLOYMENT RATE 5% (7%) TAKE TRANSIT TO WORK South")
115 Appendix "VIII" SOUTH CITY OF COMMUNITY PROFILES 2016 Census Data City of Surrey Statistics WHALLEY CITY CENTRE GUILDFORD FLEETWOOD NEWTON CLOVERDALE AREA 11,375 ha (32,621 ha) AVERAGE HOUSEHOLD INCOME $115,119 ($93,586) SOUTH POPULATION RENTERS 77,170 (517,885) IMMIGRANT POPULATION 30% (43%) OCCUPIED PRIVATE DWELLINGS JOB CENTRE 17% (29%) UNEMPLOYMENT RATE 5% (7%) TAKE TRANSIT TO WORK South Surrey is rich in history and home to unique neighbourhoods such as Crescent Beach, Grandview Heights and Semiahmoo Town Centre, the commercial and cultural heart of South Surrey. Stunning beaches, mountain views and expansive farmland characterizes the natural beauty of South Surrey. 29,890 (169,970) 8% (15%) City of Surrey statistics in brackets Due to rounding, figures may be slightly lower or higher than stated and percentages may not add up to 100%.
116 POPULATION & FAMILIES POPULATION In 2016, the population of South Surrey was 77,170, 15% of Surrey s total population. : 517,885 (100%) SOUTH 77,170 (15%) SOUTH POPULATION BY FAMILY SIZE In 2016, 52% of families in South Surrey consisted of 2 people, compared with 42% citywide. SOUTH 52% 42% 21% 23% 21% 25% 6% 10% 2 PERSONS 3 PERSONS 4 PERSONS 5 PERSONS 2 SOUTH COMMUNITY PROFILE: 2016 CENSUS DATA AND CITY OF STATISTICS
117 - 3 - POPULATION GROWTH South Surrey s population grew by 12% between 2011 and This was down from a previous high of 15% between 2006 and This was similar to the rate of growth citywide, which grew 11% between 2011 and 2016, down from 19% between 2006 and Population growth between 2011 and % 11% SOUTH POPULATION BY AGE GROUP In 2016, 23% of South Surrey s population was 65 and over, compared to 14% citywide. 50% SOUTH 42% 41% 40% Percentage of Total Population 30% 20% 10% 0% 22% 25% % % % % Age Groups SOUTH COMMUNITY PROFILE: 2016 CENSUS DATA AND CITY OF STATISTICS 3
118 IMMIGRATION TOP 4 ETHNIC GROUPS In 2016, 72% of South Surrey s population was Caucasian, compared to 42% for the city. *South Asian includes East Indian, Pakistani, Sri Lankan, etc. Other 5% Chinese 15% Caucasian 72% South Asian* 6% Korean 2% Other 11% Filipino 6% Caucasian 42% Chinese 8% South Asian* 33% SOUTH IMMIGRANTS * BY PERIOD OF IMMIGRATION In ,850 South Surrey residents were considered recent immigrants having immigrated to Canada between 2011 and At the same time there were 36,335 recent immigrants living citywide in Surrey. * Immigrants include all residents who have been granted the right to live in Canada permanently by immigration authorities. 7,355 37,055 SOUTH 1,890 25,490 3,765 52,570 6,290 68,705 3,805 36,335 IMMIGRATION POPULATION BEFORE SOUTH COMMUNITY PROFILE: 2016 CENSUS DATA AND CITY OF STATISTICS
119 -5- TOP 5 PLACES OF ORIGIN OF RECENT IMMIGRANTS In 2016 the top place of origin of recent immigrants* to South Surrey was China (64%). By comparison, the top place of origin of recent immigrants to the city was India (41%). * Recent immigrants represent those residents who became a landed immigrant between January 2011 and Census Day on May 13, 2016 UNITED KINGDOM 4% CHINA 64% SOUTH KOREA 5% INDIA 3% PHILIPPINES 6% SOUTH Map illustrates the top five places of origin of recent immigrants living in South Surrey in 2016, which equates to 82% of recent immigrants. The remaining 18% were not mapped. IRAQ 3% CHINA 13% INDIA 41% SOUTH KOREA 3% PHILIPPINES 15% Map illustrates the top five places of origin of recent immigrants living in Surrey in 2016, which equates to 75% of recent immigrants. The remaining 25% were not mapped. SOUTH COMMUNITY PROFILE: 2016 CENSUS DATA AND CITY OF STATISTICS 5
120 LANGUAGE MOST COMMON LANGUAGE SPOKEN AT HOME In 2016, 84% of South Surrey residents spoke English at home, much higher than the percentage for the city, where only 66% spoke English. Other Languages 3% Korean 1% Punjabi (Panjabi) 1% English 84% Mandarin 10% Cantonese 1% SOUTH Mandarin 4% Tagalog (Pilipino, Filipino) 2% English 66% Other Languages 9% Hindi 2% Punjabi (Panjabi) 17% 6 SOUTH COMMUNITY PROFILE: 2016 CENSUS DATA AND CITY OF STATISTICS
121 LANGUAGE INDIGENOUS & EDUCATION INDIGENOUS POPULATION BY COMMUNITY In 2016, there were 13,460 people that identified as aboriginal* living in Surrey. Of those 1,565 or 12% lived in South Surrey * Aboriginal Identity refers to persons who report being Aboriginal, which includes First Nations, Métis or Inuit and/or Registered or Treaty Indian, and/or a member of a First Nations or Indian Band. WHALLEY: EXCLUDING CITY CENTRE 2,280 CITY CENTRE 1,230 GUILDFORD 1,575 FLEETWOOD 1,240 NEWTON 3,280 CLOVERDALE 2,295 SOUTH 1,565 PERCENTAGE OF TOTAL POPULATION THAT IS INDIGENOUS In 2016, the percentage of South Surrey s total population that was indigenous was 2% compared to 3% for the city. SOUTH 2% 3% SOUTH COMMUNITY PROFILE: 2016 CENSUS DATA AND CITY OF STATISTICS 7
122 HOUSING NUMBER OF EACH TYPE OF DWELLING UNIT Single family homes remained the dominant residential building type in South Surrey. In 2016 there were 18,180 single and two family dwellings in South Surrey, which represented 61% of private dwellings. This was comparable with the city, where 58% (99,235) of private dwellings were single family. TYPE SOUTH Single Family Dwelling Row/Townhouses Apartments 61% (18,235) 23% (6,925) 16% (4,730) 58% (99,060) 18% (30,440) 24% (40,470) Total Dwellings Units 29, ,970 TENURE Ownership remained the predominant form of tenure in South Surrey and citywide. In 2016, 83% of South Surrey residents owned their home, compared with 71% for the City. However, between 2006 and 2016, the percentage of households who owned decreased while the percentage of households who rented increased. In South Surrey, the percentage of households who rented increased from 15% to 17% and Citywide from 25% to 29% between 2006 and SOUTH Percentage of Each Type of Tenure 100% 90% 80% 70% 60% 50% 40% 30% 20% 10% 0% 17% 29% Renters Between , the percentage of households who owned decreased and the percentage who rented increased in South Surrey and citywide. 83% 71% Owners 8 SOUTH COMMUNITY PROFILE: 2016 CENSUS DATA AND CITY OF STATISTICS
123 - 9 - AVERAGE VALUE OF DWELLINGS The average value of dwellings* continued to increase in South Surrey and citywide between 2006 and In 2016, the average value of a dwelling in South Surrey was $1,079,084, compared with $757,863 citywide. *The average value of a dwelling refers to the value of the entire dwelling, including the value of the land it is on and of any other structure, such as a garage, which is on the property. If the dwelling is located in a building which contains several dwellings, or a combination of residential and business premises, all of which the household owns, the value is estimated as a portion of the market value that applies only to the dwelling in which the household resides. SOUTH $593,634 $446,307 $746,715 $544,819 $1,079,084 $757, HOUSING AFFORDABILITY In Canada, housing is considered unaffordable if it costs more than 30% of a household s before-tax income. In 2016, 43% of renters in South Surrey and 37% citywide spent more than 30% of their income on rent. In comparison 23% of home owners in South Surrey and 25% citywide spent 30% or more of their household income on housing. Unaffordable to Own Unaffordable to Rent Owner households who spent more than 30% of their household income on housing. 23% 25% SOUTH 43% 37% Renter households who spent more than 30% of their household income on rent. OWNERS RENTERS SOUTH COMMUNITY PROFILE: 2016 CENSUS DATA AND CITY OF STATISTICS 9
124 INCOME AVERAGE HOUSEHOLD INCOME In 2015, South Surrey had the highest average household income of all seven Surrey communities, with an average household income of $115,119. WHALLEY: EXCLUDING CITY CENTRE $83,026 CITY CENTRE $58,761 GUILDFORD $87,256 FLEETWOOD $97,637 NEWTON $90,049 CLOVERDALE $103,177 SOUTH $115,119 AVERAGE INCOME BY HOUSEHOLD TYPE In 2015, the census family type with the highest average household income* was couples with children, with an income of $158,958. For each census family type, the average income in South Surrey was higher than those for the city. TYPE SOUTH Couple Families Without Children $123,485 $95,517 Couple Families with Children $158,958 $119,698 Lone-Parent Families $68,231 $62,818 Persons 15 Years and Over Not in Families $52,437 $39,475 All Households $115,119 $93,586 * Household income is the sum of the total income of all members of the household. Income data for families refers to all persons living in the same home who are related by blood, marriage, common-law or adoption. 10 SOUTH COMMUNITY PROFILE: 2016 CENSUS DATA AND CITY OF STATISTICS
125 INCOME DISTRIBUTION In 2015, the percentage of households in South Surrey with an income of more than $150,000 was 23%, compared with 16% for the city. Percentage of Households 30% 25% 20% 15% 10% 5% 0% 14% 15% under $30,000 20% 23% $30,00-59,999 24% 26% $60,000-99,999 19% 20% $100, ,000 23% 16% $150,000+ SOUTH PERSONS IN LOW INCOME In 2015, about 1 in 7 (14%) of the people in South Surrey were considered to be low income*. This was comparable with the percentage for the city, which was 15%. *Persons in low income are based on the Low-Income Measure, After Tax, (LIM-AT). WHALLEY CITY CENTRE GUILDFORD FLEETWOOD NEWTON CLOVERDALE 75,595 persons (15%) SOUTH 10,370 persons (14%) SOUTH COMMUNITY PROFILE: 2016 CENSUS DATA AND CITY OF STATISTICS 11
126 EDUCATION HIGHEST LEVEL OF EDUCATION ATTAINED In 2016, 39% of South Surrey s population aged 25 to 64 had a university degree, compared with 27% for the city. University certificate diploma or degree at bachelor level or above 39% College or other non-university certificate or diploma 27% SOUTH No certificate, diploma or degree 4% High school diploma or equivalent 23% Apprenticeship or trades certificate or diploma 7% University certificate diploma or degree at bachelor level or above 27% No certificate, diploma or degree 12% High school diploma or equivalent 30% College or other non-university certificate or diploma 24% Apprenticeship or trades certificate or diploma 7% 12 SOUTH COMMUNITY PROFILE: 2016 CENSUS DATA AND CITY OF STATISTICS
127 LABOUR FORCE TOP 5 MAJOR OCCUPATIONS In 2016, 17% of South Surrey s employed labour force worked in management occupations compared with 9% citywide. SOUTH Percentage of Employed Labour Force 30% 25% 20% 15% 10% 5% 0% 22% 26% Sales and service occupations 17% 16% 9% Mangement occupations Business finance and adminstration occupations 14% 13% 10% 9% Occupations in education, law and social, community and government services 19% Trades, transport and equipment operators and related occupations 22% 23% All other occupations Employment The overall labour force participation rate* in South Surrey in 2016 was 59%, compared to 66% for the city. Self-Employed In 2016, 19% (7,020) of the employed labour force in South Surrey was self-employed, compared with 12% (31,800) citywide. Unemployment Rate In 2016, 5% of those participating in the labour force in South Surrey were unemployed. This was lower than the percentage for the city, which was 7%. JOB CENTRE 59% 19% SOUTH SOUTH SOUTH 5% 12% 66% 7% * Participation Rate refers to the labour force, both employed and unemployed individuals, in the week of Sunday, May 1 to Saturday, May 7, 2016, expressed as a percentage of the population aged 15 years and over. SOUTH COMMUNITY PROFILE: 2016 CENSUS DATA AND CITY OF STATISTICS 13
128 JOURNEY TO WORK GETTING TO WORK Driving remained the predominant mode of transportation to work. In 2016, 86% of South Surrey residents drove to work, higher than the city rate of 81%. However, between 2011 and 2016, transit ridership increased more than any other mode of transportation. During this period there was a 21% increase in transit ridership in South Surrey and a 32% increase citywide. WALKED OR CYCLED 6% (1,790) 4% (10,125) SOUTH DROVE CAR 86% (25,515) 81% (193,255) SOUTH USED PUBLIC TRANSIT 8% (2,400) 15% (35,560) SOUTH 14 SOUTH COMMUNITY PROFILE: 2016 CENSUS DATA AND CITY OF STATISTICS
129 COMMUTE TIME FOR WORK In 2016 in South Surrey, 52% (38% + 14%) of those in the workforce commuted more than 30 minutes and of those, 14% commuted more than an hour to work. In comparison, 54% (38% + 16%) of Surrey s workforce commuted more than 30 minutes and of those, 16% commuted more than an hour to work. LESS THAN 30 MINUTES 30 TO 59 MINUTES 60 MINUTES AND OVER 48% 38% 14% 46% 38% 16% SOUTH PLACE OF WORK STATUS In 2016, 14% (4,955) of the employed labour force in South Surrey worked from home, compared with 6% (16,085) citywide. WORKED FROM HOME 14% (4,955) 6% (16,085) SOUTH SOUTH COMMUNITY PROFILE: 2016 CENSUS DATA AND CITY OF STATISTICS 15
130 - 16 -
 SOUTH POPULATION 75,610 (517,885) IMMIGRANT POPULATION 49% (43%) OCCUPIED PRIVATE DWELLINGS JOB CENTRE RENTERS 37% (29%) UNEMPLOYMENT RATE 7% (7%) TAKE TRANSIT TO WORK")
131 Appendix "IX" WHALLEY CITY OF COMMUNITY PROFILES 2016 Census Data City of Surrey Statistics WHALLEY CITY CENTRE GUILDFORD FLEETWOOD NEWTON CLOVERDALE AREA 3,131 ha (32,621 ha) AVERAGE HOUSEHOLD INCOME $83,026 ($93,586) SOUTH POPULATION 75,610 (517,885) IMMIGRANT POPULATION 49% (43%) OCCUPIED PRIVATE DWELLINGS JOB CENTRE RENTERS 37% (29%) UNEMPLOYMENT RATE 7% (7%) TAKE TRANSIT TO WORK Whalley takes its name from Mr. Arthur Whalley, who settled near the corner of King George Boulevard and 108th Avenue in The area, then known as Whalley s Corner, has grown into a bustling commercial centre now known as City Centre. For the purpose of this profile, Whalley excludes the City Centre (which has its own profile). 21,980 (169,970) 20% (15%) City of Surrey statistics in brackets Due to rounding, figures may be slightly lower or higher than stated and percentages may not add up to 100%.
AVERAGE HOUSEHOLD INCOME $103,177 ($93,586) RENTERS 21% (29%) UNEMPLOYMENT RATE 5% (7%) TAKE TRANSIT TO WORK 6% (15%)
 RENTERS 21% (29%) UNEMPLOYMENT RATE 5% (7%) TAKE TRANSIT TO WORK 6% (15%)") CITY OF COMMUNITY PROFILES 2016 Census Data City of Surrey Statistics WHALLEY CITY CENTRE GUILDFORD FLEETWOOD NEWTON AREA 4,917 ha (32,621 ha) AVERAGE HOUSEHOLD INCOME $103,177 ($93,586) SOUTH POPULATION
CITY OF COMMUNITY PROFILES 2016 Census Data City of Surrey Statistics WHALLEY CITY CENTRE GUILDFORD FLEETWOOD NEWTON AREA 4,917 ha (32,621 ha) AVERAGE HOUSEHOLD INCOME $103,177 ($93,586) SOUTH POPULATION
AVERAGE HOUSEHOLD INCOME $97,637 ($93,586) RENTERS 22% (29%) UNEMPLOYMENT RATE 7% (7%) TAKE TRANSIT TO WORK 15% (15%)
 RENTERS 22% (29%) UNEMPLOYMENT RATE 7% (7%) TAKE TRANSIT TO WORK 15% (15%)") CITY OF COMMUNITY PROFILES 2016 Census Data City of Surrey Statistics WHALLEY CITY CENTRE GUILDFORD NEWTON CLOVERDALE AREA 1,809 ha (32,621 ha) AVERAGE HOUSEHOLD INCOME $97,637 ($93,586) SOUTH POPULATION
CITY OF COMMUNITY PROFILES 2016 Census Data City of Surrey Statistics WHALLEY CITY CENTRE GUILDFORD NEWTON CLOVERDALE AREA 1,809 ha (32,621 ha) AVERAGE HOUSEHOLD INCOME $97,637 ($93,586) SOUTH POPULATION
$58,761 ($93,586) 57% (29%) 8% (7%) 36% (15%)
 57% (29%) 8% (7%) 36% (15%)") CITY OF COMMUNITY PROFILES 2016 Census Data City of Surrey Statistics CITY WHALLEY GUILDFORD FLEETWOOD NEWTON CLOVERDALE AREA 548 ha (32,621 ha) AVERAGE HOUSEHOLD INCOME $58,761 ($93,586) SOUTH POPULATION
CITY OF COMMUNITY PROFILES 2016 Census Data City of Surrey Statistics CITY WHALLEY GUILDFORD FLEETWOOD NEWTON CLOVERDALE AREA 548 ha (32,621 ha) AVERAGE HOUSEHOLD INCOME $58,761 ($93,586) SOUTH POPULATION
AVERAGE HOUSEHOLD INCOME $83,026 ($93,586) RENTERS 37% (29%) UNEMPLOYMENT RATE 7% (7%) TAKE TRANSIT TO WORK 20% (15%)
 RENTERS 37% (29%) UNEMPLOYMENT RATE 7% (7%) TAKE TRANSIT TO WORK 20% (15%)") CITY OF COMMUNITY PROFILES 2016 Census Data City of Surrey Statistics CITY CENTRE GUILDFORD FLEETWOOD NEWTON CLOVERDALE AREA 3,131 ha (32,621 ha) AVERAGE HOUSEHOLD INCOME $83,026 ($93,586) SOUTH POPULATION
CITY OF COMMUNITY PROFILES 2016 Census Data City of Surrey Statistics CITY CENTRE GUILDFORD FLEETWOOD NEWTON CLOVERDALE AREA 3,131 ha (32,621 ha) AVERAGE HOUSEHOLD INCOME $83,026 ($93,586) SOUTH POPULATION
Planning Study Area 1 Burnaby Heights
 Neighbourhood Profiles 2006 Census Planning Study Area 1 Heights is bounded by Burrard Inlet to the north, Willingdon Avenue to the east, Hastings Street to the south and Boundary Road to the west. PLANNING
Social and Demographic Trends in Burnaby and Neighbouring Communities 1981 to 2006
 Social and Demographic Trends in and Neighbouring Communities 1981 to 2006 October 2009 Table of Contents October 2009 1 Introduction... 2 2 Population... 3 Population Growth... 3 Age Structure... 4 3
COMMUNITY PROFILE TOWNSHIP OF LANGLEY. Township of Langley Immigrant Demographics I Page 1
 COMMUNITY PROFILE TOWNSHIP OF LANGLEY Township of Langley Demographics I Page 1 TOWNSHIP OF LANGLEY IMMIGRANT DEMOGRAPHICS Your quick and easy look at facts and figures around immigration. Newcomers are
new westminster, B.C New Westminster Immigrant Demographics I
 Immigrant demographics new westminster, B.C. - 2018 Immigrant Demographics I Page 1 new westminster IMMIGRANT DEMOGRAPHICS Your quick and easy look at facts and figures around immigration. Newcomers are
Corporate. Report COUNCIL DATE: April 28, 2008 NO: R071 REGULAR COUNCIL. TO: Mayor & Council DATE: April 28, 2008
 Corporate NO: R071 Report COUNCIL DATE: April 28, 2008 REGULAR COUNCIL TO: Mayor & Council DATE: April 28, 2008 FROM: General Manager, Planning and Development FILE: 6600-01 SUBJECT: 2006 Census Information
TOWNSHIP OF LANGLEY, B.C Township of Langley Immigrant Demographics I
 Immigrant demographics TOWNSHIP OF LANGLEY, B.C. - 2018 Township of Langley Immigrant Demographics I Page 1 TOWNSHIP OF LANGLEY IMMIGRANT DEMOGRAPHICS Your quick and easy look at facts and figures around
Immigrant. coquitlam, B.C Coquitlam Immigrant Demographics I
 Immigrant demographics coquitlam, B.C. - 2018 Immigrant Demographics I Page 1 coquitlam IMMIGRANT DEMOGRAPHICS Your quick and easy look at facts and figures around immigration. Newcomers are an important
Immigrant PORT COQUITLAM, B.C Port Coquitlam Immigrant Demographics I
 Immigrant demographics PORT COQUITLAM, B.C. - 2018 Immigrant Demographics I Page 1 PORT COQUITLAM IMMIGRANT DEMOGRAPHICS Your quick and easy look at facts and figures around immigration. Newcomers are
Immigrant DELTA, B.C Delta Immigrant Demographics I
 Immigrant demographics DELTA, B.C. - 2018 Immigrant Demographics I Page 1 DELTA IMMIGRANT DEMOGRAPHICS Your quick and easy look at facts and figures around immigration. Newcomers are an important and growing
2011 CENSUS & NATIONAL HOUSEHOLD SURVEY CITY OF BRAMPTON - WARD 10 PROFILE
 2011 CENSUS & NATIONAL HOUSEHOLD SURVEY CITY OF BRAMPTON WARD 10 PROFILE WARD HIGHLIGHTS Population 10.72% of total population 56,185 2011 Population 33 Median Age 50.1% Females 49.9% Males 2011 Population
Saanich A District Municipality in Capital Regional District
 Produced by Stats for Population Total Immigrants Change in Change in Immigrants Population Number Percent Population Number Percent 1991 95,583 20,285 21.2 1991 to 1996 5,805 755 3.7 1996 101,388 21,040
2011 National Household Survey Profile on the Town of Richmond Hill: 1st Release
 2011 National Household Survey Profile on the Town of Richmond Hill: 1st Release Every five years the Government of Canada through Statistics Canada undertakes a nationwide Census. The purpose of the Census
Nanaimo A City in Nanaimo Regional District
 A City in Regional District Produced by Stats for Population Total Immigrants Change in Change in Immigrants Population Number Percent Population Number Percent 1991 6,129 8,885 14.8 1991 to 1996,1 2,44
COMMUNITY PROFILE BURNABY
 COMMUNITY PROFILE BURNABY Burnaby Demographics I Page 1 BURNABY IMMIGRANT DEMOGRAPHICS Your quick and easy look at facts and figures around immigration. Newcomers are an important and growing part of your
View Royal A Town in Capital Regional District
 Produced by Stats for Global NonResponse Rate: 18.4 Population Total Immigrants Change in Change in Immigrants Population Number Percent Population Number Percent 1991 5,996 9 15.6 1991 to 1996 445 315
COMMUNITY PROFILE COQUITLAM. Coquitlam Immigrant Demographics I Page 1
 COMMUNITY PROFILE COQUITLAM Coquitlam Demographics I Page 1 COQUITLAM IMMIGRANT DEMOGRAPHICS Your quick and easy look at facts and figures around immigration. Newcomers are an important and growing part
Study Area Maps. Profile Tables. W Broadway & Cambie St, Vancouver, BC Pitney Bowes 2016 Estimates and Projections. W Broadway & Cambie St
 Powered by PCensus Page 1 Study Area Maps Profile Tables 2016 Demographic Snapshot Population Trends Household Trends Population by Age and Sex Comparison Population by Age and Sex Household Maintainers
CENSUS RESULTS WARD 10 PROFILE
 2011 CENSUS RESULTS WARD 10 PROFILE Town of Halton Hills City of Brampton Hwy. 407 Finch Ave. Town of Milton Hwy. 407 ETR Ninth Line 10 Derry Rd. Winston Churchill Blvd. 9 Erin Mills Pkwy. Mississauga
East Kootenay A Regional District in British Columbia
 Produced by Stats for Global Non-Response Rate: 35.5 Population Total Immigrants Change in Change in Immigrants Population Number Percent Population Number Percent 1991 52,368 5,9 11.3 1991 to 1996 3,998-55
2011 CENSUS & NATIONAL HOUSEHOLD SURVEY CITY OF BRAMPTON - WARD 4 PROFILE
 2011 CENSUS & NATIONAL HOUSEHOLD SURVEY CITY OF BRAMPTON WARD 4 PROFILE WARD HIGHLIGHTS Population 9.51% of total population 49,850 2011 Population 34 Median Age 50.5% Females 49.5% Males 2011 Population
CENSUS RESULTS WARD 9 PROFILE
 2011 CENSUS RESULTS WARD 9 PROFILE Town of Halton Hills City of Brampton Hwy. 407 Finch Ave. Town of Milton Hwy. 407 ETR Ninth Line 10 Derry Rd. Winston Churchill Blvd. 9 Erin Mills Pkwy. Mississauga Rd.
Skeena-Queen Charlotte A Regional District in British Columbia
 Global NonResponse Rate: 34.7 Population Total Immigrants Change in Change in Immigrants Population Number Percent Population Number Percent 1991 24,287 3,125 12.9 1991 to 1996 58 27 8.6 1996 24,795 2,855
CENSUS RESULTS WARD 3 PROFILE
 2011 CENSUS RESULTS WARD 3 PROFILE Town of Halton Hills City of Brampton Hwy. 407 Finch Ave. Town of Milton Hwy. 407 ETR Ninth Line 10 Derry Rd. Winston Churchill Blvd. 9 Erin Mills Pkwy. Mississauga Rd.
Castlegar A City in Central Kootenay Regional District
 Produced by Stats for Population Total Immigrants Change in Change in Immigrants Population Number Percent Population Number Percent 1991 6,579 885 13.5 1991 to 1996 448 45 5.1 1996 7,27 93 13.2 1996 to
2011 CENSUS & NATIONAL HOUSEHOLD SURVEY CITY OF BRAMPTON - WARD 1 PROFILE
 CENSUS & NATIONAL HOUSEHOLD SURVEY CITY OF BRAMPTON WARD 1 PROFILE WARD HIGHLIGHTS Population 53,130 Population 51.0% Females Population by Age Group 9% 20% 014 10.14% of total population 36 Median Age
North York City of Toronto Community Council Area Profiles 2016 Census
 Bar Chart showing the rate of population growth between the years 2006 and 2016 for the Ward compared to the City of based on the 2006 and data. For more information, please contact Michael Wright at 416-392-7558
2011 CENSUS & NATIONAL HOUSEHOLD SURVEY CITY OF BRAMPTON - WARD 3 PROFILE
 2011 CENSUS & NATIONAL HOUSEHOLD SURVEY CITY OF BRAMPTON WARD 3 PROFILE WARD HIGHLIGHTS Population 47,500 2011 Population 50.7% Females 2011 Population by Age Group 13% 18% 014 9.07% of total population
Northern Rockies Regional Municipality A Regional Municipality in Northern Rockies Regional District
 Produced by Stats for Global NonResponse Rate: 39.2 Population Total Immigrants Change in Change in Immigrants Population Number Percent Population Number Percent 1991 1991 to 1996 1996 1996 to 21 21 21
Burnaby A City in Greater Vancouver Regional District
 Produced by Stats for Global Non-Response Rate: 23.6 Population Total Change in Change in Population Number Percent Population Number Percent 1991 158,858 49,5 31.2 1991 to 1996,351 24,5 49.1 1996 179,9
CENSUS RESULTS WARD 7 PROFILE
 2011 CENSUS RESULTS WARD 7 PROFILE Town of Halton Hills City of Brampton Hwy. 407 Finch Ave. Town of Milton Hwy. 407 ETR Ninth Line 10 Derry Rd. Winston Churchill Blvd. 9 Erin Mills Pkwy. Mississauga Rd.
City of Surrey. Preface. Citizenship and Immigration Fact Sheet
 City of Citizenship and Immigration Fact Sheet Preface Statistics Canada conducts its Census of Population every five years with the most recent census having occurred in 2006. The Census provides information
City of Surrey. Labour Force Fact Sheet. Preface
 City of Preface Every five years, Statistics Canada conducts a Census of Population in order to develop a statistical portrait of Canada and its people. The most recent Census was conducted in May 2011.
Alberta Provincial Electoral Divisions. Calgary-McCall. Compiled from the 2016 Census of Canada
 Alberta Provincial Electoral Divisions Calgary-McCall Compiled from the 2016 Census of Canada July 2018 Introduction The following report produced by the Office of Statistics and Information presents a
Salmon Arm A City in Columbia-Shuswap Regional District
 Produced by Stats for Global NonResponse Rate: 22.8 Population Total Change in Change in Population Number Percent Population Number Percent 1991 12,115 1,365 11.3 1991 to 1996 2,549 25 18.3 1996 14,664
CENSUS RESULTS WARD 6 PROFILE
 2011 CENSUS RESULTS WARD 6 PROFILE Town of Halton Hills City of Brampton Hwy. 407 Finch Ave. Town of Milton Hwy. 407 ETR Ninth Line 10 Derry Rd. Winston Churchill Blvd. 9 Erin Mills Pkwy. Mississauga Rd.
Strathcona A Regional District in British Columbia
 Produced by Stats for Population Total Immigrants Change in Change in Immigrants Population Number Percent Population Number Percent 1991 - - - 1991 to 1996 - - - 1996 - - - 1996 to 1 - - - 1 - - - 1 to
people/hectare Ward Toronto
 Bar Chart showing the rate of population growth between the years 2006 and 2016 for the Ward compared to the City of based on the 2006 and data. For more information, please contact Michael Wright at 416-392-7558
Osoyoos A Town in Okanagan-Similkameen Regional District
 A Town in OkanaganSimilkameen Regional District Produced by Stats for Global NonResponse Rate: 38.5 Population Total Immigrants Change in Change in Immigrants Population Number Percent Population Number
Scarborough City of Toronto Community Council Area Profiles 2016 Census
 Bar Chart showing the rate of population growth between the years 2006 and 2016 for the Ward compared to the City of based on the 2006 and data. For more information, please contact Michael Wright at 416-392-7558
Grand Forks A City in Kootenay-Boundary Regional District
 A City in KootenayBoundary Regional District Produced by Stats for Global NonResponse Rate: 45.8 Population Total Immigrants Change in Change in Immigrants Population Number Percent Population Number Percent
Ward 4 Etobicoke Centre City of Toronto Ward Profiles 2016 Census
 Bar Chart showing the rate of population growth between the years 2006 and 2016 for the Ward compared to the City of based on the 2006 and data. For more information, please contact Michael Wright at 416-392-7558
Quesnel A City in Cariboo Regional District
 Produced by Stats for Global NonResponse Rate:.4 Population Total Immigrants Change in Change in Immigrants Population Number Percent Population Number Percent 1991 8,8 1,35 16.4 1991 to 1996 26 5.4 1996
Alberta Provincial Electoral Divisions. Lacombe- Ponoka. Compiled from the 2016 Census of Canada
 Alberta Provincial Electoral Divisions Lacombe- Ponoka Compiled from the 2016 Census of Canada July 2018 Introduction The following report produced by the Office of Statistics and Information presents
Powell River A City in Powell River Regional District
 A City in Regional District Produced by Stats for Population Total Immigrants Change in Change in Immigrants Population Number Percent Population Number Percent 1991 12,991 1,965 15.1 1991 to 1996 14 4
CENSUS RESULTS WARD 8 PROFILE
 2011 CENSUS RESULTS WARD 8 PROFILE Town of Halton Hills City of Brampton Hwy. 407 Finch Ave. Town of Milton Hwy. 407 ETR Ninth Line 10 Derry Rd. Winston Churchill Blvd. 9 Erin Mills Pkwy. Mississauga Rd.
North Vancouver, City of A City in Greater Vancouver Regional District
 Global Non-Response Rate: 25.8 Population Total Immigrants Change in Change in Immigrants Population Number Percent Population Number Percent 1991 38,436,8 28.2 1991 to 1996 3,39 2,46 22.7 1996 41,475
Port McNeill A Town in Mount Waddington Regional District
 Produced by Stats for Global NonResponse Rate: 35.1 Population Total Immigrants Change in Change in Immigrants Population Number Percent Population Number Percent 1991 2,641 225 8.5 1991 to 1996 284 5
Alberta Provincial Electoral Divisions. Calgary-Shaw. Compiled from the 2016 Census of Canada
 Alberta Provincial Electoral Divisions Calgary-Shaw Compiled from the 2016 Census of Canada July 2018 Introduction The following report produced by the Office of Statistics and Information presents a statistical
Alberta Provincial Electoral Divisions
 Alberta Provincial Electoral Divisions Edmonton-Decore Compiled from the 2011 Census of Canada and National Household Survey Introduction This report presents the statistical profile for the Provincial
Alberta Provincial Electoral Divisions
 Alberta Provincial Electoral Divisions Calgary-Foothills Compiled from the 2011 Census of Canada and National Household Survey Introduction This report presents the statistical profile for the Provincial
(Note: These are inititial neighbourhood estimates and are subject to change.) NEI Score. 1,000 Female 52%
 NEI Score. 1,000 Female 52%") 0-4 5-9 10-14 15-19 20-24 25-29 30-34 35-39 40-44 45-49 50-54 55-59 60-64 65-69 70-74 75-79 80-84 85-89 90-94 95-99 100+ 2011 Neighbourhood Demographic Estimates EGLINTON AVE E C P R DON VALLEY PARKWAY
0-4 5-9 10-14 15-19 20-24 25-29 30-34 35-39 40-44 45-49 50-54 55-59 60-64 65-69 70-74 75-79 80-84 85-89 90-94 95-99 100+ 2011 Neighbourhood Demographic Estimates EGLINTON AVE E C P R DON VALLEY PARKWAY
Cache Creek A Village in Thompson-Nicola Regional District
 A Village in ThompsonNicola Regional District Produced by Stats for Global NonResponse Rate: 39.1 Population Total Immigrants Change in Change in Immigrants Population Number Percent Population Number
BRAMALEA. Overview A. Demographic and Cultural Characteristics
 The Social Planning Council of Peel Portraits of Peel BRAMALEA Overview 13-1 A. Demographic and Cultural Characteristics Population: Size, Age and Growth 13-2 Immigrants 13-3 Visible Minorities 13-4 Language
CENSUS RESULTS NATIONAL HOUSEHOLD SURVEY
 2011 CENSUS RESULTS NATIONAL HOUSEHOLD SURVEY INTRODUCTION The inaugural National Household Survey (NHS) was a voluntary survey which replaced the mandatory long-form census questionnaire. The NHS was
Alberta Provincial Electoral Divisions
 Alberta Provincial Electoral Divisions Calgary-Mackay-Nose Hill Compiled from the 2011 Census of Canada and National Household Survey Introduction This report presents the statistical profile for the Provincial
Victoria A City in Capital Regional District
 Produced by Stats for Global Non-Response Rate: 24.6 Population Total Immigrants Change in Change in Immigrants Population Number Percent Population Number Percent 1991 71,228 14,665 20.6 1991 to 1996
Ward 17 Davenport City of Toronto Ward Profiles 2016 Census
 Bar Chart showing the rate of population growth between the years 2006 and 2016 for the Ward compared to the City of based on the 2006 and data. For more information, please contact Michael Wright at 416-392-7558
Parksville A City in Nanaimo Regional District
 Produced by Stats for Global NonResponse Rate: 2.3 Population Total Immigrants Change in Change in Immigrants Population Number Percent Population Number Percent 1991 7,381 1,27 17.2 1991 to 1996 2,91
North Okanagan A Regional District in British Columbia
 Population Total Immigrants Change in Change in Immigrants Population Number Percent Population Number Percent 1991 61,744 7,855 12.7 1991 to 1996 9,863 685 8.7 1996 71,67 8,54 11.9 1996 to 1 1,6-28 -
Changing Faces Profile of Burlington Newcomers. November 2010
 Changing Faces Profile of Burlington Newcomers November 2010 2010 Community Development Halton, all rights reserved. Copies of this document may be reproduced non-commercially for the purpose of community
City of Surrey. Preface. Labour Force Fact Sheet
 City of Labour Force Fact Sheet Preface Statistics Canada conducts its Census of Population every five years with the most recent census having occurred in 2006. The Census provides information on the
CITY OF MISSISSAUGA. Overview 2-1. A. Demographic and Cultural Characteristics
 Portraits of Peel Overview 2-1 A. Demographic and Cultural Characteristics Population: Size, Age and Growth 2-2 Immigrants 2-3 Visible Minorities 2-4 Language 2-5 Religion 2-6 Mobility Status 2-7 B. Household
Lake Country A District Municipality in Central Okanagan Regional District
 Produced by Stats for Population Total Immigrants Change in Change in Immigrants Population Number Percent Population Number Percent 1991 1991 to 1996 1996 9,7 1,275 14.2 1996 to 1 26 7 5.5 1 9,267 1,345
Ward 14 Parkdale-High Park City of Toronto Ward Profiles 2016 Census
 Bar Chart showing the rate of population growth between the years 2006 and 2016 for the Ward compared to the City of based on the 2006 and data. For more information, please contact Michael Wright at 416-392-7558
Spryfield Highlights. Household Living Arrangements. The following are highlights from the 2016 Census.
 Highlights The following are highlights from the 2016 Census., as defined for United Way's Action for Neighbourhood Change, had a Census population of 11,700 in 2016. The outline shown to the right, and
Creston A Town in Central Kootenay Regional District
 Produced by Stats for Global NonResponse Rate: 32.4 Population Total Immigrants Change in Change in Immigrants Population Number Percent Population Number Percent 1991 4,27 655 15.6 1991 to 1996 69 175
Fort St. James A District Municipality in Bulkley-Nechako Regional District
 A District Municipality in BulkleyNechako Regional District Produced by Stats for Global NonResponse Rate: 36.9 Population Total Immigrants Change in Change in Immigrants Population Number Percent Population
2016 Census: Housing, Immigration and Ethnocultural Diversity, Aboriginal peoples
 October 26, 2017 Backgrounder 2016 Census: Housing, Immigration and Ethnocultural Diversity, Aboriginal peoples The 2016 Census Day was May 10, 2016. On October 25, 2017, Statistics Canada released data
Harrison Hot Springs A Village in Fraser Valley Regional District
 Global NonResponse Rate: 42.4 Population Total Immigrants Change in Change in Immigrants Population Number Percent Population Number Percent 1991 655 17 26. 1991 to 1996 243 3 17.6 1996 898 2 22.3 1996
CENSUS BULLETIN #5 Immigration and ethnocultural diversity Housing Aboriginal peoples
 CENSUS BULLETIN #5 Immigration and ethnocultural diversity Housing Aboriginal peoples October 25, 217 Bulletin Highlights: 86.1 per cent of the Brampton s 216 surveyed population held a Canadian citizenship
Dufferin Grove: Neighbourhood Profile
 I. Population and Age Population 21 Neighbourhood Population: 12693 12% of Catchment Area Population: Change in population growth (1996-21): # 145 % 1% same as pop change in the catchment area Population
(Note: These are inititial neighbourhood estimates and are subject to change.) C N R. NEI Score. Female 54%
 C N R. NEI Score. Female 54%") 0-4 5-9 10-14 15-19 20-24 25-29 30-34 35-39 40-44 45-49 50-54 55-59 60-64 65-69 70-74 75-79 80-84 85-89 90-94 95-99 100+ 2011 Neighbourhood Demographic Estimates STANSBURY CRES MIDLAND AVE CITADEL DR WEST
0-4 5-9 10-14 15-19 20-24 25-29 30-34 35-39 40-44 45-49 50-54 55-59 60-64 65-69 70-74 75-79 80-84 85-89 90-94 95-99 100+ 2011 Neighbourhood Demographic Estimates STANSBURY CRES MIDLAND AVE CITADEL DR WEST
Alberta Provincial Electoral Divisions
 Alberta Provincial Electoral Divisions Innisfail-Sylvan Lake Compiled from the 2011 Census of Canada and National Household Survey Introduction This report presents the statistical profile for the Provincial
Lake Cowichan A Town in Cowichan Valley Regional District
 Global NonResponse Rate: 28 Population Total Change in Change in Population Number Percent Population Number Percent 1991 2,241 295 13.2 1991 to 1996 615 15 5.1 1996 2,856 28 9.8 1996 to 21 29 2 7.1 21
Logan Lake A District Municipality in Thompson-Nicola Regional District
 A District Municipality in ThompsonNicola Regional District Produced by Stats for Global NonResponse Rate: 48.9 Population Total Immigrants Change in Change in Immigrants Population Number Percent Population
Ward 16 River. City of Ottawa Ward Profiles 2011 Census and National Household Survey POPULATION* 45, ,390. Total City of Ottawa Population
 POPULATION* Total Ward Population 45,795 +2.0% 2006-2011 Total City of Ottawa Population 883,390 +8.8% 2006-2011 Population by Age Group Ward 16 City of Ottawa 2006 2011 06-11 2006 2011 06-11 Age Group
Nelson A City in Central Kootenay Regional District
 Produced by Stats for Global NonResponse Rate: 28.3 Population Total Immigrants Change in Change in Immigrants Population Number Percent Population Number Percent 1991 8,849 1,175 13.3 1991 to 1996 736
Highlands A District Municipality in Capital Regional District
 Produced by Stats for Global NonResponse Rate: 33 Population Total Immigrants Change in Change in Immigrants Population Number Percent Population Number Percent 1991 1,94 1991 to 1996 329 1996 1,423 21
Verdun borough HIGHLIGHTS. In 1996, the Verdun borough had a population of 59,714. LOCATION
 Socio-economic profile borough February 2002 HIGHLIGHTS In 1996, the borough had a population of 59,714. LOCATION Between 1991 and 1996, the population of the borough declined by 2.6%. One-person households
(Note: These are inititial neighbourhood estimates and are subject to change.) C P R. NEI Score. 600 Female 51%
 C P R. NEI Score. 600 Female 51%") 0-4 5-9 10-14 15-19 20-24 25-29 30-34 35-39 40-44 45-49 50-54 55-59 60-64 65-69 70-74 75-79 80-84 85-89 90-94 95-99 100+ 2011 Neighbourhood Demographic Estimates STEELES AVE W FENMAR DR C P R GARYRAY DR
0-4 5-9 10-14 15-19 20-24 25-29 30-34 35-39 40-44 45-49 50-54 55-59 60-64 65-69 70-74 75-79 80-84 85-89 90-94 95-99 100+ 2011 Neighbourhood Demographic Estimates STEELES AVE W FENMAR DR C P R GARYRAY DR
Population and Dwelling Counts
 Release 1 Population and Dwelling Counts Population Counts Quick Facts In 2016, Conception Bay South had a population of 26,199, representing a percentage change of 5.4% from 2011. This compares to the
Keelesdale-Eglinton West
 BLACK CREEK DR 0-4 5-9 10-14 15-19 20-24 25-29 30-34 KEELE ST 35-39 40-44 45-49 50-54 -59 KANE AVE 60-64 65-69 70-74 75-79 80-84 85-89 90-94 95-99 100+ 2011 Neighbourhood Demographic Estimates EGLINTON
The Future of North West Sydney
 The Future of North West Sydney AUGUST 2018 2 Contents Demographic & Education Trends in Sydney s North West 5 Methodology 7 Sydney s North West 8 Population growth 8 Age profile 9 Student enrolments 12
Bostwick Neighbourhood Profile
 Bostwick Profile For further information contact: John-Paul Sousa Planning Research Analyst Direct: (519) 661-2500 ext. 5989 I email: jpsousa@london.ca Page 1 Page 2 Population Characteristics & Age Distribution
Fanshawe Neighbourhood Profile
 Fanshawe Profile For further information contact: John-Paul Sousa Planning Research Analyst Direct: (519) 661-2500 ext. 5989 I email: jpsousa@london.ca Page 1 Page 2 Population Characteristics & Age Distribution
If this information is required in an accessible format, please contact ext. 2564
 If this information is required in an accessible format, please contact 1-800-372-1102 ext. 2564 From: Report: Date: Commissioner of Planning and Economic Development #2018-INFO-53 April 13, 2018 Subject:
(Note: These are inititial neighbourhood estimates and are subject to change.) 1,000 Female 54%
 1,000 Female 54%") LAWRENCE AVE E 0-4 5-9 10-14 15-19 20-24 25-29 30-34 35-39 40-44 45-49 50-54 55-59 60-64 65-69 70-74 75-79 80-84 85-89 90-94 95-99 100+ 2011 Neighbourhood Demographic Estimates RAILSIDE RD C P R DON RIVER
LAWRENCE AVE E 0-4 5-9 10-14 15-19 20-24 25-29 30-34 35-39 40-44 45-49 50-54 55-59 60-64 65-69 70-74 75-79 80-84 85-89 90-94 95-99 100+ 2011 Neighbourhood Demographic Estimates RAILSIDE RD C P R DON RIVER
Enderby A City in North Okanagan Regional District
 Produced by Stats for Global NonResponse Rate: 44.3 Population Total Immigrants Change in Change in Immigrants Population Number Percent Population Number Percent 1991 2,128 23.8 1991 to 1996 626 3 13.
(Note: These are inititial neighbourhood estimates and are subject to change.) SCARBOROUGH SHORELINE. NEI Score. 1,500 Female 53%
 SCARBOROUGH SHORELINE. NEI Score. 1,500 Female 53%") 0-4 5-9 10-14 15-19 20-24 25-29 30-34 35-39 40-44 45-49 50-54 55-59 60-64 65-69 70-74 75-79 80-84 85-89 90-94 95-99 100+ 2011 Neighbourhood Demographic Estimates HIGHLAND CREEK WEST HIGHLAND CREEK KINGSTON
0-4 5-9 10-14 15-19 20-24 25-29 30-34 35-39 40-44 45-49 50-54 55-59 60-64 65-69 70-74 75-79 80-84 85-89 90-94 95-99 100+ 2011 Neighbourhood Demographic Estimates HIGHLAND CREEK WEST HIGHLAND CREEK KINGSTON
Employment outcomes of postsecondary educated immigrants, 2006 Census
 Employment outcomes of postsecondary educated immigrants, 2006 Census Li Xue and Li Xu September 2010 Research and Evaluation The views and opinions expressed in this document are those of the author(s)
Chairman and Members of the Planning and Development Committee. Thomas S. Mokrzycki, Commissioner of Planning and Building
 CD.15.DAT DATE: TO: FROM: SUBJECT: Chairman and Members of the Planning and Development Committee Thomas S. Mokrzycki, Commissioner of Planning and Building Mississauga: A City of Many Cultures MEETING
HIGHLIGHTS. 62% with postsecondary 58% $1,081 average monthly rent. $1,026 average monthly rent. China #1 immigrant. China #1 immigrant place of birth
 HIGHLIGHTS Ward Toronto 2010 Household Income 62% with postsecondary certificate, diploma or degree 58% with postsecondary certificate, diploma or degree 30% 25% 20% 15% 10% 5% $1,081 average monthly rent
Canada at 150 and the road ahead A view from Census 2016
 Canada at 150 and the road ahead A view from Census 2016 Dr. Doug Norris Senior Vice President and Chief Demographer 2017 Environics Analytics User Conference November 8, 2017 Canada continues to lead
Immigrant Seniors in British Columbia
 Immigrant Seniors in British Columbia December 2010 Immigrant Seniors in British Columbia Most people who immigrate as seniors come to B.C. to reunite with their families. In fact, 86.2% of the 5,733 new
(Note: These are inititial neighbourhood estimates and are subject to change.) C P R. NEI Score. Female 52%
 C P R. NEI Score. Female 52%") 0-4 5-9 10-14 15-19 20-24 25-29 30-34 JANE ST 35-39 40-44 45-49 50-54 55-59 60-64 65-69 70-74 75-79 80-84 85-89 90-94 95-99 100+ 2011 Neighbourhood Demographic Estimates EGLINTON AVE W JANE ST WESTON RD
0-4 5-9 10-14 15-19 20-24 25-29 30-34 JANE ST 35-39 40-44 45-49 50-54 55-59 60-64 65-69 70-74 75-79 80-84 85-89 90-94 95-99 100+ 2011 Neighbourhood Demographic Estimates EGLINTON AVE W JANE ST WESTON RD
HIGHLIGHTS Ward Toronto. 67% with postsecondary 58% $1,040 average monthly rent. $ $1,026 average monthly rent. China #1 immigrant place of birth
 HIGHLIGHTS Ward Toronto 2010 Household Income 67% with postsecondary certificate, diploma or degree 58% with postsecondary certificate, diploma or degree 30% 25% 20% 15% 10% 5% $1,040 average monthly rent