Daniel Treisman ELECTIONS IN RUSSIA, University of California, Los Angeles
|
|
|
- Aleesha Carpenter
- 6 years ago
- Views:
Transcription
1 Daniel Treisman ELECTIONS IN RUSSIA, University of California, Los Angeles Moscow State University - Higher School of Economics
2 Treisman D. Elections in Russia, : Working paper WP7/2009/06. Moscow: State University Higher School of Economics р. In this paper, I review the main trends in voting in national elections in Russia since 1991, discuss the evidence of manipulation or falsification by the authorities, and use statistical techniques to examine the determinants of voting trends. The emphasis is on explaining change over time in the vote shares of different parties or groups of parties, not on identifiying social, economic, or opinion correlates of individuals party choice at a given point in time a subject that has been well-studied in previous work by various scholars. My goal is to provide a relatively comprehensive introduction to the changing electoral landscape in the two decades since the birth of the independent Russian state. The paper offers a more detailed and technical examination of the evidence that is summarized in Chapter 10 of my book manuscript titled The Return: Russia s Journey from Gorbachev to Medvedev. Treisman Daniel - University of California, Los Angeles Treisman D.,
3 The patterns Between 1989 and 2008, Russians had the chance to vote in seven elections to the national parliament, five presidential elections, four referenda, and several rounds of voting for regional legislatures and governors. 1 All the national elections pitted multiple candidates against each other. From 1993, many parties competed. In elections to the lower house of parliament, the Duma, between 1993 and 2003, each voter cast two ballots. 2 One was for a candidate to represent the local district; such candidates made up half of the Duma s members. The second was for a national party; each party that won at least five percent of the votes received seats proportional to its vote share. This party-list voting determined the second half of the Duma s members. From 2007, the single-member districts were abolished and voters only voted on the party-list ballot. At the same time, the threshold for representation was raised to seven percent of the votes. In presidential elections, if no candidate received 50 percent of the votes, a second round was held several weeks later between the two top vote-winners from the first round. Since 1993, parties and electoral blocs have appeared, disappeared, merged, split, and renamed themselves many times. Despite this, one can sort the parties into rough families based on what policies they support, and examine how different groups of parties have fared at the polls. The policy positions of the main parties have differed on two main dimensions, and sometimes these collapse to just one. 3 First, parties have differed in their attitudes towards market-oriented economic reform. Second and this dimension sometimes lines up with the first parties have adopted different positions on the tradeoff between individual rights and the authority of the state. At the anti-reform end of the spectrum were a number of communist blocs, led from 1993 by the Communist Party of the Russian Federation (CPRF). In close accord with the CPRF was the smaller Agrarian Party, which represented the old collective farm directors. Further to the left were various small revolutionary Marxist groups. Somewhat less opposed to economic reform, but more hostile than the Communists towards individual rights, was the perversely misnamed Liberal Democratic Party of Vladimir Zhirinovsky. It favored an authoritarian, imperialistic state that would provide many of the social benefits promised under Communism. Together, these two groups constituted the extreme opposition to Yeltsin and his pro-reform governments. At the other end of the spectrum, a number of parties supported both economic reforms and the protection of individual rights. The most economically liberal of these was a bloc led by Yegor Gaidar, Anatoly Chubais, and later Boris Nemtsov, named successively Russia s Choice, Russia s Democratic Choice, and the Union of Right Forces. A second party that favored 1 Elections for governors were eliminated at the end of In fact, in 1993, there were four ballots: two for the Duma; one for the Council of Federation, which was no longer elected after 1993; and one on the referendum on approving the draft constitution. 3 This is discovered, for instance, by analyzing how the members of the different parties have voted in the parliaments since The patterns of voting can be well summarized in just two dimensions. See F. T. Aleskerov, N. Yu. Blagoveshchensky, G. A. Satarov, A. V. Sokolova, V. I. Yakuba, Vliyanie i strukturnaya ustoichivost v Rossiiskom parlamente ( i gg.), Moscow: Fizmatlit, 2007, especially at p.113, where the authors graph the early positions of the main parties. These authors interpret the two dimensions as representing loyalty vs. opposition to the regime and ideology vs. pragmatism. However, attitudes towards economic reform and on individual rights vs. state authority seems to me to fit better. 3
4 economic reforms and individual rights was named Yabloko. Led by an ambitious, pro-market economist, Grigory Yavlinsky, its positions were similar to those of the Gaidar liberals, except that it criticized Yeltsin s governments rather than supporting them and was more inclined to favor socially oriented policies even at the cost of high inflation. Between these two extremes lay a fluid band of center parties, moderate nationalist groups, special interest blocs, and organizations whose main purpose was to support officials currently in office. The latter, known as parties of power, included the Our Home is Russia (OHIR) bloc set up by Prime Minister Viktor Chernomyrdin in 1995 and the Unity party (later renamed United Russia) created for Putin in Figures 1-3 show how these families of parties have performed in successive national elections. In each graph, the dashed line indicates the share of the valid vote won by parties from the relevant group in the party-list part of the Duma elections; the solid line records the percentage won by candidates from the relevant group of parties in presidential elections. 4 It does not take long to see the pattern. Support for the liberal reformers fell sharply during the 1990s. (Since President Yeltsin appealed to both pro-reform and centrist voters, one can see this most accurately focusing on the parliamentary votes.) In Duma elections, the vote for liberal reform parties fell from 34 percent of the valid vote in 1993 to less than four percent in That represented a drop from 18 million to fewer than three million pro-reform voters. Support for the extreme opposition Communists and the LDP peaked in the 1995 Duma election at 44 percent (30 million voters), and then fell gradually, reaching 22 percent (15 million voters) in (The extra dip in 2004 most likely reflects the fact that both Zhirinovsky and the Communist leader, Gennady Zyuganov, chose not to run for president that year and instead nominated little-known, uncharismatic colleagues.) The great beneficiaries of the shrinking pro-reform and extreme opposition votes were the party of power and the Kremlin-supported presidential candidates, whose support fell at first, but then rallied from 1999, reaching about 70 percent of the vote more than 50 million voters in In 1996, when there were two rounds, I show the result for the first round. 5 There were changes in the composition of the extreme opposition vote: in 1993, Zhirinovsky s LDP surged ahead of the Communists. This reversed in the 1995 election. 4
5 80 Figure 1. Voting for liberal reformers in Russian elections, Percent of the valid vote Liberal reformers, presidential elections Liberal reformers, Duma elections Source: Central Electoral Commission. "Liberal reformers" are: 1991: Yeltsin; 1993: Russia s Choice, Yabloko, PRES, RDDR; 1995: Yabloko, Russia s Democratic Choice, Forward Russia, Pamfilova-Gurov-Lysenko Bloc, Common Cause, PRES, Party of Economic Freedom; 1996: Yeltsin, Yavlinsky; 1999: Union of Right Forces, Yabloko; 2000: Yavlinksy, Titov; 2003: Yabloko, SPS, Razvitie Predprinimatelstva; 2004: Khakamada; 2007: Grazhdanskaya Sila, Union of Right Forces, Yabloko; 2008: Bogdanov election is first round. 80 Figure 2. Voting for the extreme opposition in Russian elections, Percent of the valid vote Extreme opposition, presidential elections Extreme opposition, Duma elections Source: Central Electoral Commission. "Extreme opposition" is "Communists" + "LDP". "Communists" are: 1991: Ryzhkov, Tuleev, Makashov, Bakatin; 1993: KPRF and Agrarians; 1995: KPRF, Agrarians, Power to the People, Communists-Working Russia; 1996: Zyuganov; 1999: KPRF, "Stalinist Bloc--For the USSR," "Communists, Working Russia," Socialist Party of Russia, Russian Socialist Party; 2000: Zyuganov, Tuleev; 2003: KPRF, Agrarians; 2004: Kharitonov; 2007: KPRF, Agrarians; 2008: Zyuganov. "LDP" is Liberal Democratic Party of Russia, Zhirinovsky, or Malyshkin (2004) election is first round. 5
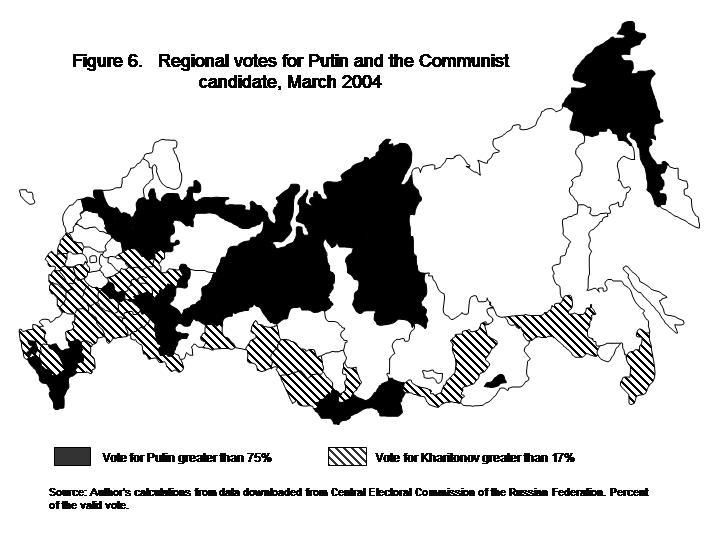
6 80 Figure 3. Voting for "Party of Power" or Kremlin favorite in Russian elections, Percent of the valid vote Kremlin favorite, presidential elections Parties of power, Duma elections Source: Central Electoral Commission. "Kremlin favorites" are: 1991: Yeltsin; 1996: Yeltsin; 2000: Putin; 2004: Putin; 2008: Medvedev. "Parties of power" are: 1993: Russia's Choice, PRES; 1995: Our Home is Russia (OHIR); 1999: Unity, OHIR; 2003: United Russia; 2007: United Russia, Just Russia election is first round. By "Kremlin favorite," I mean favorite of the incumbent Russian authorities (and not the Soviet authorities in 1991). Consider also the geography of support for candidates from different ideological groupings. Figures 4-6 show the patterns of regional voting for the incumbent and for the Communist opposition in the 1991, 1996 (first round) and 2004 presidential elections. In 1991, there is no obvious pattern in either Yeltsin s or his Communist rivals votes. The strongholds of each are scattered across the map in apparently random clumps. By 1996, this has changed markedly: a North-South divide has emerged. Yeltsin s support is strongest in the North, and his Communist challenger pulls in relatively more votes in a belt of regions along the country s extended underbelly, from Smolensk in the West to Amur in the Far East. A similar North-South divide could be seen in the April 1993 referendum on confidence in Yeltsin, and in the votes for reformers and Communists in the 1993 and 1995 parliamentary elections. Russia s regions differ in latitude by almost 27 degrees, from Dagestan, which is on a level with Southern France, to the Taimir Autonomous Okrug, situated further north than Fairbanks, Alaska. In 1996, the vote for Yeltsin was about 0.84 percentage points higher for every degree further north the region was located. However, by 2004 the pattern had changed again. The Communist challenger still did relatively better in the so-called red belt of the South and South-West. But unlike Yeltsin s, Putin s regional support was not concentrated in the North. Although it is not obvious from just looking at Figure 6, there is a powerful underlying logic. Putin s strongest showings were all in the ethnically non-russian areas of the country. 6 The 18 regions with the highest votes for Putin in 2004 were all autonomous republics or autonomous districts, named after some non-russian nationality (I 6 See Christopher Marsh and James Warhola, Ethnicity, Ethno-territoriality, and the Political Geography of Putin s Electoral Support, Post-Soviet Geography and Economics, 2001, 42, 4, pp


7 will call such regions ethnic regions ). Seven of these reported votes for Putin of more than 90 percent. Among the non-ethnic regions, there remained a North-South gradient in pro-putin voting that was almost as strong as under Yeltsin. For every degree further north a non-ethnic region was located, the vote for Putin was.65 percentage points higher, compared to.84 points under Yeltsin. Among ethnic republics, by contrast, the vote for Putin increased as one went further south. Over time, voters in the ethnic regions appear to have become ever more enamored of the Kremlin s candidates. In 1991, the ethnic regions had actually voted strongly for the Communists; Yeltsin the serving chairman of the Russian parliament, and so Russia s chief executive polled seven percentage points lower there than elsewhere. But by the first round of the 1996 election, this had reversed: Yeltsin s vote was now almost eight percentage points higher in the ethnic regions. In 2000, 2004, and 2008, the Kremlin-favored candidate won 7, 12, and 7 percentage points more, respectively, in the ethnic regions. The pro-incumbent advantage was even stronger for Putin s United Russia party, which polled more than 14 percentage points higher on average in the ethnic regions in both 2003 and My calculations from Central Electoral Commission data; these figures refer to the difference in the average result between ethnic and non-ethnic regions. 7


8 8
9 Thus, we have several puzzles to explain. First, why did electoral support for the liberal reformers decline from the early 1990s? Second, why did support for the extreme opposition at first rise and then fall from the late 1990s? Third, why did Kremlin-favored parties and candidates do worse in the early 1990s, but then surge ahead after 1999? Fourth, why did a North-South divide emerge in the mid-1990s between support for reformist incumbents like Yeltsin and Communists like Zyuganov? Finally, why did Putin and the pro-kremlin parties do so well after 2000 in the ethnic regions? Manipulation and Fraud A first question is whether the trends observable in support for the various parties simply reflect the effects of increasing manipulation and fraud by state authorities. I will not review here the copious reports of electoral abuses in Russia, especially since These have been discussed in great detail in all the major newspapers. Scholars have also detailed the various anomalies to be found in the official statistics on voting. Such anomalies do not prove that abuses occurred; innocent explanations are conceivable. But, in association with the journalists accounts, they paint a disturbing picture. Most of these oddities have to do with the reported levels of voter turnout. First, a growing number of Russia s 89 regions and of the roughly 2,700 rayons (or districts) within them have been reporting extremely high turnout (see Table 1, rows 1 and 2). By 2008, 36 towns and rural districts mostly in the republics of Bashkortostan, Tatarstan, and Tyva had turnout higher than 99 percent. Second, the vote for the Kremlin s favored candidate or party has, since 2000, been much higher in these regions and rayons. 9
10 Table 1. Turnout and voting for different parties in Russia s regions and rayons Election I 1996 II Number of regions where turnout was greater than 85 percent 2. Number of rayons (counties) where turnout was greater than 85 percent Correlation among regions between turnout and vote for Kremlin candidate/party a KPRF b Fatherland-All Russia Correlation among rayons (counties) between turnout and vote for Kremlin candidate/party n.a..71 KPRF n.a Fatherland-All Russia.43 Sources: data downloads from Central Electoral Commission of the Russian Federation, Michael McFaul and Nikolay Petrov, Politichesky almanakh Rossii 1995, Moscow: Moscow Carnegie Center, 1995; Robert Orttung and Scott Parish, Duma Votes Reflect North-South Divide, Transition, 23 February, 1996, pp a in 1991, Yeltsin; b in 1991, Ryzhkov, Bakatin, Tuleev, and Makashov. Positive correlations greater than 0.2 in bold. 10
11 Since 2000, higher turnout has correlated positively and in later years, very strongly with higher votes for the Kremlin s favorites (Table 1, rows 3 and 4). Not only has very high turnout become more frequent and correlated with pro-kremlin voting, the distribution of turnout across regions and districts has become quite peculiar from a statistical point of view. 8 In most elections where districts are relatively similar, the distribution of turnout across the districts approximates the Normal Distribution, with most districts bunching around the average level of turnout and far fewer having either relatively high or relatively low turnout. An almost perfect example of this is the distribution of turnout in different districts of Moscow in the 1995 parliamentary election (Figure 7A). But compare this to Figure 7B, which graphs the distribution of turnout for urban districts in the ethnic republics in The bell has been transformed into a camel s back with two ungainly humps. That year, there were two main groups of urban districts in the ethnic republics one group where turnout averaged percent, close to the national average, and another where turnout averaged 90 percent. There could be some innocent reason why some of these districts had much more enthusiastic voters than others. But it is not obvious what that reason might be. Another possibility is that in some but not all of the urban districts in the ethnic republics, voters were pressured to vote or ballots were stuffed on behalf of non-voters, resulting in extremely high turnout. Figure 7A. Turnout in Moscow's 121 districts, Number of districts with this turnout Turnout, percent of electorate Source: Calculated from data of the Central Electoral Commission of the Russian Federation. Smoothed line. 8 For detailed analyses of this, see the work of Mikhail Myagkov, Peter Ordeshook and their collaborators, in particular: Mikhail Myagkov, Peter Ordeshook and Dmitrii Shakin, Fraud or Fairytales? Russian and Ukrainian Electoral Experience, Post-Soviet Affairs, 21, 2, April-June 2005, pp , and Andrei Beryozkin, Mikhail Myagkov and Peter Ordeshook Location and Political Influence: A Further Elaboration of Their Effects on Voting in Recent Russian Elections. Eurasian Geography and Economics, 44, 3, March 2003, pp
12 Figure 7B. Turnout in urban districts of ethnic republics, Number of districts with this turnout Turnout, percent of the electorate Source: Calculated from data of the Central Electoral Commission of the Russian Federation. "Urban districts" are those where 100 percent of the population is urban. Smoothed line Figure 7C. Turnout in all 2,749 districts, 2008 election Number of districts with this turnout Turnout, percent of electorate Source: Calculated from data of the Central Electoral Commission of the Russian Federation. If we look at turnout across all rayons for the 2008 election, in place of a bell-shaped curve, we see a mountain with numerous jagged indentations, and a right tail that is much higher than the left tail (Figure 7C). As various statistically-minded observers have noted, such jagged indentations could plausibly be caused by rounding up the level of turnout to nice round numbers. If one plots the 12
13 distribution across all 94,000 polling stations (not shown here), it turns out that there are abnormal spikes in the numbers of precincts where turnout was an exact multiple of five. 9 In short, voter turnout has been abnormally high in a growing number of regions and rayons. Since 2000, such high turnout has been associated with higher votes for the parties and candidates favored by the central authorities. It has also tended to occur in regions where there were numerous allegations of electoral fraud in particular, the ethnic regions. Although innocent explanations are possible, the most plausible one is that officials have pressured local voters to turn out in high numbers and vote for central incumbents, or stuffed the ballot boxes, or rewritten the electoral protocols. Under this interpretation, extremely high turnout becomes an indicator that irregularities have occurred. If one accepts this interpretation, one can make inferences about which parties benefited from fraud or pressure in particular elections. The beneficiaries would be those parties whose vote shares were higher where turnout was higher. After 1999, that was the Kremlin s allies. Between 2000 and 2008, a high turnout correlated with a high vote for Putin, Medvedev, or United Russia (see Table 1, rows 3 and 4). In 2007, the correlation reached 0.90; for each additional ten percentage points of turnout in a region, the United Russia vote was on average nine percentage points higher. The 1990s were quite different. In 1993, 1995, and the first round of the 1996 presidential election, higher turnout correlated with a higher vote share for the Communists, and a lower vote for Yeltsin or the pro-kremlin parties. (This relationship became much weaker in the second round of 1996, as votes in some high turnout regions like Tatarstan shifted from Zyuganov to Yeltsin.) An obvious hypothesis is that regional and local officials were using the familiar administrative tricks on behalf of the Communists. This was exactly what Yeltsin s campaign workers believed at the time. Sergey Lissovsky, who was organizing tours of rock musicians for Yeltsin, said that many of the regional leaders, expecting Zyuganov to win, were deliberately sabotaging Yeltsin s campaign. In the provinces, they arrested our vehicles containing equipment and printed materials and cut off electricity to the squares. In Lissovsky s estimate: Half the resources were initially against Yeltsin. Of the remaining half, one third were neutral, not supporting either side. 10 Then in 1999, Moscow s mayor Yury Luzhkov, together with the presidents of Tatarstan and Bashkortostan, forged a powerful coalition of regional governors to contest the Duma elections. Their Fatherland-All Russia bloc was thought to be the main rival to the Communists and Putin s Unity. And it was Fatherland-All Russia that received higher votes that election in the regions and rayons where turnout was higher (Table 1). The regional bosses were apparently using their administrative resources on Fatherland s behalf. That did not save it from trailing Unity in the national totals, and it surrendered later, merging with Unity to form United Russia in Nabi Abdullaev, Medvedev won by curious numbers, The Moscow Times, April 14, 2008, p.1. Another type of statistical oddity occurred in some ethnic regions in 1996, where in some districts thousands of voters apparently voted for Zyuganov in the first round of the presidential election but switched to voting for Yeltsin against Zyuganov in the second. See, for instance, Valentin Mikhailov, Regional elections and democratisation in Russia, in Cameron Ross, ed., Russian Politics under Putin, New York: Manchester University Press, 2004, pp Ekaterina Deeva, Russkaya ruletka 96. Kak delali prezidenta, Moskovskiy Komsomolets, 6 July, 2001, interviews with Korzhakov, Sergey Lissovsky, and Sergey Zverev. Beryozkin, Myagkov and Ordeshook ( Location and Political Influence ) also conclude that the voting data make the most sense if one assumes that fraud in 1996 redounded to the Communists benefit. 13
14 All the indications are that manipulation and fraud increased over time, becoming quite widespread under Putin. Can this explain the pattern of results? Was it electoral foul play that caused the decline in the vote shares of the reformers and the extreme opposition, while boosting the share of Kremlin-connected parties and candidates? Based on the various facts presented so far, one would expect the answer to be yes. Here things get more puzzling. If the official results of elections reflect major falsification and pressures on voters, one should expect these results to diverge noticeably from those of public opinion polls. And yet a variety of polling organizations, some with strong reputations for independence, have been able to predict the election results accurately on the basis of their polls. Table 2 shows the forecasts of a few of the main pollsters on the eve of each election, along with the actual election results. Table 2. Forecasts of pollsters compared to election results , I Percent of vote for Kremlin favorite Russia s Choice OHIR Yeltsin Unity Putin United Russia Putin United Russia Medvedev Forecasts of: FOM VCIOM Levada Center Average Actual percent of total votes Turnout Forecasts of: FOM VCIOM Levada Center Average Actual percent of eligible voters Sources: 1993: VCIOM: Yury Levada, Nashi dyesat let: itogi i problyemy, p : FOM: VCIOM: Yury Levada, Nashi dyesat let: itogi i problyemy, p : FOM: VCIOM: Yury Levada, Nashi dyesat let: itogi i problyemy, p : FOM: 14
15 VCIOM: : FOM: VCIOM: (21 March 2009, Polit.ru). 2003: Levada: party vote is percent of those intending to vote, from Nov survey, adjusted to exclude those planning to vote but who say don t know for whom, FOM: VCIOM: : Levada: FOM: VCIOM: : Levada: FOM: VCIOM: : All: FOM on turnout: Electoral results: Central Electoral Commission of the Russian Federation. For the most part, the forecasts of the performance of Kremlin-connected contestants have been on target. Unity and UR do exceed the average forecast by up to five points in 1999, 2003, and But the forecasts are somewhat too high for Putin and Medvedev in the presidential contests. 11 Overall, had votes in elections for the Kremlin-favored parties and candidates exactly matched their levels of support in opinion polls, it would have made no difference at all to the outcomes of presidential elections and very little to the distribution of power in the Duma. Indeed, the forecasts have proven so accurate that some have wondered if this might indicate collusion between the pollsters and the Kremlin. While some organizations are closely connected to the presidential administration, the Levada Center is not, and, as noted in previous chapters, it was subject to a hostile takeover by the state apparently provoked by its determination to remain independent. There is no reason to doubt that polls it publishes faithfully represent the Center s best estimate of public opinion. To construct the forecasts, the pollsters used surveys for preceding weeks that asked people whether they planned to vote, and if so for whom. Voting preferences were then weighted by the respondent s likelihood of turning out. Moreover, the election results fit well into the longer term patterns of support for different parties elicited in repeated polls over the years. Figure 8 shows the percentage of respondents who, in VCIOM/Levada Center polls, said that if a Duma election were held the next Sunday they would vote for, respectively, the Putin-connected Unity or United Russia parties; the Communist Party; and Russia s Choice or its successor, the Union of Right Forces. With the letters CP, U, UR, and RC, I indicate the share of the valid vote received by the Communist Party, Unity, United Russia, and Russia s Choice respectively in the actual elections held between 1993 and As can be 11 Where the pollsters do less well is in predicting turnout after They do a very good job in the 1990s, but the turnout predictions are quite a bit too high in 2003 and too low in However, it is not the case that when turnout was unexpectedly high, the Kremlin allies did better than expected. 15
16 seen, the electoral results for each party are close to the lines showing the trajectory of support reported by the survey respondents. 12 The authorities heavy-handed interventions hardly seem to have changed the results at all. According to Lev Gudkov, director of the Levada Center, turnout would have been more than 10 percentage points lower if the 2007 election had been run in a completely honest way. But the shares won by the various parties would have been about the same. 13 Another researcher tried to estimate how the results would change if one left out all regions with suspicious results. She concluded that United Russia would have received about 61 percent (instead of 64 percent) and the Communists would have got about one percentage point more. 14 Even the opposition seemed to accept that the widespread abuses had not made much of a difference. After the 2003 vote, Zyuganov accused the Kremlin of rigging the election. Nevertheless, his party s parallel tally of the votes had it winning just.03 percentage points more than it did in the official results I have interpolated values where data were missing. Where possible, I used fitted values from a regression of voting preferences for a given party on answers to another VCIOM/Levada question that asked with which party or group of parties respondents sympathized. (For instance, I regressed the percent saying they would vote for the Communists on the percent saying they sympathized with the Communists and used fitted values to fill gaps in the data in the first series.) The series on sympathies of voters started later than the series on vote preferences but had fewer gaps. The correlations between sympathy for and vote preference for a given party were high. Where this was not possible, I simply interpolated linearly from the surrounding values in the series. Interpolations represent 41 percent of the data for the Communists and Russia s Choice and 23 percent for Unity/United Russia. 13 Itogi izbiratelnoy kampanii v Gosudarstvennuyu dumu pyatogo sozyva, Seminar at the Moscow Carnegie Center, 13 December 2007, 14 Ibid. 15 Communists say Duma vote was rigged, Gazeta.ru, 10 December,
17 80 Figure 8. Support for parties in opinion polls and official election results UR Percent planning to vote for Unity/United Russia UR Percent planning to vote for Communist Party RC CP CP CP U RC CP CP Percent planning to vote for Russia's Choice/Union of Right Forces RC Source: VCIOM/Levada Center polls, vote plans measure percent indicating the given party when asked how they would vote if a Duma election were held the next Sunday, excluding those who would not vote or who were undecided; some values interpolated. U: percent for Unity; UR: percent for United Russia; CP: percent for Communist Party; RC: percent for Russia's Choice or Union of Right Forces--in Duma elections. RC RC 17
18 Manipulations or fraud are often said to have made a difference on three occasions. First, on the basis of certain unusual statistical features of the published results, a group of experts claimed that the 1993 referendum on the constitution had not received the required turnout of 50 percent of the electorate. The evidence they presented was far from unequivocal. 16 Second, although noone contested that Putin was the winner in 2000, some suggested that only irregularities allowed him to win in the first round, receiving more than 50 percent of the vote. Note, however, that the pollsters FOM and VCIOM had both predicted a vote share for Putin about as large as or slightly larger than the official result, in the range percent. Finally, on the basis of their parallel vote count in 2003, the Communists claimed that the liberal parties Union of Right Forces and Yabloko both passed the five-percent threshold and should have been seated in the Duma. However, this claim was based on examining results in just 15 percent of the districts. Given that districts where the liberals were popular were likely to be ones where officials would be most open about publishing their protocols, it is very possible that the true results for the liberal parties were below those of the Communist count. In sum, the evidence suggests that relatively minor electoral fraud occurred in the 1990s, and considerably more did after In the early 1990s, irregularities appear to have advantaged the Communists and, in 1999, an anti-kremlin coalition of governors, rather than the Yeltsin administration and its allies. Since 2000, irregularities have clearly helped Putin and his associates. And yet, the manipulation and fraud do not seem to have changed the outcomes of elections much at all. Judging from what representative samples of Russians told pollsters in private interviews, the votes for the Communists and liberal reformers fell, and those for the parties connected to Putin rose over time, because most Russians came to genuinely support the pro-kremlin parties and oppose the Communists and reformers. Explaining nationwide trends Changing social composition of the electorate If electoral irregularities do not explain the voting trends, what does? Although voters switched back and forth quite fluidly early on, different parties did have distinct social bases of support. The Communist Party was particularly popular in rural areas, and among the old, less skilled workers, and those with lower incomes. 17 Zhirinovsky and the LDP appealed most to the young, and polled better among male than among female voters. The liberal reform parties showed strength in urban areas, and among the young and the highly educated. 18 Could it be that social and economic change had eroded some parties bases, while enlarging those of others? Focusing first on age, some wondered if the Communist vote was shrinking because, as one journalist put it, the party s elderly supporters were steadily dying off. 19 Conversely, if the relative number of young adults was falling, that might explain the drop in support for the LDP and the 16 See Mikhail Filippov and Peter C. Ordeshook, Who Stole What in Russia s December 1993 Elections, Demokratizatsiya, 5, 1, Winter Colton, Transitional Citizens, p.81; White, Rose, and McAllister, How Russia Votes. 18 Colton, Transitional Citizens, p Julius Strauss, Communist Party faces obscurity in new Russia, The Daily Telegraph, December 5,
19 liberal reformers. In fact, despite the decrease in Russia s total population, the ranks of both the elderly and young adults were swelling. The number of Russians aged over 60 rose from 22.5 million in 1989 to 24.5 million in 2008, while the number of Russians in their twenties grew from 22.3 million to 24.2 million. 20 Perhaps what mattered was not age per se but having grown up under Stalin. It might be the passing of a generation of true-believers, socialized into Soviet beliefs during the country s totalitarian age, that was now shrinking Communist support. If this were the case, one would expect the oldest cohort to become less pro-communist over time, as the true-believers died and were replaced by others who had come of age later. In fact, the opposite was the case. The proportion of those aged 60 and older who voted Communist was higher in 2007 (24 percent) than in 1993 (15 percent). 21 It was Communist voting in all the other age groups that fell drastically. 22 Nor were there fewer Russians with higher education to vote for the reformers. On the contrary, the proportion of Russians aged over 14 with some higher education rose from 11 percent in 1989 to 16 percent in The proportions living in urban and rural areas changed hardly at all. Nor was it the case that the old or young were dropping out, choosing not to vote in elections. In fact, the self-reported turnout rates for both the youngest and the oldest age groups increased by more than the average between 1993 and It is true that turnout among the highly educated did not increase as much as for other groups but this was because it started so high, just below 75 percent. In short, it does not appear that changes in the population s social characteristics can explain the trends in voting behavior. Economic conditions, presidential coattails, wars, campaigns What else might matter? In previous work, I found a close association between economic conditions, as perceived by the public, and the popularity of the incumbent president. We might expect a similar link between economic conditions and support for the main parties. Support for the party associated with the incumbent government should go up when the economy improves, while support for the opposition should increase when the economy deteriorates. Beyond such economic factors, one might expect voters attitudes towards the incumbent president to influence their view of the party running on his coattails. High approval of Putin should translate into strong support for United Russia, while high approval of Yeltsin should boost the vote for Russia s Choice. In addition, voters might favor or oppose particular parties based on their positions on the two wars in 20 Goskomstat RF, Demografichesky yezhegodnik Rossii, various years. 21 These figures are the proportions of those that chose the Communists among those aged 60 and over who said they had voted and revealed how they had voted, calculated from VCIOM post-election polls at and 22 See also D. Roderick Kiewiet and Mikhail Myagkov, Are the Communists dying out in Russia, Pasadena, CA: Caltech, Mezhgosudarstvenny statistichesky komitet Sodruzhestva Nezavisimykh gosudarstv, Statistika SNG. Statistichesky biulleten, Jun 15, Calculated from VCIOM post-election polls. 19
20 Chechnya; in this case, as public opinion on the wars changed, so might the public s party preferences. Finally, one might expect the parties performance during electoral campaigns to win or lose them voters. To see which, if any, of these factors were important, I analyzed the responses to the VCIOM/Levada Center polls on voting preferences shown in Figure 8. Tests suggested that each of these series was fractionally integrated. 25 I therefore fractionally differenced the series. 26 I then ran error correction models, including variables to capture economic perceptions of the public (derived from VCIOM/Levada Center polls), levels of support for the incumbent president, whether or not a war in Chechnya was ongoing, and whether or not the month fell within a presidential campaign or its aftermath (I used a variable that took the value 1 for the six months preceding the presidential election and -1 for the six months following it). The economic perceptions and presidential support variables were themselves fractionally integrated in most cases, so I fractionally differenced these too, using the same technique as for the voting preference series. Where necessary to reduce autocorrelation to acceptable levels, I included one or two lags of the fractionally differenced dependent variable. I tried including three economic perceptions variables. To measure retrospective evaluations of the national economy, I used the VCIOM/Levada Center survey question: How would you assess Russia s present economic situation? Respondents could answer very good, good, in between, bad, very bad, or don t know. I added the percentages saying very good or good and substracted the shares saying very bad or bad. 27 To measure retrospective evaluations of personal finances, I used the question: How would you assess the current material situation of your family, which had the same choice of answers. Again, I subtracted the percentages saying very bad or bad from those saying very good or good. For prospective evaluations of the national economy, I used the question: What do you think awaits Russia in the economy in the coming several months? Respondents chose between a significant improvement of the situation, some improvement of the situation, some deterioration of the situation, a significant deterioration of the situation, and don t know. I subtracted the percentage anticipating deterioration from that anticipating improvement. No question was available for a comparable time period on prospective views of personal finances. I also tried including dummy variables for particular events most notably, for the month of December 2000, in which Putin restored the Soviet era music to the Russian national anthem, and December 2003, the last month of that year s Duma election campaign, when, as is clear from Figure 8, a major change occurred in support for both the Communists and United Russia. If this month was different in some important way, omitting the cause for this difference might bias the results for other variables. 25 On fractional integration and appropriate methods to analyze fractionally integrated series, see, for instance, Janet M. Box-Steffensmeier and Andrew R. Tomlinson, Fractional Integration Methods in Political Science, Electoral Studies, 19, 1, March 2000, pp I used James Davidson s Time Series Modeling software to calculate d for each series, and averaged the results for bandwidths of 10, 20, and This was generally available every second month, with some longer and some shorter gaps. To avoid irregular gaps in the data, I interpolated missing values linearly. 20
21 To review the results: first, I found no evidence that either of the Chechnya wars had a direct effect on Russians party preferences. For the first Chechen war, I simply included a variable that took the value 1 in the first month of the first Chechen war, -1 in August, 1996, the month in which the Khasavyurt Accord was signed, and 0 in all other months. Dating the end of the second Chechen war was more complicated. I used a variable measuring the proportion of respondents in VCIOM/Levada Center polls that when asked what was currently occurring in Chechnya said that war was continuing. This series appeared to be fractionally integrated, so I included both the lag of the level and the fractionally differenced value. As can be seen, these variables were not statistically significant for any of the three parties. Second, there was evidence that Russians perceptions of the state of the economy influenced party preferences. When Russians considered their personal finances to be in bad shape and when they thought national economic conditions were deteriorating, more Table 3. Explaining party preferences of voters, Dependent variable: F Communist Party F Unity / United Russia F Russia s Choice/ Union of Right Forces (1) (2) (3) (4) (5) (6) Lag Communist Party -.11*** (.04) -.12*** (.04) Lag Unity/United Russia -.13 (.08) -.26*** (.10) Lag Russia s Choice / URF.03 (.05) Lag second Chechen war (1.25) Lag current economy -.02 (.03) Lag current economy before May 1995 Lag family finances -.06 (.04) Lag Russia s ec. future.05 (.03) -.08** (.03).03 (.02) -.58 (8.94).11 (.15) -.12 (.12).06 (.06).16* (.09).08 (.08) (1.55) -.03 (.04) -.01 (.04) -.01 (.02) Lag Yeltsin s approval rating.57 (.39) Lag Yeltsin s approval rating before May 1995 Lag Putin s approval rating 1.51 (2.04) 1.61 (2.08) Lag Presidential campaign (9.94) Lag presidential campaign *.96 Lag Putin s approval rating (1.48).61* (.32) F second Chechen war *** (.08) -.06*** (.02).25*** (.06).02 (.02).69** (.30) 6.92*** (1.50).54** (.21) 21
22 F current economy -.14** (.07) (9.87) (16.41) (4.37) -.15** (.07).26 (.18).21 (.15).02 (.05) F family finances -.04 (.05) F Russia s ec. future.12** (.05).10* (.05) -.09 (.21) -.06 (.12) -.04 (.08) -.07 (.05) F Yeltsin s approval rating 5.13*** (1.89) F Yeltsin s approval rating before May 1995 F Putin s approval rating 1.42 (1.20) Lag presidential campaign * F Putin s approval rating (2.20) 5.31** (2.50).61 (.51) -.05 (.03) 2.05* (1.07) 13.73*** (3.85).42 (.34) First Chechen war.41 (.48) (.97) Soviet anthem 4.90*** (.64) 4.95*** (.57) 1.71 (1.36) 3.32*** (1.09) 2.70*** (.35) 2.58*** (.26) 22
23 Table 3 continued December *** (.60) Presidential campaign -.83** (.36) Lag dependent variable -.37*** (.09) Second lag dependent variable -.26*** (.09) Constant.37 (.88) F Communist Party F Unity / United Russia F Russia s Choice/ Union of Right Forces -9.69*** (.61) -.81** (.34) -.35*** (.09) -.24*** (.09).15 (.76) 19.58*** (1.40) 3.46*** (1.09) -.25** (.10) (16.10) 21.39*** (1.27) 6.87 (15.80).68* (.40) -.04 (.21) -4.26** (2.11).49** (.24) -4.62*** (1.51) R Ljung-Box (residuals), Q(12) (p =.58) 9.82 (p =.63) (p =.47) 5.12 (p =.95) (p =.23) (p =.50) N F fractionally differenced series. Second models for each dependent variable include interaction terms to distinguish particular time periods, and exclude some variables that have very low statistical significance. people said they would vote for the Communists (model 2). (A little surprisingly, when expectations for the national economy deteriorated, fewer planned to vote for the Communists.) Economic conditions had different implications for Russia s Choice depending on whether or not it was the main party of government. While it was still the party of power, the popularity of Russia s Choice was higher when the economy was doing better. But after Russia s Choice surrendered this role to OHIR in May 1995, becoming if not an opposition party at least the advocate of an alternative approach to reform, its appeal was greatest when economic conditions were bad. 28 Later on, United Russia also did better when the economy was perceived to be strong, although the evidence on this is less clear (the coefficient on the lag of views of the current economy was positive and marginally significant in model 4). The fortunes of both United Russia and Russia s Choice were clearly tied to the popularity of the presidents with which they were associated. As one might expect, a rise in Putin s rating was associated with an increase in the proportion of Russians that planned to vote for Unity/United Russia. What is interesting, however, is that such convergence only occurred during the presidential 28 I include variables for the lag of evaluations of the current economy and for the same thing before May 1995, when OHIR was founded. Thus, the estimated effect of this before May 1995 is =.19, while the estimated effect after May 1995 is -.06 (see model 6). Along with the negative coefficient on the lagged percent planning to vote for RC/URF, these imply a positive long-run relationship between evaluations of the current economy and plans to vote for RC/URF before May 1995 and a negative long-run relationship after May
24 election campaigns. In fact, a rise in Putin s rating at other times was associated with, if anything, a fall in United Russia s support (though this is not statistically significant). But in the heat of the electoral season, the party s ratings would leap upward closer to Putin s; then after the election was over, some of the party s support would quickly dissipate. 29 To anyone who observed these campaigns, this makes a lot of sense. Unity s and United Russia s advertising sought to get across just one, quintessential point about the party that it was the party of Putin. Other than that, it had almost no identity. In 2007, the year in which Putin agreed to head United Russia s party list, some of its electoral posters did not even mention the party s name. One, for instance, just showed a photograph of Putin, alongside the caption: 2 December Elections Of Putin. 30 Throughout Yeltsin s two terms, the popularity of Russia s Choice was linked to that of the president. But the link was much stronger before OHIR took over as the main pro-government party. 31 During Putin s terms in office, Russia s Choice s successor, the Union of Right Forces, did better when Putin s approval was high. Besides economic perceptions and the president s popularity, two other phenomena shaped the pattern of party support. First, in December 2000, Putin restored the Soviet-era music to the Russian national anthem. This act appears to have polarized the political community. The ratings of Unity, the Communists, and Russia s Choice all jumped by several percentage points. The debate over this issue had been divisive, with both the Communists and President Putin strongly supporting restoring the traditional music, and former President Yeltsin breaking his post-retirement silence to criticize the decision. Liberals opposed it, with the Yabloko faction complaining that the restoration deepened the schism in society. 32 It appears that the debate enabled all the factions to rally previously netural citizens behind them. Second,, in the final month of the 2003 Duma campaign, a major reshuffling of support occurred. The proportion saying they would vote for United Russia rose by around 20 percentage points, while the proportion endorsing the Communists fell by around 10 points. 33 I cannot say for sure what caused this. There are several possibilities. The Kremlin s political operatives had unleashed a ferocious onslaught against the party, accusing Zyuganov and his allies of selling out to the oligarchs, one of whom Putin had just jailed. It turned out that the Communists had at least four dollar millionaires on their party list, two of them former executives from Khodorkovsky s 29 See model 4, coefficient on lag presidential campaign * F Putin s approval rating ; recall that the presidential campaign variable took the value 1 in the six months before a presidential election and -1 in the six months after the election. 30 I am grateful to Konstantin Sonin for the photograh of this poster. 31 There is evidence of both long-run equilibrium relationships and short-run adjustment effects; see the coefficients on the lag of Yeltsin approval and of this for just the period before May 1995, and the coefficients for the fractional difference of Yeltsin approval and for this before May 1995, in model BBC, Duma approves Soviet anthem, 8 December 2000, 33 These are estimates from regressions controlling for economic performance and/or presidential approval. 24
Elections in Russia,
 Elections in Russia, 1991-2008 Daniel Treisman In this paper, I review the main trends in voting in national elections in Russia since 1991, discuss the evidence of manipulation or falsification by the
Federation Council: Political Parties & Elections in Post-Soviet Russia (Part 2) Terms: Medvedev, United Russia
 Terms: Medvedev, United Russia") Political Parties & Elections in Post-Soviet Russia (Part 2) Terms: Medvedev, United Russia Key questions: What sorts of changes did Putin make to the electoral system? Why did Putin make these changes?
Political Parties & Elections in Post-Soviet Russia (Part 2) Terms: Medvedev, United Russia Key questions: What sorts of changes did Putin make to the electoral system? Why did Putin make these changes?
Russia's Political Parties. By: Ahnaf, Jamie, Mobasher, David X. Montes
 Russia's Political Parties By: Ahnaf, Jamie, Mobasher, David X. Montes Brief History of the "Evolution" of Russian Political Parties -In 1991 the Commonwealth of Independent States was established and
Power as Patronage: Russian Parties and Russian Democracy. Regina Smyth February 2000 PONARS Policy Memo 106 Pennsylvania State University
 Power as Patronage: Russian Parties and Russian Democracy Regina February 2000 PONARS Policy Memo 106 Pennsylvania State University "These elections are not about issues, they are about power." During
Russian Political Parties. Bryan, George, Jason, Tahzib
 Russian Political Parties Bryan, George, Jason, Tahzib United Russia Founded in 2001 with the merging of the Fatherland All-Russia Party and the Unity Party of Russia. Currently holds 238 seats in the
Elections in the Former Glorious Soviet Union
 Elections in the Former Glorious Soviet Union An investigation into electoral impropriety and fraud (Or: How I Learned to Stop Worrying and Love Putin) Electoral History There have been six presidential
Comparative Politics: Domestic Responses to Global Challenges, Seventh Edition. by Charles Hauss. Chapter 9: Russia
 Comparative Politics: Domestic Responses to Global Challenges, Seventh Edition by Charles Hauss Chapter 9: Russia Learning Objectives After studying this chapter, students should be able to: describe
Iowa Voting Series, Paper 4: An Examination of Iowa Turnout Statistics Since 2000 by Party and Age Group
 Department of Political Science Publications 3-1-2014 Iowa Voting Series, Paper 4: An Examination of Iowa Turnout Statistics Since 2000 by Party and Age Group Timothy M. Hagle University of Iowa 2014 Timothy
(Gulag) Russia. By Когтерез Путина, Товарищ основе Бог, Мышечная зубная щетка
 Russia. By Когтерез Путина, Товарищ основе Бог, Мышечная зубная щетка") Political Political Parties Parties in in Putin s Putin s (Gulag) (Gulag) Russia Russia By Когтерез Путина, Товарищ основе Бог, Мышечная зубная щетка Beginnings of the Party System Mikhail Gorbachev took
Political Political Parties Parties in in Putin s Putin s (Gulag) (Gulag) Russia Russia By Когтерез Путина, Товарищ основе Бог, Мышечная зубная щетка Beginnings of the Party System Mikhail Gorbachev took
Russia. Part 2: Institutions
 Russia Part 2: Institutions Political Structure 1993 Democratic Constitution but a history of Authoritarianism Currently considered a hybrid regime: Soft authoritarianism Semi-authoritarian Federal system
Democratic Consolidation and Political Parties in Russia
 The 3 rd International Conference of the HK RussiaㆍEurasia Research Project 20 Years since the Disintegration of the Soviet Union: Looking Backward, Looking Forward Session II: The Evolution of the Dissolution
Non-fiction: Russia Un-united?
 Russia Un-united? Anti-Putin Protests Startle Government Fraud... crook... scoundrel... thief. Those are just some of the not-sonice names Russian protesters are calling Prime Minister Vladimir Putin and
STRATEGIC FORUM. Russia's Duma Elections: Ii _2. Why they should matter to the United States. Number 54, November 1995
 Ii _2 STRATEGIC FORUM INSTITUTE FOR NATIONAL STRATEGIC STUDIES C C3 Number 54, November 1995 Russia's Duma Elections: Why they should matter to the United States by Ellen Jones and James H. Brusstar Conclusions
Hungary. Basic facts The development of the quality of democracy in Hungary. The overall quality of democracy
 Hungary Basic facts 2007 Population 10 055 780 GDP p.c. (US$) 13 713 Human development rank 43 Age of democracy in years (Polity) 17 Type of democracy Electoral system Party system Parliamentary Mixed:
Multiparty Politics in Russia
 Boston University OpenBU Institute for the Study of Conflict, Ideology and Policy http://open.bu.edu Perspective 1994-04 Multiparty Politics in Russia Ponomarev, Lev A. Boston University Center for the
The Fate of Russian Democracy
 Boston University OpenBU Institute for the Study of Conflict, Ideology and Policy http://open.bu.edu Perspective 1996-01 The Fate of Russian Democracy Albats, Yevgenia Boston University Center for the
The Duma Districts Key to Putin s Power
 The Duma Districts Key to Putin s Power PONARS Policy Memo 290 Henry E. Hale Indiana University and Robert Orttung American University September 2003 When politicians hit the campaign trail and Russians
BASIC BACKGROUND: RUSSIAN POLITICS 101
 RUSSIAN ELECTION WATCH Graham T. Allison, Director Strengthening Democratic Institutions Project John F. Kennedy School of Government Harvard University No.1, July-August 1999 Editor, Writer: Henry E.
The Fair Sex in an Unfair System
 The Fair Sex in an Unfair System The Gendered Effects of Putin s Political Reforms PONARS Policy Memo No. 398 Valerie Sperling Clark University December 2005 In September 2004, in the aftermath of the
Executive Summary. 1 Page
 ANALYSIS FOR THE ORGANIZATION OF AMERICAN STATES (OAS) by Dr Irfan Nooruddin, Professor, Walsh School of Foreign Service, Georgetown University 17 December 2017 Executive Summary The dramatic vote swing
Iowa Voting Series, Paper 6: An Examination of Iowa Absentee Voting Since 2000
 Department of Political Science Publications 5-1-2014 Iowa Voting Series, Paper 6: An Examination of Iowa Absentee Voting Since 2000 Timothy M. Hagle University of Iowa 2014 Timothy M. Hagle Comments This
Minnesota Public Radio News and Humphrey Institute Poll. Coleman Lead Neutralized by Financial Crisis and Polarizing Presidential Politics
 Minnesota Public Radio News and Humphrey Institute Poll Coleman Lead Neutralized by Financial Crisis and Polarizing Presidential Politics Report prepared by the Center for the Study of Politics and Governance
Chapter 6 Online Appendix. general these issues do not cause significant problems for our analysis in this chapter. One
 Chapter 6 Online Appendix Potential shortcomings of SF-ratio analysis Using SF-ratios to understand strategic behavior is not without potential problems, but in general these issues do not cause significant
STUDY THE ELECTORAL SYSTEM OF THE RUSSIAN FEDERATION
 DIRECTORATE-GENERAL FOR EXTERNAL POLICIES OF THE UNION DIRECTORATE B POLICY DEPARTMENT STUDY THE ELECTORAL SYSTEM OF THE RUSSIAN FEDERATION Abstract This report examines the development of the electoral
Convergence in Post-Soviet Political Systems?
 Convergence in Post-Soviet Political Systems? A Comparative Analysis of Russian, Kazakh, and Ukrainian Parliamentary Elections PONARS Eurasia Policy Memo No. 36 Nikolay Petrov Carnegie Moscow Center August
FOR RELEASE: SUNDAY, OCTOBER 13, 1991, A.M.
 FOR RELEASE: SUNDAY, OCTOBER 13, 1991, A.M. Two In Three Want Candidates To Discuss Economic Issues "DON'T KNOW" LEADS KERREY IN EARLY DEMOCRATIC NOMINATION SWEEPS "Don't Know" leads in the early stages
Nigeria heads for closest election on record
 Dispatch No. 11 27 January 215 Nigeria heads for closest election on record Afrobarometer Dispatch No. 11 Nengak Daniel, Raphael Mbaegbu, and Peter Lewis Summary Nigerians will go to the polls on 14 February
Research Proposal. Determinants and Pay-offs of Electoral Fraud in Russia
 Research Proposal Research topic Determinants and Pay-offs of Electoral Fraud in Russia Objectives 1. To investigate demographic, socio-economic and political determinants of electoral fraud within regions
A New Wave of Russian Nationalism?
 A New Wave of Russian Nationalism? WHAT REALLY CHANGED IN PUBLIC OPINION AFTER CRIMEA PONARS Eurasia Policy Memo No. 362 May 2015 Mikhail A. Alexseev San Diego State University Henry E. Hale The George
Youth Voter Turnout has Declined, by Any Measure By Peter Levine and Mark Hugo Lopez 1 September 2002
 Youth Voter has Declined, by Any Measure By Peter Levine and Mark Hugo Lopez 1 September 2002 Measuring young people s voting raises difficult issues, and there is not a single clearly correct turnout
THE NATIONAL COUNCIL FOR EURASIAN AND EAST EUROPEAN RESEARCH TITLE VIII PROGRAM
 TITLE: URBAN-RURAL VOTING DIFFERENCES IN RUSSIAN ELECTIONS, 1995-1996: A RAYON LEVEL ANALYSIS AUTHORS: RALPH S. CLEM and PETER T. CRAUMER Florida International University THE NATIONAL COUNCIL FOR EURASIAN
1_1c. On the whole do you approve or disapprove of the performance of the Government of Russia? Approve Disapprove [Don t read] Hard to say/missing
![1_1c. On the whole do you approve or disapprove of the performance of the Government of Russia? Approve Disapprove [Don t read] Hard to say/missing](/thumbs/91/104797815.jpg "1_1c. On the whole do you approve or disapprove of the performance of the Government of Russia? Approve Disapprove [Don t read] Hard to say/missing") NEW RUSSIA BAROMETER XIX 1. Do you think that things in our country today are moving generally in the right direction or that our country is on the wrong track? Things are going in the right direction
NEW RUSSIA BAROMETER XIX 1. Do you think that things in our country today are moving generally in the right direction or that our country is on the wrong track? Things are going in the right direction
Minnesota State Politics: Battles Over Constitution and State House
 Minnesota Public Radio News and Humphrey Institute Poll Minnesota State Politics: Battles Over Constitution and State House Report prepared by the Center for the Study of Politics and Governance Humphrey
CIRCLE The Center for Information & Research on Civic Learning & Engagement
 FACT SHEET CIRCLE The Center for Information & Research on Civic Learning & Engagement The Youth Vote 2004 By Mark Hugo Lopez, Emily Kirby, and Jared Sagoff 1 July 2005 Estimates from all sources suggest
WISCONSIN SUPREME COURT ELECTIONS WITH PARTISANSHIP
 The Increasing Correlation of WISCONSIN SUPREME COURT ELECTIONS WITH PARTISANSHIP A Statistical Analysis BY CHARLES FRANKLIN Whatever the technically nonpartisan nature of the elections, has the structure
The Full Cycle of Political Evolution in Russia
 The Full Cycle of Political Evolution in Russia From Chaotic to Overmanaged Democracy PONARS Policy Memo No. 413 Nikolay Petrov Carnegie Moscow Center December 2006 In the seven years that President Vladimir
Georg Lutz, Nicolas Pekari, Marina Shkapina. CSES Module 5 pre-test report, Switzerland
 Georg Lutz, Nicolas Pekari, Marina Shkapina CSES Module 5 pre-test report, Switzerland Lausanne, 8.31.2016 1 Table of Contents 1 Introduction 3 1.1 Methodology 3 2 Distribution of key variables 7 2.1 Attitudes
Reading the local runes:
 Reading the local runes: What the 2011 council elections suggest for the next general election By Paul Hunter Reading the local runes: What the 2011 council elections suggest for the next general election
Non-Voted Ballots and Discrimination in Florida
 Non-Voted Ballots and Discrimination in Florida John R. Lott, Jr. School of Law Yale University 127 Wall Street New Haven, CT 06511 (203) 432-2366 john.lott@yale.edu revised July 15, 2001 * This paper
Supplementary Materials for Strategic Abstention in Proportional Representation Systems (Evidence from Multiple Countries)
") Supplementary Materials for Strategic Abstention in Proportional Representation Systems (Evidence from Multiple Countries) Guillem Riambau July 15, 2018 1 1 Construction of variables and descriptive statistics.
Supplementary Materials for Strategic Abstention in Proportional Representation Systems (Evidence from Multiple Countries) Guillem Riambau July 15, 2018 1 1 Construction of variables and descriptive statistics.
Campaign Finance Charges Raise Doubts Among 7% of Clinton Backers FINAL PEW CENTER SURVEY-CLINTON 52%, DOLE 38%, PEROT 9%
 FOR RELEASE: SUNDAY, NOVEMBER 3, 1996, 5:00 P.M. Campaign Finance Charges Raise Doubts Among 7% of Clinton Backers FINAL PEW CENTER SURVEY-CLINTON 52%, DOLE 38%, PEROT 9% FOR FURTHER INFORMATION CONTACT:
CIVIL SOCIETY DEVELOPMENT FOUNDATION. The Putin majority on the eve of the next electoral cycle
 CIVIL SOCIETY DEVELOPMENT FOUNDATION The Putin majority on the eve of the next electoral cycle 4 MAY 2017 The Putin majority on the eve of the next electoral cycle The Civil Society Development Fund (FCDS)
THE SOUTH AUSTRALIAN LEGISLATIVE COUNCIL: POSSIBLE CHANGES TO ITS ELECTORAL SYSTEM
 PARLIAMENTARY LIBRARY OF SOUTH AUSTRALIA THE SOUTH AUSTRALIAN LEGISLATIVE COUNCIL: POSSIBLE CHANGES TO ITS ELECTORAL SYSTEM BY JENNI NEWTON-FARRELLY INFORMATION PAPER 17 2000, Parliamentary Library of
Media and Political Persuasion: Evidence from Russia
 Media and Political Persuasion: Evidence from Russia Ruben Enikolopov, Maria Petrova, Ekaterina Zhuravskaya Web Appendix Table A1. Summary statistics. Intention to vote and reported vote, December 1999
Voting and Non-Voting in Christchurch City
 Voting and Non-Voting in Christchurch City Territorial local Authority and District Health Board Elections October 2001 Voting and Non-Voting in Christchurch City An analysis of a survey on voter attitudes
Who says elections in Ghana are free and fair?
 Who says elections in Ghana are free and fair? By Sharon Parku Afrobarometer Policy Paper No. 15 November 2014 Introduction Since 2000, elections in Ghana have been lauded by observers both internally
Patterns of Poll Movement *
 Patterns of Poll Movement * Public Perspective, forthcoming Christopher Wlezien is Reader in Comparative Government and Fellow of Nuffield College, University of Oxford Robert S. Erikson is a Professor
Political Knowledge Update PUBLIC FAMILIAR WITH KEY POLITICAL & IRAQ FACTS
 NEWS Release. 1615 L Street, N.W., Suite 700 Washington, D.C. 20036 Tel (202) 419-4350 Fax (202) 419-4399 FOR IMMEDIATE RELEASE: September 24, 2007 FOR FURTHER INFORMATION: Andrew Kohut, Director Scott
Shifting Political Landscape Impacts San Diego City Mayoral Election
 Shifting Political Landscape Impacts San Diego City Mayoral Election Executive Summary The November 2012 election brought a sea change to San Diego City Hall, as the first Democratic mayor in more than
North Carolina Races Tighten as Election Day Approaches
 North Carolina Races Tighten as Election Day Approaches Likely Voters in North Carolina October 23-27, 2016 Table of Contents KEY SURVEY INSIGHTS... 1 PRESIDENTIAL RACE... 1 PRESIDENTIAL ELECTION ISSUES...
Electoral Fraud in Russia: Vote Counts Analysis using. Second-digit Mean Tests
 Electoral Fraud in Russia: Vote Counts Analysis using Second-digit Mean Tests Walter R. Mebane, Jr. Kirill Kalinin April 20, 2010 Abstract Growing authoritarian tendencies in Russian politics pose the
The Case of the Disappearing Bias: A 2014 Update to the Gerrymandering or Geography Debate
 The Case of the Disappearing Bias: A 2014 Update to the Gerrymandering or Geography Debate Nicholas Goedert Lafayette College goedertn@lafayette.edu May, 2015 ABSTRACT: This note observes that the pro-republican
Supplementary Materials A: Figures for All 7 Surveys Figure S1-A: Distribution of Predicted Probabilities of Voting in Primary Elections
 Supplementary Materials (Online), Supplementary Materials A: Figures for All 7 Surveys Figure S-A: Distribution of Predicted Probabilities of Voting in Primary Elections (continued on next page) UT Republican
Election 2015: Liberals edge Conservatives as volatile electorate mulls final choice before last campaign weekend
 Page 1 of 22 Election 2015: Liberals edge Conservatives as volatile electorate mulls final choice before last campaign weekend Momentum and softness of NDP vote give Liberals more room to grow late in
The California Primary and Redistricting
 The California Primary and Redistricting This study analyzes what is the important impact of changes in the primary voting rules after a Congressional and Legislative Redistricting. Under a citizen s committee,
Who influences the formation of political attitudes and decisions in young people? Evidence from the referendum on Scottish independence
 Who influences the formation of political attitudes and decisions in young people? Evidence from the referendum on Scottish independence 04.03.2014 d part - Think Tank for political participation Dr Jan
Post-election round-up: New Zealand voters attitudes to the current voting system
 MEDIA RELEASE 14 November 2017 Post-election round-up: New Zealand voters attitudes to the current voting system The topic: Following on from the recent general election, there has been much discussion
Maintaining Control. Putin s Strategy for Holding Power Past 2008
 Maintaining Control Putin s Strategy for Holding Power Past 2008 PONARS Policy Memo No. 397 Regina Smyth Pennsylvania State University December 2005 There is little question that Vladimir Putin s Kremlin
CALTECH/MIT VOTING TECHNOLOGY PROJECT A
 CALTECH/MIT VOTING TECHNOLOGY PROJECT A multi-disciplinary, collaborative project of the California Institute of Technology Pasadena, California 91125 and the Massachusetts Institute of Technology Cambridge,
1. A Republican edge in terms of self-described interest in the election. 2. Lower levels of self-described interest among younger and Latino
 2 Academics use political polling as a measure about the viability of survey research can it accurately predict the result of a national election? The answer continues to be yes. There is compelling evidence
Do Russians Want Change?
 Do Russians Want Change? Results From Polling and Focus Groups Conducted by the Carnegie Moscow Center and Levada Center Andrei Kolesnikov February 8, 2018 Does Russia need change? Most Russians understand
These are the highlights of the latest Field Poll completed among a random sample of 997 California registered voters.
 THE FIELD POLL THE INDEPENDENT AND NON-PARTISAN SURVEY OF PUBLIC OPINION ESTABLISHED IN 1947 AS THE CALIFORNIA POLL BY MERVIN FIELD Field Research Corporation 601 California Street, Suite 900 San Francisco,
Escalating Uncertainty
 Escalating Uncertainty THE NEXT ROUND OF GUBERNATORIAL ELECTIONS IN RUSSIA PONARS Eurasia Policy Memo No. 224 September 2012 Gulnaz Sharafutdinova Miami University Subnational electoral competition has
Congruence in Political Parties
 Descriptive Representation of Women and Ideological Congruence in Political Parties Georgia Kernell Northwestern University gkernell@northwestern.edu June 15, 2011 Abstract This paper examines the relationship
Campaigning in General Elections (HAA)
") Campaigning in General Elections (HAA) Once the primary season ends, the candidates who have won their party s nomination shift gears to campaign in the general election. Although the Constitution calls
Campaigning in General Elections (HAA) Once the primary season ends, the candidates who have won their party s nomination shift gears to campaign in the general election. Although the Constitution calls
Colorado 2014: Comparisons of Predicted and Actual Turnout
 Colorado 2014: Comparisons of Predicted and Actual Turnout Date 2017-08-28 Project name Colorado 2014 Voter File Analysis Prepared for Washington Monthly and Project Partners Prepared by Pantheon Analytics
BLISS INSTITUTE 2006 GENERAL ELECTION SURVEY
 BLISS INSTITUTE 2006 GENERAL ELECTION SURVEY Ray C. Bliss Institute of Applied Politics The University of Akron Executive Summary The Bliss Institute 2006 General Election Survey finds Democrat Ted Strickland
Robert H. Prisuta, American Association of Retired Persons (AARP) 601 E Street, N.W., Washington, D.C
 601 E Street, N.W., Washington, D.C") A POST-ELECTION BANDWAGON EFFECT? COMPARING NATIONAL EXIT POLL DATA WITH A GENERAL POPULATION SURVEY Robert H. Prisuta, American Association of Retired Persons (AARP) 601 E Street, N.W., Washington, D.C.
A POST-ELECTION BANDWAGON EFFECT? COMPARING NATIONAL EXIT POLL DATA WITH A GENERAL POPULATION SURVEY Robert H. Prisuta, American Association of Retired Persons (AARP) 601 E Street, N.W., Washington, D.C.
CAN FAIR VOTING SYSTEMS REALLY MAKE A DIFFERENCE?
 CAN FAIR VOTING SYSTEMS REALLY MAKE A DIFFERENCE? Facts and figures from Arend Lijphart s landmark study: Patterns of Democracy: Government Forms and Performance in Thirty-Six Countries Prepared by: Fair
Moral Values Take Back Seat to Partisanship and the Economy In 2004 Presidential Election
 Moral Values Take Back Seat to Partisanship and the Economy In 2004 Presidential Election Lawrence R. Jacobs McKnight Land Grant Professor Director, 2004 Elections Project Humphrey Institute University
Amy Tenhouse. Incumbency Surge: Examining the 1996 Margin of Victory for U.S. House Incumbents
 Amy Tenhouse Incumbency Surge: Examining the 1996 Margin of Victory for U.S. House Incumbents In 1996, the American public reelected 357 members to the United States House of Representatives; of those
ANNUAL SURVEY REPORT: BELARUS
 ANNUAL SURVEY REPORT: BELARUS 2 nd Wave (Spring 2017) OPEN Neighbourhood Communicating for a stronger partnership: connecting with citizens across the Eastern Neighbourhood June 2017 1/44 TABLE OF CONTENTS
Partisan Advantage and Competitiveness in Illinois Redistricting
 Partisan Advantage and Competitiveness in Illinois Redistricting An Updated and Expanded Look By: Cynthia Canary & Kent Redfield June 2015 Using data from the 2014 legislative elections and digging deeper
Electoral Reform Questionnaire Field Dates: October 12-18, 2016
 1 Electoral Reform Questionnaire Field Dates: October 12-18, 2016 Note: The questions below were part of a more extensive survey. 1. A [ALTERNATE WITH B HALF-SAMPLE EACH] All things considered, would you
Young Voters in the 2010 Elections
 Young Voters in the 2010 Elections By CIRCLE Staff November 9, 2010 This CIRCLE fact sheet summarizes important findings from the 2010 National House Exit Polls conducted by Edison Research. The respondents
ANNUAL SURVEY REPORT: REGIONAL OVERVIEW
 ANNUAL SURVEY REPORT: REGIONAL OVERVIEW 2nd Wave (Spring 2017) OPEN Neighbourhood Communicating for a stronger partnership: connecting with citizens across the Eastern Neighbourhood June 2017 TABLE OF
NEW JERSEY VOTERS TAKE ON 2008
 Contact: PATRICK MURRAY 732-263-5858 (office) 732-979-6769 (cell) pdmurray@monmouth.edu Released: Wednesday, 30, For more information: Monmouth University Polling Institute 400 Cedar Avenue West Long Branch,
Union Voters and Democrats
 POLITICAL MEMO Union Voters and Democrats BY ANNE KIM AND STEFAN HANKIN MAY 2011 Top and union leaders play host this week to prospective 2012 Congressional candidates, highlighting labor s status as a
Public Opinion and Political Participation
 CHAPTER 5 Public Opinion and Political Participation CHAPTER OUTLINE I. What Is Public Opinion? II. How We Develop Our Beliefs and Opinions A. Agents of Political Socialization B. Adult Socialization III.
Presidential Race Nip and Tuck in Michigan
 SOSS Bulletin Preliminary Draft 1.1 Presidential Race Nip and Tuck in Michigan Darren W. Davis Professor of Political Science Brian D. Silver Director of the State of the State Survey (SOSS) and Professor
2013 Boone Municipal Election Turnout: Measuring the effects of the 2013 Board of Elections changes
 2013 Boone Municipal Election Turnout: Measuring the effects of the 2013 Board of Elections changes George Ehrhardt, Ph.D. Department of Government and Justice Studies Appalachian State University 12/2013
ALABAMA: TURNOUT BIG QUESTION IN SENATE RACE
 Please attribute this information to: Monmouth University Poll West Long Branch, NJ 07764 www.monmouth.edu/polling Follow on Twitter: @MonmouthPoll Released: Monday, 11, Contact: PATRICK MURRAY 732-979-6769
The Cook Political Report / LSU Manship School Midterm Election Poll
 The Cook Political Report / LSU Manship School Midterm Election Poll The Cook Political Report-LSU Manship School poll, a national survey with an oversample of voters in the most competitive U.S. House
A Journal of Public Opinion & Political Strategy. Missing Voters in the 2012 Election: Not so white, not so Republican
 THE strategist DEMOCRATIC A Journal of Public Opinion & Political Strategy www.thedemocraticstrategist.org A TDS Strategy Memo: Missing White Voters: Round Two of the Debate By Ruy Teixeira and Alan Abramowitz
Part Three (continued): Electoral Systems & Linkage Institutions
: Electoral Systems & Linkage Institutions") Part Three (continued): Electoral Systems & Linkage Institutions Our political institutions work remarkably well. They are designed to clang against each other. The noise is democracy at work. -- Michael
Part Three (continued): Electoral Systems & Linkage Institutions Our political institutions work remarkably well. They are designed to clang against each other. The noise is democracy at work. -- Michael
2017 CAMPAIGN FINANCE REPORT
 2017 CAMPAIGN FINANCE REPORT PRINCIPAL AUTHORS: LONNA RAE ATKESON PROFESSOR OF POLITICAL SCIENCE, DIRECTOR CENTER FOR THE STUDY OF VOTING, ELECTIONS AND DEMOCRACY, AND DIRECTOR INSTITUTE FOR SOCIAL RESEARCH,
It s Democrats +8 in Likely Voter Preference, With Trump and Health Care on Center Stage
 ABC NEWS/WASHINGTON POST POLL: The 2018 Midterm Elections EMBARGOED FOR RELEASE AFTER 12:00 a.m. Sunday, Nov. 4, 2018 It s Democrats +8 in Likely Voter Preference, With Trump and Health Care on Center
THE PEOPLE, THE PRESS & POLITICS 1990 After The Election
 FOR RELEASE: FRIDAY, NOVEMBER 16, 1990 THE PEOPLE, THE PRESS & POLITICS 1990 After The Election FOR FURTHER INFORMATION CONTACT: Donald S. Kellermann, Director Andrew Kohut, Director of Surveys Carol Bowman,
Who Would Have Won Florida If the Recount Had Finished? 1
 Who Would Have Won Florida If the Recount Had Finished? 1 Christopher D. Carroll ccarroll@jhu.edu H. Peyton Young pyoung@jhu.edu Department of Economics Johns Hopkins University v. 4.0, December 22, 2000
Minnesota Public Radio News and Humphrey Institute Poll. Backlash Gives Franken Slight Edge, Coleman Lifted by Centrism and Faith Vote
 Minnesota Public Radio News and Humphrey Institute Poll Backlash Gives Franken Slight Edge, Coleman Lifted by Centrism and Faith Vote Report prepared by the Center for the Study of Politics and Governance
Elections in Russia The March 4 Presidential Election
 IFES FAQ March 2012 Elections in Russia The March 4 Presidential Election Europe and Asia International Foundation for Electoral Systems 1850 K Street, NW Fifth Floor Washington, DC 20006 www.ifes.org
Party Formation and Non-Formation in Russia. Michael McFaul. Russian Domestic Politics Project RUSSIAN AND EURASIAN PROGRAM
 Party Formation and Non-Formation in Russia Michael McFaul Russian Domestic Politics Project RUSSIAN AND EURASIAN PROGRAM Number 12 May 2000 2000 Carnegie Endowment for International Peace All rights reserved.
Possible voting reforms in the United States
 Possible voting reforms in the United States Since the disputed 2000 Presidential election, there have numerous proposals to improve how elections are conducted. While most proposals have attempted to
Flash Eurobarometer 337 TNS political &social. This document of the authors.
 Flash Eurobarometer Croatia and the European Union REPORT Fieldwork: November 2011 Publication: February 2012 Flash Eurobarometer TNS political &social This survey has been requested by the Directorate-General
The Youth Vote 2004 With a Historical Look at Youth Voting Patterns,
 The Youth Vote 2004 With a Historical Look at Youth Voting Patterns, 1972-2004 Mark Hugo Lopez, Research Director Emily Kirby, Research Associate Jared Sagoff, Research Assistant Chris Herbst, Graduate
Vote Preference in Jefferson Parish Sheriff Election by Gender
 March 22, 2018 A survey of 617 randomly selected Jefferson Parish registered voters was conducted March 18-20, 2018 by the University of New Orleans Survey Research Center on the Jefferson Parish Sheriff
Release #2337 Release Date and Time: 6:00 a.m., Friday, June 4, 2010
 THE FIELD POLL THE INDEPENDENT AND NON-PARTISAN SURVEY OF PUBLIC OPINION ESTABLISHED IN 1947 AS THE CALIFORNIA POLL BY MERVIN FIELD Field Research Corporation 601 California Street, Suite 900 San Francisco,
Political Sophistication and Third-Party Voting in Recent Presidential Elections
 Political Sophistication and Third-Party Voting in Recent Presidential Elections Christopher N. Lawrence Department of Political Science Duke University April 3, 2006 Overview During the 1990s, minor-party
Page 1 of 10 Half of Canadians say their country is too generous toward illegal border crossers
 Page 1 of 10 Half of Canadians say their country is too generous toward illegal border crossers 57 per cent disapprove of the federal government s handling of this summer s surge in asylum seekers September
What Went Wrong? Regional Electoral Politics and Impediments to State Centralization in Russia,
 What Went Wrong? Regional Electoral Politics and Impediments to State Centralization in Russia, 2003-2004 PONARS Policy Memo 337 Grigorii V. Golosov European University at St. Petersburg November 2004