Colorado 2014: Comparisons of Predicted and Actual Turnout
|
|
|
- Elwin Bishop
- 6 years ago
- Views:
Transcription
1 Colorado 2014: Comparisons of Predicted and Actual Turnout Date Project name Colorado 2014 Voter File Analysis Prepared for Washington Monthly and Project Partners Prepared by Pantheon Analytics Amelia Showalter Executive Summary Analysis of voter turnout in the 2014 midterm election in Colorado shows that low-propensity voters, including young voters, significantly overperformed their predicted turnout levels. This report also contains analyses of predicted versus actual turnout among various subgroups, including those based on demographics, partisanship, and vote history. While not conclusive, the evidence generated by these analyses supports the assertion that Colorado s universal vote-by-mail system -- which debuted in likely played a role in increasing turnout. 1
2 1. Background In 2014 Colorado instituted a new system of voting in which all active voters would receive their ballots in the mail. Voters could then either mail back those ballots or drop them o at one of many o icial voting centers. The ostensible goal of this program was to make voting easier for more citizens, and to reduce costs. Without a control group, it is impossible to know whether Colorado s Universal Vote By Mail (UVBM) system a ected turnout. There are, however, methods for making reasonable inferences about UVBM s e ect. The analyses in this report compares predicted voter turnout -- in the form of a respected turnout model -- to actual voter turnout in the 2014 election. 2. Methodology and Descriptive Statistics 2.1 Methods All analyses in this report aggregate voters into groups according to particular variables: age brackets, model score ranges, racial categories, and so on. For each of these aggregated groups, two key averages are calculated. The first is the average Clarity Turnout Model score (see below for model details). A group s average turnout score is, in essence, the percent of that group that was expected to vote in For instance, within voters listed as active on the Colorado voter file, female Democrats had an average turnout score of While perfect prediction is impossible, the political scientists who built this model would tell you that their best guess before Election Day 2014 was that 70.6% of female Democrats would vote. The second figure calculated for each group in this report is their actual turnout percentage. For instance, female Democrats in Colorado actually turned out at a rate of 73.2%. Looking at the di erence between predicted and actual turnout is the crux of the analyses in this report. 2
3 2.2 About the Clarity Turnout Model Like most turnout models, Clarity Campaigns generated its 2014 turnout scores by using data from a similar previous election (2010) to train and validate a model. As documented by Clarity: This model was trained on randomly selected voters from the National Voter File Coop in 50 states and DC based on their 2010 general turnout history. A look-up table was generated of vote history patterns and their probability of predicting turnout in a mid-term general election. Additional sub-models were created using a rules-based classifier on a variety of consumer and vote history synthetic variables. All sub-models were adjusted to take into account the four years since the previous election. The final score was generated using a logistic regression built on top of the sub-models and turnout pattern prediction. Each voter was assigned a 1 weighted probability of turning out, which is that voter s score. Key variables in model include past vote history, age, gender, marital status, household turnout history, migration history, and various appended consumer variables including home ownership. Importantly for these analyses, the turnout model did not make any adjustments to account for what might happen in Colorado in 2014 because of UVBM (or any other Colorado-specific quirks). While regional and state-level sub-models may have been incorporated, the final model was national in nature. As mentioned later in this report, the model was shown to be quite accurate nationally. 2.3 Descriptive Statistics The December 2014 Colorado voter file, as transmitted by TargetSmart, contains 4,563,192 records. However, only 64% of these records were designated as Active voters on the file (a status defined by the Secretary of State). The analyses in this report focuses on these active voters. 1 Model Release Notes, Clarity National Likely Voter Model V2 3
 were necessarily excluded from all analyses")

 A er this exclusion, the total pool for analysis was 2,833,121 voters.")


4 Of the 2,924,842 active voters, 97% had received a Clarity turnout score. The remaining 3% (91,721) were necessarily excluded from all analyses below. (It is likely many of that these unscored voters were people who registered very late in the cycle.) A er this exclusion, the total pool for analysis was 2,833,121 voters. Descriptive statistics of these 2.8 million voters are represented below. Of these 2.8 million active voters, 2014 turnout was approximately 70%. The voter file shows substantial numbers of both absentee and mailed ballots in 2014, but it is unclear whether there is a meaningful distinction between these two designations. (A smaller number of votes cast at polling places, presumably at drop-o centers.) 4


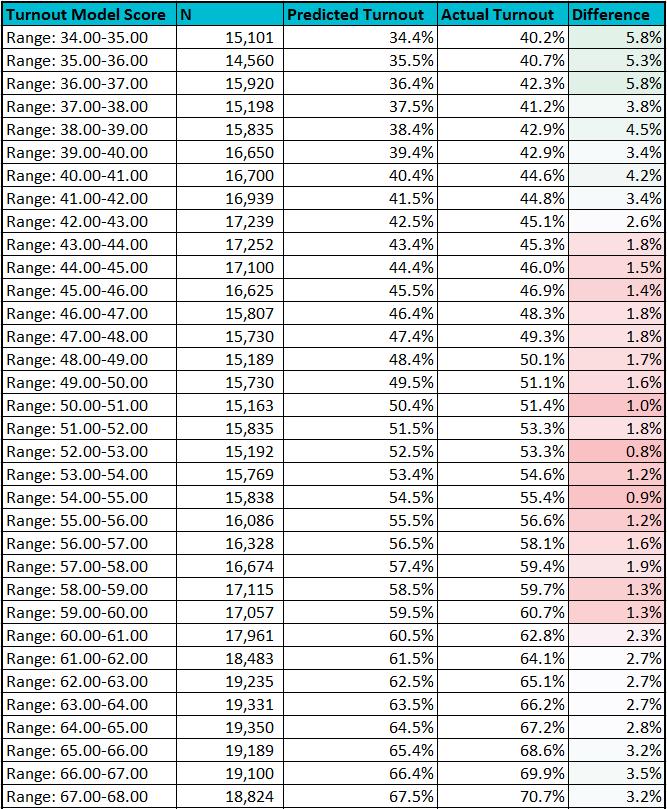
5 TargetSmart receives these vote-method designations from the Colorado Secretary of State and/or county elections o icers. It is not uncommon for the absentee/mail designation to vary by county. For the purpose of the analyses below, all vote methods have been combined into a binary turnout variable. 3. Results 3.1 Turnout Model Cohort Results Overall, turnout in Colorado was 3.3 points higher than the Clarity Turnout Model would have predicted. This is due almost entirely to overperformance among those with the lowest turnout scores. Of course, it is important to remember that overperformance is inherently easier for people with lower scores. Voters with high turnout scores have less room to 5

6 improve. Still, the magnitude of the overperformance among the bottom cohorts is remarkable. The following pages break the scores down further into single percentages. 6
7 7

8 Above the score threshold of 40 (i.e. 40% predicted turnout) the Clarity Turnout Model proved reasonably accurate. No cohort above this threshold was o by more than a few points. At the lower end of the spectrum, however, turnout was o en much higher than predicted. Voters who had been predicted to turn out at a rate of 8
9 10% actually turned out at a rate of nearly 31%. Voters who had been predicted to vote 20% of the time actually voted 36% of the time, and so on. We cannot know whether UVBM is the root cause of these voters overperformance (or, to put it another way, the model s underprediction). But Colorado appears to be unique in this particular pattern of predicted-versus-actual performance when looking at the Clarity Turnout Model nationwide. A post-election analysis by Clarity of its model across all states showed a much more linear relationship between predicted and actual turnout. Nationally, the Clarity turnout model slightly underpredicted turnout, particularly in the middle-to-upper end of the spectrum. On the whole, however, Clarity s model was reasonably accurate; the linear relationship between predicted and actual turnout is a good measure of reliability for a turnout model. As shown in the tables above and the chart below, however, the Clarity turnout model s predictions for Colorado s active voters were quite accurate except for the lower end of the spectrum. 9
10 What made Colorado di erent? Why did low-propensity voters voters in Colorado vote at rates that were significantly higher than expected, even as low-propensity voters nationwide voted close to (or slightly below) their predicted levels? While it is possible to imagine any number of explanations -- targeted GOTV programs, for example -- it is not unreasonable to conclude that UVBM played a large role. 3.2 Demographic Comparisons Age is a usually strong predictor of turnout, particularly in non-presidential elections. Young people simply do not vote at the same rates as older people. Thus, it is not a surprise that younger people had lower predicted turnout in Colorado in Given the evidence in the previous section, it is also not surprising that young people strongly overperformed their predicted turnout. There is a strong overlap between younger voters and low-propensity voters. 10


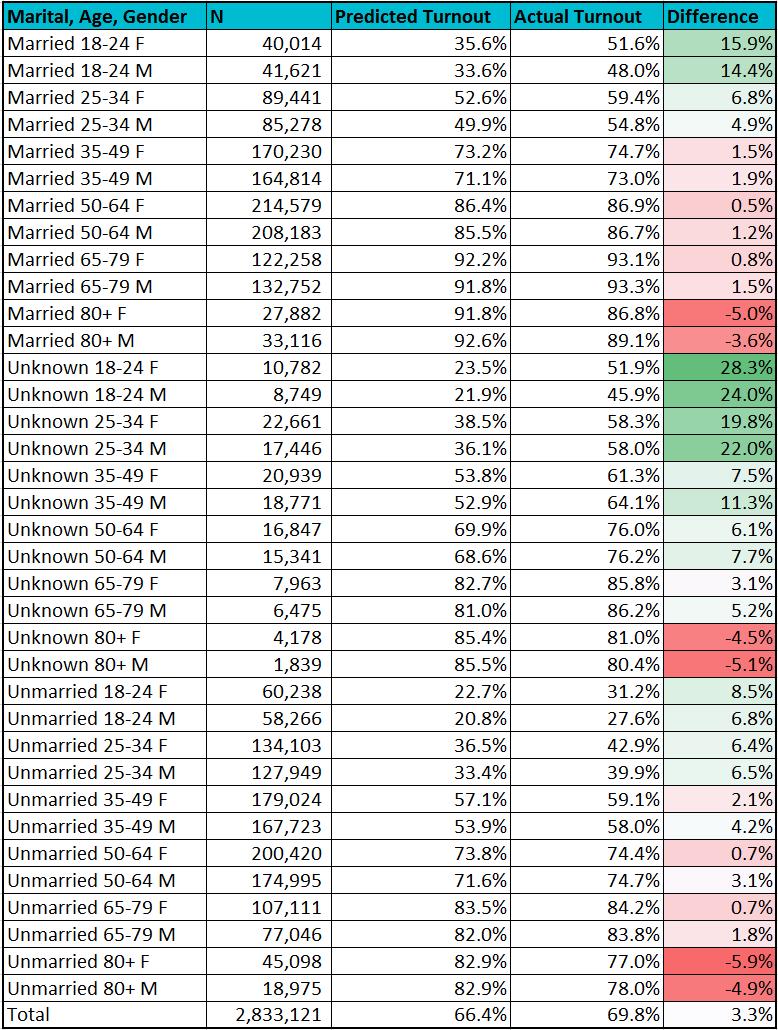
11 While the youngest voters overperformed their predicted turnout by twelve points, the oldest voters underperformed by five points. If we posit that some of the elevated youth turnout is thanks to UVBM, must we also conclude that some older voters might have been dissuaded by UVBM? Perhaps. Though, again, it is important to caution that with any group with very high scores -- such as the elderly -- there is inherently more opportunity for underperformance than overperformance. Still, it is at least plausible that a er a lifetime of voting at polling places, at least a few older voters might have found their mailed ballots confusing. (One would think that mailed ballots would actually be a boon to voters in assisted living facilities, but perhaps this benefit was o set by other negative e ects such as delivery issues.) Gender di erences in over- versus under-performance were slight. Males outperformed their predicted score to a slightly greater degree, but the di erence is minimal in comparison to the age and general turnout analyses. 11

12 Likewise, there were not large overperformance di erences between married and unmarried voters. The small number of voters whose marital status was unknown overperformed by thirteen points, but this mostly reflects the younger average age for voters with missing marital status information. Racial di erences in overperformance were also relatively small. Traditionally Democratic groups such as Blacks, Hispanics, and Asians had lower levels of overperformance compared to Whites. It is worth noting, however, that the race variable on the Colorado voter file is imputed -- most likely by matching a voter s name and geography against racial probability models. Exit polls showed higher 2 levels of non-white turnout than the imputed numbers below would suggest. The numbers below should therefore be viewed with some caution. Still, even if we had more reliable figures for race than those above, there is little evidence to suggest a strong association between race and overperformance. Certainly, the association is less strong than for age. 3.3 Partisanship Comparisons There are three ways to look at a voter s partisanship. The most obvious method is to look at party registration, which Colorado records on its voter file. The second method examines which partisan presidential primaries voters have chosen to participate in (or caucuses, in Colorado s case). The final method uses the Clarity Partisanship Model, which generates a score for each voter based on massive


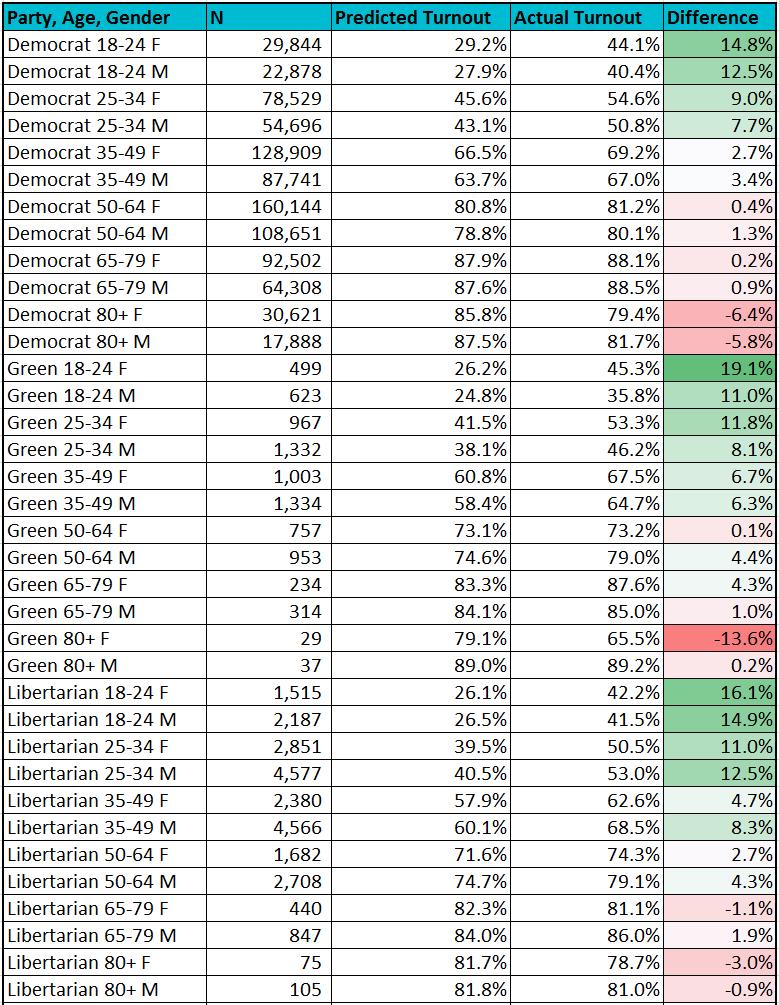
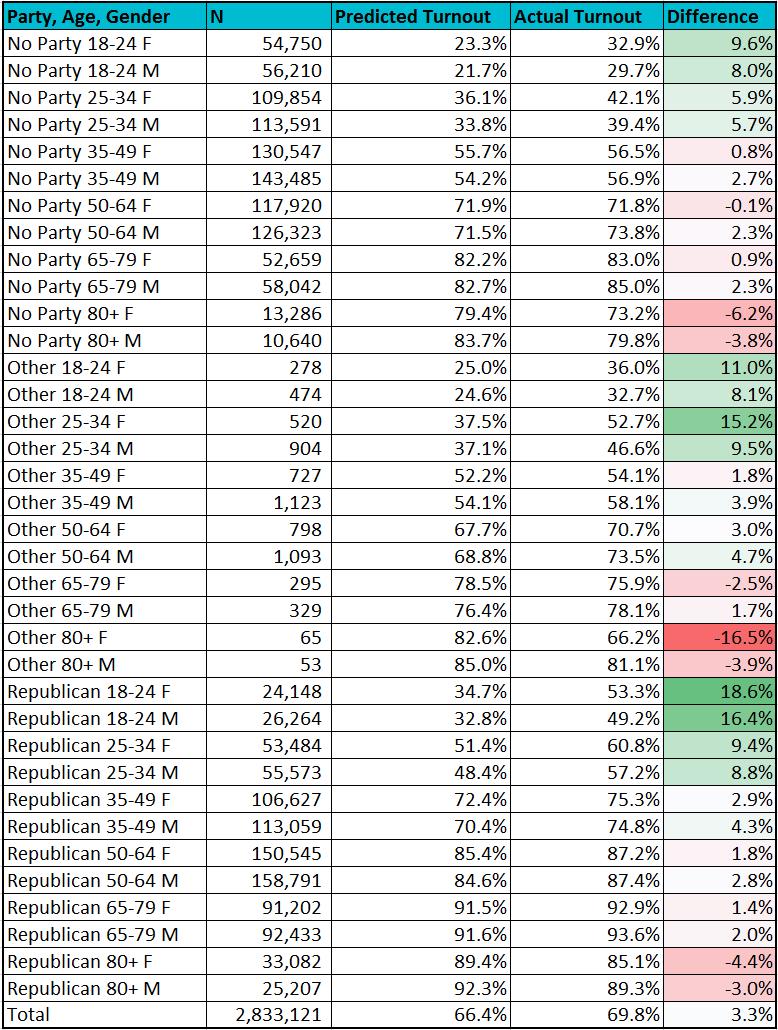
13 numbers of surveys. This model was the o icial partisanship model used by the Democratic National Committee in Registered Republicans overperformed slightly more than registered Democrats overperformed, though the di erence is not large in the context of other analyses in this report. Greens, Libertarians, and other third party registrants had the highest levels of overperformance, though these groups are fairly small. Since 2012 only had presidential primaries on the Republican side, 2008 was the best choice for examining partisan caucus-goers on both sides. Unsurprisingly, caucus-goers are a small and unique bunch; these die-hard Democrats and Republicans had incredibly high predicted turnout for 2014, which they more or less met. 13
 overperformed by a little over two points, while voters predicted to be the most Democratic (i.")
14 Using the Clarity Partisanship Model as a lens for examining partisan di erences in overperformance, we can get a somewhat more nuanced view. Again, the die-hards at either end of the spectrum were predicted to have high turnout and only exceeded expectations by a little. Voters predicted to be most Republican (i.e. those with scores under 10) overperformed by a little over two points, while voters predicted to be the most Democratic (i.e. those with scores above 90) overperformed by just under two points. The highest levels of overperformance were among those with middle-of-the-road partisanship scores. Voters with scores between 60 and i.e. potential Democratic leaners -- turned out at a rate eight points higher than predicted. Voters with scores between 40 and 50 turned out at a rate six points higher than predicted. Historically, voters in these middle bands of partisanship (particularly but also 30-70) have been prime targets for persuasion messaging by campaigns. It is also worth noting that young people and others without much history of voting are o en placed in the middle of the spectrum. 3.4 Previous Vote Methods Prior to 2014, a large majority of Coloradans -- over 70% in 2012, for example -- voted by returning mailed-out "absentee" ballots." While it might be tempting to 14

15 view Colorado's UVBM system as little more than "absentee ballots on steroids," that would obscure a subtle but profound distinction. While Colorado's "permanent absentee" system made ballots very accessible, voters still had to apply to receive them. The new UVBM system arguably abolished traditional absentee ballots, too, since every registered voter would now receive ballot (a mailed-out one, to be sure), regardless of whether they asked for or even expected one. On the other hand, it is plausible that previous absentee voters experienced less disruption with UVBM. The chart below examines 2014 overperformance broken out by whether, and by what method, people had voted in People who did not vote in 2012 had the greatest level of 2014 overperformance. This is not surprising, given the analyses in the previous sections. People who did not vote in 2012 are largely those who were very young and/or had little previous history of voting (or who were not registered/eligible in 2012), and would therefore end up with very low predicted turnout scores. Notably, people who had voted absentee in 2012 had almost no overperformance in 2014, whereas people who had voted in polling locations (either early or on election day) overperformed just slightly. These numbers are all fairly small, so it is important not to overinterpret. But the pattern is consistent with the idea that UVBM would have a smaller e ect on those who had voted by mail previously. 3.5 Multi-dimensional Comparisons All of the variables in the above analyses can be combined for deep-dive comparisons. A few of these multi-dimensional analyses are presented below. The 15


16 results largely follow the patterns seen above, with few unexpected results for hidden subgroups. 16
17 17
18 18
19 19
20 5. Discussion Because we don t have a true control group, we cannot be certain about the role that UVBM played in the 2014 Colorado election. The analyses above are, however, consistent with the patterns one would expect if UVBM had a positive e ect on voter turnout. Low propensity voters overperformed their 2014 Clarity Turnout Model predictions in Colorado, contrasting with low propensity voters nationwide who turned out mostly as expected. Age, which is strongly correlated with turnout in every election, was also a notable predictor of overperformance; young people in Colorado voted at higher rates than expected. Demographic and partisan distinctions were less relevant to overperformance, though there were some small di erences. People who had voted absentee in 2012 turned out at almost exactly their predicted rate, while those who had previously voted in person overperformed slightly. 6. Next Steps Analysis of other states and other elections would help provide context to these results. In other locations where UVBM has been introduced, do similar patterns emerge? Though Oregon and Washington instituted UVBM many cycles ago, perhaps it would be possible to find contemporaneous turnout models and perform similar analysis. Likewise, if there are particular counties that have instituted vote-by-mail in non-uvbm states, analysis could be performed there. Many counties in Utah, for instance, moved to a UVBM system in It is also possible that more evidence can be gleaned from Colorado itself. Repeating the analyses in this report on Colorado s 2016 voter file could yield valuable new evidence. There is reason to believe that UVBM s e ects, if any, would continue to confound the national turnout model for at least another cycle. 20
21 Particularly among new voters, infrequent voters, and recent arrivals to Colorado, the 2016 turnout model might similarly under-predict turnout if indeed UVBM has a positive e ect on these groups. Another avenue for analysis would be to compare sub-populations -- in Colorado or other UVBM states -- with histories of recent migration. As UVBM becomes the norm within a state over the course of several cycles, the turnout e ects presumably become baked in for the model scores assigned to voters there. But what about people who move into those states from elsewhere? Comparisons between intra-state migrants and inter-state migrants may yield interesting results. 21
Iowa Voting Series, Paper 6: An Examination of Iowa Absentee Voting Since 2000
 Department of Political Science Publications 5-1-2014 Iowa Voting Series, Paper 6: An Examination of Iowa Absentee Voting Since 2000 Timothy M. Hagle University of Iowa 2014 Timothy M. Hagle Comments This
Iowa Voting Series, Paper 4: An Examination of Iowa Turnout Statistics Since 2000 by Party and Age Group
 Department of Political Science Publications 3-1-2014 Iowa Voting Series, Paper 4: An Examination of Iowa Turnout Statistics Since 2000 by Party and Age Group Timothy M. Hagle University of Iowa 2014 Timothy
Data Models. 1. Data REGISTRATION STATUS VOTING HISTORY
 Cambridge Analytica offers a range of enhanced audience segments drawn from our national database of over 220 million Americans. These segments can be used individually or together to power highly targeted
Case Study: Get out the Vote
 Case Study: Get out the Vote Do Phone Calls to Encourage Voting Work? Why Randomize? This case study is based on Comparing Experimental and Matching Methods Using a Large-Scale Field Experiment on Voter
VoteCastr methodology
 VoteCastr methodology Introduction Going into Election Day, we will have a fairly good idea of which candidate would win each state if everyone voted. However, not everyone votes. The levels of enthusiasm
DNC SCORES IN VOTEBUILDER. VA 5th District Democratic Committee
 DNC SCORES IN VOTEBUILDER VA 5th District Democratic Committee DNC scores in VoteBuilder are models of behavior that are created from historic data, demographics, selfidentification, consumer data and
POLL: CLINTON MAINTAINS BIG LEAD OVER TRUMP IN BAY STATE. As early voting nears, Democrat holds 32-point advantage in presidential race
 DATE: Oct. 6, FOR FURTHER INFORMATION, CONTACT: Brian Zelasko at 413-796-2261 (office) or 413 297-8237 (cell) David Stawasz at 413-796-2026 (office) or 413-214-8001 (cell) POLL: CLINTON MAINTAINS BIG LEAD
Young Voters in the 2010 Elections
 Young Voters in the 2010 Elections By CIRCLE Staff November 9, 2010 This CIRCLE fact sheet summarizes important findings from the 2010 National House Exit Polls conducted by Edison Research. The respondents
1. A Republican edge in terms of self-described interest in the election. 2. Lower levels of self-described interest among younger and Latino
 2 Academics use political polling as a measure about the viability of survey research can it accurately predict the result of a national election? The answer continues to be yes. There is compelling evidence
Youth Voter Turnout has Declined, by Any Measure By Peter Levine and Mark Hugo Lopez 1 September 2002
 Youth Voter has Declined, by Any Measure By Peter Levine and Mark Hugo Lopez 1 September 2002 Measuring young people s voting raises difficult issues, and there is not a single clearly correct turnout
Who Votes for America s Mayors?
 Who Votes for America s Mayors? A Pilot study to determine who casts ballots and who doesn t in 4 U.S. Cities: Charlotte, Detroit, Portland, and St. Paul Jason R. Jurjevich, PhD 1 Phil Keisling 1 Kevin
CIRCLE The Center for Information & Research on Civic Learning & Engagement
 FACT SHEET CIRCLE The Center for Information & Research on Civic Learning & Engagement The Youth Vote 2004 By Mark Hugo Lopez, Emily Kirby, and Jared Sagoff 1 July 2005 Estimates from all sources suggest
November 2018 Hidden Tribes: Midterms Report
 November 2018 Hidden Tribes: Midterms Report Stephen Hawkins Daniel Yudkin Miriam Juan-Torres Tim Dixon November 2018 Hidden Tribes: Midterms Report Authors Stephen Hawkins Daniel Yudkin Miriam Juan-Torres
THE 2004 YOUTH VOTE MEDIA COVERAGE. Select Newspaper Reports and Commentary
 MEDIA COVERAGE Select Newspaper Reports and Commentary Turnout was up across the board. Youth turnout increased and kept up with the overall increase, said Carrie Donovan, CIRCLE s young vote director.
The Youth Vote 2004 With a Historical Look at Youth Voting Patterns,
 The Youth Vote 2004 With a Historical Look at Youth Voting Patterns, 1972-2004 Mark Hugo Lopez, Research Director Emily Kirby, Research Associate Jared Sagoff, Research Assistant Chris Herbst, Graduate
Five Days to Go: The Race Tightens October 28-November 1, 2016
 Five Days to Go: The Race Tightens October 28-November 1, 2016 CBS NEWS/NEW YORK TIMES POLL For release: Thursday November 3, 2016 7:00 AM EDT As the race for president pulls into the home stretch, Hillary
The Demography of the Labor Force in Emerging Markets
 The Demography of the Labor Force in Emerging Markets David Lam I. Introduction This paper discusses how demographic changes are affecting the labor force in emerging markets. As will be shown below, the
POLL DATA HIGHLIGHTS SIGNIFICANT DIFFERENCES BETWEEN REGISTERED DEMOCRATS AND REPUBLICANS.
 - - - - - - e THE INDEPENDENT AND NON-PARTISAN STATEWIDE SURVEY OF PUBLIC OPINION ESTABLISHED IN 947 BY MERVIN D. FIELD. 234 Front Street San Francisco 94 (45) 392-5763 COPYRIGHT 978 BY THE FIELD INSTITUTE.
NATIONAL: 2018 HOUSE RACE STABILITY
 Please attribute this information to: Monmouth University Poll West Long Branch, NJ 07764 www.monmouth.edu/polling Follow on Twitter: @MonmouthPoll Released: Friday, November 2, 2018 Contact: PATRICK MURRAY
CIRCLE The Center for Information & Research on Civic Learning & Engagement 70% 60% 50% 40% 30% 20% 10%
 FACT SHEET CIRCLE The Center for Information & Research on Civic Learning & Engagement Youth Voter Increases in 2006 By Mark Hugo Lopez, Karlo Barrios Marcelo, and Emily Hoban Kirby 1 June 2007 For the
The California Primary and Redistricting
 The California Primary and Redistricting This study analyzes what is the important impact of changes in the primary voting rules after a Congressional and Legislative Redistricting. Under a citizen s committee,
Friends of Democracy Corps and Greenberg Quinlan Rosner Research. Stan Greenberg and James Carville, Democracy Corps
 Date: January 13, 2009 To: From: Friends of Democracy Corps and Greenberg Quinlan Rosner Research Stan Greenberg and James Carville, Democracy Corps Anna Greenberg and John Brach, Greenberg Quinlan Rosner
Ohio State University
 Fake News Did Have a Significant Impact on the Vote in the 2016 Election: Original Full-Length Version with Methodological Appendix By Richard Gunther, Paul A. Beck, and Erik C. Nisbet Ohio State University
Objectives and Context
 Encouraging Ballot Return via Text Message: Portland Community College Bond Election 2017 Prepared by Christopher B. Mann, Ph.D. with Alexis Cantor and Isabelle Fischer Executive Summary A series of text
Executive Summary of Texans Attitudes toward Immigrants, Immigration, Border Security, Trump s Policy Proposals, and the Political Environment
 2017 of Texans Attitudes toward Immigrants, Immigration, Border Security, Trump s Policy Proposals, and the Political Environment Immigration and Border Security regularly rank at or near the top of the
RBS SAMPLING FOR EFFICIENT AND ACCURATE TARGETING OF TRUE VOTERS
 Dish RBS SAMPLING FOR EFFICIENT AND ACCURATE TARGETING OF TRUE VOTERS Comcast Patrick Ruffini May 19, 2017 Netflix 1 HOW CAN WE USE VOTER FILES FOR ELECTION SURVEYS? Research Synthesis TRADITIONAL LIKELY
Data Dictionary. Online Segments
 Data Dictionary Online Segments From its database of over 230 million American voters and consumers, i360 offers advanced online segments, custom-tailored for the pro-business political and advocacy communities.
Characteristics of Poverty in Minnesota
 Characteristics of Poverty in Minnesota by Dennis A. Ahlburg P overty and rising inequality have often been seen as the necessary price of increased economic efficiency. In this view, a certain amount
NUMBERS, FACTS AND TRENDS SHAPING THE WORLD. FOR RELEASE September 12, 2014 FOR FURTHER INFORMATION ON THIS REPORT:
 NUMBERS, FACTS AND TRENDS SHAPING THE WORLD FOR RELEASE September 12, 2014 FOR FURTHER INFORMATION ON THIS REPORT: Carroll Doherty, Director of Political Research Jocelyn Kiley, Associate Director Rachel
Political participation by young women in the 2018 elections: Post-election report
 Political participation by young women in the 2018 elections: Post-election report Report produced by the Research and Advocacy Unit (RAU) & the Institute for Young Women s Development (IYWD). December
THE SECRETS OF VOTER TURNOUT 2018
 Dish THE SECRETS OF VOTER TURNOUT 2018 AN ANALYSIS OF INDIVIDUALLEVEL VOTE HISTORY IN THE VIRGINIA GOVERNOR S RACE Comcast May 2018 Netflix!X!1 Overview VIRGINIA 17: WHAT HAPPENED Despite polls suggesting
An Assessment of Ranked-Choice Voting in the San Francisco 2005 Election. Final Report. July 2006
 Public Research Institute San Francisco State University 1600 Holloway Ave. San Francisco, CA 94132 Ph.415.338.2978, Fx.415.338.6099 http://pri.sfsu.edu An Assessment of Ranked-Choice Voting in the San
CSI Brexit 2: Ending Free Movement as a Priority in the Brexit Negotiations
 CSI Brexit 2: Ending Free Movement as a Priority in the Brexit Negotiations 18 th October, 2017 Summary Immigration is consistently ranked as one of the most important issues facing the country, and a
Political socialization: change and stability in political attitudes among and within age cohorts
 University of Central Florida HIM 1990-2015 Open Access Political socialization: change and stability in political attitudes among and within age cohorts 2011 Michael S. Hale University of Central Florida
2.2 THE SOCIAL AND DEMOGRAPHIC COMPOSITION OF EMIGRANTS FROM HUNGARY
 1 Obviously, the Population Census does not provide information on those emigrants who have left the country on a permanent basis (i.e. they no longer have a registered address in Hungary). 60 2.2 THE
By David Lauter. 1 of 5 12/12/2016 9:39 AM
 Clinton won as many votes as Obama in 2012 just not in the states wher... 1 of 5 12/12/2016 9:39 AM Hillary Clinton won the popular vote by at least 2.8 million, according to a final tally. The result
Partisan Nation: The Rise of Affective Partisan Polarization in the American Electorate
 Partisan Nation: The Rise of Affective Partisan Polarization in the American Electorate Alan I. Abramowitz Department of Political Science Emory University Abstract Partisan conflict has reached new heights
Robert H. Prisuta, American Association of Retired Persons (AARP) 601 E Street, N.W., Washington, D.C
 601 E Street, N.W., Washington, D.C") A POST-ELECTION BANDWAGON EFFECT? COMPARING NATIONAL EXIT POLL DATA WITH A GENERAL POPULATION SURVEY Robert H. Prisuta, American Association of Retired Persons (AARP) 601 E Street, N.W., Washington, D.C.
A POST-ELECTION BANDWAGON EFFECT? COMPARING NATIONAL EXIT POLL DATA WITH A GENERAL POPULATION SURVEY Robert H. Prisuta, American Association of Retired Persons (AARP) 601 E Street, N.W., Washington, D.C.
The Rising American Electorate
 The Rising American Electorate Their Growing Numbers and Political Potential Celinda Lake and Joshua Ulibarri Lake Research Partners Washington, DC Berkeley, CA New York, NY LakeResearch.com 202.776.9066
Wide and growing divides in views of racial discrimination
 FOR RELEASE MARCH 01, 2018 The Generation Gap in American Politics Wide and growing divides in views of racial discrimination FOR MEDIA OR OTHER INQUIRIES: Carroll Doherty, Director of Political Research
Clinton Maintains 3% Lead in Michigan (Clinton 47% - Trump 44% - Johnson 4% - Stein 1%)
") FOR RELEASE: November 3, 2016 P R E S S R E L E A S E Contact: Steve Mitchell 248-891-2414 Clinton Maintains 3% Lead in Michigan (Clinton 47% - Trump 44% - Johnson 4% - Stein 1%) EAST LANSING, Michigan
FOR RELEASE: November 3, 2016 P R E S S R E L E A S E Contact: Steve Mitchell 248-891-2414 Clinton Maintains 3% Lead in Michigan (Clinton 47% - Trump 44% - Johnson 4% - Stein 1%) EAST LANSING, Michigan
Union Voters and Democrats
 POLITICAL MEMO Union Voters and Democrats BY ANNE KIM AND STEFAN HANKIN MAY 2011 Top and union leaders play host this week to prospective 2012 Congressional candidates, highlighting labor s status as a
The Cook Political Report / LSU Manship School Midterm Election Poll
 The Cook Political Report / LSU Manship School Midterm Election Poll The Cook Political Report-LSU Manship School poll, a national survey with an oversample of voters in the most competitive U.S. House
Voter Turnout by Income 2012
 American democracy is challenged by large gaps in voter turnout by income, age, and other factors. Closing these gaps will require a sustained effort to understand and address the numerous and different
9. Gangs, Fights and Prison
 Between Two Worlds: How Young Latinos Come of Age in America 81 9. Gangs, Fights and Prison Parents all around the world don t need social scientists to tell them what they already know: Adolescence and
WDSU TV & The University of New Orleans Survey Research Center Jefferson Parish Sheriff s Election Survey
 March 8, 2018 WDSU TV commissioned a survey of 767 randomly selected Jefferson Parish registered voters that was conducted March 4-5, 2018 by the University of New Orleans Survey Research Center on the
Telephone Survey. Contents *
 Telephone Survey Contents * Tables... 2 Figures... 2 Introduction... 4 Survey Questionnaire... 4 Sampling Methods... 5 Study Population... 5 Sample Size... 6 Survey Procedures... 6 Data Analysis Method...
The 2005 Ohio Ballot Initiatives: Public Opinion on Issues 1-5. Ray C. Bliss Institute of Applied Politics University of Akron.
 The 2005 Ohio Ballot Initiatives: Public Opinion on Issues 1-5 Ray C. Bliss Institute of Applied Politics University of Akron Executive Summary A survey of Ohio citizens finds mixed results for the 2005
An analysis and presentation of the APIAVote & Asian Americans Advancing Justice AAJC 2014 Voter Survey
 ASIAN AMERICANS TURN OUT FOR WHAT? SPOTLIGHT ON YOUTH VOTERS IN 2014 An analysis and presentation of the APIAVote & Asian Americans Advancing Justice AAJC 2014 Voter Survey Survey research and analysis
Update on OFA Grassroots Organizing: Voter Registration and Early Voting
 October 11, 2012 MEMORANDUM TO INTERESTED PARTIES RE: TO: FROM: Update on OFA Grassroots Organizing: Voter Registration and Early Voting Interested Parties Jeremy Bird, Obama for America National Field
ANNUAL SURVEY REPORT: BELARUS
 ANNUAL SURVEY REPORT: BELARUS 2 nd Wave (Spring 2017) OPEN Neighbourhood Communicating for a stronger partnership: connecting with citizens across the Eastern Neighbourhood June 2017 1/44 TABLE OF CONTENTS
The Washington Poll King County Exit Poll, November 7, 2006
 The exit poll was conducted by the University of Washington at a random sample of 65 polling place precincts throughout King County. At each polling place, a random selection of voters were asked to complete
The Effect of North Carolina s New Electoral Reforms on Young People of Color
 A Series on Black Youth Political Engagement The Effect of North Carolina s New Electoral Reforms on Young People of Color In August 2013, North Carolina enacted one of the nation s most comprehensive
Case 1:17-cv TCB-WSD-BBM Document 94-1 Filed 02/12/18 Page 1 of 37
 Case 1:17-cv-01427-TCB-WSD-BBM Document 94-1 Filed 02/12/18 Page 1 of 37 REPLY REPORT OF JOWEI CHEN, Ph.D. In response to my December 22, 2017 expert report in this case, Defendants' counsel submitted
Eagleton Institute of Politics Rutgers University New Brunswick 191 Ryders Lane New Brunswick, New Jersey
 Eagleton Institute of Politics Rutgers University New Brunswick 191 Ryders Lane New Brunswick, New Jersey 08901-8557 eagletonpoll.rutgers.edu poll@eagleton.rutgers.edu 848-932-8940 Fax: 732-932-6778 WEDNESDAY
ONLINE SEGMENTS DATA DICTIONARY
 DATA DICTIONARY ONLINE SEGMENTS From its database of over 230 million American voters and consumers, i360 offers advanced online segments, custom-tailored for the pro-business political and advocacy communities.
Constitutional Reform in California: The Surprising Divides
 Constitutional Reform in California: The Surprising Divides Mike Binder Bill Lane Center for the American West, Stanford University University of California, San Diego Tammy M. Frisby Hoover Institution
NEWS RELEASE. Red State Nail-biter: McCain and Obama in 47% - 47 % Dead Heat Among Hoosier Voters
 NEWS RELEASE FOR IMMEDIATE RELEASE: October 31, 2008 Contact: Michael Wolf, Associate Professor of Political Science, 260-481-6898 Andrew Downs, Assistant Professor of Political Science, 260-481-6691 Red
Participation. Voting Campaign Activity. Contacting officials Group Activity Protest. Volunteer Contribute money (corporations are people)
") Participation Voting Campaign Activity Volunteer Contribute money (corporations are people) Contacting officials Group Activity Protest Voter Participation What trends? How does US compare? Which mode
Participation Voting Campaign Activity Volunteer Contribute money (corporations are people) Contacting officials Group Activity Protest Voter Participation What trends? How does US compare? Which mode
Vote Preference in Jefferson Parish Sheriff Election by Gender
 March 22, 2018 A survey of 617 randomly selected Jefferson Parish registered voters was conducted March 18-20, 2018 by the University of New Orleans Survey Research Center on the Jefferson Parish Sheriff
Millsaps College-Chism Strategies State of the State Survey: Voters Back Early Voting, Automatic Registration
 For Immediate Release Contact: John Sewell July 12, 2018 601-974-1019 Millsaps College-Chism Strategies State of the State Survey: Voters Back Early Voting, Automatic Registration Survey Finds Mixed Support
Survey of Likely General Election Voters Missouri Statewide
 Survey of Likely General Election Voters Missouri Statewide Conducted October 26-27, 2018 n=501 ±4.38 A. How likely are you to vote or have you already voted in the November 6th General election for Governor
Preliminary results. Fieldwork: June 2008 Report: June
 The Gallup Organization Flash EB N o 87 006 Innobarometer on Clusters Flash Eurobarometer European Commission Post-referendum survey in Ireland Fieldwork: 3-5 June 008 Report: June 8 008 Flash Eurobarometer
Misvotes, Undervotes, and Overvotes: the 2000 Presidential Election in Florida
 Misvotes, Undervotes, and Overvotes: the 2000 Presidential Election in Florida Alan Agresti and Brett Presnell Department of Statistics University of Florida Gainesville, Florida 32611-8545 1 Introduction
GOP Makes Big Gains among White Voters
 1 Especially among the Young and Poor GOP Makes Big Gains among White Voters As the country enters into the 2012 presidential election cycle, the electorate s partisan affiliations have shifted significantly
A Journal of Public Opinion & Political Strategy. Missing Voters in the 2012 Election: Not so white, not so Republican
 THE strategist DEMOCRATIC A Journal of Public Opinion & Political Strategy www.thedemocraticstrategist.org A TDS Strategy Memo: Missing White Voters: Round Two of the Debate By Ruy Teixeira and Alan Abramowitz
New Hampshire is an increasingly mobile state, with
 NEW ENGLAND C A R S EISSUE Y I N SBRIEF T I T UNO. T E 9 1 FALL 2008 CARSEYI N S T I T U T E Many New Voters Make the Granite State One to Watch in November KENNETH M. JOHNSON, DANTE SCAL A, AND ANDREW
Who Votes Without Identification? Using Affidavits from Michigan to Learn About the Potential Impact of Strict Photo Voter Identification Laws
 Using Affidavits from Michigan to Learn About the Potential Impact of Strict Photo Voter Identification Laws Phoebe Henninger Marc Meredith Michael Morse University of Michigan University of Pennsylvania
ANNUAL SURVEY REPORT: ARMENIA
 ANNUAL SURVEY REPORT: ARMENIA 2 nd Wave (Spring 2017) OPEN Neighbourhood Communicating for a stronger partnership: connecting with citizens across the Eastern Neighbourhood June 2017 ANNUAL SURVEY REPORT,
ALABAMA: TURNOUT BIG QUESTION IN SENATE RACE
 Please attribute this information to: Monmouth University Poll West Long Branch, NJ 07764 www.monmouth.edu/polling Follow on Twitter: @MonmouthPoll Released: Monday, 11, Contact: PATRICK MURRAY 732-979-6769
Introduction. Background
 Millennial Migration: How has the Great Recession affected the migration of a generation as it came of age? Megan J. Benetsky and Alison Fields Journey to Work and Migration Statistics Branch Social, Economic,
FINAL RESULTS: National Voter Survey Total Sample Size: 2428, Margin of Error: ±2.0% Interview Dates: November 1-4, 2018
 FINAL RESULTS: National Voter Survey Total Sample Size: 2428, Margin of Error: ±2.0% Interview Dates: November 1-4, 2018 Language: English and Spanish Respondents: Likely November 2018 voters in 72 competitive
Methodology. 1 State benchmarks are from the American Community Survey Three Year averages
 The Choice is Yours Comparing Alternative Likely Voter Models within Probability and Non-Probability Samples By Robert Benford, Randall K Thomas, Jennifer Agiesta, Emily Swanson Likely voter models often
Alberta Carbon Levy and Rebate Program Lethbridge Public Opinion Study Winter 2018
 Alberta Carbon Levy and Rebate Program Lethbridge Public Opinion Study Winter 2018 2018 Lethbridge College Faron Ellis PhD, Research Chair Citizen Society Research Lab faron.ellis@lethbridgecollege.ca
An in-depth examination of North Carolina voter attitudes in important current issues. Registered Voters in North Carolina
 An in-depth examination of North Carolina voter attitudes in important current issues Registered Voters in North Carolina January 21-25, 2018 Table of Contents Key Survey Insights... 3 Satisfaction with
Preliminary Effects of Oversampling on the National Crime Victimization Survey
 Preliminary Effects of Oversampling on the National Crime Victimization Survey Katrina Washington, Barbara Blass and Karen King U.S. Census Bureau, Washington D.C. 20233 Note: This report is released to
The California Civic Engagement Project Issue Brief
 Increasing Proportions of Vote-by-Mail Ballots In Millions 14 12 10 8 6 4 2 0 1. VBM Use Rates by Sub-Group Youth and Older Voters: Disparities in VBM Use Only voters age 55 and older use VBM at a rate
Likely Iowa Caucus Voters Attitudes Toward Social Security
 Likely Iowa Caucus Voters Attitudes Toward Social Security Copyright 2016 AARP AARP Research 601 E Street NW Washington, DC 20049 Reprinting with Permission AARP is a nonprofit, nonpartisan organization,
The Employment of Low-Skilled Immigrant Men in the United States
 American Economic Review: Papers & Proceedings 2012, 102(3): 549 554 http://dx.doi.org/10.1257/aer.102.3.549 The Employment of Low-Skilled Immigrant Men in the United States By Brian Duncan and Stephen
The Partisan Effects of Voter Turnout
 The Partisan Effects of Voter Turnout Alexander Kendall March 29, 2004 1 The Problem According to the Washington Post, Republicans are urged to pray for poor weather on national election days, so that
REPORT TO PROPRIETARY RESULTS FROM THE 48 TH PAN ATLANTIC SMS GROUP. THE BENCHMARK OF MAINE PUBLIC OPINION Issued May, 2011
 REPORT TO PROPRIETARY RESULTS FROM THE 48 TH PAN ATLANTIC SMS GROUP OMNIBUS POLL THE BENCHMARK OF MAINE PUBLIC OPINION Issued May, 2011 5 Milk Street Portland, Maine 04101 Tel: (207) 871-8622 www.panatlanticsmsgroup.com
Secretary of Commerce
 January 19, 2018 MEMORANDUM FOR: Through: Wilbur L. Ross, Jr. Secretary of Commerce Karen Dunn Kelley Performing the Non-Exclusive Functions and Duties of the Deputy Secretary Ron S. Jarmin Performing
Experiments in Election Reform: Voter Perceptions of Campaigns Under Preferential and Plurality Voting
 Experiments in Election Reform: Voter Perceptions of Campaigns Under Preferential and Plurality Voting Caroline Tolbert, University of Iowa (caroline-tolbert@uiowa.edu) Collaborators: Todd Donovan, Western
FOR RELEASE APRIL 26, 2018
 FOR RELEASE APRIL 26, 2018 FOR MEDIA OR OTHER INQUIRIES: Carroll Doherty, Director of Political Research Jocelyn Kiley, Associate Director, Research Bridget Johnson, Communications Associate 202.419.4372
Evaluating Methods for Estimating Foreign-Born Immigration Using the American Community Survey
 Evaluating Methods for Estimating Foreign-Born Immigration Using the American Community Survey By C. Peter Borsella Eric B. Jensen Population Division U.S. Census Bureau Paper to be presented at the annual
Hispanic Attitudes on Economy and Global Warming June 2016
 Hispanic Attitudes on Economy and Global Warming June 2016 Final Results June May June M-M Y-Y 2016 2016 2015 Change Change Index of Consumer Sentiment 105.8 93.5 98.4 +12.3 +7.4 Current Economic Conditions
Partisan Advantage and Competitiveness in Illinois Redistricting
 Partisan Advantage and Competitiveness in Illinois Redistricting An Updated and Expanded Look By: Cynthia Canary & Kent Redfield June 2015 Using data from the 2014 legislative elections and digging deeper
NH Statewide Horserace Poll
 NH Statewide Horserace Poll NH Survey of Likely Voters October 26-28, 2016 N=408 Trump Leads Clinton in Final Stretch; New Hampshire U.S. Senate Race - Ayotte 49.1, Hassan 47 With just over a week to go
D A T A D I C T I O N A R Y D2 D A T A D I C T I O N A R Y
 DATA DICTIONARY i360 joined forces with Media Sales, a joint venture between DIRECTV and DISH, to provide voter behavior data to aligned campaigns and organizations. i360 s voter data has been pre-matched
The Future of Health Care after Repeal and Replace is Pulled: Millennials Speak Out about Health Care
 March 17 The Future of Health Care after Repeal and Replace is Pulled: Millennials Speak Out about Health Care A summary of key findings from the first-of-its-kind monthly survey of racially and ethnically
Clinton Leads by 13% in Michigan before Last Debate (Clinton 51% - Trump 38%- Johnson 6% - Stein 2%)
") P R E S S R E L E A S E FOR RELEASE: October 19, 2016 Contact: Steve Mitchell 248-891-2414 Clinton Leads by 13% in Michigan before Last Debate (Clinton 51% - Trump 38%- Johnson 6% - Stein 2%) EAST LANSING,
P R E S S R E L E A S E FOR RELEASE: October 19, 2016 Contact: Steve Mitchell 248-891-2414 Clinton Leads by 13% in Michigan before Last Debate (Clinton 51% - Trump 38%- Johnson 6% - Stein 2%) EAST LANSING,
 American democracy is challenged by large gaps in voter turnout by income, educational attainment, length of residency, age, ethnicity and other factors. Closing these gaps will require a sustained effort
Nevada Poll Results Tarkanian 39%, Heller 31% (31% undecided) 31% would renominate Heller (51% want someone else, 18% undecided)
 31% would renominate Heller (51% want someone else, 18% undecided)") Nevada Poll Results Tarkanian 39%, Heller 31% (31% undecided) 31% would renominate Heller (51% want someone else, 18% undecided) POLLING METHODOLOGY For this poll, a sample of likely Republican households
Nevada Poll Results Tarkanian 39%, Heller 31% (31% undecided) 31% would renominate Heller (51% want someone else, 18% undecided) POLLING METHODOLOGY For this poll, a sample of likely Republican households
Statewide Survey on Job Approval of President Donald Trump
 University of New Orleans ScholarWorks@UNO Survey Research Center Publications Survey Research Center (UNO Poll) 3-2017 Statewide Survey on Job Approval of President Donald Trump Edward Chervenak University
REPORT ON POLITICAL ATTITUDES & ENGAGEMENT
 THE TEXAS MEDIA &SOCIETY SURVEY REPORT ON POLITICAL ATTITUDES & ENGAGEMENT VS The Texas Media & Society Survey report on POLITICAL ATTITUDES & ENGAGEMENT Released October 27, 2016 Suggested citation: Texas
U.S. Catholics split between intent to vote for Kerry and Bush.
 The Center for Applied Research in the Apostolate Georgetown University Monday, April 12, 2004 U.S. Catholics split between intent to vote for Kerry and Bush. In an election year where the first Catholic
1 Year into the Trump Administration: Tools for the Resistance. 11:45-1:00 & 2:40-4:00, Room 320 Nathan Phillips, Nathaniel Stinnett
 1 Year into the Trump Administration: Tools for the Resistance 11:45-1:00 & 2:40-4:00, Room 320 Nathan Phillips, Nathaniel Stinnett Nathan Phillips Boston University Department of Earth & Environment The
Study Background. Part I. Voter Experience with Ballots, Precincts, and Poll Workers
 The 2006 New Mexico First Congressional District Registered Voter Election Administration Report Study Background August 11, 2007 Lonna Rae Atkeson University of New Mexico In 2006, the University of New
2018 Florida General Election Poll
 Florida Southern College Center for Polling and Policy Research 2018 Florida General Election Poll For media or other inquiries: Zachary Baumann, Ph.D. Assistant Professor of Political Science Director,
Engaging New Voters: The Impact of Nonprofit Voter Outreach on Client and Community Turnout
 Engaging New : The Impact of Voter Outreach on Client and Community Turnout www.nonprofitvote.org Executive Summary In the lead up to the 2014 general election, VOTE and its partners conducted a study