Are Republicans Sprawlers and Democrats New Urbanists? Understanding the Spatial Analysis of the 2004 Presidential Vote
|
|
|
- Arleen Austin
- 5 years ago
- Views:
Transcription
1 Are Republicans Sprawlers and Democrats New Urbanists? Understanding the Spatial Analysis of the 2004 Presidential Vote Stephen L. Sperry Associate Professor Clemson University Abstract After the 2004 Presidential Election, a perception with planners was that the voting pattern represented urban sprawl with little empirical research. The author used the 2004 Presidential Election results and 2000 Census data to examine the relationship between sprawl and the election winner by county. The study analyzed election results and compared it to the 83 metropolitan sprawling regions defined in the Measuring Sprawl and Its Impact study and the USDA urban/rural codes. The author provides a quantitative examination of how the population relates to political ties. The study evaluated whether the voting pattern of the Republican win had sprawl and exurban ties. The author used ArcGIS and its Spatial Statistics tools to assess the association of population density and metropolitan location to a county s political vote. The study found that election results were unrelated to the location of sprawl, but were significantly related to population density. Keyword: GIS; Voting Demographics, Census; Sustainable Development Planning, Change Analysis Introduction With the beginning of the millennium, the American media has become obsessed with the colors red and blue. Before the 2000 election, we rarely heard the terms "blue state" and "red state. According Geoffrey Nunberg, as late as 2000, the terms only appeared about a dozen times in major newspapers. They always were associated with stories about the presidential election. The 2000 presidential election gave rise to the terms. Starting in late 2003, these terms have appeared over 2500 times. We continue to use them even with the 2004 election settled (Nunberg, 2005). The media has a fixation on isolating political and social differences. Are there real differences or a contrived assessment? The media has used the terms to simply explain the culture wars and typecast our opinion based on where we live in this country. Are these terms becoming permanent fixtures of the American political lexicon alongside left and right or liberal and conservative? Has the media s analysis has become oversimplified, particularly since we can generate good visuals using these terms? The press tried to compartmentalize all voting decisions by polarizing the electorate into two culturally distinct groups. Respected journalists David Brooks of the New York Times and Ronald Brownstein of the Los Angeles Times used selective demographics to make their point about the election. They glossed over the different levels of political support throughout the country. Many academics have the same stereotype. Web posts by planning academicians on the Planet List Serve stated that Democratic votes are concentrated in the urban areas, while the Republicans strength is just in exurbia or rural areas of the country. Where was the 1
 with 583,774 votes. Houston was third giving Bush 580,553 votes. However, LA and Chicago each gave John Kerry over 700,000 more votes.")
2 largest concentration of votes for George Bush? Was it in Texas or the sprawling South? Is it surprising that it was Los Angeles County with 954,764 votes? His next largest area was Cook County (Chicago) with 583,774 votes. Houston was third giving Bush 580,553 votes. However, LA and Chicago each gave John Kerry over 700,000 more votes. In Houston, Kerry came within 100,000 votes of George Bush s total. Should Democrats be written off in the South and Republicans in the Northeast? Do we really have political segregation? If you used the typical vote graphics, you may assume we are segregated. GIS allows us to drill down and see different views. This paper discusses these presentation techniques and reviews how urban is the Democratic vote and suburban is the Republican vote. The Sea of Red and Cartographic Representations A typical election chloropleth map (see Figure1) was shown on TV stations during election night. November 2, 2004 was joy to Republicans. Unfortunately, mapping totals or absolute values per enumeration unit (e.g., individual votes by state) has been perplexing to nearly half of the electorate. Their concern was the overemphasis of red land mass verses actual votes. If the goal is to show thematically relevant information in an easily interpretive manner, this graphic does not work. Figure 1: 2004 Presidential Election by States Source: The states are unequal in area giving the reader a false impression of the mapped data distribution. People, not familiar with the U.S. voting system, might assume that President. George W. Bush won nearly two thirds of the U.S votes. However, the race was much closer. Bush did win 31 of the 51 states (which includes the District of Columbia), but only 286 of the 538 electoral votes (59,834,866 votes, or 51% of the popular vote). Senator John Kerry on the other hand triumphed only in 20 states, but he still received 252 of the electoral votes (56,373,514 votes, or 48% of the popular vote} (USA Today, 2004). While the state map bothered Democrats, the counties map of the vote appearing in USA Today and other newspapers was even worse. It emphasized the islands of blue in the sea 2
3 of red (see Figure 2). However, as pointed out by many others, this is misleading because it fails to take into account the fact that many of the red states have small populations, whereas most of the blue states have large populations but small land mass. The blue islands are small in area, but they are large in terms of votes, which is what matters in an election. By counties, the President s voting land mass was 81%, but it represented only 55% of the US population. On the internet, some creative cartography was created to show the truer vote distribution. Figure 2: 2004 Presidential Election by Counties Square miles of counties won Bush 2.54 million Kerry 592,000 Population (2003) of counties won Bush Kerry 159,2 million million Counties won by less than 5 percentage points Bush 164 Kerry 146 Note: County election data is not reported for Alaska, Source: the Associated Press, ESRI Inc. USATODAY analysis by Paul Overberg. Robert J. Vanderbei of Princeton University produced a map depicting the results by voting percentage (see Figure 3). The blue is for the Democrats, red is for the Republicans, and green is for all other. Each county's color is a mix of these three-color components (RGB) in proportion to the results for that county. The (48 contiguous) states of the country are colored red to purple or blue to purple indicating the voting percentage for George W. Bush and John F. Kerry respectively. It is difficult to discern the voting pattern and showing the actual population weight. 3

, New York County (Manhattan) with over 1.")
4 Figure 3: 2000 Presidential Election by Voting Percentage Source Robert Vanderbi, Princeton University At the University of Michigan, Michael Gastner, Cosma Shalizi, and Mark Newman tried to correct the voting proportion by making use of a cartogram, a map in which the sizes of counties have been rescaled according to their population. That is, counties are drawn with a size proportional to the number of their inhabitants not its acerage. Counties with more people appear larger than counties with fewer people. Thus, on the cartogram map (see Figure 4), New York County (Manhattan) with over 1.5 million inhabitants, appears about 42 times the size of Nye, Nevada, which has approximately 35,000 residents, even though it has 793 times the acreage of New York County. The cartogram reveals what we know already from the news: that the country was nearly evenly divided by the vote, rather than being dominated by one side or the other. While this type of graphic has generated a lot of talk, its usefulness is questionable. Locating areas and discerning a pattern are difficult. Figure 4: Cartogram of Voting Percentage Source: 4

5 Finally, ESRI made a 3D version of the county vote map for CBS News (see Figure 5). The column height represents the total number of voters. While the map helps to show the concentration of votes, it has a flaw: because the heights are proportional to total votes rather than votes per area or population density. This display approach makes it look like there are more people on the west coast than on the east coast, which is not the case. Figure 5: 3D Version of the 2004 Presidential Election by Counties Source: By devising with a more descriptive color ramp display at the county-level, an election map can go further describing the vote results. This image is more striking (see Figure 6). The map of the continental US counties has an RGB color ramp of red to warm gray for the Republican vote and blue to cool gray to indicate the Democratic vote. This map uses a color scale that ranges the shades of red for 70% Republican vote or shades of blue for 70% Democrat vote. Solid colors are used beyond this range. This color range makes it easier to understand the vote range and spatial pattern. It helps in showing the vote was not segregated as many in the media and academia assumed. This type of map address the sea of red isssue but still needs another display for population density. So, we are not purple states but shades of gray. The final county totals were difficult to map in the Northeast. The vote total came from USA Today s website. Extensive data manipulation had to be done in the New England states, because many vote totals were reported at the municipal level not the county level. 5

6 Figure 6: 2004 The Presidential Election by Voting Percentage. Population and Votes On the web, many people asked to see maps more reflective of the actual location of the population. For example, Clark County, Nevada is one of the fastest growing counties in the US. It is very large in land mass. Actually most residents are located within proximity of Las Vegas, which at a national scale is just a large dot. The method required merging the county vote results (see Figure 6) with population density (see Figure 7). Using census tract boundaries, the tract s population figures were multiplied by the candidates county vote percentages and divided by the tract land area to generate density figures. Theses densities were mapped to reflect the voting densities. This map still shows the county winners but now focuses on specifically where the county population is located. The color ramp reflects both the winning vote and where concentrations of voters actually occur (see Figure 8). The classification centers on a base data of less than two people per square mile. It shows dramatically, where most people live. The resulting map balances between accurate density equalization and readability. A brief analysis reveals the Republican voters dominate much more than a half of the country. This is a misleading finding, because the US population is not uniform. Much of the Republicans' dominance is in the large but relatively unpopulated states in the 6
, the red intensity of Republican county wins is significant.")
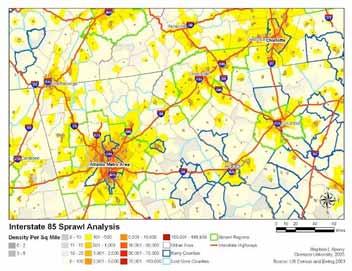
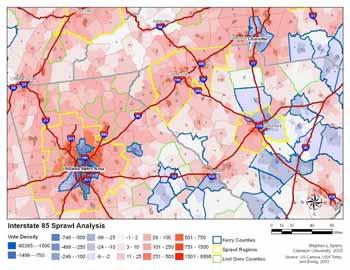
7 Midwest, Plain and Mountain States. On the other hand, the Democrats carried the more populous areas in the Northeast, the Great Lakes, and the West Coast. Applying the analysis to the Interstate 85 corridor between Atlanta and Charlotte (see Figure 9), the red intensity of Republican county wins is significant. It shows much of the land mass with over a 60 percent vote for George Bush. When population density is added to the mix, the red intensity is diluted to reflect the concentration of the population. Using the third image, the 2008 challenge is essentially around the metropolitan areas of Atlanta, Greenville and Charlotte. Several rural counties that went for Gore in 2000 may become available with the right candidate for the Democrats, or they may become even more of a Republican strong hold. The final analysis shows the new Republican South may offer the Democrats opportunities in 2008 that Kerry did not capture in Other looking at the analysis may conclude this area will continue the trend of expanding the Republican strong hold in the fast growing exurban areas. Either way the battle will be in the metropolitan areas. Figure 7: 2000 Population Density 7

8 Figure 8: 2004 Election by Population Density and Voting Percentage. 8

9 Figure 9: Interstate 85 Corridor Vote Analysis 9

10 As a final analysis, each party s density was mapped separately (see Figures 10 and 11). The seven vote density classes were based on quantile breaks of the Republican vote and were rounded up. The Democratic vote used the same class breaks. The difference is that the density range is higher in the last Democratic class, 139,552 verses 49,287. In comparing the maps, the vote concentrations are similar between the parties but more spread out from the urban cores for the Republicans. The exception is the southern concentration of votes centering on the Appalachian Mountain region with its small cities and expanding to the more metropolitan areas of North Carolina, Tennessee, South Carolina, Georgia and Alabama. The urban centers did generate greater Democratic votes while the urban fringe appears to be Republican territory. While there is a difference in the concentrations for either party s supporters when looking at vote distribution they are similar. Figure 10: Republican Vote Density 10
11 Figure 11: Democratic Vote Density Sprawl Analysis The Spatial Distribution of Bush's Vote Between 2000 and 2004, there was a net shift of about 4 million votes in Bush's direction (USA Today, 2004). The analysis shows that Bush made gains across the board when you examine counties sorted into nine categories, going from most urban to most rural. This analysis uses the rural-urban continuum codes developed by Calvin Beale of the USDA's Economic Research Service (ERS). The study also compares the vote in the top 83 sprawl regions as defined by Reid Ewing and others in the report Measuring Sprawl and Its Impacts (Ewing, 2003). The 2003 rural-urban continuum codes form a classification scheme that categorizes metropolitan counties by size and non-metropolitan counties by degree of urbanization and proximity to metro areas (see Figure 12 and Table 1). ERS developed the classifications to measure rural characteristics and assess the economic and social diversity of rural America. The rural-urban continuum codes are used to classify counties, census tracts, and ZIP codes by the different rural codes. These codes classify rural counties by their economic and policy types. 11
12 The standard Office of Management and Budget (OMB) metro and non-metro categories have been subdivided into three metro and six non-metro categories, resulting in the 9- part county codification. This scheme was originally developed in The codes were updated in 1983 and 1993, and This scheme allows researchers to break county data into finer residential groups, beyond metro and non-metro, particularly for the analysis of trends in non-metro areas that are related to population density and metro influence. The versions based on the 1970, 1980, 1990 and 2000 Censuses are found on the ERS website. (Economic Research Service, 2004) The classifications starts with the highest urban concentration (see Table 2). They are the central counties of large (one million or more) metro areas. This class represents 53% of the US population. These urban areas have the highest population density and the highest median income of the nine categories. It also represents over 50% of the 2004 vote. Bush received over 46% of his total vote in this category while John Kerry received nearly 57% of his vote. The metro counties (the top three categories) accounted for 82% of the nation vote. Bush received 79% his vote there while Kerry got 85% of his total votes in these three urban classes. Kerry had nearly a 600,000 vote margin over t his Republican rival. Bush, however, won eight of the nine categories except in the most urban category. His vote margin percentage increased as a category became more rural from 46.5% to 62.8%. Within the 83 sprawl regions (which accounts for over 50% of the nation s population), the voting was better for Kerry (see Table 3). The top three categories accounted for over 98% of the vote for each candidate. In the top three categories, Kerry s margin was over 4,200,000 votes. Within the 83 regions, there are only six of the nine categories. Bush carried five of the six categories but with closer margins than the country vote outside the sprawl regions. Within these regions, John Kerry received over 3,100,000 more votes than George Bush. In fringe or exurban counties of these large metro areas, Bush improved his winning margin. Because these exurban areas contain far fewer people than the central counties, Bush received only 8% of his vote from these counties. More important to Bush's vote gains were the medium-sized metro areas (250,000 to a million in population) and the counties in the metro area with less than 250,000, where he had his largest vote margin over Kerry. Bush received over 32 percent of his net vote gain from the medium-sized metro areas counties. In these smaller metro areas, Bush received over 3,500,000 more votes than Kerry. In the 83 sprawl regions, Bush s margin was over 1,500,000 votes Turning to non-metro counties or rural, these categories have urban concentrations that range from a high of 20,000 to a low of fewer than 2,500 people. Bush did the best in non-metro counties that are adjacent to a metro area and have an urban population of between 2,500 and 20,000. Nationally his vote percentage was over 60%. In the sprawl regions, those percentages were similar. Nationally, the Republican concentration is in the urban area of less than one million people. It accounted for 79% of their vote margin. On the other hand in the 83 sprawl regions, Bush s most successful region was the urban population of 250,000 or more, adjacent to a metro area. Bush beat Kerry by over one million votes. Finally, other than 12

13 the most urban concentration, the vote percentage were with one to two percentage points showing that both candidates can attract votes in each of the nine code classes. Contrary to the media portrayal, we are not segregating into common camps. We are more diversified than the press wants to believe. Figure 12: USDA Urban Rural Codes Table 1: National Metropolitan Analysis Description Number of Counties 2000 Population Population Percentage Population Per Square Mile Median Income Poverty Percentage College Degree Percentage Code Total Area Metro counties: 1 Counties in metro areas of 1 million population or more , ,224, % $ 47, % 15.1% 2 Counties in metro areas of 250,000 to 1 million population ,065 55,514, % $ 39, % 12.7% 3 Counties in metro areas of fewer than 250,000 population ,380 27,841, % 85.0 $ 36, % 11.6% Nonmetro counties: 4 Urban population of 20,000 or more, adjacent to a metro area ,984 14,442, % 63.3 $ 35, % 10.5% 5 Urban population of 20,000 or more, not adjacent to a metro area ,541 5,573, % 34.1 $ 34, % 12.2% 6 Urban population of 2,500 to 19,999, adjacent to a metro area ,877 15,134, % 27.5 $ 32, % 8.5% 7 Urban population of 2,500 to 19,999, not adjacent to a metro area ,012 8,463, % 10.8 $ 32, % 9.8% 8 Completely rural or less than 2,500 urban population, adjacent to a metro area ,751 2,425, % 6.3 $ 31, % 8.8% 9 Completely rural or less than 2,500 urban population, not adjacent to a metro area ,761 2,802, % 5.0 $ 30, % 9.8% Total/Average 3,141 3,593, ,421, % 78.3 $ 35, % 10.8% 13
14 Table 2: National Metropolitan Vote Analysis Description Code Metro counties: Number of Counties Bush Votes Kerry Votes Nader Votes Bush Margin Bush Percentage Percent of Bush's Total Vote Percent of Kerry's Total Vote Percent of Total Vote 1 Counties in metro areas of 1 million population or more ,736,596 31,816, ,972 (4,080,101) 46.4% 46.5% 56.7% 51.4% 2 Counties in metro areas of 250,000 to 1 million population ,450,410 10,924,349 87,780 1,526, % 20.9% 19.5% 20.2% 3 Counties in metro areas of fewer than 250,000 population 351 6,934,487 4,979,517 47,440 1,954, % 11.6% 8.9% 10.3% Nonmetro counties: 4 Urban population of 20,000 or more, adjacent to a metro area 218 3,607,318 2,522,126 22,918 1,085, % 6.0% 4.5% 5.3% 5 Urban population of 20,000 or more, not adjacent to a metro area 105 1,336, ,734 11, , % 2.2% 1.7% 2.0% 6 Urban population of 2,500 to 19,999, adjacent to a metro area 609 3,837,788 2,500,736 23,150 1,337, % 6.4% 4.5% 5.5% 7 Urban population of 2,500 to 19,999, not adjacent to a metro area 450 2,162,112 1,408,603 16, , % 3.6% 2.5% 3.1% 8 Completely rural or less than 2,500 urban population, adjacent to a metro area , ,055 4, , % 1.1% 0.8% 1.0% 9 Completely rural or less than 2,500 urban population, not adjacent to a metro area , ,950 10, , % 1.6% 1.0% 1.3% - Total/Average 3,141 59,696,762 56,137, ,832 3,558, % 100.0% 100.0% 100.0% Tables 3: Sprawl Regions Analysis Description Code Metro counties: Number of Counties Total Area 2000 Population Population Per Square Mile Bush Votes Kerry Votes Nader Votes Bush Margin Bush Percentage Percent of Bush's Total Vote Percent of Kerry's Total Vote 1 Counties in metro areas of 1 million population or more , ,389, ,949,259 30,529, ,083 (4,580,275) 45.8% 81.1% 84.6% 82.9% 2 Counties in metro areas of 250,000 to 1 million population 88 78,021 24,105, ,108,793 4,871,816 42, , % 16.0% 13.5% 14.7% 3 Counties in metro areas of fewer than 250,000 population 16 13,507 2,469, , ,878 5, , % 1.9% 1.4% 1.6% Nonmetro counties: 4 Urban population of 20,000 or more, adjacent to a metro area 14 21,377 1,176, , ,492 2, , % 0.9% 0.5% 0.7% 5 Urban population of 20,000 or more, not adjacent to a metro area 0.0% 0.0% 0.0% 6 Urban population of 2,500 to 19,999, adjacent to a metro area 3 18,799 87, ,678 17, , % 0.1% 0.0% 0.1% 7 Urban population of 2,500 to 19,999, not adjacent to a metro area 0.0% 0.0% 0.0% 8 Completely rural or less than 2,500 urban population, adjacent to a metro area , ,144 2,739-2, % 0.0% 0.0% 0.0% 9 Completely rural or less than 2,500 urban population, not adjacent to a metro area 0.0% 0.0% 0.0% - Total/Average , ,246, ,002,662 36,104, ,748 (4,102,044) 46.8% 100.0% 100.0% 100.0% Percent of Total Vote Conclusion The Roads to the Vote In this paper a general method for constructing density-equalizing vote display, provides an invaluable tool for the presentation and analysis of political demographic data. The method allows for an easier understanding of the voter pattern in the US. It shows where the votes were concentrated. The technique generates more accurate and readable maps. The method allows people to see the balance between good density equalization and voter spatial patterns. The approach may help the media to convey voting analysis. Does the analysis in the media justify the somewhat extravagant claims of polarization? When comparing the Republican and Democratic vote density maps (Figures 10 and 11), the country is not polarized into two camps. In fact, it appears to be a very diverse country. Your neighbor may have voted for the other candidate. Are Republican 14

15 Sprawlers? The answer is yes and no. In the analysis, the exurbs, defined as fringe counties of large metropolitan areas, contributed to Bush's gain in However, do not forget how many votes he received in Los Angeles and Chicago. The Democratic concentration is in the most urban areas, but they also are within one to two percentage points of the Republicans distribution in the other eight categories. The only consistent thread is in every one of the nine rural-urban continuum codes the Democratic demographics showed a higher population density than Republicans. So while the Democrats maybe Urbanists they have many of the same economic and social desires as Republicans. They just voted for a different candidate. In the final analysis, it looks like Bush's victory was mostly attributable to modest, but broad-based, gains across every region of the country including the cities. The vote does not reflect any particular flavor of county. This may not follow the media s storyline but in the end, Democrats are proportionally within one to two percentage points of Republicans each of the rural-urban codes. Therefore, both parties have Sprawlers and New Urbanists. So if you are Ken Mehlman or Howard Dean in planning the 2008 election, just follow the roads and do not give up on any part of the country. Figure 13: 2004 Voting Density and Major Highways 15
16 References Ewing, Reid, Pendall, Rolf, and Chen, Don. Measuring Sprawl and Its Impact, Smart Growth America, Nunberg, Geoffrey, Color Wars, Fresh Air" commentary on National Public Radio, May 18, 2005 Rural-urban Continuum Codes: USA Today Vote Analysis: Author Information Stephen L. Sperry Associate Professor Clemson University Department of Planning and Landscape Architecture 121 Lee Hall, Box Clemson, SC Phone: Fax:
Are Republicans Sprawlers and Democrats New Urbanists? Comparing 83 Sprawling Regions with the 2004 Presidential Vote
 Are Republicans Sprawlers and Democrats New Urbanists? Comparing 83 Sprawling Regions with the 2004 Presidential Vote Stephen L. Sperry Associate Professor Clemson University College of Architecture, Arts
Inside the Ballot Box
 University at Buffalo Regional Institute POLICY BRIEF March 2009 How did the region vote? Did our voting habits change in 2008? Who voted for whom?, 0 8 Inside the Ballot Box The 2008 presidential election
Shifting Political Landscape Impacts San Diego City Mayoral Election
 Shifting Political Landscape Impacts San Diego City Mayoral Election Executive Summary The November 2012 election brought a sea change to San Diego City Hall, as the first Democratic mayor in more than
Why The National Popular Vote Bill Is Not A Good Choice
 Why The National Popular Vote Bill Is Not A Good Choice A quick look at the National Popular Vote (NPV) approach gives the impression that it promises a much better result in the Electoral College process.
Rural Sprawl in Metropolitan Portland
 Rural Sprawl in Metropolitan Portland A comparison of growth management in Oregon and Washington Clark Williams-Derry July 2012 As a single metropolis split between two states, greater Portland, Oregon,
PRESENT TRENDS IN POPULATION DISTRIBUTION
 PRESENT TRENDS IN POPULATION DISTRIBUTION Conrad Taeuber Associate Director, Bureau of the Census U.S. Department of Commerce Our population has recently crossed the 200 million mark, and we are currently
News Letter. Visualizing Virginia s Changing Electorate: Mapping Presidential Elections from 2000 to 2012 * The Virginia
 Vol. 89 No. 2 May 2013 The Virginia News Letter Visualizing Virginia s Changing Electorate: Mapping Presidential Elections from 2000 to 2012 * by Stephen Hanna and Stephen J. Farnsworth Introduction In
3Demographic Drivers. The State of the Nation s Housing 2007
 3Demographic Drivers The demographic underpinnings of long-run housing demand remain solid. Net household growth should climb from an average 1.26 million annual pace in 1995 25 to 1.46 million in 25 215.
2010 CENSUS POPULATION REAPPORTIONMENT DATA
 Southern Tier East Census Monograph Series Report 11-1 January 2011 2010 CENSUS POPULATION REAPPORTIONMENT DATA The United States Constitution, Article 1, Section 2, requires a decennial census for the
- Bill Bishop, The Big Sort: Why the Clustering of Like-Minded America is Tearing Us Apart, 2008.
 Document 1: America may be more diverse than ever coast to coast, but the places where we live are becoming increasingly crowded with people who live, think and vote like we do. This transformation didn
Regional Total Population: 2,780,873. Regional Low Income Population: 642,140. Regional Nonwhite Population: 1,166,442
 BALTIMORE REGION Neighborhood change in Baltimore is marked by a major city suburban divide, reflecting its long and troubled history of racial segregation. In the suburbs, only about one in six residents
Swing Voters in Swing States Troubled By Iraq, Economy; Unimpressed With Bush and Kerry, Annenberg Data Show
 DATE: June 4, 2004 CONTACT: Adam Clymer at 202-879-6757 or 202 549-7161 (cell) VISIT: www.naes04.org Swing Voters in Swing States Troubled By Iraq, Economy; Unimpressed With Bush and Kerry, Annenberg Data
In the Margins Political Victory in the Context of Technology Error, Residual Votes, and Incident Reports in 2004
 In the Margins Political Victory in the Context of Technology Error, Residual Votes, and Incident Reports in 2004 Dr. Philip N. Howard Assistant Professor, Department of Communication University of Washington
Minority Suburbanization and Racial Change
 University of Minnesota Law School Scholarship Repository Studies Institute on Metropolitan Opportunity 2006 Minority Suburbanization and Racial Change Institute on Metropolitan Opportunity University
By David Lauter. 1 of 5 12/12/2016 9:39 AM
 Clinton won as many votes as Obama in 2012 just not in the states wher... 1 of 5 12/12/2016 9:39 AM Hillary Clinton won the popular vote by at least 2.8 million, according to a final tally. The result
2008 Electoral Vote Preliminary Preview
 2008 Electoral Vote Preliminary Preview ʺIn Clinton, the superdelegates have a candidate who fits their recent mold and the last two elections have been very close. This year is a bad year for Republicans.
BUFFALO REGION. NET DISPLACEMENT (Low-Income Change in Tracts with Strong Expansion, )
") BUFFALO REGION Poverty concentration and neighborhood abandonment are commonplace in the Buffalo region, while economic growth and displacement are rare. Regionally, about 3 percent of residents live in
BUFFALO REGION Poverty concentration and neighborhood abandonment are commonplace in the Buffalo region, while economic growth and displacement are rare. Regionally, about 3 percent of residents live in
Copyrighted Material CHAPTER 1. Introduction
 CHAPTER 1 Introduction OK, but here s the fact that nobody ever, ever mentions Democrats win rich people. Over $100,000 in income, you are likely more than not to vote for Democrats. People never point
Megapolitan America. Luck Stone Corporation
 Megapolitan America Luck Stone Corporation Historical World Population Growth World population continually increases. With current world population over 6 billion (6,590,514,881 and counting) people, there
Marist College Institute for Public Opinion Poughkeepsie, NY Phone Fax
 Marist College Institute for Public Opinion Poughkeepsie, NY 12601 Phone 845.575.5050 Fax 845.575.5111 www.maristpoll.marist.edu National Poll: The Candidates and the Campaign 2004 FOR IMMEDIATE RELEASE:
To understand the U.S. electoral college and, more generally, American democracy, it is critical to understand that when voters go to the polls on
 To understand the U.S. electoral college and, more generally, American democracy, it is critical to understand that when voters go to the polls on Tuesday, November 8th, they are not voting together in
Integrating Latino Immigrants in New Rural Destinations. Movement to Rural Areas
 ISSUE BRIEF T I M E L Y I N F O R M A T I O N F R O M M A T H E M A T I C A Mathematica strives to improve public well-being by bringing the highest standards of quality, objectivity, and excellence to
are receiving more funding than they should. Funds must be reallocated, zoning ordinances must be modified, train lines need to be laid, and new
 Suburban Poverty A hut standing before long rows of cotton fields at the edge of a road in the Mississippi Delta; a shack balanced precariously on a mountainside in Appalachia; a high rise catacomb in
Community Well-Being and the Great Recession
 Pathways Spring 2013 3 Community Well-Being and the Great Recession by Ann Owens and Robert J. Sampson The effects of the Great Recession on individuals and workers are well studied. Many reports document
Gentrification is rare in the Orlando region, while a moderate number of neighborhoods are strongly declining.
 ORLANDO REGION Gentrification is rare in the Orlando region, while a moderate number of neighborhoods are strongly declining. One in four regional residents live in an area that experienced strong decline
Deficiencies in the Internet Mass Media. Visualization of U.S. Election Results
 Deficiencies in the Internet Mass Media Visualization of U.S. Election Results Soon Tee Teoh Department of Computer Science, San Jose State University San Jose, California, USA Abstract - People are increasingly
SECTION TWO: REGIONAL POVERTY TRENDS
 SECTION TWO: REGIONAL POVERTY TRENDS Metropolitan Council Choice, Place and Opportunity: An Equity Assessment of the Twin Cities Region Section 2 The changing face of poverty Ebbs and flows in the performance
Electing our President with National Popular Vote
 Electing our President with National Popular Vote The current system for electing our president no longer serves America well. Four times in our history, the candidate who placed second in the popular
The Case of the Disappearing Bias: A 2014 Update to the Gerrymandering or Geography Debate
 The Case of the Disappearing Bias: A 2014 Update to the Gerrymandering or Geography Debate Nicholas Goedert Lafayette College goedertn@lafayette.edu May, 2015 ABSTRACT: This note observes that the pro-republican
For each of the 50 states, we ask a
 state of states 30 head Spatial Segregation The Stanford Center on Poverty and Inequality By Daniel T. Lichter, Domenico Parisi, and Michael C. Taquino Key findings There is extreme racial segregation
Refugee Resettlement in Small Cities Reports
 The University of Vermont PR3: Refugee Resettlement Trends in the Southeast REPORT Pablo Bose & Lucas Grigri Photo Credit: L. Grigri Published April 2018 in Burlington, VT Refugee Resettlement in Small
Statistics, Politics, and Policy
 Statistics, Politics, and Policy Volume 1, Issue 1 2010 Article 3 A Snapshot of the 2008 Election Andrew Gelman, Columbia University Daniel Lee, Columbia University Yair Ghitza, Columbia University Recommended
Places in Need: The Geography of Poverty and the American Safety Net
 Places in Need: The Geography of Poverty and the American Safety Net Scott W. Allard Professor, Evans School of Public Affairs University of Washington Nonresident Fellow, Brookings Institution Co Director,
Campaign Strategy Script
 Campaign Strategy Script SHOT / TITLE DESCRIPTION 1. 00:00 Animated Open Animated Open 2. 00:07 Stacey on the street STACEY ON CAMERA: HI, I M STACEY DELIKAT. IN THE FINAL WEEKS LEADING UP TO THE ELECTIONS,
New Progressive America
 AP Photo/Bob Bird New Progressive America Twenty Years of Demographic, Geographic, and Attitudinal Changes Across the Country Herald a New Progressive Majority Ruy Teixeira March 2009 www.americanprogress.org
Test-Taking Strategies and Practice
 Test-Taking Strategies and Practice You can improve your test-taking skills by practicing the strategies discussed in this section. First, read the tips in the left-hand column. Then apply them to the
The twentieth-century reversal: How did the Republican states switch to the Democrats and vice versa? 1. Andrew Gelman.
 The twentieth-century reversal: How did the Republican states switch to the Democrats and vice versa? 1 Andrew Gelman 29 June 2013 The familiar U.S. electoral map with the Democrats winning in the northeast,
Is Life Better in America s Red States?
 SundayReview Opinion Is Life Better in America s Red States? By RICHARD FLORIDA JAN. 3, 2015 THE new Congress that starts work this week is the latest reminder of America s stark political divisions: The
Introduction to the declination function for gerrymanders
 Introduction to the declination function for gerrymanders Gregory S. Warrington Department of Mathematics & Statistics, University of Vermont, 16 Colchester Ave., Burlington, VT 05401, USA November 4,
Asian American Survey
 Asian American Survey Findings from a Survey of 700 Asian American Voters nationwide plus 100 each in FL, IL, NV, and VA Celinda Lake, David Mermin, and Shilpa Grover Lake Research Partners Washington,
THE EFFECT OF EARLY VOTING AND THE LENGTH OF EARLY VOTING ON VOTER TURNOUT
 THE EFFECT OF EARLY VOTING AND THE LENGTH OF EARLY VOTING ON VOTER TURNOUT Simona Altshuler University of Florida Email: simonaalt@ufl.edu Advisor: Dr. Lawrence Kenny Abstract This paper explores the effects
AUGUST 2014 TOPLINE RESULTS
 AUGUST 2014 TOPLINE RESULTS RELEASED: AUGUST 19th 2014 The Reason-Rupe August 2014 Poll interviewed 1,000 adults on both mobile (500) and landline (500) phones, including 291 respondents without landlines,
Population Vitality Overview
 8 Population Vitality Overview Population Vitality Overview The Population Vitality section covers information on total population, migration, age, household size, and race. In particular, the Population
Elections Alberta Survey of Voters and Non-Voters
 Elections Alberta Survey of Voters and Non-Voters RESEARCH REPORT July 17, 2008 460, 10055 106 St, Edmonton, Alberta T5J 2Y2 Tel: 780.423.0708 Fax: 780.425.0400 www.legermarketing.com 1 SUMMARY AND CONCLUSIONS
ELECTION OVERVIEW. + Context: Mood of the Electorate. + Election Results: Why did it happen? + The Future: What does it mean going forward?
 1 ELECTION OVERVIEW + Context: Mood of the Electorate + Election Results: Why did it happen? + The Future: What does it mean going forward? + Appendix: Polling Post-Mortem 2 2 INITIAL HEADLINES + Things
Behind Kerry s New Hampshire Win: Broad Base, Moderate Image, Electability
 ABC NEWS EXIT POLL ANALYSIS: THE NEW HAMPSHIRE PRIMARY FOR IMMEDIATE RELEASE 1/27/04 Behind Kerry s New Hampshire Win: Broad Base, Moderate Image, Electability A broad base on issues, a moderate image
THE PRESIDENTIAL RACE: MIDSUMMER July 7-14, 2008
 CBS NEWS/NEW YORK TIMES POLL For release: Tuesday July 15, 2008 6:30 P.M. EDT THE PRESIDENTIAL RACE: MIDSUMMER July 7-14, 2008 Democrat Barack Obama now holds a six-point edge over his Republican rival
HOUSTON REGION. NET DISPLACEMENT (Low-Income Change in Tracts with Strong Expansion, )
") HOUSTON REGION The Houston region has undergone significant population growth since 2000. About 13 percent of regional population lives in a census tract that has undergone strong economic expansion, while
HOUSTON REGION The Houston region has undergone significant population growth since 2000. About 13 percent of regional population lives in a census tract that has undergone strong economic expansion, while
The Brookings Institution Metropolitan Policy Program Robert Puentes, Fellow
 The Brookings Institution Metropolitan Policy Program Robert Puentes, Fellow Of First Burbs and Boom Burbs: Dealing with Suburban Transition in the 21st Century City of Plano, TX Annual Retreat October
Recent Demographic Trends in Nonmetropolitan America: First Evidence from the 2010 Census Executive Summary
 Recent Demographic Trends in Nonmetropolitan America: First Evidence from the 2010 Census Executive Summary Kenneth M. Johnson Department of Sociology and Carsey Institute University of New Hampshire This
U.S. Catholics split between intent to vote for Kerry and Bush.
 The Center for Applied Research in the Apostolate Georgetown University Monday, April 12, 2004 U.S. Catholics split between intent to vote for Kerry and Bush. In an election year where the first Catholic
8AMBER WAVES VOLUME 2 ISSUE 3
 8AMBER WAVES VOLUME 2 ISSUE 3 F E A T U R E William Kandel, USDA/ERS ECONOMIC RESEARCH SERVICE/USDA Rural s Employment and Residential Trends William Kandel wkandel@ers.usda.gov Constance Newman cnewman@ers.usda.gov
Growth Leads to Transformation
 Growth Leads to Transformation Florida attracted newcomers for a variety of reasons. Some wanted to escape cold weather (retirees). Others, primarily from abroad, came in search of political freedom or
Mid Term Elections 2018
 Mid Term Elections 2018 Elections require long and costly preparation. Because of this, extensive planning is required to designate where to geographically campaign based on variables of voter interest.
The Brookings Institution Metropolitan Policy Program Robert Puentes, Fellow
 The Brookings Institution Metropolitan Policy Program Robert Puentes, Fellow Caution: Challenges Ahead A Review of New Urban Demographics and Impacts on Transportation Eno Foundation Forum on the Future
The sustained negative mood of the country drove voter attitudes.
 3 The sustained negative mood of the country drove voter attitudes. Last Time Mood Was Positive: 154 Months Ago 01/2004: 47% RD 43% WT The Mood of the Country Rasmussen Reports 11/20 11/22: 30% - 58% The
From Straw Polls to Scientific Sampling: The Evolution of Opinion Polling
 Measuring Public Opinion (HA) In 1936, in the depths of the Great Depression, Literary Digest announced that Alfred Landon would decisively defeat Franklin Roosevelt in the upcoming presidential election.
Partisan Advantage and Competitiveness in Illinois Redistricting
 Partisan Advantage and Competitiveness in Illinois Redistricting An Updated and Expanded Look By: Cynthia Canary & Kent Redfield June 2015 Using data from the 2014 legislative elections and digging deeper
Racial integration between black and white people is at highest level for a century, new U.S. census reveals
 Thursday, Dec 16 2010 Racial integration between black and white people is at highest level for a century, new U.S. census reveals By Daily Mail Reporter Last updated at 1:11 PM on 16th December 2010 But
Immigrant Incorporation and Local Responses
 Audrey Singer Senior Fellow Immigrant Incorporation and Local Responses American Sociological Association San Francisco, CA August 9, 2009 Questions --- Exploration How do we evaluate recent state and
Key Factors That Shaped 2018 And A Brief Look Ahead
 Key Factors That Shaped 2018 And A Brief Look Ahead November 2018 Bill McInturff SLIDE 1 Yes, it was all about Trump. SLIDE 2 A midterm record said their vote was a message of support or opposition to
The Next Swing Region: Reapportionment and Redistricting in the Intermountain West
 The Next Swing Region: Reapportionment and Redistricting in the Intermountain West David F. Damore Associate Professor of Political Science University of Nevada, Las Vegas Nonresident Senior Fellow Brookings
Chapter 1: The Demographics of McLennan County
 Chapter 1: The Demographics of McLennan County General Population Since 2000, the Texas population has grown by more than 2.7 million residents (approximately 15%), bringing the total population of the
The Electoral College. What is it?, how does it work?, the pros, and the cons
 The Electoral College What is it?, how does it work?, the pros, and the cons What is the Electoral College? n E lec tor al College- A body of electors chosen to elect the President and Vice President of
American Cancer Society Cancer Action Network, November
 American Cancer Society Cancer Action Network, November 2018 1 To: American Cancer Society Cancer Action Network Fr: Lake Research Partners and the Tarrance Group Re: Election Eve/Night Survey i Date:
Electing a President. The Electoral College
 Electing a President The Electoral College The Original Electoral College System Compromise between allowing Congress to choose a chief executive and direct popular election -Allowing Congress goes against
IV. Residential Segregation 1
 IV. Residential Segregation 1 Any thorough study of impediments to fair housing choice must include an analysis of where different types of people live. While the description of past and present patterns
The Brookings Institution Metropolitan Policy Program Robert Puentes, Fellow
 The Brookings Institution Metropolitan Policy Program Robert Puentes, Fellow A Review of New Urban Demographics and Impacts on Housing National Multi Housing Council Research Forum March 26, 2007 St. Louis,
Chapter 7. Migration
 Chapter 7 Migration Chapter 7 Migration Americans have traditionally been highly higher levels of educational attainment than Figure 7-1. mobile, with nearly 1 in 7 people changing residence each year.
A PRIMER ON UNITED STATES VOTING BEHAVIOR
 BOB LOEVY Department Of Political Science at Colorado College A PRIMER ON UNITED STATES VOTING BEHAVIOR Based on the Statewide Partisan Average (SPA) 1 THE STATEWIDE PARTISAN AVERAGE Measures Democratic
Issue Overview: How the U.S. elects its presidents
 Issue Overview: How the U.S. elects its presidents By Bloomberg, adapted by Newsela staff on 09.27.16 Word Count 660 TOP: Voters head to the polls on Super Tuesday during the primaries. Photo by Alex Wong.
Asian American Survey
 Asian American Survey Findings from a Survey of 700 Asian American Voters nationwide plus 100 each in FL, NV, VA, and IL Celinda Lake, David Mermin, and Shilpa Grover Lake Research Partners Washington,
Testimony of FairVote The Center for Voting and Democracy Jack Santucci, Program for Representative Government. October 16, 2006
 Testimony of FairVote The Center for Voting and Democracy Jack Santucci, Program for Representative Government Given in writing to the Assembly Standing Committee on Governmental Operations and Assembly
Designing Weighted Voting Games to Proportionality
 Designing Weighted Voting Games to Proportionality In the analysis of weighted voting a scheme may be constructed which apportions at least one vote, per-representative units. The numbers of weighted votes
even mix of Democrats and Republicans, Florida is often referred to as a swing state. A swing state is a
 As a presidential candidate, the most appealing states in which to focus a campaign would be those with the most electoral votes and a history of voting for their respective political parties. With an
News English.com Ready-to-use ESL / EFL Lessons
 www.breaking News English.com Ready-to-use ESL / EFL Lessons The Breaking News English.com Resource Book 1,000 Ideas & Activities For Language Teachers http://www.breakingnewsenglish.com/book.html Hillary
STATISTICAL GRAPHICS FOR VISUALIZING DATA
 STATISTICAL GRAPHICS FOR VISUALIZING DATA Tables and Figures, I William G. Jacoby Michigan State University and ICPSR University of Illinois at Chicago October 14-15, 21 http://polisci.msu.edu/jacoby/uic/graphics
Percentages of Support for Hillary Clinton by Party ID
 Executive Summary The Meredith College Poll asked questions about North Carolinians views of as political leaders and whether they would vote for Hillary Clinton if she ran for president. The questions
LIFE IN RURAL AMERICA
 LIFE IN RURAL AMERICA October 2018 0 REPORT SUMMARY Survey Background This Life in Rural America report is based on a survey conducted for National Public Radio, the Robert Wood Johnson Foundation, and
Who Runs the States?
 Who Runs the States? An in-depth look at historical state partisan control and quality of life indices Part 1: Partisanship of the 50 states between 1992-2013 By Geoff Pallay May 2013 1 Table of Contents
Political Parties. Chapter 9
 Political Parties Chapter 9 Political Parties What Are Political Parties? Political parties: organized groups that attempt to influence the government by electing their members to local, state, and national
THE CALIFORNIA LEGISLATURE: SOME FACTS AND FIGURES. by Andrew L. Roth
 THE CALIFORNIA LEGISLATURE: SOME FACTS AND FIGURES by Andrew L. Roth INTRODUCTION The following pages provide a statistical profile of California's state legislature. The data are intended to suggest who
Arizona Gains Rhode Island s Seat With New 2018 Census Estimates; But Greater Change Likely by 2020
 FOR IMMEDIATE RELEASE Date: December19, 2018 Contact: Kimball W. Brace Tel.: (202) 789 2004 or (703) 580-7267 Email: kbrace@electiondataservices.com Website: www.electiondataservices.com Arizona Gains
Chapter 8: Mass Media and Public Opinion Section 1 Objectives Key Terms public affairs: public opinion: mass media: peer group: opinion leader:
 Chapter 8: Mass Media and Public Opinion Section 1 Objectives Examine the term public opinion and understand why it is so difficult to define. Analyze how family and education help shape public opinion.
Part 1: Focus on Income. Inequality. EMBARGOED until 5/28/14. indicator definitions and Rankings
 Part 1: Focus on Income indicator definitions and Rankings Inequality STATE OF NEW YORK CITY S HOUSING & NEIGHBORHOODS IN 2013 7 Focus on Income Inequality New York City has seen rising levels of income
Bush 2004 Gains among Hispanics Strongest with Men, And in South and Northeast, Annenberg Data Show
 FOR IMMEDIATE RELEASE DATE: December 21, 2004 CONTACT: Adam Clymer at 202-879-6757 or 202 549-7161 (cell) VISIT: www.naes04.org Bush 2004 Gains among Hispanics Strongest with Men, And in South and Northeast,
Rock the Vote September Democratic Strategic Analysis by Celinda Lake, Joshua E. Ulibarri, and Karen M. Emmerson
 Rock the Vote September 2008 Democratic Strategic Analysis by Celinda Lake, Joshua E. Ulibarri, and Karen M. Emmerson Rock the Vote s second Battleground poll shows that young people want change and believe
CHOICES The magazine of food, farm and resource issues
 CHOICES The magazine of food, farm and resource issues 4th Quarter 2003 A publication of the American Agricultural Economics Association Rural Area Brain Drain: Is It a Reality? By Georgeanne Artz Brain
THE PEOPLE, THE PRESS & POLITICS 1990 After The Election
 FOR RELEASE: FRIDAY, NOVEMBER 16, 1990 THE PEOPLE, THE PRESS & POLITICS 1990 After The Election FOR FURTHER INFORMATION CONTACT: Donald S. Kellermann, Director Andrew Kohut, Director of Surveys Carol Bowman,
The Effect of Electoral Geography on Competitive Elections and Partisan Gerrymandering
 The Effect of Electoral Geography on Competitive Elections and Partisan Gerrymandering Jowei Chen University of Michigan jowei@umich.edu http://www.umich.edu/~jowei November 12, 2012 Abstract: How does
Assessment of Voting Rights Progress in Jurisdictions Covered Under Section Five of the Voting Rights Act
 Assessment of Voting Rights Progress in Jurisdictions Covered Under Section Five of the Voting Rights Act Submitted to the United s Senate Committee on the Judiciary May 17, 2006 American Enterprise Institute
Grades 2-7. American Government and the Election Process Unit Study SAMPLE PAGE. A Journey Through Learning
 A J T L Grades 2-7 American Government and the Election Process Unit Study A Journey Through Learning www.ajourneythroughlearning.com Copyright 2008 A Journey Through Learning 1 Authors: Paula Winget and
Romney Leads in Confidence on Recovery But Obama Escapes Most Economic Blame
 ABC NEWS/WASHINGTON POST POLL: Election Tracking No. 11 EMBARGOED FOR RELEASE AFTER 5 p.m. Thursday, Nov. 1, 2012 Romney Leads in Confidence on Recovery But Obama Escapes Most Economic Blame More likely
Growth in the Foreign-Born Workforce and Employment of the Native Born
 Report August 10, 2006 Growth in the Foreign-Born Workforce and Employment of the Native Born Rakesh Kochhar Associate Director for Research, Pew Hispanic Center Rapid increases in the foreign-born population
Percentage and income.
 Blacks The fact that the maps shows a large area of concentrated Black settlement exists in 20 confirms indirectly the fact that Los Angeles County is still quite highly segregated between Blacks and Whites.
Rural America At A Glance
 Rural America At A Glance 7 Edition Between July 5 and July 6, the population of nonmetro America grew.6 percent. Net domestic migration from metro areas accounted for nearly half of this growth. Gains
Citizenship in 21 st Century America
 Citizenship in 21 st Century America T he United States is a representative democracy, in which government officials are selected by the people they represent. However, many have questioned whether democracy
Immigrant Communities of Philadelphia: Spatial Patterns and Revitalization
 University of Pennsylvania ScholarlyCommons Reports Social Science Studio 1-1-2015 Immigrant Communities of Philadelphia: Spatial Patterns and Revitalization Jake Riley University of Pennsylvania, rjake@sas.upenn.edu
SMGX Strategic Intelligence Insider s Look. Election Night Broadcast Network Evening News Average Live Ratings by Demographic November 6, 2012
 SMGX Strategic Intelligence Insider s Look Look Election Night 2012 After months of analysis, countless predictions and agonizing promotion, the people spoke loud and clear on. In the end, people elected
Vermonters Awareness of and Attitudes Toward Sprawl Development in 2002
 Vermonters Awareness of and Attitudes Toward Sprawl Development in 2002 Written by Thomas P. DeSisto, Data Research Specialist Introduction In recent years sprawl has been viewed by a number of Vermont