World Macroeconomic Overview
|
|
|
- Clifford Reeves
- 5 years ago
- Views:
Transcription
1 World Macroeconomic Overview Erik Hurst V. Duane Rath Professor of Economics University of Chicago Booth School of Business September
2 Outline Part 1: A Primer on Economic Growth Part 2: Commodity Prices Part 3: Housing Markets Part 4: Inflation Part 5: U.S. Overview Part 6: European Overview 2
3 Part 1: A Primer on Economic Growth 3
4 Measuring Economic Growth Y = f(a, K, N, raw materials) Y = GDP f(.) = Some production function Inputs into production K N = capital stock (machines, buildings, production equipment, etc.) = labor force (number and quality of workers) A = Defined as Total Factor Productivity 4
5 Defining Total Factor Productivity Total Factor Productivity (TFP) is basically a catch all for anything that affects output other than K, N and raw materials Examples Innovation (including innovation in management practices) Competition Specialization Regulation Infrastructure Work week of labor and capital Quality of labor and capital Changes in discrimination or culture 5
6 Growth Accounting Output growth in a country comes from: Growth in TFP (see entrepreneurial ability, education, roads, technology, etc.) Growth in Capital (machines, equipment, plants) Growth in Hours (workforce, population, labor participation, etc). One can decompose output growth into the part determined by A, K, and N. Growth in output per worker (Y/N) is determined by A and (K/N). 6
7 What Causes Sustained Growth? Sustained increases in the growth of A are the only thing that can cause a sustained growth in output per person. Empirically, when a country exhibits faster Y/N growth.. 33% typically comes from growth in K/N 67% typically comes from growth in A (where N = employment (not hours) - limited data). 7
8 Growth Across Countries Most developed economies grow at the same rate that the technological frontier grows. Some helpful definitions: Convergence countries inside of the technological frontier move towards the technological frontier. Divergence countries inside of the technological frontier grow at a rate less than the technological frontier. 8
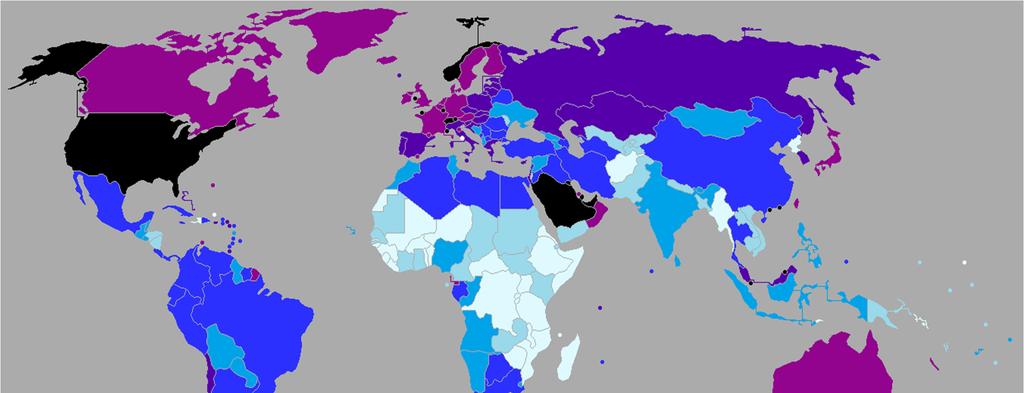

9 Distribution of World GDP in 2014 (IMF, $) 9
10 Distribution of World GDP in 2014 (IMF, $) Top 10 Other Notable Bottom 10 Qatar 143,427 Lithuania 27,051 Madagascar 1,437 Luxembourg 92,049 Russia 24,805 Guinea 1,313 Singapore 82,726 Chile 22,971 Eritrea 1,195 Brunei 73,233 Turkey 19,610 Mozambique 1,174 Kuwait 71,020 Venezuela 17,695 Niger 1,048 Norway 66,937 Brazil 16,096 Burundi 911 UAE 64,479 South Africa 13,046 Liberia 882 Switzerland 58,087 China 12,880 Malawi 780 Hong Kong 54,722 Ukraine 8,668 Congo 704 USA 54,597 India 5,855 Cent. Afric. Repub


11 Some Data: Distribution of World GDP in 2000 From Barro, 2003 includes 147 countries. Horizontal axis is a log scale. All data are in 1995 U.S. dollars. 11


12 Some Data: Distribution of World GDP in 1960 From Barro, 2003 includes 113 countries. Horizontal axis is a log scale. All data are in 1995 U.S. dollars. 12

13 Growth Rate of GDP Per Capita: From Barro, 2003 includes 111 countries. 13
14 Convergence of Income Across U.S. States: Historical Trends in Convergence Unadjusted Growth in Per Capita Income MS ARAL ND SD KY OK NC GA NM KS NE TN SC LA TX UT CO ID IA MO WV VA AZMNWI IN FL WY VT NH ME MT OR WA OH PA MI MD IL RI MA CA NJ NYNV CT DE Per Capita Income 1940 Fitted values gr_ipc_40_60 14
15 From Sosa et al. (2013), IMF Working Paper 15
16 16
17 17
18 18
19 19
20 20
21 21
22 22
23 23

24 Source of GDP Growth Latin America Brazil, Chile, Columbia, Mexico, Peru, Uruguay. Bolivia, Ecuador, Paraguay, Venezuela Emerging Asia Indonesia, Malaysia, Philippines, Thailand, and China Advanced Exporters Australia, Canada, New Zealand, and Norway. From Sosa et al. (2013), IMF Report 24
25 TFP Growth Barbados (BRB), Bolivia (BOL), Brazil (BRA), Chile (CHL), Columbia (Col), Costa Rica (CRI), Dominican Republic (DOM), Ecuador (ECU), El Salvador (SLV), Honduras (HND), Jamaica (JAM), Mexico (MEX), Nicaragua (NIC), Panama (PAN), Paraguay (PRY), Peru (PER), Trinidad and Tobago (TTO), Uruguay (URY), and Venezuela (VEN). 25
26 Drivers of Latin American Growth Very little comes from TFP growth slightly more during the 2000s but, small in comparison to the Asian economies. Hard to get sustainable growth without TFP growth Large increase in labor (decline in unemployment) driving the bulk of the growth. Good for standards of livings but, hard to get sustainable growth from just increasing N. 26

27 Source of GDP Growth: Labor Component Latin America 6 Brazil, Chile, Columbia, Mexico, Peru, and Uruguay. Other South American - Bolivia, Ecuador, Paraguay, and Venezuela Central America Costa Rica, Dominican Republic, El Salvador, Honduras, Nicaragua and Panama Caribbean Barbados, Jamaica, and Trinidad and Tobago. From Sosa et al. (2013), IMF Report 27
28 Outstanding Questions: Part 1 Why is Latin American growth slowing in recent years? Why was the growth during the boom years ( ) occurring without strong TFP growth? 28
29 Part 2: Understanding Commodity Markets 29
30 What I Will Do Show trends in world commodity prices. Overview of commodity prices and macroeconomic activity. Discuss the importance of commodities for U.S. and Latin American economies. Discuss Dutch Disease and implications to commodity based economies. Forecast role of commodity price stabilization on U.S. and Latin American economies. 30
31 Importance of Commodity Sector to Latin American Economies Many popular press articles concerned about Latin American dependence on commodity prices The Economist (9/9/2010) Commodities alone are not enough to sustain flourishing economies During the 2000 s, 52 percent of regions exports are commodities (World Bank). Chile, Peru, and Venezuela still rely on raw materials for three-quarters of their exports. Estimates suggest that one-third to one-half of regions growth during the 2000s can be attributed to higher demand for commodities. 31

32 Tax Revenues From Natural Resources Taken from economist magazine 32
33 Trends in Composite Commodity Prices Over Time (IMF) 33
34 Trends in Non-Fuel Commodity Prices Over Time (IMF) 34
35 35
36 What Drove the Commodity Price Boom? Chinese and Indian growth Massively large countries grew fast. o o o Increased demand for commodities and energy As those countries converge to the technological frontier, economic growth will moderate. As it does, so will their commodity demand. Additionally, they will start to mine their own commodities (seeing this already in resource rich China). 36
37 Commodity Price Forecasts (IMF) 37
38 Commodity Price Forecasts (IMF) 38
39 Commodity Price Forecasts (IMF) 39

40 Share of Commodity Exports: Selected LAC 2014 (IMF) 40

41 Is Commodity Growth Related to GDP Growth in Latin America? IMF Report NCPI is natural resource production index 41

42 Is Commodity Growth Related to GDP Growth in Latin America? 42
43 Concerns About Commodity Price Reliance Volatility (commodity prices are volatile) Dutch Disease referred to the North Sea s gas boom in the mid-1970s on the economy of the Netherlands. o o Commodity prices drive value of the currency making other parts of the economy less competitive. Increases reliance on commodity sector. I expand the definition to refer to anything that draws resources towards one sector and away from another sector. Many non-agricultural commodities are not renewable. When they are gone, they are gone. Short run supply restrictions on commodity extractions yields large rents that are often expropriated by government (often leading to corruption). 43
44 Commodity Price Boom and Low TFP Growth As commodity prices grow, incentive of commodity rich countries to focus on extraction. The relative monopoly of the commodity exporters creates rents. There is not as much incentive to increase efficiency given the excess rents to the economy. Can result in large growth in output (and employment) without a corresponding increase in TFP. If the resource boom is temporary, can have lasting effects on a countries growth prospects! A similar story can be told for effects of housing boom in U.S., Spain, etc. 44
45 Summary: Part 1 Weakening commodity demand is putting a strain on Latin American economies. Most important for high commodity producing countries that did not have high TFP growth during the 2000s. Latin American countries that export commodities dependent on world demand (which drives commodity price variation). o o China/India/Emerging Market growth U.S. growth (given proximity) Need to discuss Chinese and American growth to get a full picture of risks to Latin American economies. 45
46 Energy Boom in U.S. How has the U.S. responded to energy price boom? Potential spill over to Latin American Economies 46

47 U.S. Energy Production Over Time (IMF) 47

48 U.S. Energy Production Over Time (IMF) 48
 49")
49 U.S. Crude Imports Over Time (IMF) 49

50 Will A Strong U.S. Spur Latin American Growth? IMF Report Model Projection 50
51 Part 3: Understanding Housing Markets 51
52 What I Will Do Show recent data on property price movements in Latin America relative to the rest of the world. Establish three facts about the nature of housing prices. Provide a simple model to understand housing price dynamics. Forecast housing prices out for the U.S., China and Latin American (broadly). Discuss potential housing price collapse on Chinese economy. 52
53 Real House Price Growth (Post Global Recession) Country House Price Growth (Percent) Brazil 45.5 Britain -4.9 Canada 7.3 China -3.3 Germany 13.6 Ireland Japan -6.0 South Africa -6.4 Spain
54 Source: BIS Monetary and Economic Department 54
55 Source: BIS Monetary and Economic Department 55

56 Real House Price Index (2005Q1 = 100) Source: BIS Monetary and Economic Department 56
57 Three Facts About Housing Prices in Developed Countries 1. Long run house price appreciation averages 0 2 percent real per year. 2. Housing prices cycle (big booms are followed by big busts) 3. Supply and demand pin down house prices. Caveat gentrification can lead to sustained house prices over time. What is gentrification? Is it more likely to occur in developing economies? 57
58 Average Annual Real Price Growth By US State State State AK MT AL NC AR ND AZ NE CA NH CO NJ CT NM DC NV DE NY FL OH GA OK HI OR IA PA ID RI IL SC IN SD Average
59 Average Annual Real Price Growth By US State State State AK MT AL NC AR ND AZ NE CA NH CO NJ CT NM DC NV DE NY FL OH GA OK HI OR IA PA ID RI IL SC IN SD Average
60 Average Annual Real Price Growth By US State State State AK MT AL NC AR ND AZ NE CA NH CO NJ CT NM DC NV DE NY FL OH GA OK HI OR IA PA ID RI IL SC IN SD Average
61 Average Annual Real Price Growth By US State State State AK MT AL NC AR ND AZ NE CA NH CO NJ CT NM DC NV DE NY FL OH GA OK HI OR IA PA ID RI IL SC IN SD Average
62 Inflation Adjusted Housing Price Growth in the U.S
63 Housing Market: New York
64 Typical Local Cycle: California
65 Typical Local Cycle: Nevada
66 Average Annual Real Price Growth Across Countries State Belgium Canada Germany Denmark Spain Finland France UK Ireland Italy Japan Luxembourg Norway Sweden S. Africa USA Average
67 :Q1 1977:Q1 1978:Q1 1979:Q1 1980:Q1 1981:Q1 1982:Q1 1983:Q1 1984:Q1 1985:Q1 1986:Q1 1987:Q1 1988:Q1 1989:Q1 1990:Q1 1991:Q1 1992:Q1 1993:Q1 1994:Q1 1995:Q1 1996:Q1 1997:Q1 1998:Q1 1999:Q1 2000:Q1 2001:Q1 2002:Q1 2003:Q1 2004:Q1 2005:Q1 2006:Q1 2007:Q1 2008:Q1 2009:Q1 2010:Q1 2011:Q1 2012:Q1 2013:Q1 2014:Q1 Real House Price Growth in Spain (Annual Appreciation)
68 :Q1 1977:Q1 1978:Q1 1979:Q1 1980:Q1 1981:Q1 1982:Q1 1983:Q1 1984:Q1 1985:Q1 1986:Q1 1987:Q1 1988:Q1 1989:Q1 1990:Q1 1991:Q1 1992:Q1 1993:Q1 1994:Q1 1995:Q1 1996:Q1 1997:Q1 1998:Q1 1999:Q1 2000:Q1 2001:Q1 2002:Q1 2003:Q1 2004:Q1 2005:Q1 2006:Q1 2007:Q1 2008:Q1 2009:Q1 2010:Q1 2011:Q1 2012:Q1 2013:Q1 2014:Q1 Real House Price Growth in Ireland (Annual Appreciation)
69 :Q1 1977:Q1 1978:Q1 1979:Q1 1980:Q1 1981:Q1 1982:Q1 1983:Q1 1984:Q1 1985:Q1 1986:Q1 1987:Q1 1988:Q1 1989:Q1 1990:Q1 1991:Q1 1992:Q1 1993:Q1 1994:Q1 1995:Q1 1996:Q1 1997:Q1 1998:Q1 1999:Q1 2000:Q1 2001:Q1 2002:Q1 2003:Q1 2004:Q1 2005:Q1 2006:Q1 2007:Q1 2008:Q1 2009:Q1 2010:Q1 2011:Q1 2012:Q1 2013:Q1 2014:Q1 Real House Price Growth in Japan (Annual Appreciation)
70 :Q1 1977:Q1 1978:Q1 1979:Q1 1980:Q1 1981:Q1 1982:Q1 1983:Q1 1984:Q1 1985:Q1 1986:Q1 1987:Q1 1988:Q1 1989:Q1 1990:Q1 1991:Q1 1992:Q1 1993:Q1 1994:Q1 1995:Q1 1996:Q1 1997:Q1 1998:Q1 1999:Q1 2000:Q1 2001:Q1 2002:Q1 2003:Q1 2004:Q1 2005:Q1 2006:Q1 2007:Q1 2008:Q1 2009:Q1 2010:Q1 2011:Q1 2012:Q1 2013:Q1 2014:Q1 Real House Price Index in South Korea
71 Equilibrium in Housing Markets Fixed Supply P H Demand Q H 71
72 Equilibrium in Housing Markets Fixed Supply P H P H Demand Q H 72
73 Equilibrium in Housing Markets Fixed Supply P H P H Supply Eventually Adjusts P H Demand Q H 73
74 How Does Supply Adjust? Build on Vacant Land Convert Rental or Commercial Property Build Up Build Out (Suburbs) Build Way Out (Create New Cities) Some of these adjustments can take consider amounts of time. Caveat: Gentrification/Agglomeration can lead to sustained increases in house prices. 74
75 Supply and demand forces. Why Do House Prices Cycle? When demand increases (increasing prices), supply eventually adjusts (build more houses). The increase in housing supply moderates price growth. Housing supply in the long run is very elastic (convert old properties, build on vacant land, create new cities, etc.). 75


76 U.S Quarterly Housing Starts (in 1,000s) 76
77 Housing Prices in China o o o o o China house prices have growth has been massive during the 2000s (e.g., ~500% in Beijing, ~350% in Shanghai, and 200% in mid-sized cities) Is housing price boom in China a bubble? Some academics/officials say no bubble. Income growth was also high. Income growth and housing growth have been tracking each other (although housing growth is slightly higher). As seen above, it is hard for economic theory to predict a tight relationship between housing price growth and income growth (because supply can adjust). Empirically, no relationship between house price growth and income growth.
78 House Price Growth in China (Fang et al, 2015)
79 79
80 80
81 81
82 82
83 83
84 84
85 1975:Q1 1976:Q2 1977:Q3 1978:Q4 1980:Q1 1981:Q2 1982:Q3 1983:Q4 1985:Q1 1986:Q2 1987:Q3 1988:Q4 1990:Q1 1991:Q2 1992:Q3 1993:Q4 1995:Q1 1996:Q2 1997:Q3 1998:Q4 2000:Q1 2001:Q2 2002:Q3 2003:Q4 2005:Q1 2006:Q2 2007:Q3 2008:Q4 2010:Q1 2011:Q2 2012:Q3 2013:Q Real House Price Index vs Real Per Capita Inc. Index: Croatia (2005= 100) Real House Price Growth : 8% Real Per Capita Income Growth : 257% 85
86 86
87 What is Driving Property Price Boom in China? How much of the increase in Chinese housing demand during last decade is due to lack of alternate investment options? Antidotal evidence that housing is a preferred investment vehicle in China given low returns on bank accounts and restricted access to equity markets. Some evidence that foreign Chinese investors have propped up housing prices in London, Vancouver, and Toronto. Little formal analysis on this topic.
88 Data on Multiple Ownership of Residential Property Data from China s Urban Household Survey Analyzed data for Liaoning, Shanghai, Guangdong, and Sichuan Fraction of households (by income category) who own 1 or 2 houses. Number of Homes (All Homeowners) Year = Liaoning Shanghai Guangdong Sichuan
89 Data on Multiple Ownership of Residential Property Data from China s Urban Household Survey Analyzed data for Liaoning, Shanghai, Guangdong, and Sichuan Fraction of households (by income category) who own 1 or 2 houses. Shanghai Guangdong Sichuan Income Quartile 1 house 2 house 1 house 2 house 1 house 2 house Bottom Second Third Top
90 Housing Supply Growth in Chinese Cities Deng et al. (2015), NYU working paper
91 Unsold Housing Inventories in Chinese Cities Deng et al. (2015), NYU working paper
92 Vacancy Rate in Chinese Cities Deng et al. (2015), NYU working paper
93 House Prices and The Macroeconomy o Three channels of house prices on economic activity o Building channel (high housing demand creates jobs in construction sector). o Wealth channel (high house prices can drive spending because people feel wealthier or because they tap into home equity). o Bank channel (falling house prices could cause defaults which causes banks to lose money effects aggregate lending). o c Lower leverage in Latin America limits the latter channel (bank losses ould be less from a property price decline).
94 House Price Forecast: U.S. o Housing prices have for the most part - stabilizing in nominal terms. o We should expect annual real housing price growth of somewhere in the range of 0% to 3% nominal in the medium run. o Housing market will not be rebounding toward 2006 levels anytime soon. - Have a glut of existing supply - No reason to expect a large housing demand shock
95 House Price Forecast: Latin America o Fair amount of heterogeneity across o Olympics should prop up prices in medium run in Brazil (demand is high, increased construction costs, etc.) o Need to separately analyze both demand factors (credit constraints, commodity price demand) and supply factors (building regulations, construction costs). o Will land prices permanently increase because of gentrification (lower crime, better schools, lower pollution, etc.)? o Are prices over-inflated?
96 House Price Forecast: China o I believe housing prices to be over-inflated. o Prices are starting to fall in the last year (slightly) o Demand is propped up housing being treated as an investment vehicle. o Financial liberalization may cause a housing price collapse. o Will the stock market collapse spill over to the housing market? - Stocks have plummeted during the last two months (25 percent decline) o Will the housing price collapse effect the overall economy?
97 Risks to the Chinese Economy o Stocks still up on the year but, stock wealth makes up only 6% of household wealth. Stock issuance only funds 5% of firm investment (the rest is financed by bank lending). o As a result, stock market decline may not have big effect on domestic spending. o Growth in output has been slowing prior to the stock market declines. o Banks are lending encouraged by the government. This will prop up firm investment/consumer spending. Will it spur inflation? o Is a financial crises in China looming?
98 Part 4: The Anemic U.S. Labor Market 98

99 Unemployment Rate: 1970M1 2015M4 99
100 How is Unemployment Measured? Standardized Definition of the Unemployment Rate: Unemployed = jobless but looking for a job Labor Force = #Employed + #Unemployed Unemployment Rate = (# Unemployed) / (Labor Force) This is the definition used in most countries, including the U.S. U.S. data: U.S. measurement details: Issues: Discouraged Workers, Underemployed, Measurement Issues 100
101 Components of Unemployment Flow of people into the unemployment pool o Flow into unemployment from employment (job loss) o Flow into unemployment from out of labor force (stop being discouraged) Flow of people out of the unemployment pool o Flow out of unemployment into employment (job finding) o Flow out of unemployment out of labor force (discouraged workers) 101

102 Employment to Population Rate: Men 102

103 Employment to Population Rate: Women 103
104 104
105 105
106 106
107 107
108 Types of Unemployment Frictional Unemployment: Result of Matching Behavior between Firms and Workers. Structural Unemployment: Result of Mismatch of Skills and Employer Needs Cyclical Unemployment: Result of output being below full-employment. Individuals have the desire to work and the skills to work, yet cannot find a job. Is Zero Unemployment a Reasonable Policy Goal? No. Frictional and Structural Unemployment may be desirable (unavoidable). 108
109 Why is the Distinction Important? How much of the current low employment is structural vs. cyclical? This is a current debate among policy makers (and a question I am trying to answer in my own research) Why could there be structural non-employment? o Some industries boomed inefficiently during the early 2000s (construction) and need to retrench. The jobs being created now are not in those industries (where unemployment is high). o Some industries were in secular decline during the 2000s (manufacturing). The jobs being created now are not in those industries. o Workers in manufacturing and construction need to be reallocated to other sectors. 109
110 My Current Research Big decline in manufacturing employment during the early 2000s. This depresses wages and employment of non-college individuals. Housing boom during the early 2000s lifted the employment and wages of lower skilled individuals (by propping up construction and housing related services). Housing boom masked the structural decline in manufacturing. The manufacturing decline is permanent while the housing boom was temporary. This is the focus of a series of new papers I have with (with Kerwin Charles and Matt Notowidigdo). Preview some background patterns first. Then I will talk about the identification of this mechanism. Summary: Both housing and manufacturing had a significant effect on labor markets during the last 15 years within the U.S.

111 ~1 Million Jobs Lost During 1980s and 1990s

112 ~1 Million Jobs Lost During 1980s and 1990s ~4 Million Jobs Lost Between (Housing Boom Years)
 ~1 Million Jobs Lost After")
113 ~1 Million Jobs Lost During 1980s and 1990s ~4 Million Jobs Lost Between (Housing Boom Years) ~1 Million Jobs Lost After 2007

114 U.S. Employment Trends for Non-College Men (age 21-55) Manufacturing + Construction Manufacturing Construction
 Manufacturing + Construction Manufacturing")
115 U.S. Employment Trends for Non-College Women (age 21-55) Manufacturing + Construction Manufacturing Construction
116 Part 5: Housing Boom and Educational Attainment 116
117 Propensity to Have At Least One Year of College (Age: 18-29)

118 Propensity to Have At Least One Year of College (Age: 18-29)

119
120 Did Housing Boom Delay College Attendance? Use same local labor market design to answer this question. The answer is YES! Places that had large housing booms had a large reduction in the propensity to attend at least one year of college. o o Nearly all the action was on two year colleges (community colleges, technical schools, trade schools, etc.). Found effects for both men and women. During the bust, this trend reversed (but, not completely). Estimates can explain about 50% of the time series change for both men and women.
121 Conclusions 1. Structural shifts are having real effects on the economy during the 2000s. o o o About 40% of increase in non-employment during 2000s can be attributed to the decline in manufacturing. Most of this effect occurred along the out of the labor force margin and not the unemployment margin. Manufacturing (inclusive of the part masked by housing boom) explain about 35% of increase during the recession. 2. Labor market was weaker in the period than we thought. o o o Housing boom masked deterioration of U.S. labor market period marked by secular decline in one sector and a temporary boom in another sector. Implication: 2007 may not be a good benchmark to evaluate cyclical changes in economic variables of interest.
122 Conclusions 3. The net effect of housing booms/busts on labor markets was smaller over the entire decade. o The bust reduced employment but the boom raised employed 4. Housing boom deterred college attainment during period. o Housing boom distorted human capital in addition to physical capital. 5. Broader implications what happens when you have cyclical booms/busts in one sector and persistent declines in another sector. o o Not saying housing is important, per se (it was just the boom/bust during this decade). Real focus is on the manufacturing decline.
123 Part 6: Some Thoughts on Inequality 123
124 Inequality Mania Recent empirical work showing inequality is increasing: o o o o Income inequality (Kevin Murphy, Larry Katz, Emmanuel Saez, Thomas Piketty, Ed Glaeser). Consumption Inequality (Steve Davis, Me) Employment Inequality (Kevin Murphy, Bob Topel, Me) Wealth Inequality (Thomas Piketty, Emmanuel Saez) What are the causes of increased inequality? Is increased inequality detrimental to a society? 124
125 Thomas Piketty Capital in the Twenty First Century Book: Capital in the Twenty First Century - Worldwide best seller. Documents wealth inequality increases around the developed world. Claim: economic conditions are such that eventually most wealth will be concentrated in the hands of the rich. o Forces will continue to make inequality grow. o Reason: rate of return on capital > income growth (i.e., r > g) Policy prescription: Tax wealth In my class, walk through all the assumptions needed for Piketty s conclusions. Some of the assumptions are unrealistic. 125
126 U.S. Income Inequality: Top 10% Kuznet s Curve 126
127 Cross-Country Income Inequality: Top 1% 127
128 U.S. Wealth Inequality 128
129 Inequality Thoughts Are there benefits to income inequality? In human capital models, unequal returns to skill are necessary to induce people to invest in human capital. The widening inequality in earnings and the buoyant demand for skilled workers also indirectly encourages greater growth in the economy by increasing the incentives for young people to invest in themselves. Gary Becker, The Economics of Life 129
130 Inequality Thoughts Is income inequality detrimental to society? The economic literature has focused on documenting trends in inequality and modeling the determinants of income inequality. However, the consequences of inequality are relatively understudied due to some challenges in research design. How do we think about: o The health of societies that are unequal? o Intergenerational mobility? o Income segregation (do poor and rich people choose to live next to each other)? o Political participation (who votes? who gives money to candidates?)? 130
131 Part 7: The Sustainability of Europe 131

132 European GDP Growth Rate
133 European GDP Growth Rate
134 Will Eurozone Last? o How do currency unions deal with regional heterogeneity? o o o o o Devaluation of local currency (only possible if currency union dissolves). Regional migration - very little population migration in Europe (language barriers). Inter-Region transfers this is the policy currently being pursued. Inflation in the relatively strong countries (makes weak countries exports cheaper). Wage/Budget cuts in the relatively weak countries (politically hard to implement).
135 Why is the U.S. a good currency union? o How do currency unions deal with regional heterogeneity? o o Devaluation of local currency (only possible if currency union dissolves). Regional migration o Inter-Region transfers o o Inflation in the relatively strong countries (makes weak countries exports cheaper). Wage/Budget cuts in the relatively weak countries (politically hard to implement).
136 U.S. Inter-Region Transfers: Average State Yearly Net Transfer (% GDP) State Yearly Net Transfer (% GDP) Delaware 10.3 Hawaii -6.7 Minnesota 10.0 Virginia -7.3 New Jersey 7.5 Alaska -7.5 Illinois 5.6 Maryland/DC -7.5 Connecticut 5.3 Maine -7.6 New York 4.4 North Dakota -7.7 Ohio 3.3 Montana -9.2 Michigan 2.7 West Virginia Nebraska 2.6 Mississippi Massachusetts 2.1 New Mexico From Economist: 8/1/2011
137 Some Concluding Topics (if time allows) o Monetary Policy in the U.S. Interest Rate Policy Going Forward? o U.S. inflationary pressures? o Greek exit?
138 Questions 138
World Macroeconomic Overview
 World Macroeconomic Overview Erik Hurst V. Duane Rath Professor of Economics University of Chicago Booth School of Business August/September 2016 1 Outline Part 1: Latin America Discussion o o o o Overview
INSTITUTE of PUBLIC POLICY
 INSTITUTE of PUBLIC POLICY Harry S Truman School of Public Affairs University of Missouri ANALYSIS OF STATE REVENUES AND EXPENDITURES Andrew Wesemann and Brian Dabson Summary This report analyzes state
WYOMING POPULATION DECLINED SLIGHTLY
 FOR IMMEDIATE RELEASE Wednesday, December 19, 2018 Contact: Dr. Wenlin Liu, Chief Economist WYOMING POPULATION DECLINED SLIGHTLY CHEYENNE -- Wyoming s total resident population contracted to 577,737 in
UNIFORM NOTICE OF REGULATION A TIER 2 OFFERING Pursuant to Section 18(b)(3), (b)(4), and/or (c)(2) of the Securities Act of 1933
(3), (b)(4), and/or (c)(2) of the Securities Act of 1933") Item 1. Issuer s Identity UNIFORM NOTICE OF REGULATION A TIER 2 OFFERING Pursuant to Section 18(b)(3), (b)(4), and/or (c)(2) of the Securities Act of 1933 Name of Issuer Previous Name(s) None Entity Type
Item 1. Issuer s Identity UNIFORM NOTICE OF REGULATION A TIER 2 OFFERING Pursuant to Section 18(b)(3), (b)(4), and/or (c)(2) of the Securities Act of 1933 Name of Issuer Previous Name(s) None Entity Type
If you have questions, please or call
 SCCE's 17th Annual Compliance & Ethics Institute: CLE Approvals By State The SCCE submitted sessions deemed eligible for general CLE credits and legal ethics CLE credits to most states with CLE requirements
Hilde C. Bjørnland. BI Norwegian Business School. Advisory Panel on Macroeconomic Models and Methods Oslo, 27 November 2018
 Discussion of OECD Deputy Secretary-General Ludger Schuknecht: The Consequences of Large Fiscal Consolidations: Why Fiscal Frameworks Must Be Robust to Risk Hilde C. Bjørnland BI Norwegian Business School
Planting Seeds of Change
 Planting Seeds of Change Bangladesh/Portland: A Policing Partnership Sgt. Tim Sessions, Asst. Project Mgr. Oregon National Guard State Partnership Program 62 state partnerships Mission Enhance the United
GLOBAL RISKS OF CONCERN TO BUSINESS WEF EXECUTIVE OPINION SURVEY RESULTS SEPTEMBER 2017
 GLOBAL RISKS OF CONCERN TO BUSINESS WEF EXECUTIVE OPINION SURVEY RESULTS SEPTEMBER 2017 GLOBAL RISKS OF CONCERN TO BUSINESS Results from the World Economic Forum Executive Opinion Survey 2017 Survey and
Representational Bias in the 2012 Electorate
 Representational Bias in the 2012 Electorate by Vanessa Perez, Ph.D. January 2015 Table of Contents 1 Introduction 3 4 2 Methodology 5 3 Continuing Disparities in the and Voting Populations 6-10 4 National
2016 us election results
 1 of 6 11/12/2016 7:35 PM 2016 us election results All News Images Videos Shopping More Search tools About 243,000,000 results (0.86 seconds) 2 WA OR NV CA AK MT ID WY UT CO AZ NM ND MN SD WI NY MI NE
We re Paying Dearly for Bush s Tax Cuts Study Shows Burdens by State from Bush s $87-Billion-Every-51-Days Borrowing Binge
 Citizens for Tax Justice 202-626-3780 September 23, 2003 (9 pp.) Contact: Bob McIntyre We re Paying Dearly for Bush s Tax Cuts Study Shows Burdens by State from Bush s $87-Billion-Every-51-Days Borrowing
The globalization of inequality
 The globalization of inequality François Bourguignon Paris School of Economics Public lecture, Canberra, May 2013 1 "In a human society in the process of unification inequality between nations acquires
Presentation to the Bakery, Confectionery, Tobacco Workers and Grain Millers' International Union. Paul Lemmon July 26, 2010
 Presentation to the Bakery, Confectionery, Tobacco Workers and Grain Millers' International Union Paul Lemmon July 26, 2010 Our Hard Work in 2006 Our Hard Work in 2008 Who We re Fighting Speaker Boehner?
January 17, 2017 Women in State Legislatures 2017
 January 17, 2017 in State Legislatures 2017 Kelly Dittmar, Ph.D. In 2017, 1832 women (1107D, 703R, 4I, 4Prg, 1WFP, 13NP) hold seats in state legislatures, comprising 24.8% of the 7383 members; 442 women
Latin America in the New Global Order. Vittorio Corbo Governor Central Bank of Chile
 Latin America in the New Global Order Vittorio Corbo Governor Central Bank of Chile Outline 1. Economic and social performance of Latin American economies. 2. The causes of Latin America poor performance:
The Big Switch in Latin America: Restoring Growth Through Trade
 216/FDM2/3 Session 1 The Big Switch in Latin America: Restoring Growth Through Trade Purpose: Information Submitted by: World Bank Group Finance and Central Bank Deputies Meeting Lima, Peru 14 October
Handout 1: Empirics of Economic Growth
 14.451: Macroeconomic Theory I Suman S. Basu, MIT Handout 1: Empirics of Economic Growth Welcome to 14.451, the introductory course of the macro sequence. The aim of this course is to familiarize you with
Share of Countries over 1/3 Urbanized, by GDP per Capita (2012 $) 1960 and 2010
 1960 and 2010") Share of Countries over 1/3 Urbanized, by GDP per Capita (2012 $) 1960 and 2010 Share Urbanized 0.2.4.6.8 1 $0-1000 $1000-2000 $2000-3000 $3000-4000 $4000-5000 1960 2010 Source: World Bank Welfare Economics
Share of Countries over 1/3 Urbanized, by GDP per Capita (2012 $) 1960 and 2010 Share Urbanized 0.2.4.6.8 1 $0-1000 $1000-2000 $2000-3000 $3000-4000 $4000-5000 1960 2010 Source: World Bank Welfare Economics
RULE 1.14: CLIENT WITH DIMINISHED CAPACITY
 American Bar Association CPR Policy Implementation Committee Variations of the ABA Model Rules of Professional Conduct RULE 1.14: CLIENT WITH DIMINISHED CAPACITY (a) When a client's capacity to make adequately
Mineral Availability and Social License to Operate
 Mineral Availability and Social License to Operate Brett Jordan Division of Economics and Business Colorado School of Mines Camp Resources, August 7-9, 2016 Motivation Social License to Operate (SLO) NIMBYism
Why is Measured Productivity so Low in Agriculture?
 Why is Measured Productivity so Low in Agriculture? Berthold Herrendorf and Todd Schoellman Arizona State University June 6, 2013 Herrendorf and Schoellman Motivation Key Fact about Poor Countries Value
TABLE OF CONTENTS. Introduction. Identifying the Importance of ID. Overview. Policy Recommendations. Conclusion. Summary of Findings
 1 TABLE OF CONTENTS Introduction Identifying the Importance of ID Overview Policy Recommendations Conclusion Summary of Findings Quick Reference Guide 3 3 4 6 7 8 8 The National Network for Youth gives
New Population Estimates Show Slight Changes For 2010 Congressional Apportionment, With A Number of States Sitting Close to the Edge
 67 Emerywood Court Manassas, Virginia 202 202 789.2004 tel. or 703 580.7267 703 580.6258 fax Info@electiondataservices.com EMBARGOED UNTIL 6:0 P.M. EST, SUNDAY, SEPTEMBER 26, 200 Date: September 26, 200
Dynamic Diversity: Projected Changes in U.S. Race and Ethnic Composition 1995 to December 1999
 Dynamic Diversity: Projected Changes in U.S. Race and Ethnic Composition 1995 to 2050 December 1999 DYNAMIC DIVERSITY: PROJECTED CHANGES IN U.S. RACE AND ETHNIC COMPOSITION 1995 TO 2050 The Minority Business
Governing Board Roster
 AASA Governance AASA is the national association most directly concerned with public education leadership. Its practicing superintendents and other school system leaders establish and oversee AASA's goals.
RULE 1.1: COMPETENCE. As of January 23, American Bar Association CPR Policy Implementation Committee
 American Bar Association CPR Policy Implementation Committee Variations of the ABA Model Rules of Professional Conduct RULE 1.1: COMPETENCE A lawyer shall provide competent representation to a client.
Now is the time to pay attention
 Census & Redistricting : Now is the time to pay attention By Kimball Brace, President Election Data Services, Inc. Definitions Reapportionment Allocation of districts to an area Example: Congressional
Poverty Reduction and Economic Management The World Bank
 Financiamento del Desarollo Productivo e Inclusion Social Lecciones para America Latina Danny Leipziger Vice Presidente Poverty Reduction and Economic Management, Banco Mundial LAC economic growth has
WORLDWIDE DISTRIBUTION OF PRIVATE FINANCIAL ASSETS
 WORLDWIDE DISTRIBUTION OF PRIVATE FINANCIAL ASSETS Munich, November 2018 Copyright Allianz 11/19/2018 1 MORE DYNAMIC POST FINANCIAL CRISIS Changes in the global wealth middle classes in millions 1,250
International Visitation to the United States: A Statistical Summary of U.S. Visitation (2011)
") U. S. Depar tment of Commerce International Trade Administration Manufac turing and Ser vices Ser vices Office of Travel and Tourism Industries International Visitation to the United States: A Statistical
U. S. Depar tment of Commerce International Trade Administration Manufac turing and Ser vices Ser vices Office of Travel and Tourism Industries International Visitation to the United States: A Statistical
Congressional Districts Potentially Affected by Shipments to Yucca Mountain, Nevada
 2015 Congressional Districts Potentially Affected by Shipments to Yucca Mountain, Nevada Fred Dilger PhD. Black Mountain Research 10/21/2015 Background On June 16 2008, the Department of Energy (DOE) released
Global Variations in Growth Ambitions
 Global Variations in Growth Ambitions Donna Kelley, Babson College 7 th Annual GW October Entrepreneurship Conference World Bank, Washington DC October 13, 216 Wide variation in entrepreneurship rates
HOW ECONOMIES GROW AND DEVELOP Macroeconomics In Context (Goodwin, et al.)
") Chapter 17 HOW ECONOMIES GROW AND DEVELOP Macroeconomics In Context (Goodwin, et al.) Chapter Overview This chapter presents material on economic growth, such as the theory behind it, how it is calculated,
Chapter 17 HOW ECONOMIES GROW AND DEVELOP Macroeconomics In Context (Goodwin, et al.) Chapter Overview This chapter presents material on economic growth, such as the theory behind it, how it is calculated,
The Multidimensional Financial Inclusion MIFI 1
 2016 Report Tracking Financial Inclusion The Multidimensional Financial Inclusion MIFI 1 Financial Inclusion Financial inclusion is an essential ingredient of economic development and poverty reduction
14 Pathways Summer 2014
 14 Pathways Summer 2014 Pathways Summer 2014 15 Does Immigration Hurt the Poor? By Giovanni Peri The United States has a famously high poverty rate. In recent years, the Great Recession and the slow recovery
Charting Cambodia s Economy, 1H 2017
 Charting Cambodia s Economy, 1H 2017 Designed to help executives interpret economic numbers and incorporate them into company s planning. Publication Date: January 3 rd, 2017 HELPING EXECUTIVES AROUND
Impact of Immigration: Disruptive or Helpful?
 DABE September Meeting Denver, CO September 21, 2016 Impact of Immigration: Disruptive or Helpful? Pia Orrenius, Ph.D. Federal Reserve Bank of Dallas Disclaimer: The views expressed herein are those of
The Conference Board Total Economy Database Summary Tables November 2016
 The Conference Board Total Economy Database Summary Tables November 2016 About This document contains a number of tables and charts outlining the most important trends from the latest update of the Total
Daniel Kaufmann, Brookings Institution
 Reset Within Russia?: A Comparative Governance Perspective Daniel Kaufmann, Brookings Institution Presentation at the Public Conference The Risks of the Reset, at the Heritage Foundation, Washington, D.C.,
SPECIAL EDITION 11/6/14
 SPECIAL EDITION 11/6/14 The document below will provide insights on what the new Senate Majority means, as well as a nationwide view of House, Senate and Gubernatorial election results. We will continue
REGIONAL INTEGRATION IN THE AMERICAS: THE IMPACT OF THE GLOBAL ECONOMIC CRISIS
 REGIONAL INTEGRATION IN THE AMERICAS: THE IMPACT OF THE GLOBAL ECONOMIC CRISIS Conclusions, inter-regional comparisons, and the way forward Barbara Kotschwar, Peterson Institute for International Economics
FSC-BENEFITED EXPORTS AND JOBS IN 1999: Estimates for Every Congressional District
 FSC-BENEFITED EXPORTS AND JOBS IN 1999: Estimates for Every Congressional District Prepared for National Foreign Trade Council July 2, 2002 National Economic Consulting FSC-BENEFITED EXPORTS AND JOBS IN
Equity and Excellence in Education from International Perspectives
 Equity and Excellence in Education from International Perspectives HGSE Special Topic Seminar Pasi Sahlberg Spring 2015 @pasi_sahlberg Evolution of Equity in Education 1960s: The Coleman Report 1970s:
By 1970 immigrants from the Americas, Africa, and Asia far outnumbered those from Europe. CANADIAN UNITED STATES CUBAN MEXICAN
 In Search of the American Dream After World War II, millions of immigrants and citizens sought better lives in the United States. More and more immigrants came from Latin America and Asia. Between 940
SEVERANCE PAY POLICIES AROUND THE WORLD
 SEVERANCE PAY POLICIES AROUND THE WORLD SEVERANCE PAY POLICIES AROUND THE WORLD No one likes to dwell on lay-offs and terminations, but severance policies are a major component of every HR department s
Figure 2: Range of scores, Global Gender Gap Index and subindexes, 2016
 Figure 2: Range of s, Global Gender Gap Index and es, 2016 Global Gender Gap Index Yemen Pakistan India United States Rwanda Iceland Economic Opportunity and Participation Saudi Arabia India Mexico United
Red State, Blue State, Rich State, Poor State
 Why Americans Vote the Way They Do Department of Statistics and Department of Political Science, Columbia University 22 September 2008 1/36 The Paradox Journalists Get It Wrong (and Right) Red and Blue
The Emergence of Latin America: A Break with History?
 The Emergence of Latin America: A Break with History? Mauricio Cárdenas, Brookings Institution Brookings Mountain West University of Nevada, Las Vegas March 1, 2011 It is impossible to understand Latin
the Federal Reserve Board.
 Joint News Release Comptroller of the Currency Federal Deposit Insurance Corporation Federal Reserve Board For immediate release June 12, 1980 COUNTRY EXPOSURE LENDING SURVEY The result8 of a survey of
Global Trends in Location Selection Final results for 2005
 Global Business Services Plant Location International Global Trends in Location Selection Final results for 2005 September, 2006 Global Business Services Plant Location International 1. Global Overview
CA CALIFORNIA. Ala. Code 10-2B (2009) [Transferred, effective January 1, 2011, to 10A ] No monetary penalties listed.
![CA CALIFORNIA. Ala. Code 10-2B (2009) [Transferred, effective January 1, 2011, to 10A ] No monetary penalties listed.](/thumbs/72/66892882.jpg "CA CALIFORNIA. Ala. Code 10-2B (2009) [Transferred, effective January 1, 2011, to 10A ] No monetary penalties listed.") AL ALABAMA Ala. Code 10-2B-15.02 (2009) [Transferred, effective January 1, 2011, to 10A-2-15.02.] No monetary penalties listed. May invalidate in-state contracts made by unqualified foreign corporations.
AL ALABAMA Ala. Code 10-2B-15.02 (2009) [Transferred, effective January 1, 2011, to 10A-2-15.02.] No monetary penalties listed. May invalidate in-state contracts made by unqualified foreign corporations.
Chapter 5. Labour Market Equilibrium. McGraw-Hill/Irwin Labor Economics, 4 th edition
 Chapter 5 Labour Market Equilibrium McGraw-Hill/Irwin Labor Economics, 4 th edition Copyright 2008 The McGraw-Hill Companies, Inc. All rights reserved. 5-2 Introduction Labour market equilibrium coordinates
The Political Economy of Public Policy
 The Political Economy of Public Policy Valentino Larcinese Electoral Rules & Policy Outcomes Electoral Rules Matter! Imagine a situation with two parties A & B and 99 voters. A has 55 supporters and B
Graduation and Retention Rates of Nonresidents by State
 Graduation and Retention Rates of Nonresidents by State March 2011 Highlights: California, Illinois, and Texas are the states with the largest numbers of nonresidents. Students from Ohio and Wyoming persist
Immigrant Policy Project. Overview of State Legislation Related to Immigrants and Immigration January - March 2008
 Immigrant Policy Project April 24, 2008 Overview of State Legislation Related to Immigrants and Immigration January - March 2008 States are still tackling immigration related issues in a variety of policy
Mandated Use of Prescription Drug Monitoring Programs (PMPs) Map
 Map") Mandated Use of Prescription Drug Monitoring Programs (PMPs) Map Research Current as of January 2, 2018. This project was supported by Grant No. G1799ONDCP03A, awarded by the Office of National Drug Control
Mandated Use of Prescription Drug Monitoring Programs (PMPs) Map Research Current as of January 2, 2018. This project was supported by Grant No. G1799ONDCP03A, awarded by the Office of National Drug Control
2018 Social Progress Index
 2018 Social Progress Index The Social Progress Index Framework asks universally important questions 2 2018 Social Progress Index Framework 3 Our best index yet The Social Progress Index is an aggregate
VACATION AND OTHER LEAVE POLICIES AROUND THE WORLD
 VACATION AND OTHER LEAVE POLICIES AROUND THE WORLD VACATION AND OTHER LEAVE POLICIES AROUND THE WORLD AT A GLANCE ORDER ONLINE GEOGRAPHY 47 COUNTRIES COVERED 5 REGIONS 48 MARKETS Americas Asia Pacific
Emerging Asian economies lead Global Pay Gap rankings
 For immediate release Emerging Asian economies lead Global Pay Gap rankings China, Thailand and Vietnam top global rankings for pay difference between managers and clerical staff Singapore, 7 May 2008
PREVIEW 2018 PRO-EQUALITY AND ANTI-LGBTQ STATE AND LOCAL LEGISLATION
 PREVIEW 08 PRO-EQUALITY AND ANTI-LGBTQ STATE AND LOCAL LEGISLATION Emboldened by the politics of hate and fear spewed by the Trump-Pence administration, state legislators across the nation have threatened
1 THICK WHITE SENTRA; SIDES AND FACE PAINTED TO MATCH WALL PAINT: GRAPHICS DIRECT PRINTED TO SURFACE; CLEAT MOUNT TO WALL CRITICAL INSTALL POINT
 Map Country Panels 1 THICK WHITE SENTRA; SIDES AND FACE PAINTED TO MATCH WALL PAINT: GRAPHICS DIRECT PRINTED TO SURFACE; CLEAT MOUNT TO WALL CRITICAL INSTALL POINT GRAPHICS PRINTED DIRECT TO WHITE 1 THICK
Global Prevalence of Adult Overweight & Obesity by Region
 Country Year of Data Collection Global Prevalence of Adult Overweight & Obesity by Region National /Regional Survey Size Age Category % BMI 25-29.9 %BMI 30+ % BMI 25- %BMI 30+ 29.9 European Region Albania
2016 NATIONAL CONVENTION
 Delegate Allocations and Region Formation 2016 NATIONAL CONVENTION ROSEN CENTRE, ORLANDO, FL FRIDAY, MAY 27 MONDAY, MAY 30 Written and Prepared By Alicia Mattson Secretary, Libertarian National Committee
/mediation.htm s/adr.html rograms/adr/
 Alaska Alaska Court System AK http://www.state.ak.us/courts /mediation.htm A variety of programs are offered in courts throughout the state. Alabama Arkansas Alabama Center for AL http://www.alabamaadr.org
A GLOBAL PERSPECTIVE ON RESEARCH AND DEVELOPMENT
 UNESCO Institute for Statistics A GLOBAL PERSPECTIVE ON RESEARCH AND DEVELOPMENT The UNESCO Institute for Statistics (UIS) works with governments and diverse organizations to provide global statistics
APPENDIX 1: MEASURES OF CAPITALISM AND POLITICAL FREEDOM
 1 APPENDIX 1: MEASURES OF CAPITALISM AND POLITICAL FREEDOM All indicators shown below were transformed into series with a zero mean and a standard deviation of one before they were combined. The summary
Lessons learned in the negotiation of the Pacific Alliance on IRC.
 Lessons learned in the negotiation of the Pacific Alliance on IRC. Gastón Fernández Sch. Head Regulatory Department General Directorate for International Economic Affair Ministry of Foreign Affairs Chile
PISA 2015 in Hong Kong Result Release Figures and Appendices Accompanying Press Release
 PISA 2015 in Hong Kong Result Release Figures and Appendices Accompanying Press Release Figure 1-7 and Appendix 1,2 Figure 1: Comparison of Hong Kong Students Performance in Science, Reading and Mathematics
Incarcerated Women and Girls
 Incarcerated and Over the past quarter century, there has been a profound change in the involvement of women within the criminal justice system. This is the result of more expansive law enforcement efforts,
MACROECONOMICS. Key Concepts. The Importance of Economic Growth. The Wealth of Nations. GDP Growth. Elements of Growth. Total output Output per capita
 MACROECONOMICS AND THE GLOBAL BUSINESS ENVIRONMENT The Wealth of Nations The Supply Side PowerPoint by Beth Ingram adapted by R Helg Copyright 2005 John Wiley & Sons, Inc. All rights reserved. 3-2 Key
31% - 50% Cameroon, Paraguay, Cambodia, Mexico
 EStimados Doctores: Global Corruption Barometer 2005 Transparency International Poll shows widespread public alarm about corruption Berlin 9 December 2005 -- The 2005 Global Corruption Barometer, based
RULE 2.4: LAWYER SERVING
 American Bar Association CPR Policy Implementation Committee Variations of the ABA Model Rules of Professional Conduct RULE 2.4: LAWYER SERVING AS THIRD-PARTY NEUTRAL (a) A lawyer serves as a third-party
The National Police Immigration Service (NPIS) forcibly returned 412 persons in December 2017, and 166 of these were convicted offenders.
 forcibly returned 412 persons in December 2017, and 166 of these were convicted offenders.") Monthly statistics December 2017: Forced returns from Norway The National Police Immigration Service (NPIS) forcibly returned 412 persons in December 2017, and 166 of these were convicted offenders. The
Monthly statistics December 2017: Forced returns from Norway The National Police Immigration Service (NPIS) forcibly returned 412 persons in December 2017, and 166 of these were convicted offenders. The
Income, Deprivation, and Perceptions in Latin America and the Caribbean:
 Income, Deprivation, and Perceptions in Latin America and the Caribbean: New Evidence from the Gallup World Poll Leonardo Gasparini* Walter Sosa Escudero** Mariana Marchionni* Sergio Olivieri* * CEDLAS
Oregon and STEM+ Migration and Educational Attainment by Degree Type among Young Oregonians. Oregon Office of Economic Analysis
 Oregon and STEM+ Migration and Educational Attainment by Degree Type among Young Oregonians 1 What is STEM and STEM+? STEM refers to college degrees where graduates majored in Science, Technology, Engineering
Geek s Guide, Election 2012 by Prof. Sam Wang, Princeton University Princeton Election Consortium
 Geek s Guide, Election 2012 by Prof. Sam Wang, Princeton University Princeton Election Consortium http://election.princeton.edu This document presents a) Key states to watch early in the evening; b) Ways
LIST OF CHINESE EMBASSIES OVERSEAS Extracted from Ministry of Foreign Affairs of the People s Republic of China *
 ANNEX 1 LIST OF CHINESE EMBASSIES OVERSEAS Extracted from Ministry of Foreign Affairs of the People s Republic of China * ASIA Chinese Embassy in Afghanistan Chinese Embassy in Bangladesh Chinese Embassy
RIDE Program Overview
 RIDE Program Overview Region IV Annual Conference May 2017 Table of Contents 1 2 3 Program Overview and the E-Verify Process Fact and Fiction Filling a Critical Gap and a Glance at Identity Fraud? 4 RIDE
RIDE Program Overview
 RIDE Program Overview Table of Contents 1 Program Overview and the E-Verify Process 2 RIDE by the Numbers 3 Filling a Critical Gap and a Glance at Identity Fraud 4 Fact and Fiction? 5 Benefits of Working
CHILE NORTH AMERICA. Egypt, Israel, Oman, Saudi Arabia and UAE. Barge service: Russia Federation, South Korea and Taiwan. USA East Coast and Panama
 EUROPE Bulgaria, Greece, Italy, Netherlands and Turkey Belgium, Denmark, France, Germany, Malta, Netherlands, Poland, Slovenia, Spain and UK Belgium, Germany, Gibraltar, Greece, Italy, Malta, Netherlands,
Uniform Wage Garnishment Act
 Uniform Wage Garnishment Act Agenda What is it? Why do we need it? Major provisions Enactment 1 Who is the ULC? National Conference of Commissioners for Uniform State Laws Uniform Interstate Family Support
A Global View of Entrepreneurship Global Entrepreneurship Monitor 2012
 A Global View of Entrepreneurship Global Entrepreneurship Monitor 2012 Donna Kelley, Babson College REITI Workshop Tokyo Japan January 21, 2001 In 2012, its 14 th year, GEM surveyed 198,000 adults in 69
Latin America and the Caribbean
 Regional Outlook Latin America and the Caribbean Sebastián Vergara M. Development Policy and Analysis Division Department of Economic and Social Affairs United Nations UN DESA Expert Group Meeting on the
Global Consumer Confidence
 Global Consumer Confidence The Conference Board Global Consumer Confidence Survey is conducted in collaboration with Nielsen 1ST QUARTER 2018 RESULTS CONTENTS Global Highlights Asia-Pacific Africa and
The Impact of Wages on Highway Construction Costs
 The Impact of Wages on Highway Construction Costs Updated Analysis Prepared for the Construction Industry Labor-Management Trust and the National Heavy & Highway Alliance by The Construction Labor Research
Introduction to the 2013 Global Entrepreneurship and Development Index
 CHAPTER 1 Introduction to the Global Entrepreneurship and Development Index This is the third edition of the Global Entrepreneurship and Development Index (). The mission is to provide a detailed look
THE LEGISLATIVE PROCESS
 THE LEGISLATIVE PROCESS (and a few other things) Gary Moncrief University Distinguished Professor of Political Science Boise State University NEW LEADERSHIP IDAHO 2017 Lets start with a few other things
QGIS.org - Donations and Sponsorship Analysis 2016
 QGIS.org - Donations and Sponsorship Analysis 2016 QGIS.ORG received 1128 donations and 47 sponsorships. This equals to >3 donations every day and almost one new or renewed sponsorship every week. The
2018 NATIONAL CONVENTION
 Delegate Allocations and Region Formation 2018 NATIONAL CONVENTION HYATT REGENCY, NEW ORLEANS, LA SUNDAY, JULY 1 TUESDAY JULY 3 Written and Prepared By Alicia Mattson Secretary, Libertarian National Committee
International Travel to the U.S.
 University of Massachusetts Amherst ScholarWorks@UMass Amherst Travel and Tourism Research Association: Advancing Tourism Research Globally 2013 Marketing Outlook Forum - Outlook for 2014 International
National Travel and Tourism Office
 U.S. Department of Commerce International Trade Administration National Travel and Tourism Office International Visitation to the United States: A Statistical Summary of U.S. Visitation (2015 P ) International
The Youth Vote in 2008 By Emily Hoban Kirby and Kei Kawashima-Ginsberg 1 Updated August 17, 2009
 The Youth Vote in 2008 By Emily Hoban Kirby and Kei Kawashima-Ginsberg 1 Updated August 17, 2009 Estimates from the Census Current Population Survey November Supplement suggest that the voter turnout rate
Chapter 13. Country of Birth of the Foreign-Born Population
 Campbell Gibson American Demographic History Chartbook: 0 to www.demographicchartbook.com Chapter. Country of Birth of the Foreign-Born Population With a few exceptions, data on the foreign-born population
RULE 3.1: MERITORIOUS CLAIMS AND CONTENTIONS
 American Bar Association CPR Policy Implementation Committee Variations of the ABA Model Rules of Professional Conduct RULE 3.1: MERITORIOUS CLAIMS AND CONTENTIONS A lawyer shall not bring or defend a
A Partial Solution. To the Fundamental Problem of Causal Inference
 A Partial Solution To the Fundamental Problem of Causal Inference Some of our most important questions are causal questions. 1,000 5,000 10,000 50,000 100,000 10 5 0 5 10 Level of Democracy ( 10 = Least
Wage Inequality in Latin America: Understanding the Past to Prepare for the Future Julian Messina and Joana Silva
 Wage Inequality in Latin America: Understanding the Past to Prepare for the Future Julian Messina and Joana Silva 2002 2003 2004 2005 2006 2007 2008 2009 2010 2011 US (Billions) Gini points, average Latin
Country pairings for the second cycle of the Mechanism for the Review of Implementation of the United Nations Convention against Corruption
 Country pairings for the second cycle of the Mechanism for the Review of Implementation of the United Nations Convention against Corruption In year 1, a total of 29 reviews will be conducted: Regional
HUMAN RESOURCES IN R&D
 HUMAN RESOURCES IN R&D This fact sheet presents the latest UIS S&T data available as of July 2011. Regional density of researchers and their field of employment UIS Fact Sheet, August 2011, No. 13 In the
Mrs. Yuen s Final Exam. Study Packet. your Final Exam will be held on. Part 1: Fifty States and Capitals (100 points)
") Mrs. Yuen s Final Exam Study Packet your Final Exam will be held on All make up assignments must be turned in by YOUR finals day!!!! Part 1: Fifty States and Capitals (100 points) Be able to identify the
Mrs. Yuen s Final Exam Study Packet your Final Exam will be held on All make up assignments must be turned in by YOUR finals day!!!! Part 1: Fifty States and Capitals (100 points) Be able to identify the
Constitution in a Nutshell NAME. Per
 Constitution in a Nutshell NAME Per Preamble We the People of the United States, in Order to form a more perfect Union, establish Justice, insure domestic Tranquility, provide for the common defense, promote